Geo-Hazard-Based Approach for the Estimation of Seismic Vulnerability and Damage Scenarios of the Old City of Senerchia (Avellino, Italy)


1
Department of Civil Engineering, Faculty of Engineering, Politehnica University of Timisoara, Traian Lalescu Street, Timisoara 300223, jud. Timis, Romania
2
Department of Structures for Engineering and Architecture, School of Polytechnic and Basic Sciences, University of Naples “Federico II”, P. le V. Tecchio 80, 80125 Napoli, Italy
*
Author to whom correspondence should be addressed.
Geosciences 2019, 9(2), 59; https://doi.org/10.3390/geosciences9020059
Submission received: 30 December 2018
/
Revised: 20 January 2019
/
Accepted: 22 January 2019
/
Published: 26 January 2019
(This article belongs to the Special Issue Inaugural Section Special Issue: Key Topics and Future Perspectives in Natural Hazards Research)
Abstract
:The large-scale seismic risk assessment is a crucial point for safeguarding people and planning adequate mitigation plans in urban areas. The current research work aims at analysing a sector of the historic centre of Senerchia, located in the province of Avellino, in order to assess the seismic vulnerability and damage of old masonry building compounds. First, the typological classification of the inspected building aggregates is developed using the CARTIS form developed by the PLINIVS research centre in collaboration with the Italian Civil Protection Department. The global seismic vulnerability assessment of the building sample is carried out using the macroseismic method according to the EMS-98 scale in order to identify the buildings most susceptible to seismic damage. Furthermore, 12 damage scenarios are developed by means of an appropriate seismic attenuation law. Finally, the expected damage scenarios considering the local hazard effects induced are developed in order to evaluate the damage increment, averagely equal to 50%, due to the seismic amplification of different soil categories.
1. Introduction
The concept of seismic risk, in general, can be understood as a multi-factorial combination of three main parameters, Vulnerability (V), Exposure (E) and Hazard (H), which directly or indirectly influence a specific area. Some of the most recent Italian seismic disasters (L’Aquila 2009, Emilia Romagna 2012, Central Italy 2016) [1,2,3], have shown again the inadequate structural performance of many existing buildings against seismic actions. The main reason is related to the widely accepted fact that seismic risk scenarios and the estimation of the economic and human losses produced by earthquakes are useful tools for seismic risk mitigation based on adequate prevention plans [4,5].
The formulation of an earthquake loss model into a given region is not only of interest for the economic impact of future earthquakes, but it is also important for risk mitigation. A specific loss model allows us to predict the damage to the built environment under a given data scenario (deterministic approach model) and may be particularly important for responding to emergencies and disaster planning by national governments [6].
Thus, focusing at the urban scale, risk and age of the buildings are dependent on each other, since the site hazard induces significant consequences in term of expected losses. In fact, the seismic risk assessment on an urban scale implies the management of a large number of variables, such as different types of buildings, people, roads, etc., in order to know the expected damage probability due to earthquakes [7].
The vulnerability to disasters in areas exposed at risk is one of the most underestimated and impressive problems for urban development.
Rapid urbanization has dramatically increased the vulnerabilities and risks of urban dwellers in densely populated areas. In fact, the high population, combined with the presence of numerous buildings that do not comply with seismic regulations, significantly increase the problem of seismic safety in urban areas [8]. The identification of the most vulnerable buildings in an urban context is not a simple task due to their heterogeneity and complexity. However, in order to both cope with such inefficiencies and to achieve the overall improvement of the urban system, generally limited economic resources are needed [9]. The inventory of buildings is an essential procedure for the acquisition of data for the evaluation of large-scale seismic vulnerability [10]. The available strategies usually take into consideration survey forms to collect information on urban buildings based mainly on the parameters necessary for the seismic vulnerability assessment, i.e., the system type resistant to lateral loading, the regularity, the maintenance conditions and the presence of existing damages. The application of the survey forms allows us to fully contextualise, especially in the case of heterogeneous urban centres, the various structural types located there.
Therefore, the vulnerability can be defined as the potential of buildings to suffer a certain level of damage when subjected to a seismic event. Furthermore, the concept of vulnerability pertains to a system of basic concepts involved in risk analysis. This kind of definition, which is definitely vague, requires considerable refinements in order to become an operational tool for various purposes, as the estimate of seismic risk, development of earthquake scenarios or development of strategies for risk mitigation [11,12,13].
In general, the predisposition of a building to be damaged by a seismic impact depends on many aspects that are mainly concerned with the construction type, the quality of materials, the construction methods and the maintenance. Many studies [14,15,16] have shown how the lack of these issues makes structures inefficient so as to cause extensive damage during earthquakes. Indeed, the masonry buildings sample within the historical centres very often is characterised by a static inadequacy mainly due to an obsolete construction technique that does not guarantee an adequate safety standard. The lack of connections among orthogonal walls combined with the poor mechanical characteristics of masonry blocks and mortars are usually the main causes of incipient collapses caused by seismic phenomena.
However, the dynamic response of buildings is also influenced by site effects, which play an important role in the evaluation of the expected global damage. Site effects are responsible for the amplification of seismic waves in surface geological layers. In fact, surface motion can be strongly amplified if geological conditions are unfavourable [17].
Generally, specific geological, geomorphologic and geo-structural settings of restricted areas can induce a high level of shaking on the ground surface even in occasions of low-intensity/magnitude earthquakes. This effect is called site or local amplification. An appropriate geotechnical model based on the effects induced by local amplification phenomena certainly aims to favour a better prediction of the damage increase caused by the different soil conditions. It is principally due to the seismic motion transfer from hard deep soils to soft superficial ones and to effects of seismic energy focalization owing to the typical geometrical setting of the deposits [18,19].
A reliable and easy method for large scale analysis developed in Reference [20] allows us to estimate the macroseismic intensity increment derived from specific soil category so as to properly define, taking into account the local amplification factors, the global vulnerability of building stocks. In this framework, the macroseismic method allows for a direct estimation of the problem as it allows directly linking the cause (expected damage) to the effect (local seismic amplification) according to the EMS-98 scale.
Based on these considerations, a sub-urban sector of the historical centre of Senerchia, in the district of Avellino, was selected as a case study. The proposed work aims to evaluate the effects of local amplification varying the topographic class (from T1 to T4) and the type (from A to E) of soils foreseen in the new Italian Technical standard NTC18 [21]. The influence of soil conditions was considered by implementing a macroelement model of a typical masonry aggregate of the investigated study area with the goal to plot damage scenarios expected under different earthquake moment magnitudes and site-source distances.
2. The Historical Centre of Senerchia
2.1. Geographical-Historical Background
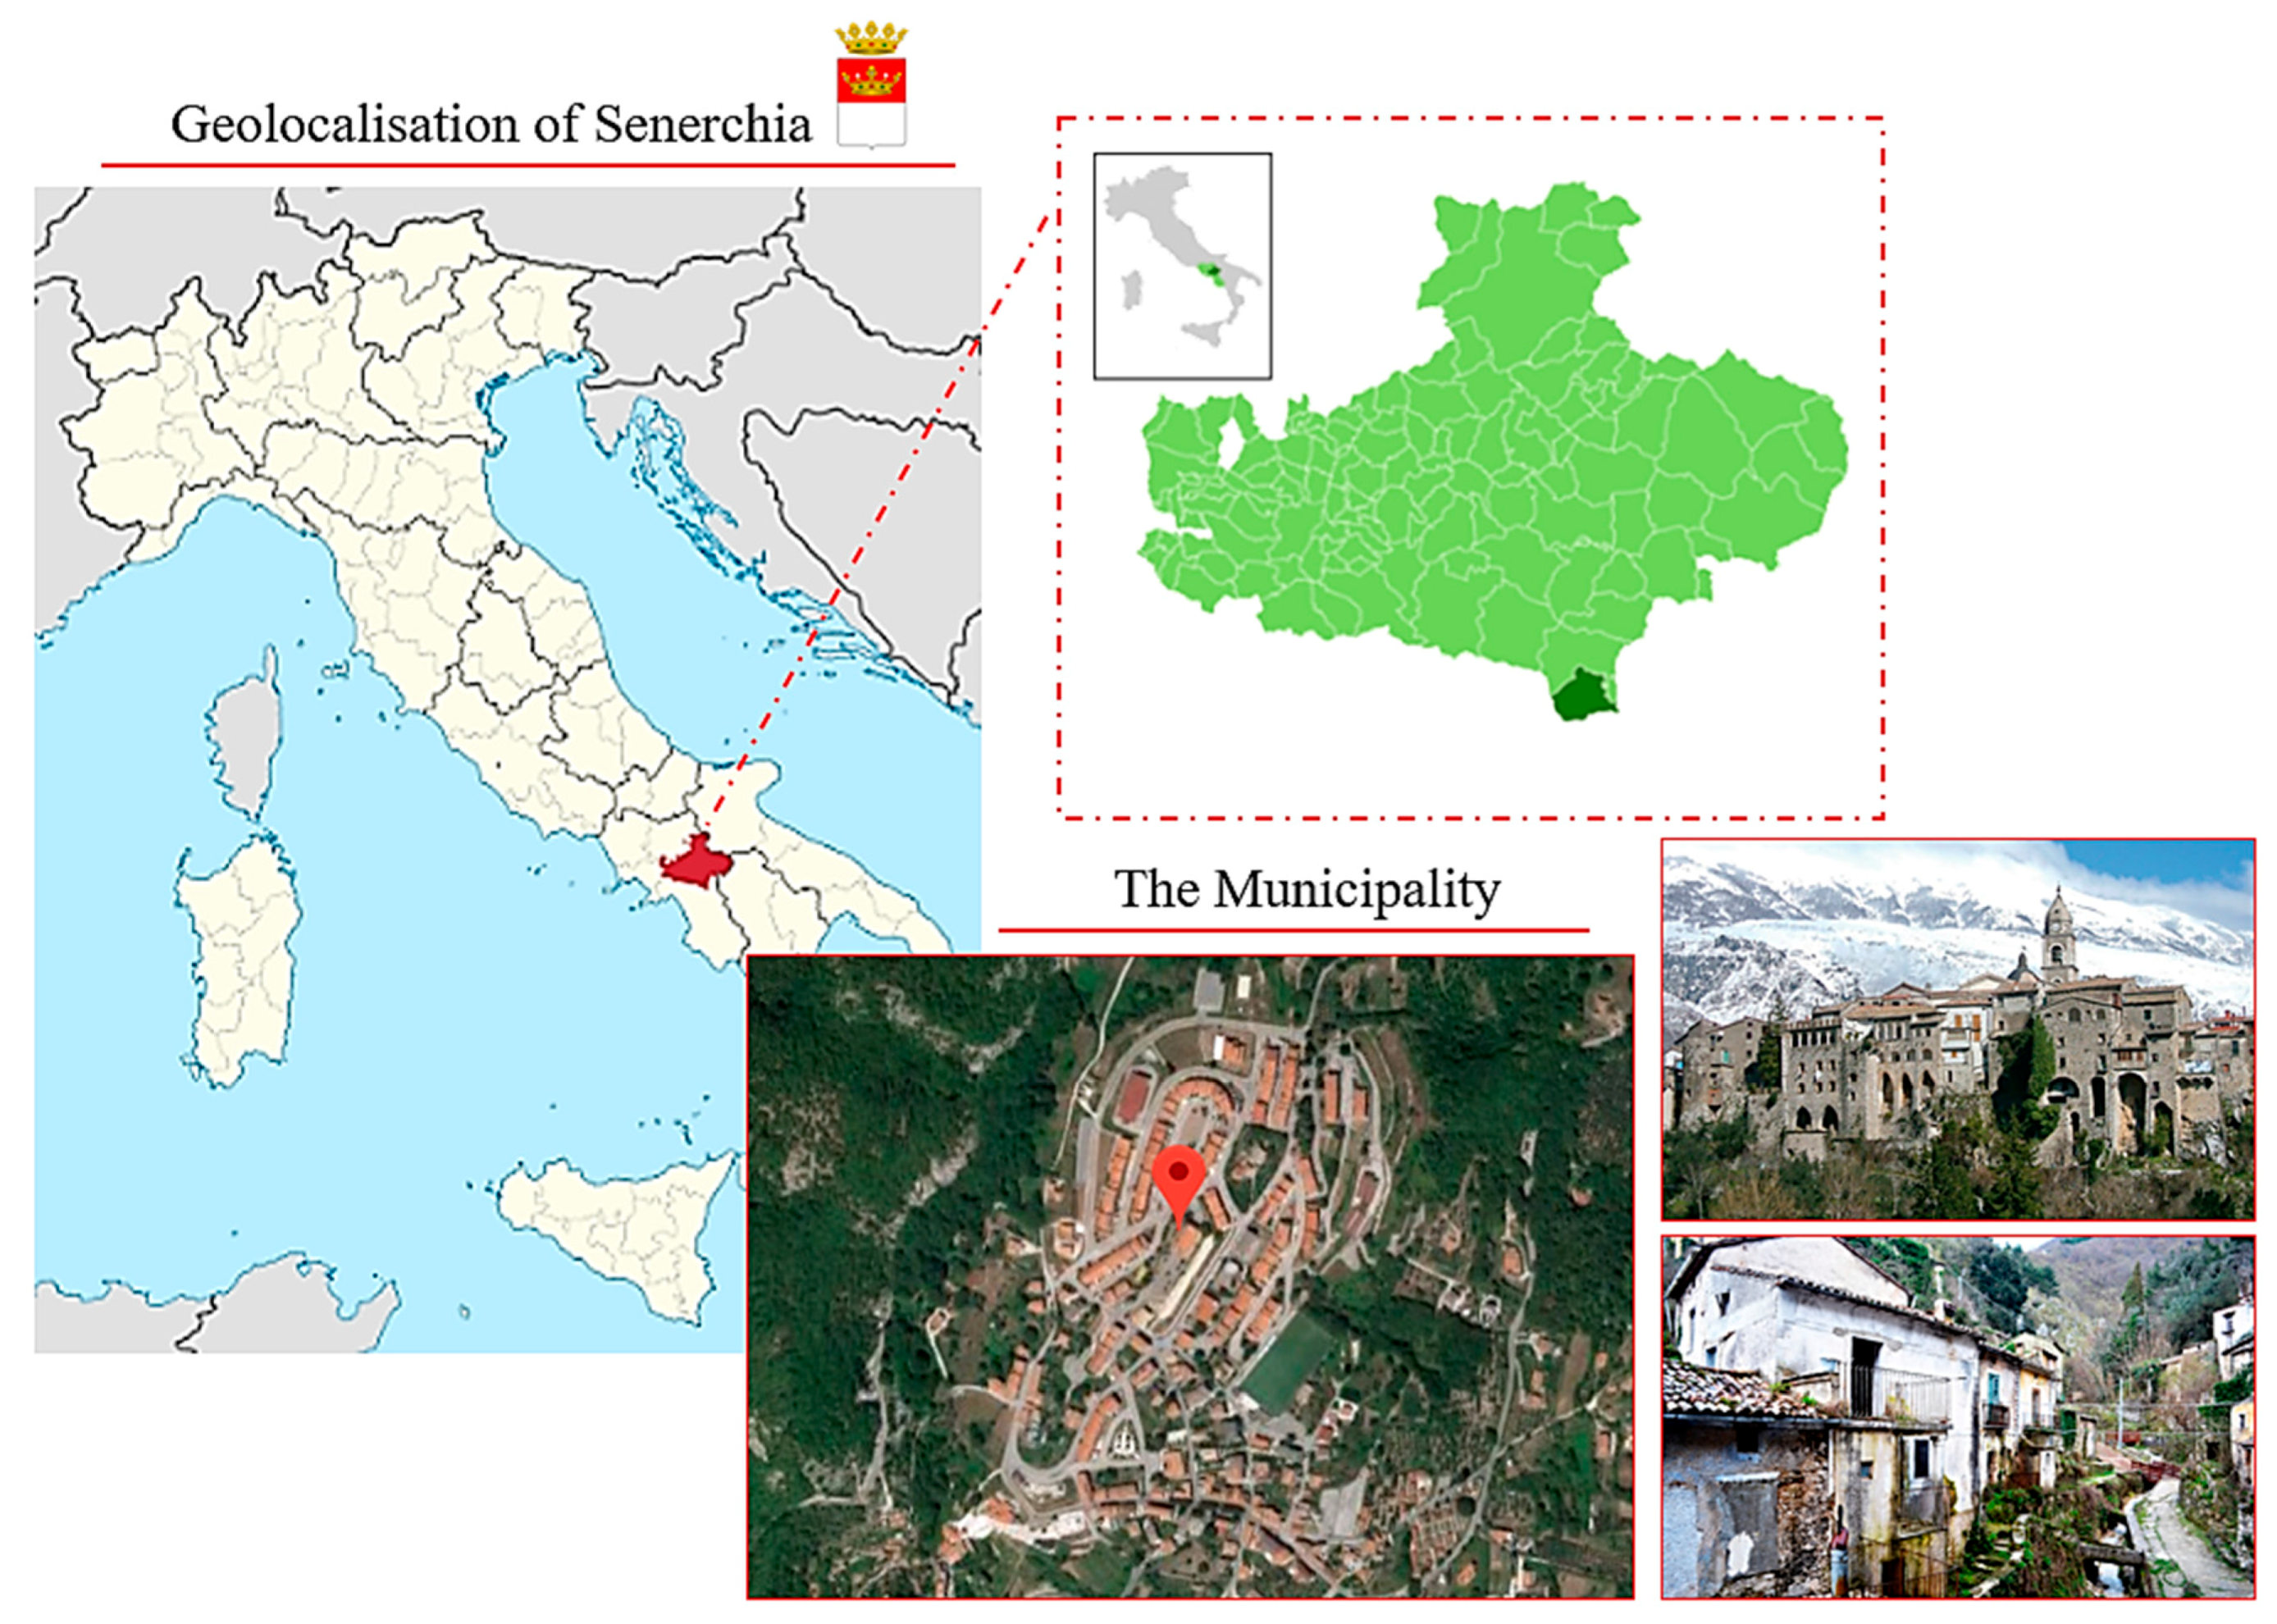
The municipal territory (Figure 1) is mostly mountainous and hilly, being characterised on the South-East side by the Picentini Mountains.
The village is located 600 meters above sea level in the High Valley of the Sele, a hilly area on the eastern side of the Picentini mountains group, stretching up to the slopes of Boscotiello mount. Besides the Sele, which laps the municipal territory, the other watercourses are Vallone Rovivo, Vallone Forma, Piceglia, Fiumicello, Rovivo, Pozzo San Nicola, Acquabianca and Vallone Badoleia (better known as Vallone Varleia).
Senerchia has ancient origins dating back to the IX century of the vulgar era. The Picentine population, who lived in the steep, expensive rocks of the valley, settled after the Second Punic War, came to settle in the Roman oppidum with the name of SENA HERCLEA.
The birth of Senerchia, therefore, is due to the Longobards, who were the protagonists of the birth of most of the castles and villages of the provinces of Avellino and Salerno.
The first settlement nucleus, located on the foothills upstream of the church of San Michele Arcangelo, was made of partial winding surrounded by parts of walls leading, also due to the orographic feature of the site, towards the castle-church binomial typical of fortified centres.
The type of housing is called the “house on a slope”. As in the second war, the population did not want to abate the use of building on the rock, even the second housing expansion along the Vallone river saw the buildings erected on the rocky coast [22].
2.2. The 1980 Irpinia Earthquake
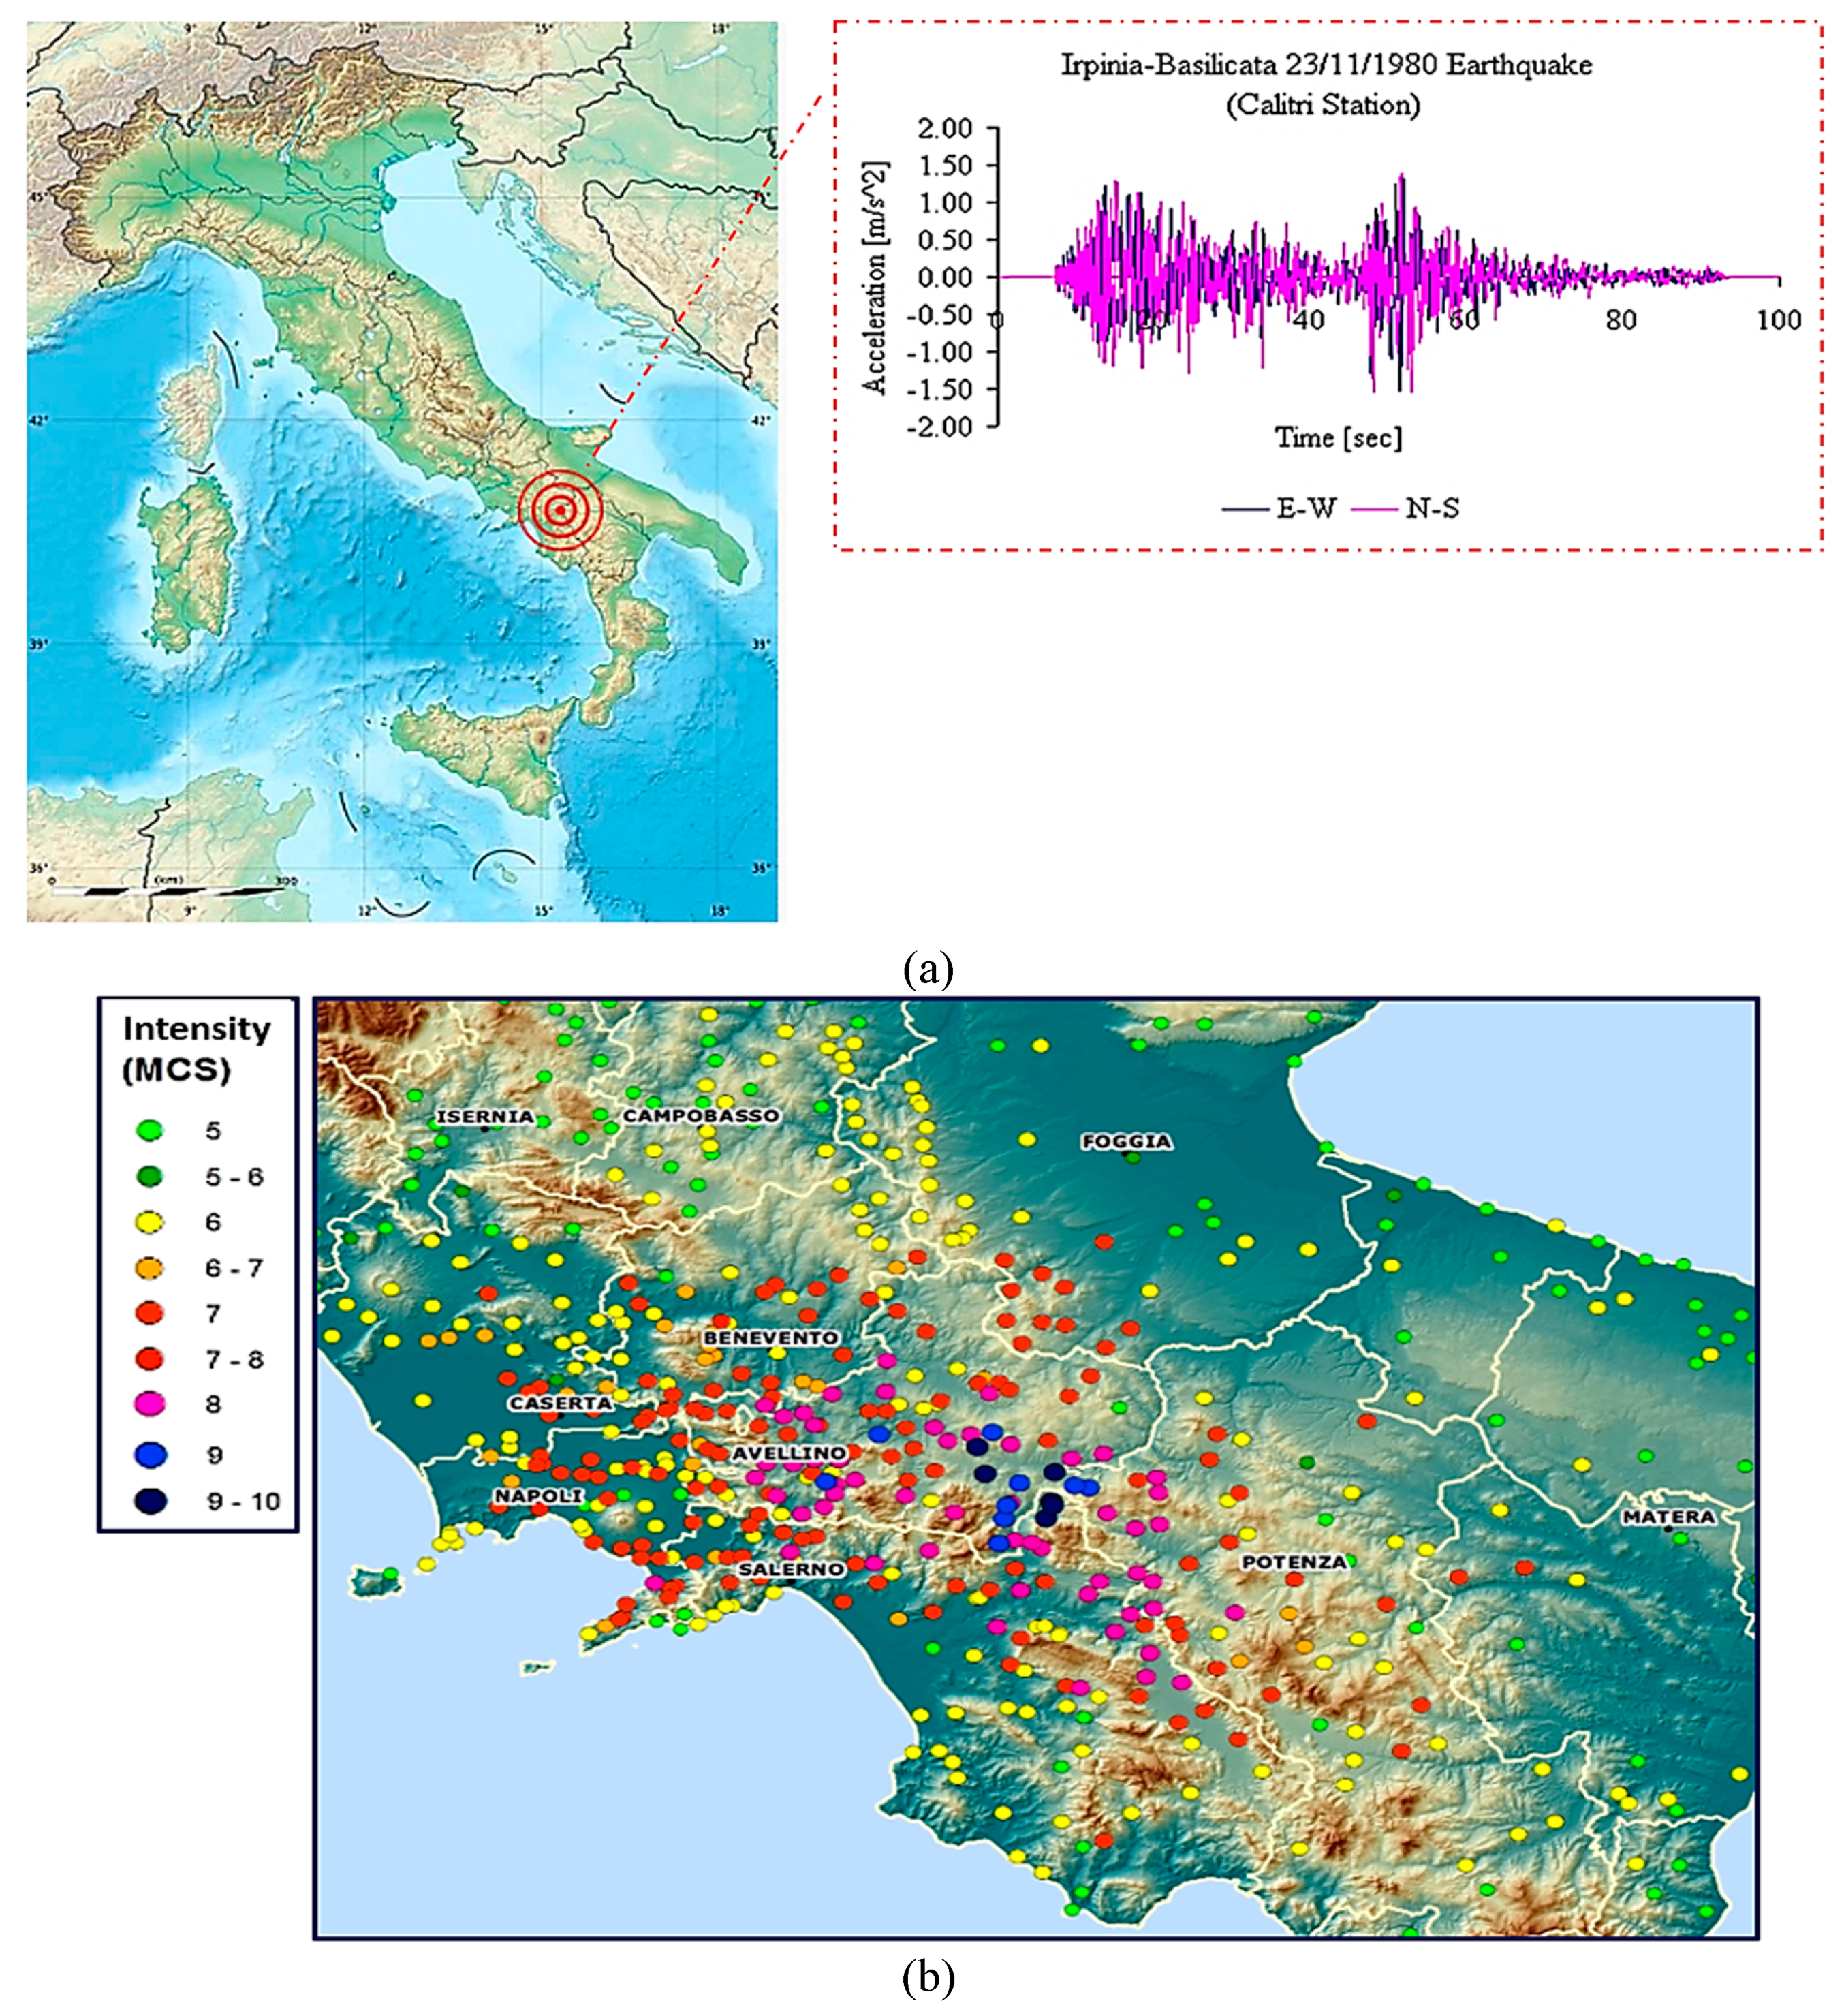
The Irpinia earthquake occurred on 23 November 1980 at 7:34 pm. A strong shock (X degree of the Mercalli scale) lasting about 90 s, with a hypocenter of about 12 km depth, striking an area of 17,000 km2 that extended from Irpinia to Vulture, straddling the provinces of Avellino, Salerno and Potenza [23].
The municipalities most severely affected by the earthquake were Castelnuovo di Conza, Conza della Campania, Laviano, Lioni, Sant’Angelo dei Lombardi, Senerchia, Calabritto and Santomenna (Figure 2).
The seismic effects, however, spread to a much wider area affecting practically the entire central part of the southern area of the Italian peninsula [24,25]. Many injuries and collapses also took place in Naples involving many dilapidated or damaged buildings and old dwellings in tuff stones.
In particular, in the Poggioreale district of Naples, a building along Stadera Street collapsed, probably due to construction defects, causing 52 deaths. The three most damaged provinces were those of Avellino (103 municipalities), Salerno (66 municipalities) and Potenza (45 municipalities). Thirty-six municipalities in the epicentre area had about 20,000 destroyed or unusable homes. In 244 (far from the epicentre) municipalities of the provinces of Avellino, Benevento, Caserta, Matera, Foggia, Naples, Potenza and Salerno, another 50,000 houses suffered serious and medium-large damages. Additional 30,000 homes were only slightly affected by the earthquake [26].
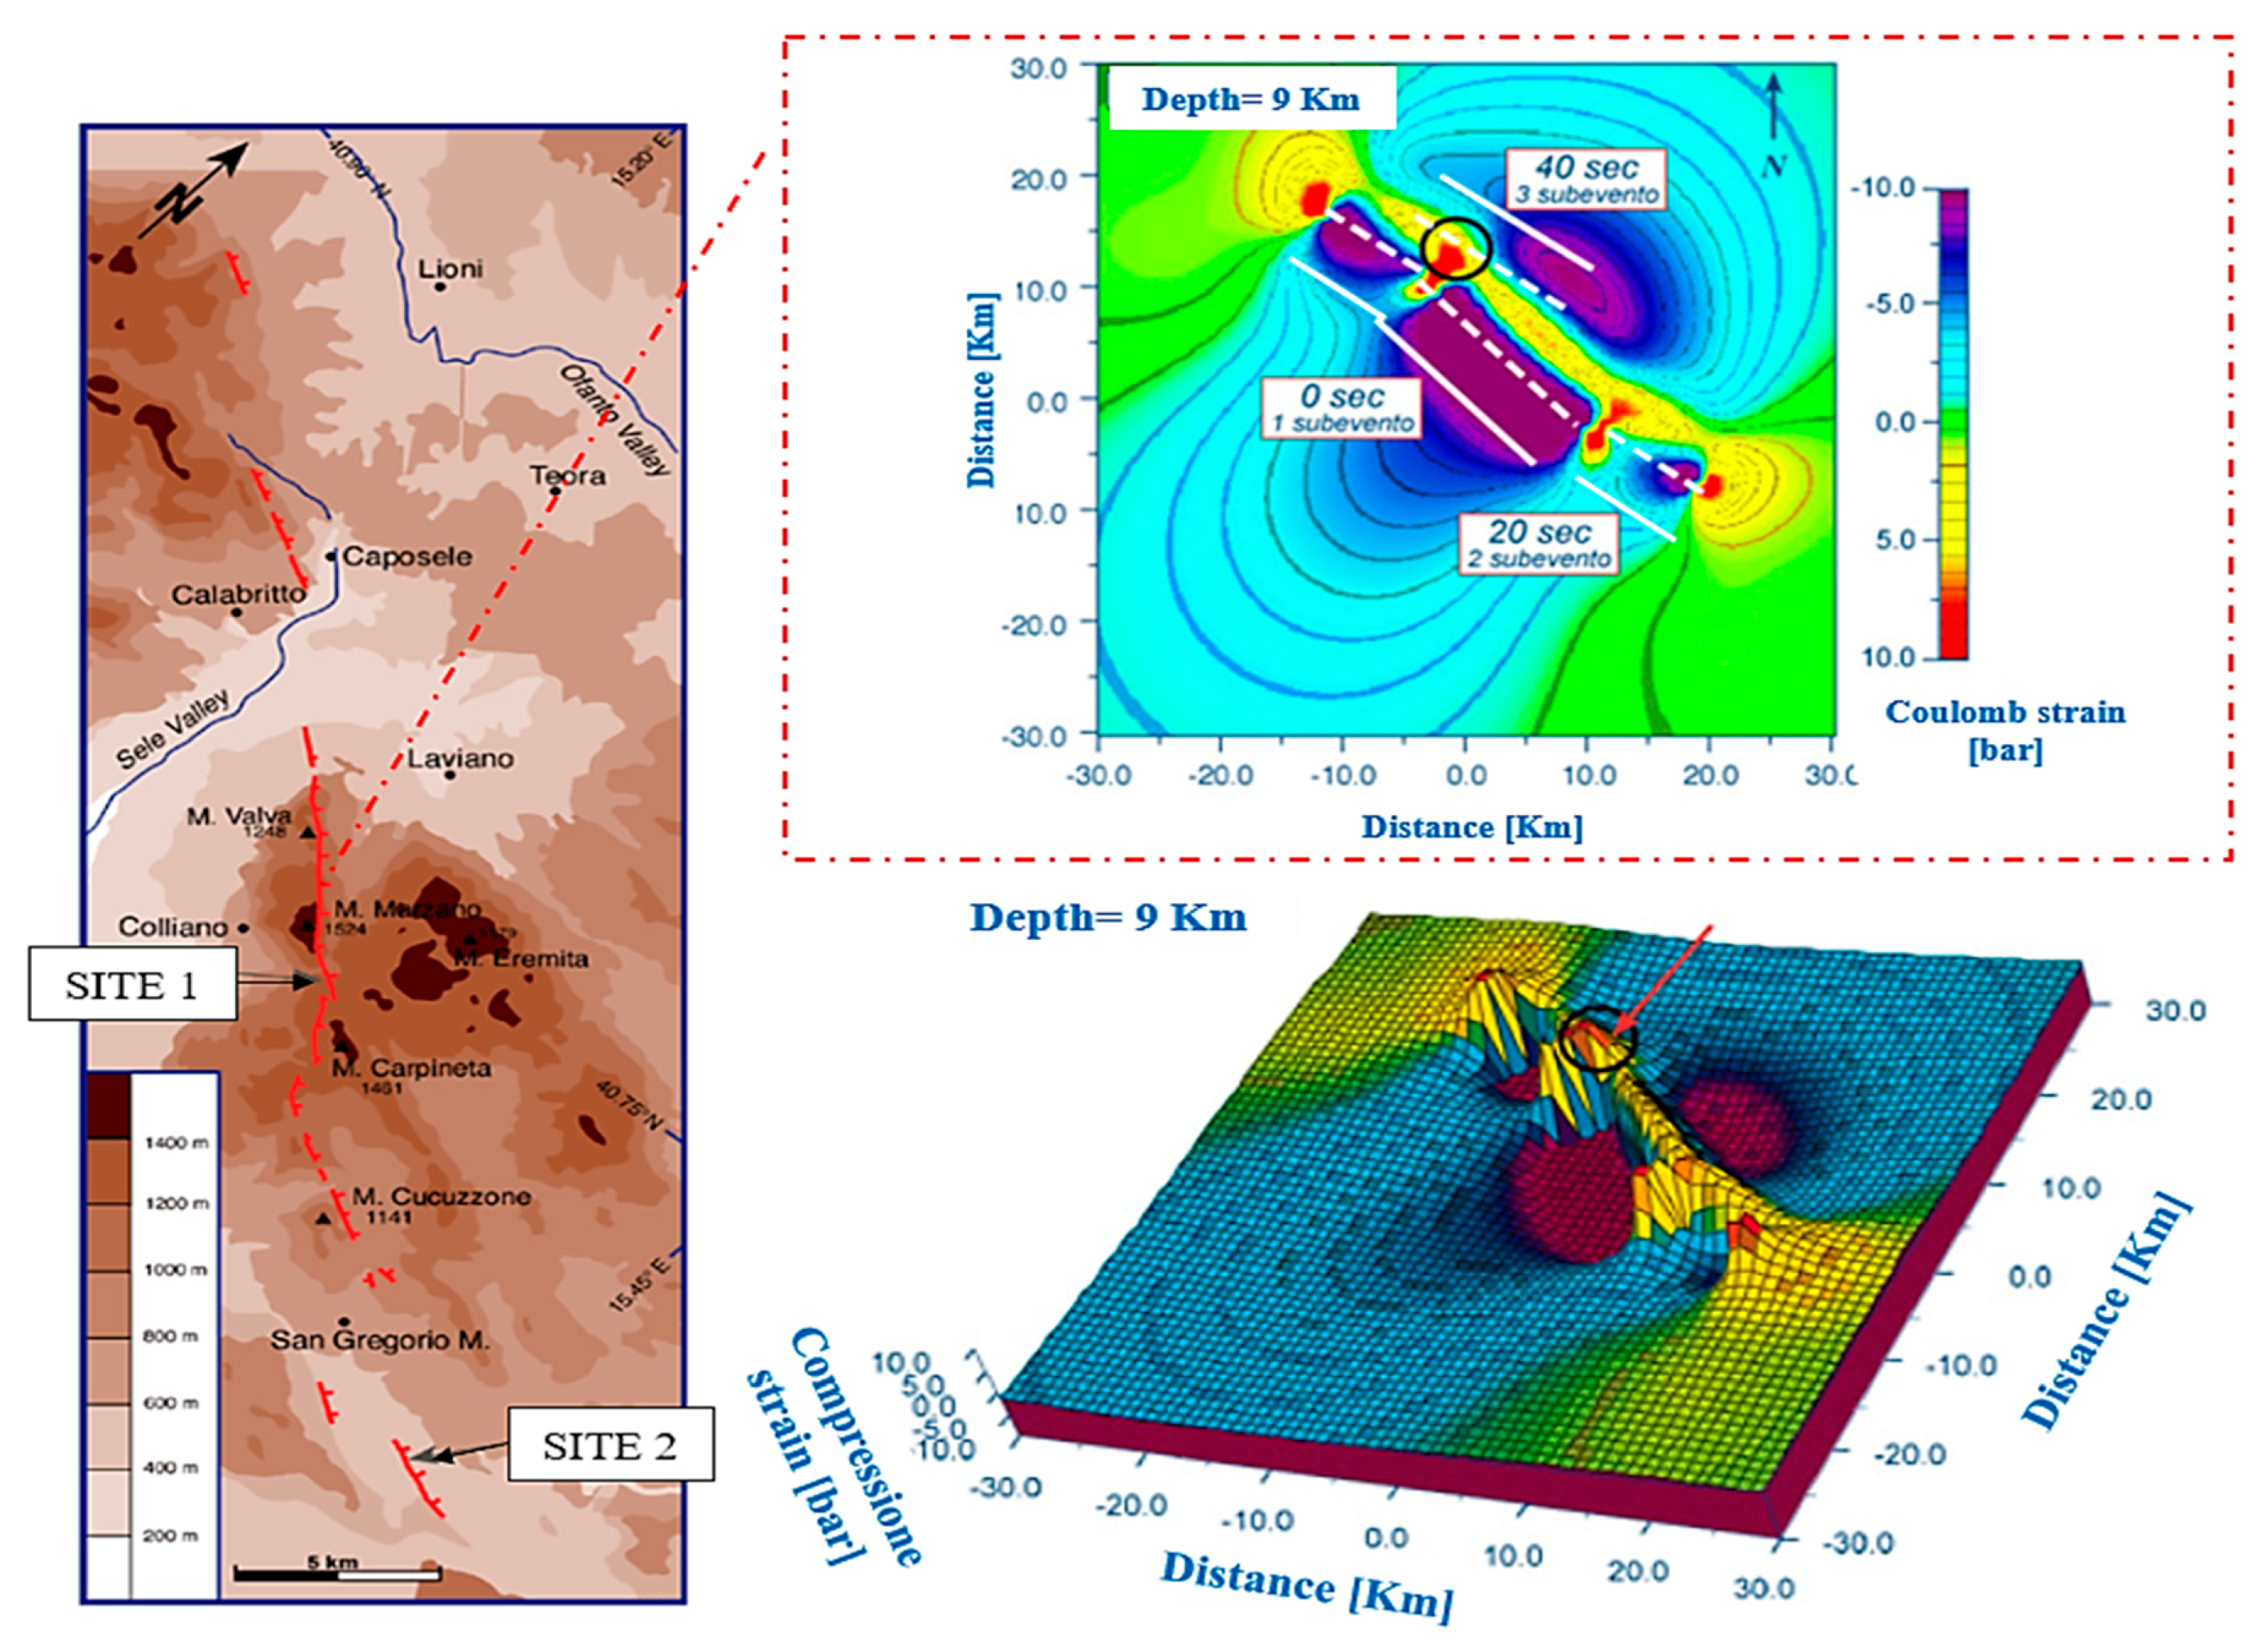
The 1980 Irpinia earthquake was characterised by three distinct phenomena along different fault segments that occurred in about 40 s. The rupture spread from the hypocenter involving fault segments along the Marzano mountains, Carpineta and Cervialto. After about 20 s, the break propagated towards the southeast in the direction of the Piana di San Gregorio. The last fault segment affected by the breaking process, after 40 s, was located in the northeast of the first segment.
3. Typological and Structural Characterisation of the Buildings Sample
3.1. The CARTIS Form
The classification of the construction typologies is a very important task for large-scale seismic risk assessments. In this framework, an effective methodology [28] allowed a new grouping technique based on an analysis of covariance on probabilistic seismic demand models. This grouping method, mainly calibrated on bridges, reduces sub-classes from all possible sub-class combinations. The proposed method is relevant and could also be applied to buildings.
In the urban area under investigation, however, the CARTIS form was adopted as the analysis tool to identify the most relevant structural typologies.
The CARTIS form [29] was developed by the PLINIVS research centre of the University of Naples “Federico II” during the ReLUIS 2014–2016 project, the “Development of a systematic methodology for the assessment of exposure on a territorial scale based on the typological characteristics/structural of buildings”, in collaboration with the Department of Italian Civil Protection (DPC).
The CARTIS form aimed to detect the prevalent ordinary building typologies in municipal or sub-municipal areas, called urban sectors, characterized by typological and structural homogeneity.
The form is divided into four sections: Section 0 for the identification of the municipality and the sectors identified therein; Section 1 for the identification of each of the predominant typologies characterizing the generic sub-sector of the assigned municipality; Section 2 for the identification of general characteristics of each typology of the constructions; Section 3 for the characterisation of the structural elements of all individuated construction typologies.
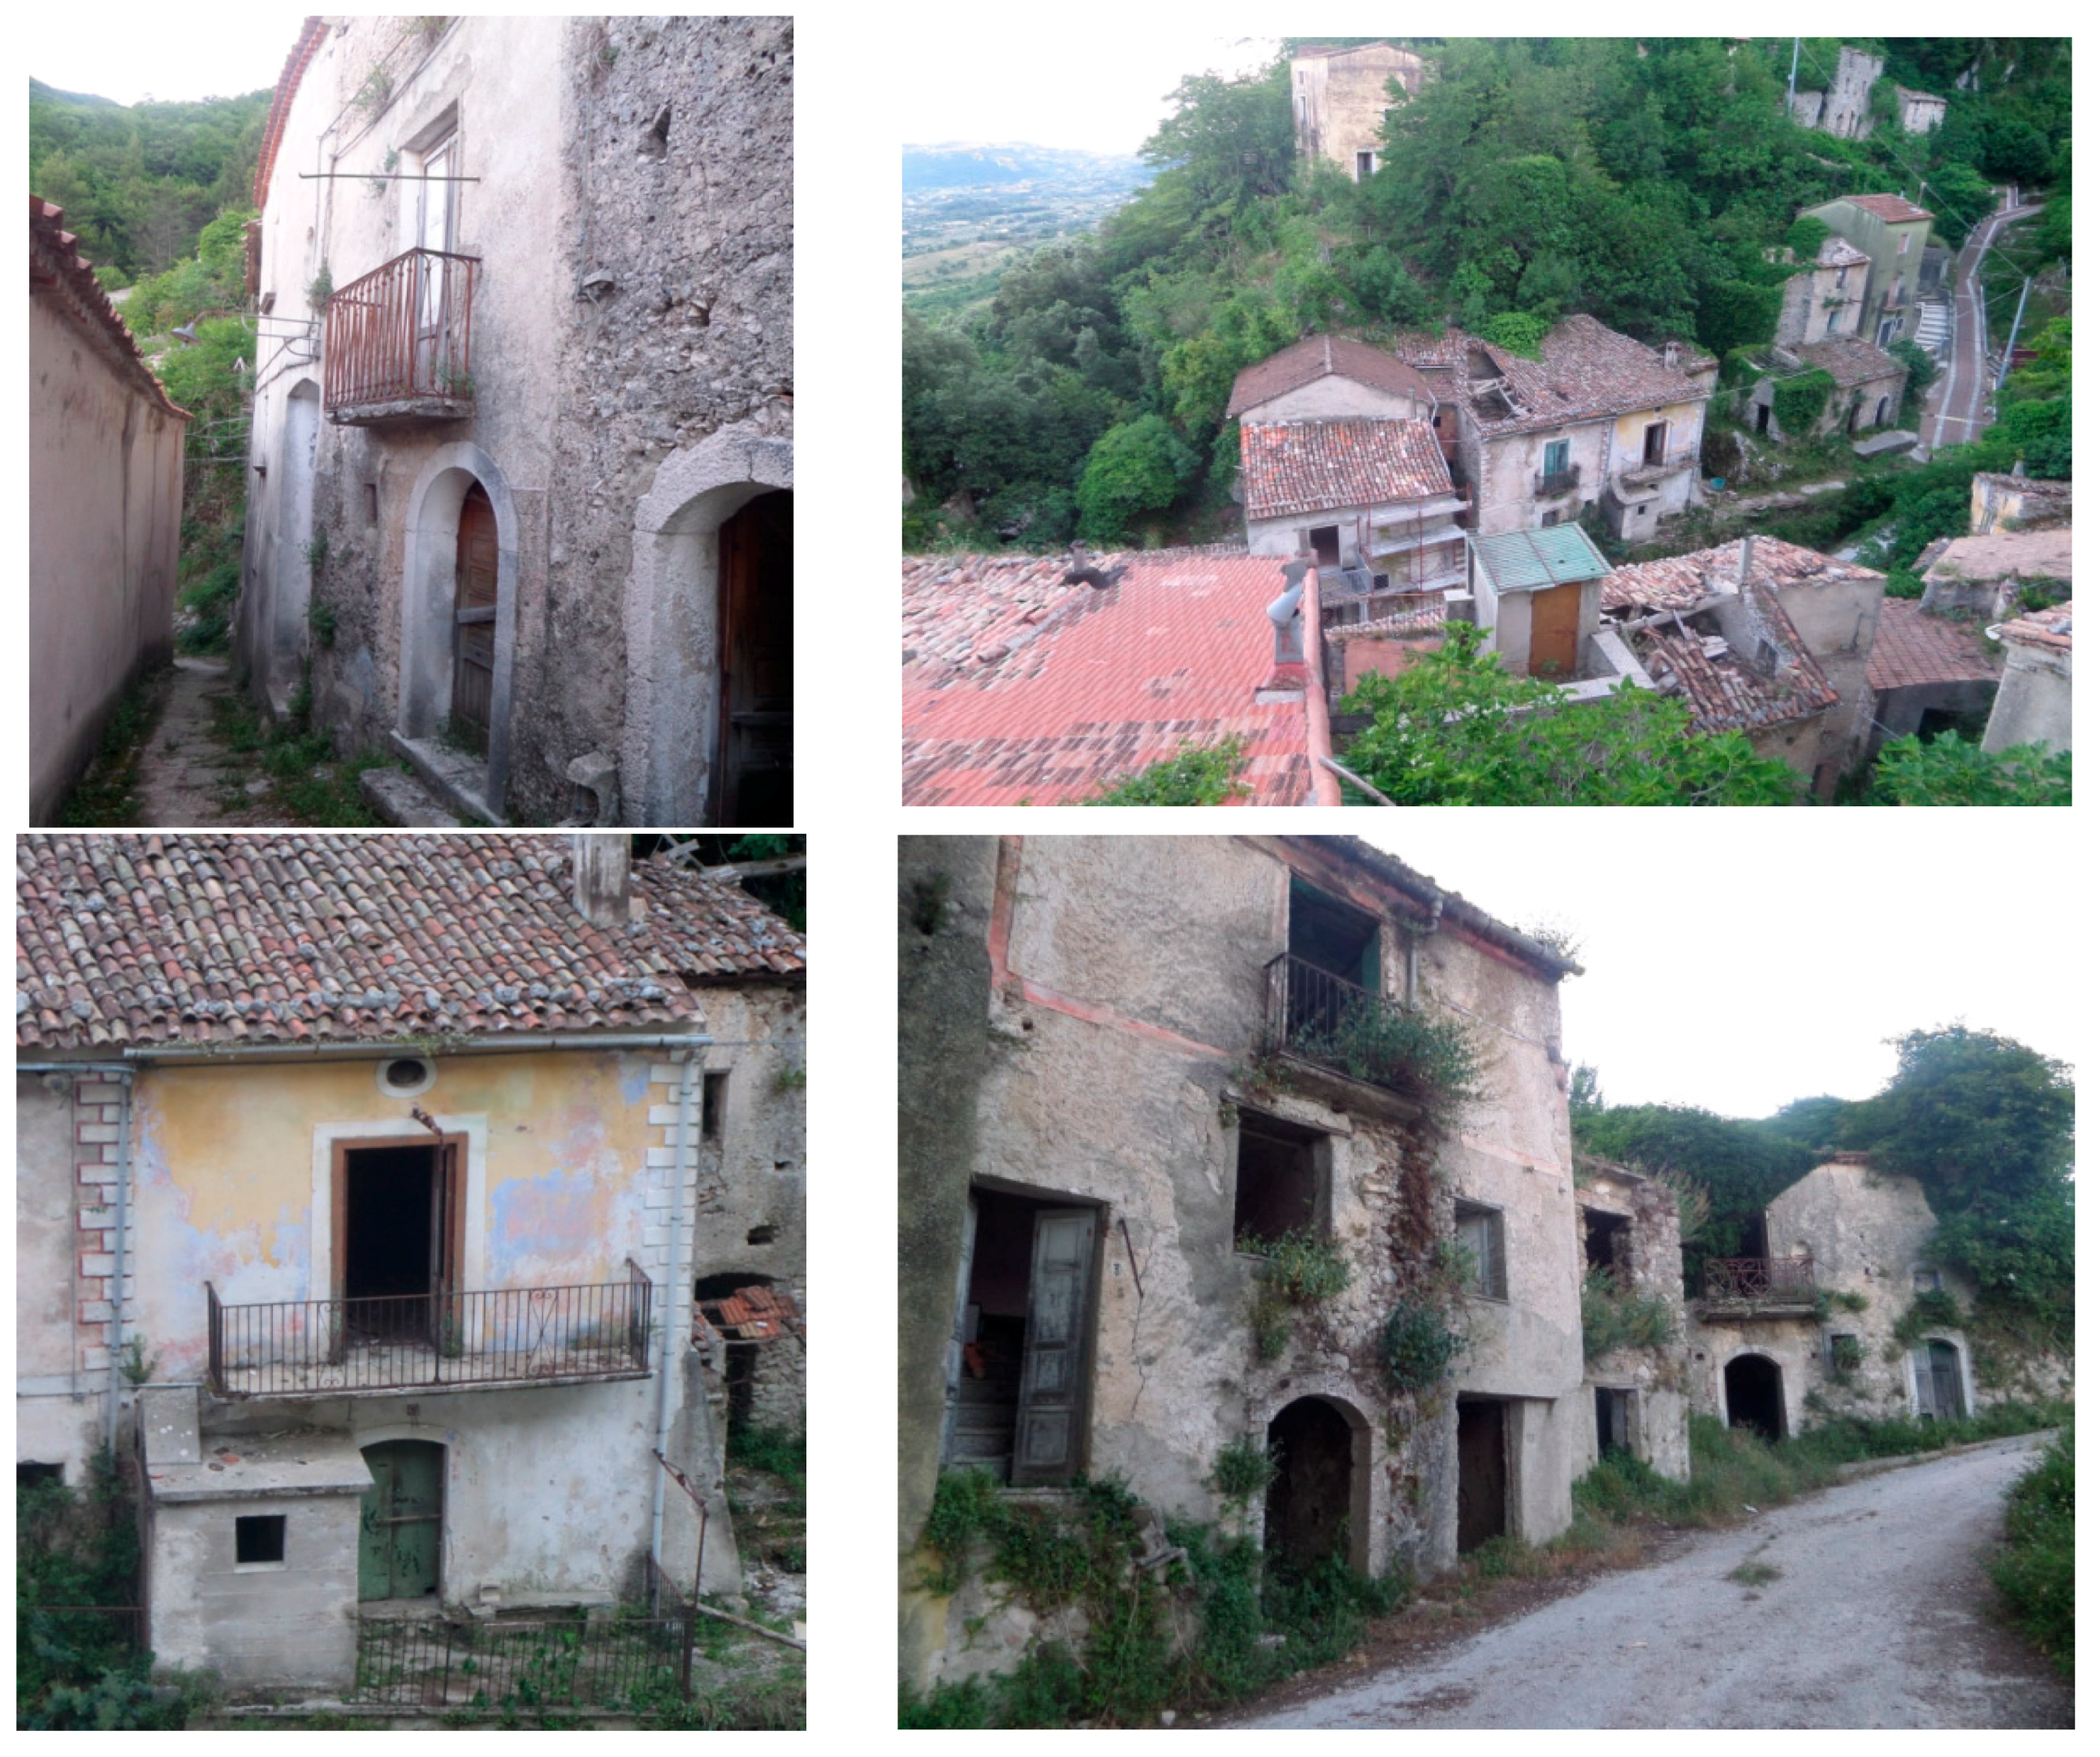
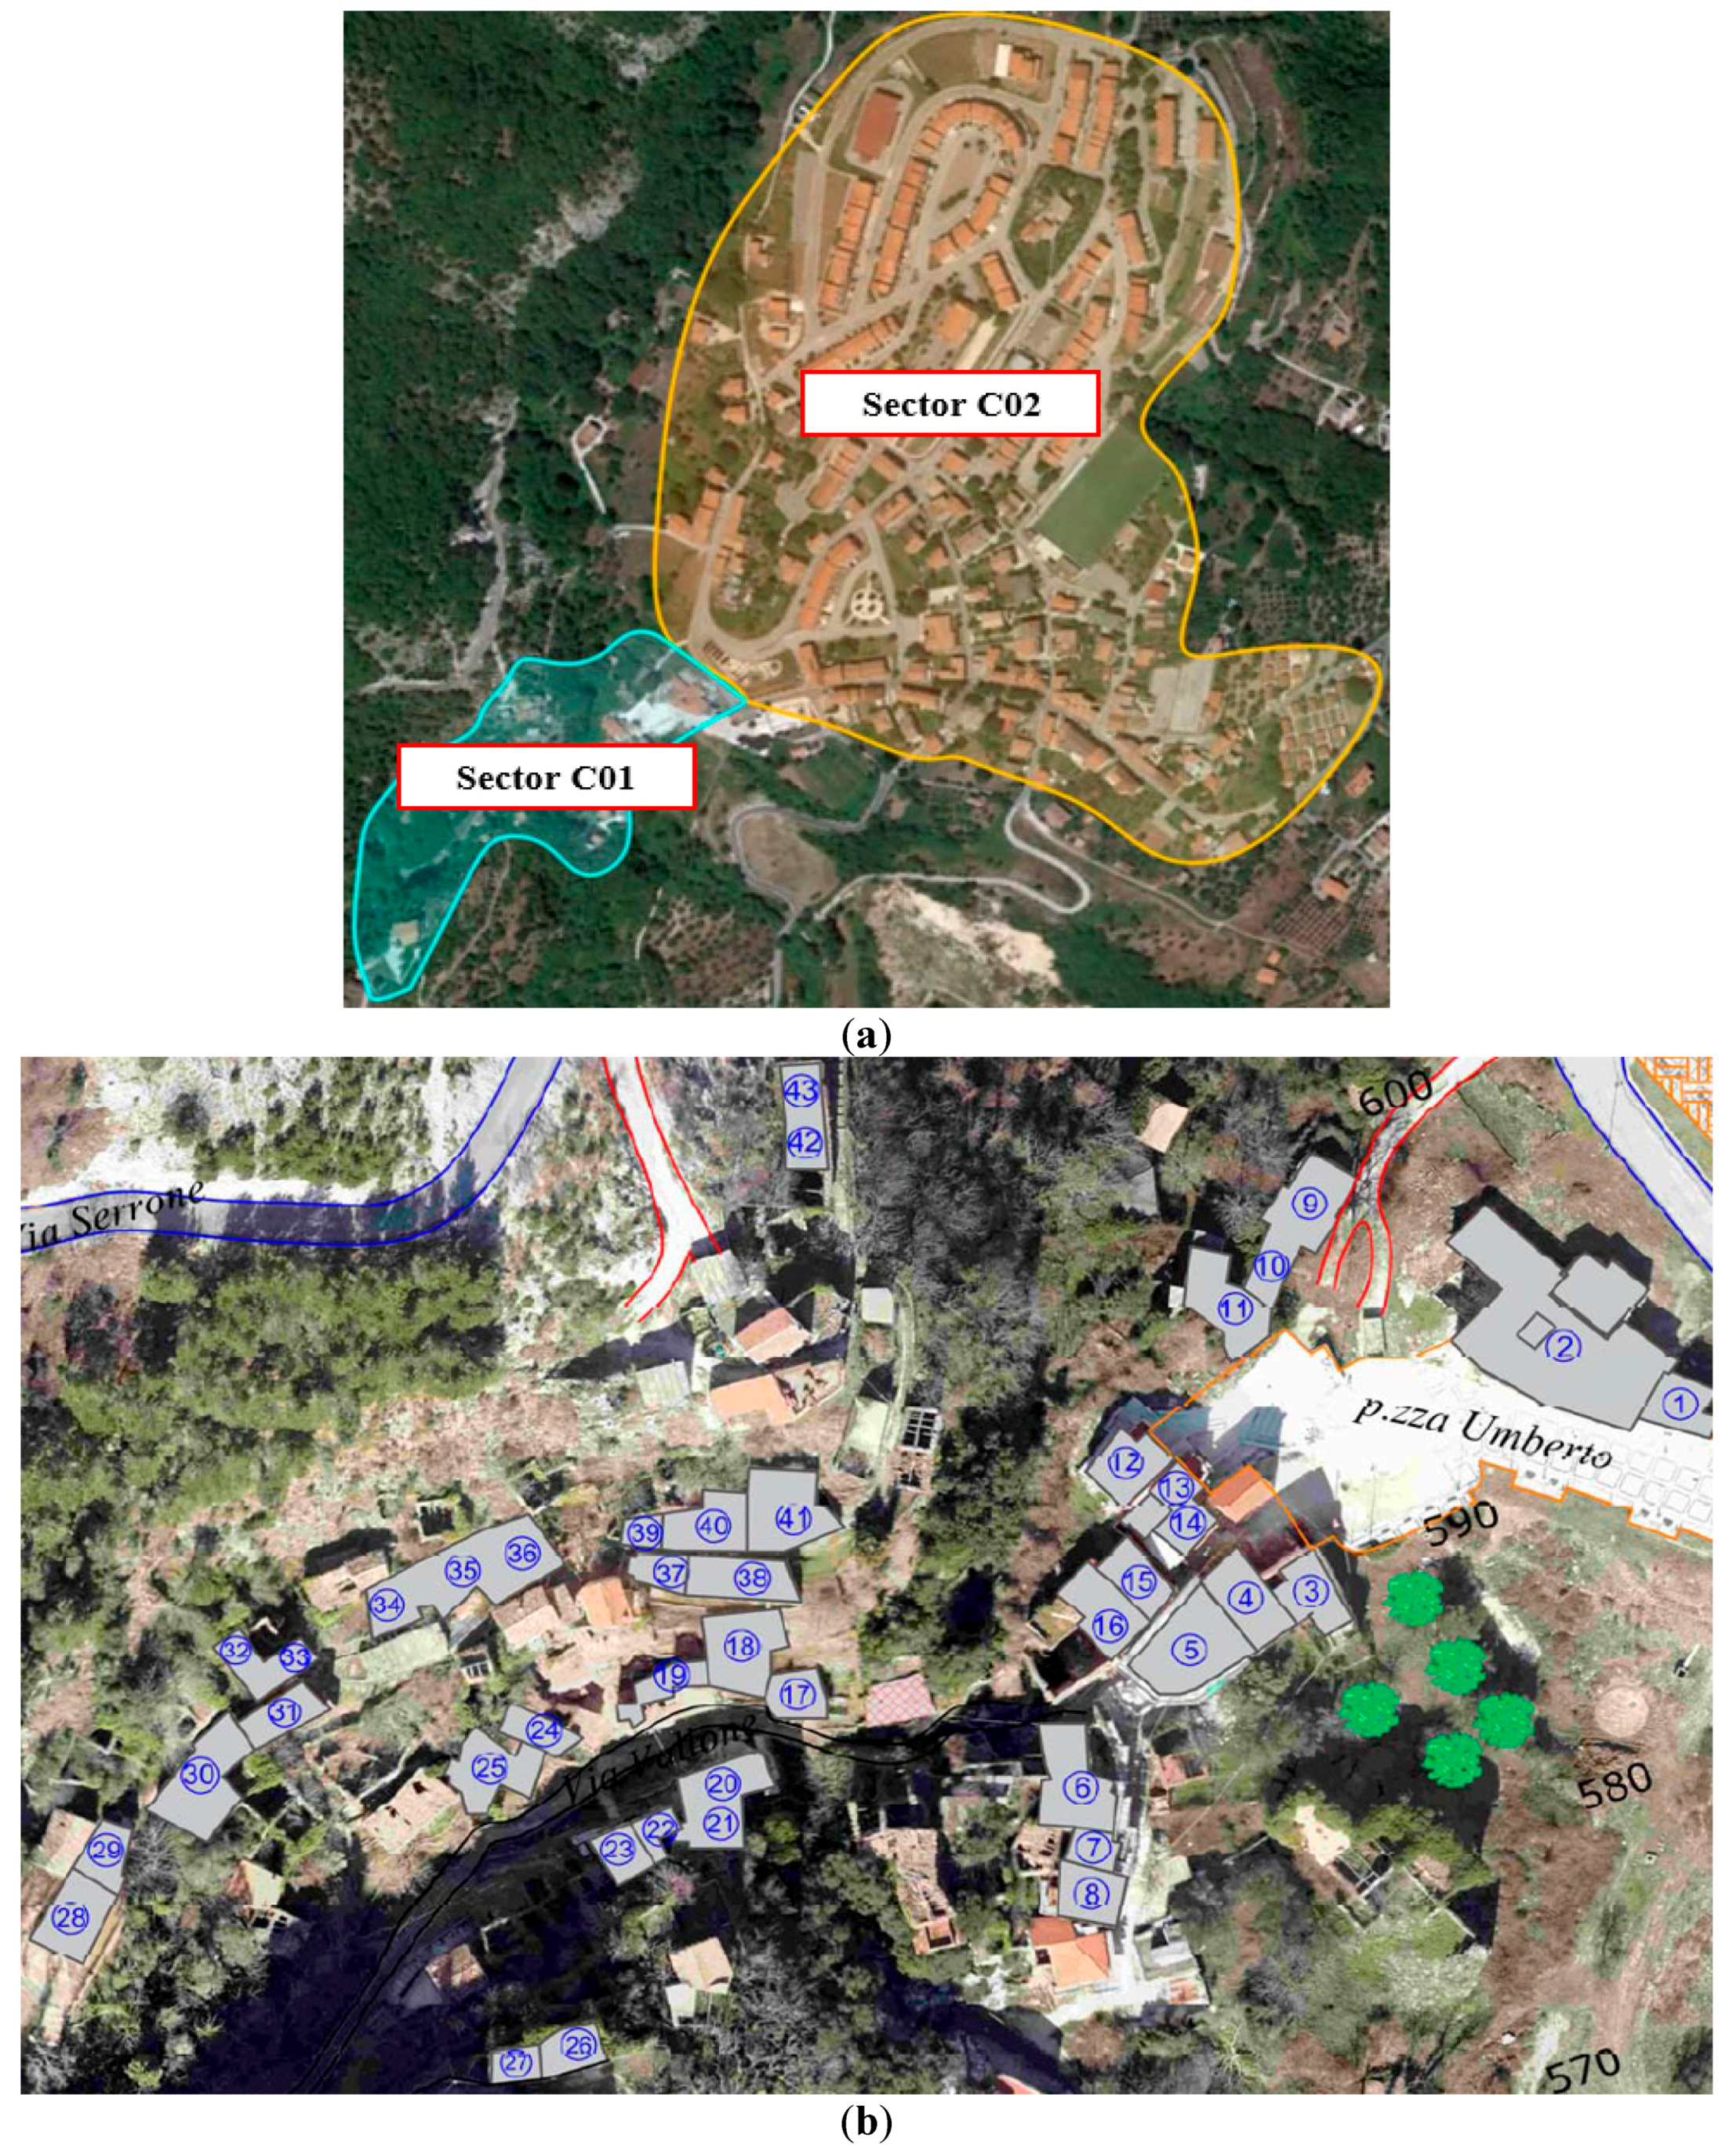
Thus, focusing on the case study, the historical centre of Senerchia is composed of two building compartments (C01 and C02). In both sectors, the buildings, made of local limestone, are grouped in aggregates and are characterized by the lack of effective connections among orthogonal walls, which could prevent out-of-plane mechanisms. The small houses characterising the historical centre buildings, composed of walls with an average thickness of 0.8 m, are illuminated by a few small windows. The storey average height is about 3.50 m. The horizontal structures, as well as roofs, are generally made of timber beams (Figure 4).
The study herein illustrated is conducted on the C01 urban sector composed of 43 structural units (S.U.), as reported in Figure 5.
3.2. Seismic Vulnerability Assessment
In order to implement a rapid seismic assessment procedure for examined building aggregates, the new form of vulnerability depicted in Table 1 is used [30,31].
This new form is based on the vulnerability index method proposed some decades ago by Benedetti and Petrini [32]. The new investigation form appropriately conceived for building aggregates is achieved by adding five new parameters, which take into account the effects of mutual interaction under earthquakes among aggregated structural units, to the ten basic parameters of the original form developed by the above-mentioned researchers.
The additional parameters, deriving from previous studies found in the literature [30], are summarized as follows:
– Parameter 11: Presence of adjacent buildings with different heights
The in-elevation interaction among adjacent buildings has a significant effect on the seismic response of S.U. The optimal configuration occurs for adjacent buildings with the same height (class A) due to the mutual confinement action. Additionally, a building adjacent to taller buildings (on one or both sides, class B) can suffer less damage than one adjacent to buildings with less height (classes C and D).
– Parameter 12: Position of the building in the aggregate
This parameter provides indications about the in-plane interaction among S.U. In particular, the case of an isolated building corresponds to class D (most unfavourable condition), while the intermediate, corner and heading conditions are related to classes A, B and C, respectively. It is worth noting that the inclusion in aggregate, regardless of the position of the structural unit, always gives rise to the reduction of seismic vulnerability.
– Parameter 13: Number of staggered floors
In the case of an earthquake, staggered floors are responsible for pounding effects among adjacent S.U., which could activate out-of-plane collapse mechanisms. The best condition is the absence of staggered floors (class A), while one (class B), two (class C) or more than two (class D) staggered floors increase the vulnerability.
– Parameter 14: Structural or typological heterogeneity among adjacent S.U.
This parameter takes into account that adjacent buildings can be built with different construction technologies or have structural heterogeneity. In the case of “homogeneous” buildings, i.e., made of the same masonry type, the vulnerability remains unchanged compared to that of the isolated building (class C). On the other hand, the case of structural heterogeneity (i.e., a masonry S.U. near to an RC structure) is the most favourable seismic condition. Finally, S.U. can be placed next to another masonry unit with worst (class B) or better mechanical properties (class D).
– Parameter 15: Percentage difference of opening areas among adjacent facades
This parameter affects the seismic response of S.U. because it is responsible for the distribution of horizontal actions among façades of adjacent buildings. Neglecting the case of no difference of opening areas (class A), the S.U. can be placed between buildings with lower (classes B and C) or higher (class D) percentages of openings.
The methodology is based on the evaluation of a vulnerability index, IV, for each S.U. as the weighted sum of the 15 parameters listed in Table 1. The estimated parameters are distributed in 4 vulnerability classes (A, B, C and D, from the best to the worst), characterised by a given score (also with negative sign in case of vulnerability reduction), which a correspondent weight, Wi, is assigned to, changing it from a minimum of 0.25 for the less important parameters up to a maximum of 1.20 for the most important ones. Further information on how the scores and classes were determined are found in Reference [30].
Based on these considerations, the vulnerability index, IV, is calculated according to the following equation:
In detail, the survey form adopted is applied to a generic building with specific constructive and technological characteristics. Substantially, each parameter is associated with vulnerability classes, with a specific score, Si, and specific weight, Wi.
Subsequently, the vulnerability index value is normalized in the range [0−1] by means of Equation (2), assuming, from this moment, the notation VI.
where IV is the vulnerability index deriving from the previously properly defined form; (Smin·Wi), equal to −125.50, represents the sum of scores associated to the vulnerability class A of each parameter multiplied by respective weights; (Smax·Wi), equal to 495.00, represents the sum of scores associated to the vulnerability class D of each parameter multiplied by the respective weights; and the denominator, equal to 620.50, represents the total vulnerability.
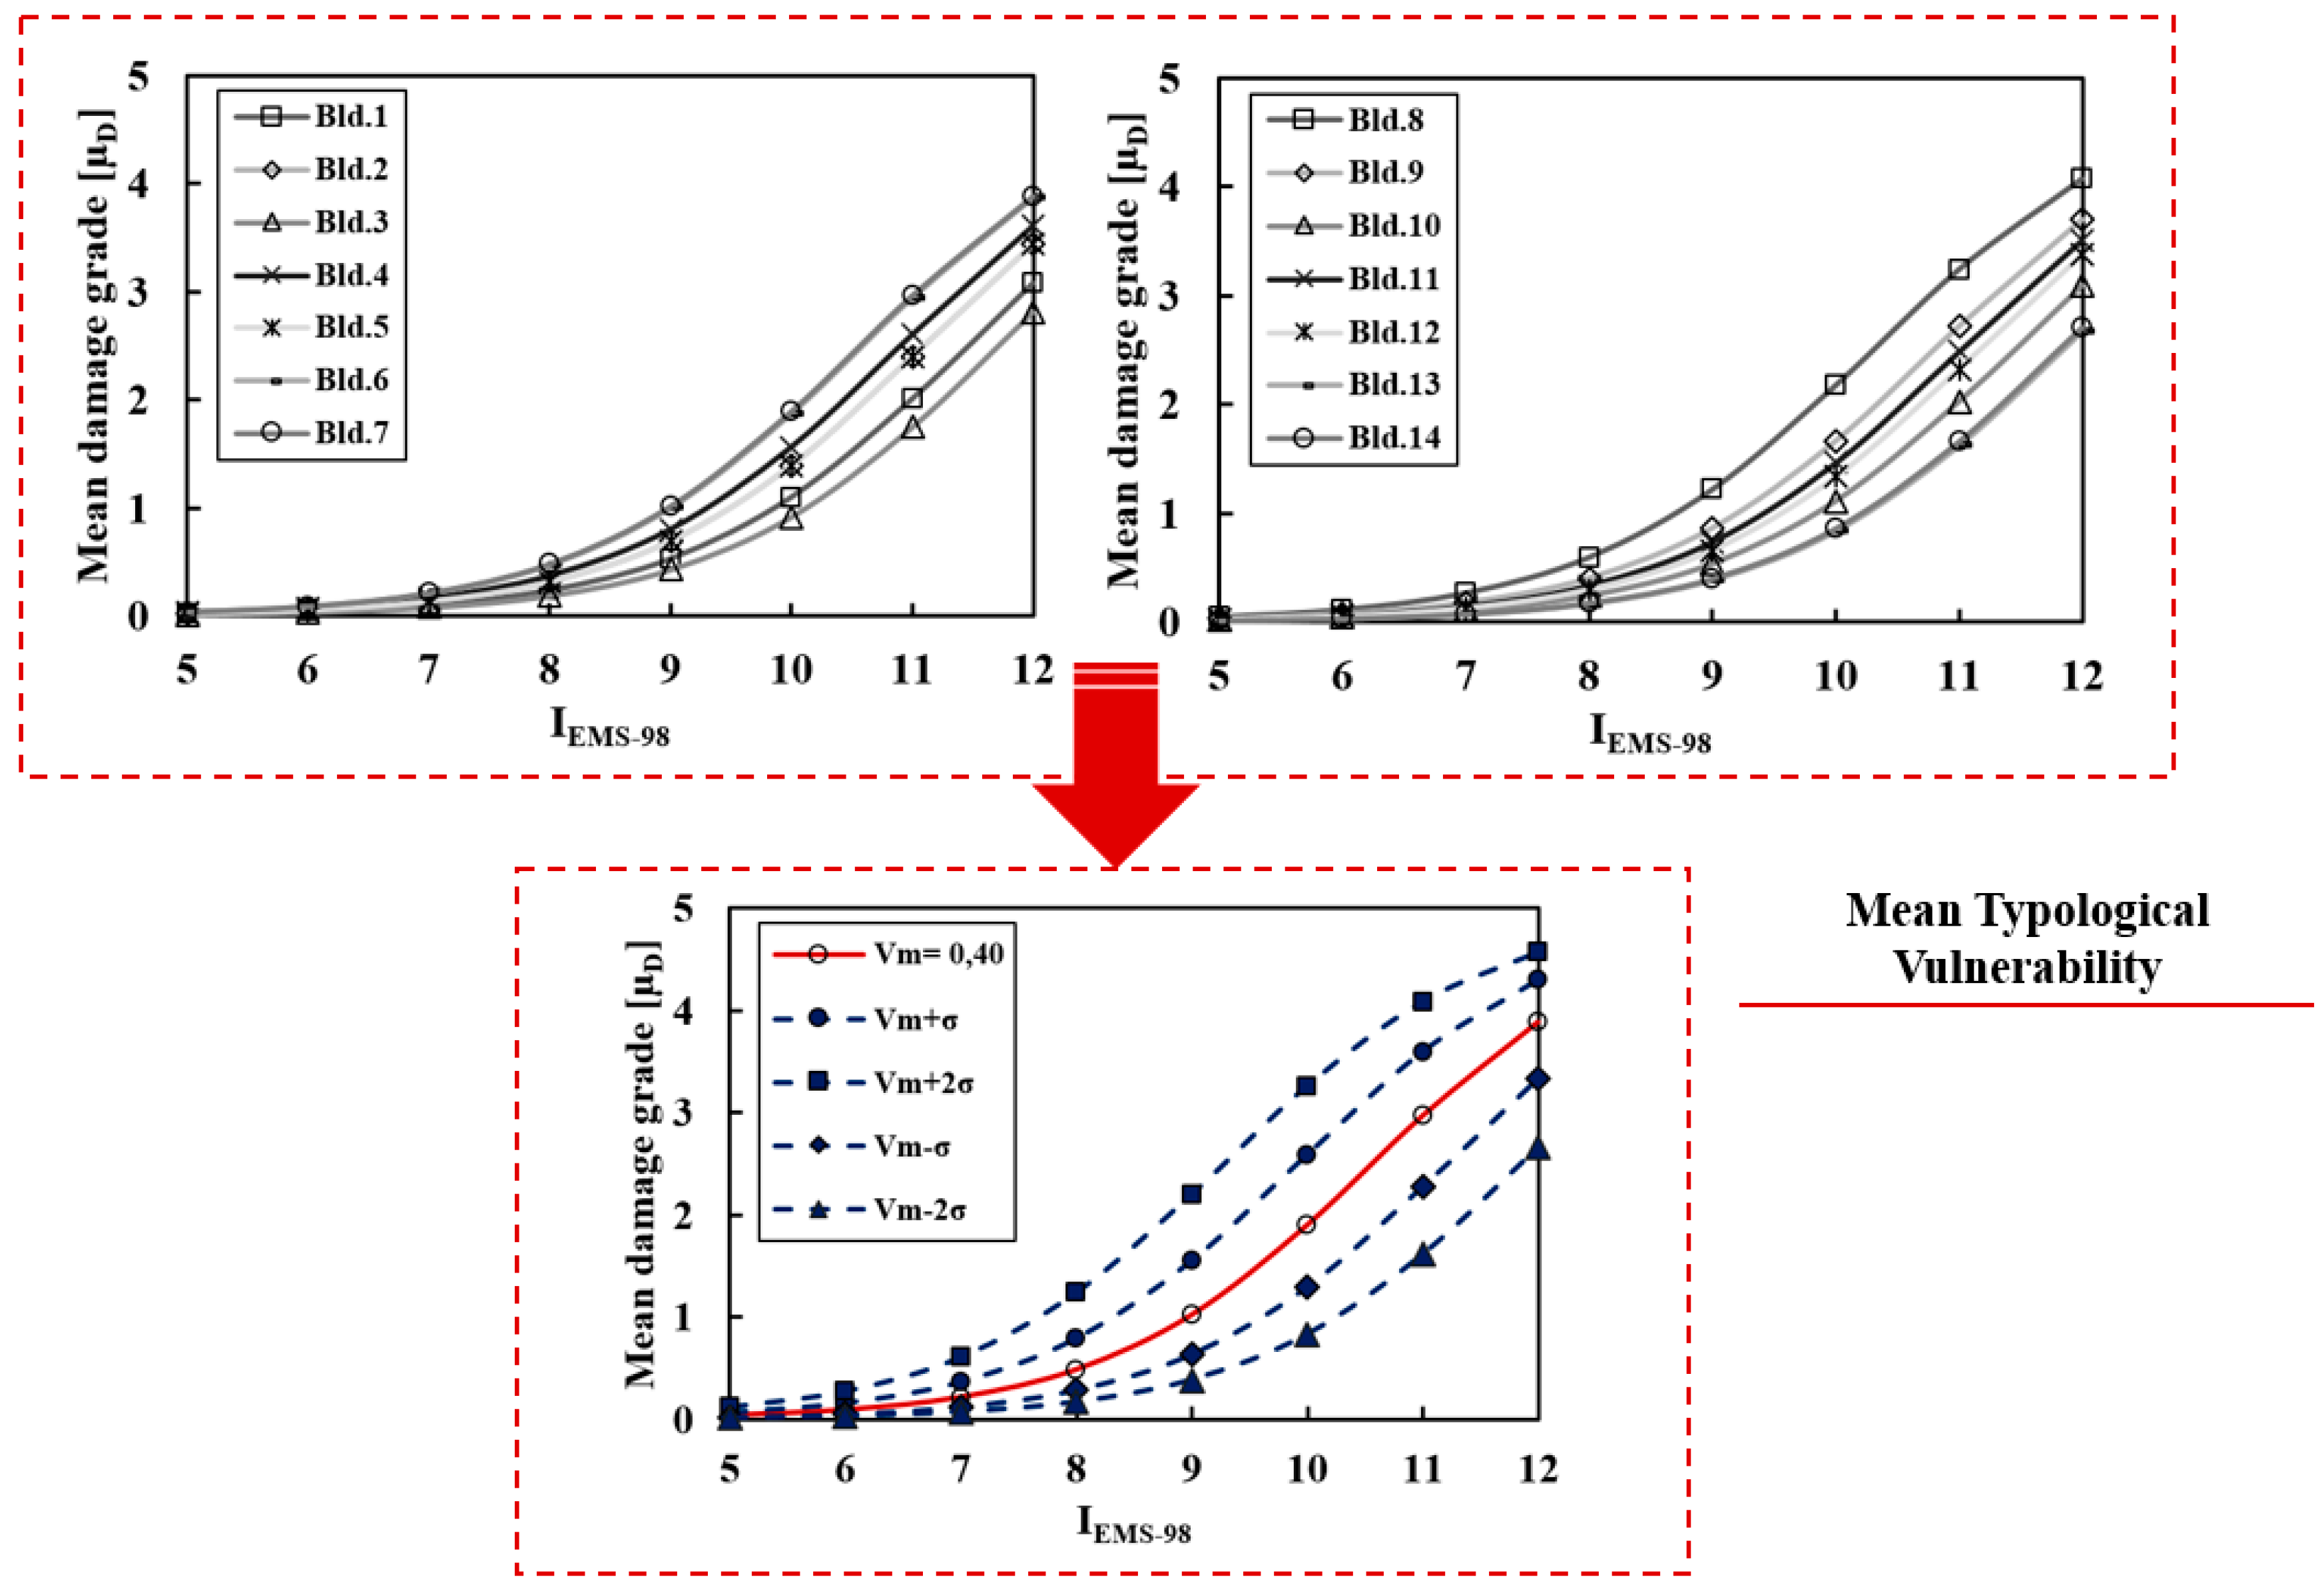
Appropriate vulnerability curves [33] are obtained to estimate the propensity of the damage of the analysed building stock (Figure 6). More in detail, these curves express the probability
P[LS|IEMS-98] that a building reaches a certain limit state “LS” at a given seismic intensity “IEMS-98”, which is defined according to the European macroseismic scale EMS-98.
In particular, as mathematically expressed by Equation (3), the vulnerability curves depend on three variables: the vulnerability index (VI), the seismic hazard, expressed in terms of macroseismic intensity (IEMS-98) and the ductility factor Q, ranging from 1.0 to 4.0, which describes the ductility of a certain typological class. In the case under study, a ductility factor Q of 2.3 is considered [34].
As reported in the previous figure, the vulnerability curves are derived for a sample of buildings representative of the construction types found in the inspected area. However, for a more complete representation of the expected damage, the mean typological vulnerability curves are herein represented together with other curves taking into account the variability of damage in the vulnerability range (Vm − σ; Vm + σ; Vm + 2σ ; Vm − 2σ) according to Reference [35].
3.3. Parametric Estimation of Seismic Impact Scenarios
The earthquake is associated with the accumulation of stresses in particular points of the lithosphere, between the surfaces in contact with ancient faults or in other areas. When these stresses exceed the shear strength, there are shifts and breakages with the release of energy in the form of seismic volume waves (P-waves and S-waves). These waves radiate at different speeds in all directions with roughly spherical wavefronts. There is, therefore, a progressive attenuation of the energy contained by the seismic waves from the epicentre to the different sites where earthquake effects are felt.
The seismic waves also undergo other modifications, which are linked to reflection and refraction phenomena at the interface between layers of different characteristics (attenuation by scattering) and to the internal damping of the soils. They have a further attenuation of the energy content with the distance and a “verticalization” of the propagation direction of seismic waves.
However, the severity of seismic damage to buildings of similar structural characteristics would be a regular and decreasing function with the distance from the epicentre, which a progressive reduction of the expected acceleration, a progressive increase in terms of the duration and an increase of frequencies are associated to Reference [36].
The seismicity prediction of a given site can be achieved by adopting appropriate seismic attenuation laws, which are empirical formulations calibrated on the statistical analysis of a sample of instrumental or macroseismic data. The main feature of these formulations is to estimate the value of a seismic parameter (i.e., accelerations, velocity, seismic intensity, etc.) as a function of other synthetic factors, such as magnitude (Mw), epicentre (R) or hypocentre (h) distances.
Generally, the calibration of attenuation laws is based on the analysis of a catalogue of seismic events occurred in a given site of interest [37].
According to References [38,39], attenuation laws in terms of spectral accelerations (Sa) and peak ground accelerations (PGA) were derived in North America using a stochastic approach for the prediction of ground motions.
Other studies [40] derived attenuation equations in terms of seismic intensity (MMI) from instrumental recordings of events that occurred in the United States.
Similarly, research performed in Europe [41] provided important insights into the adoption of seismic attenuation laws based on the maximum expected acceleration.
In the current investigation, the analysis of the damage scenarios of the inspected urban compartment of Senerchia is carried out by means of the following seismic attenuation law [42]:
where Mw is the moment magnitude and R (measured in Km) is the site-source distance. To this purpose, the historical earthquakes in the examined area were taken from the Italian Macroseismic Database DBMI-15 (National Institute of Geophysics and Volcanology) [43]. In particular, the seismic events of Area Nolana (1805), Irpinia (1982) and Potentino (1990), which gave rise to moment magnitudes of 4, 5 and 6, respectively, were selected (Figure 7). The selection of these magnitude sets has allowed us to plot the expected damage scenarios.
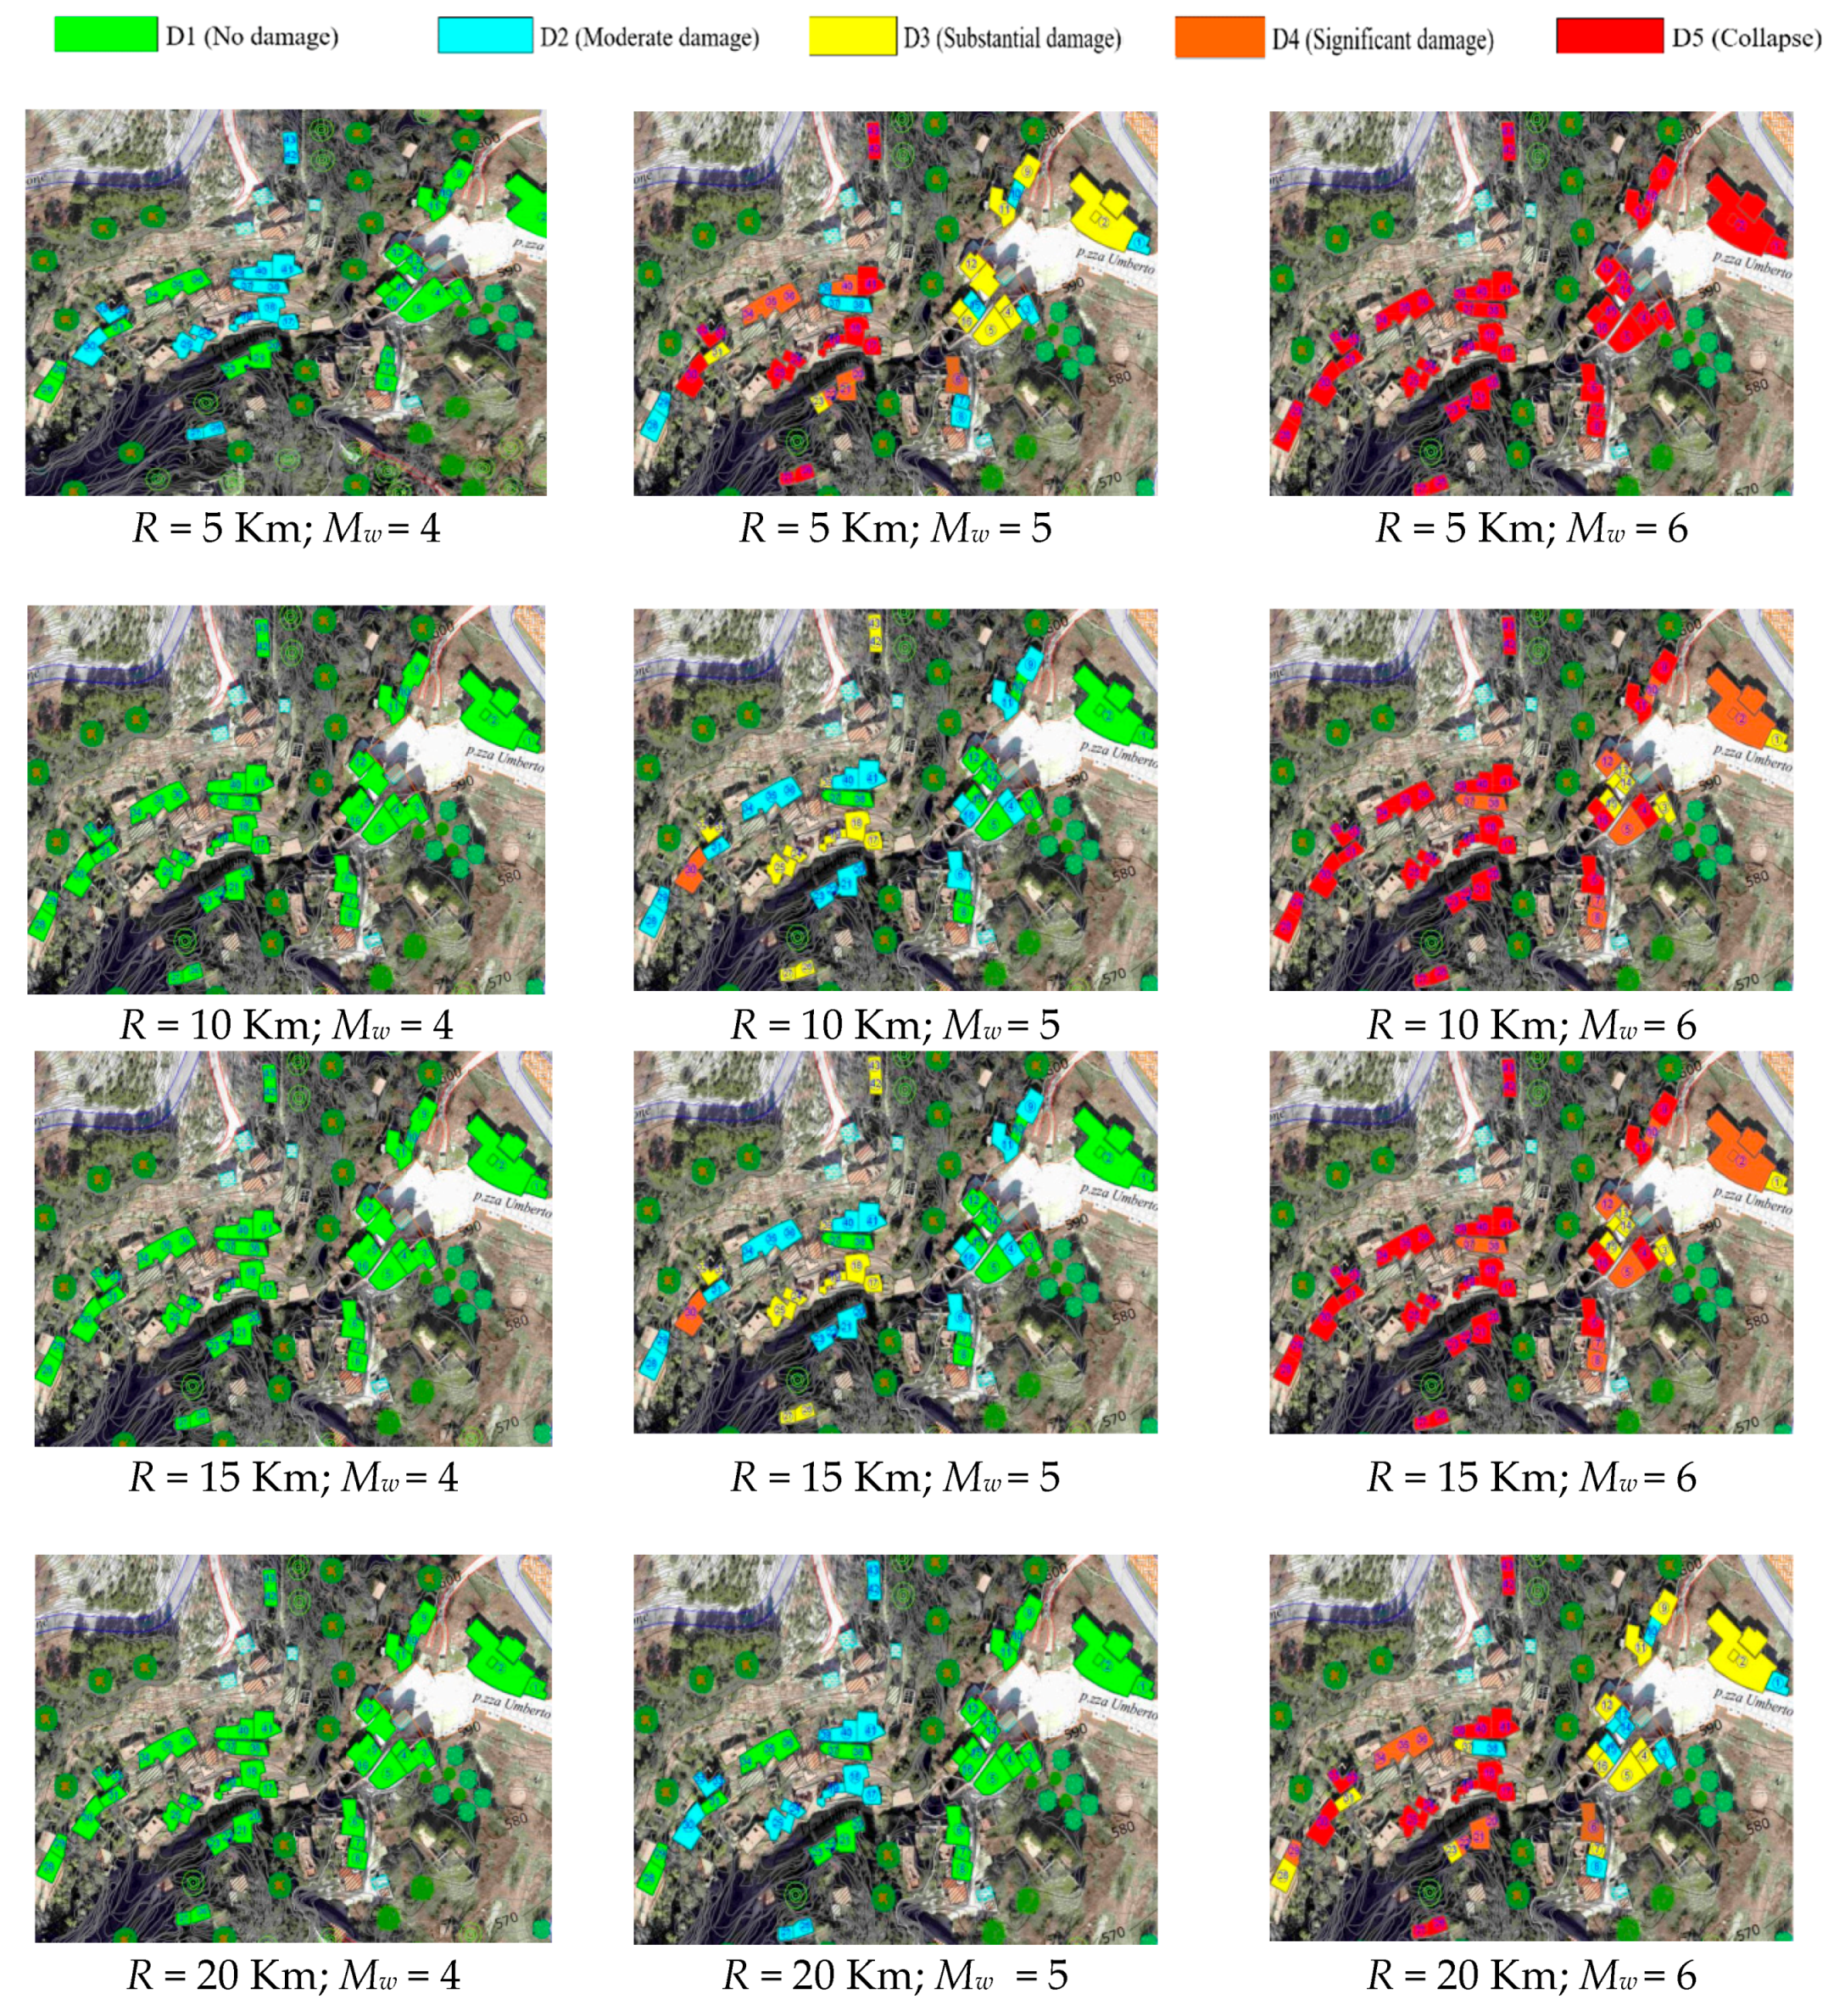
In order to predict the seismicity of the study area, a set of magnitudes (in the range (4–6)) and epicentre distances (in the range (5–20 Km)) are considered. The macroseismic intensities correlated to the earthquake magnitudes on the basis of Equation (4) are reported in Table 2.
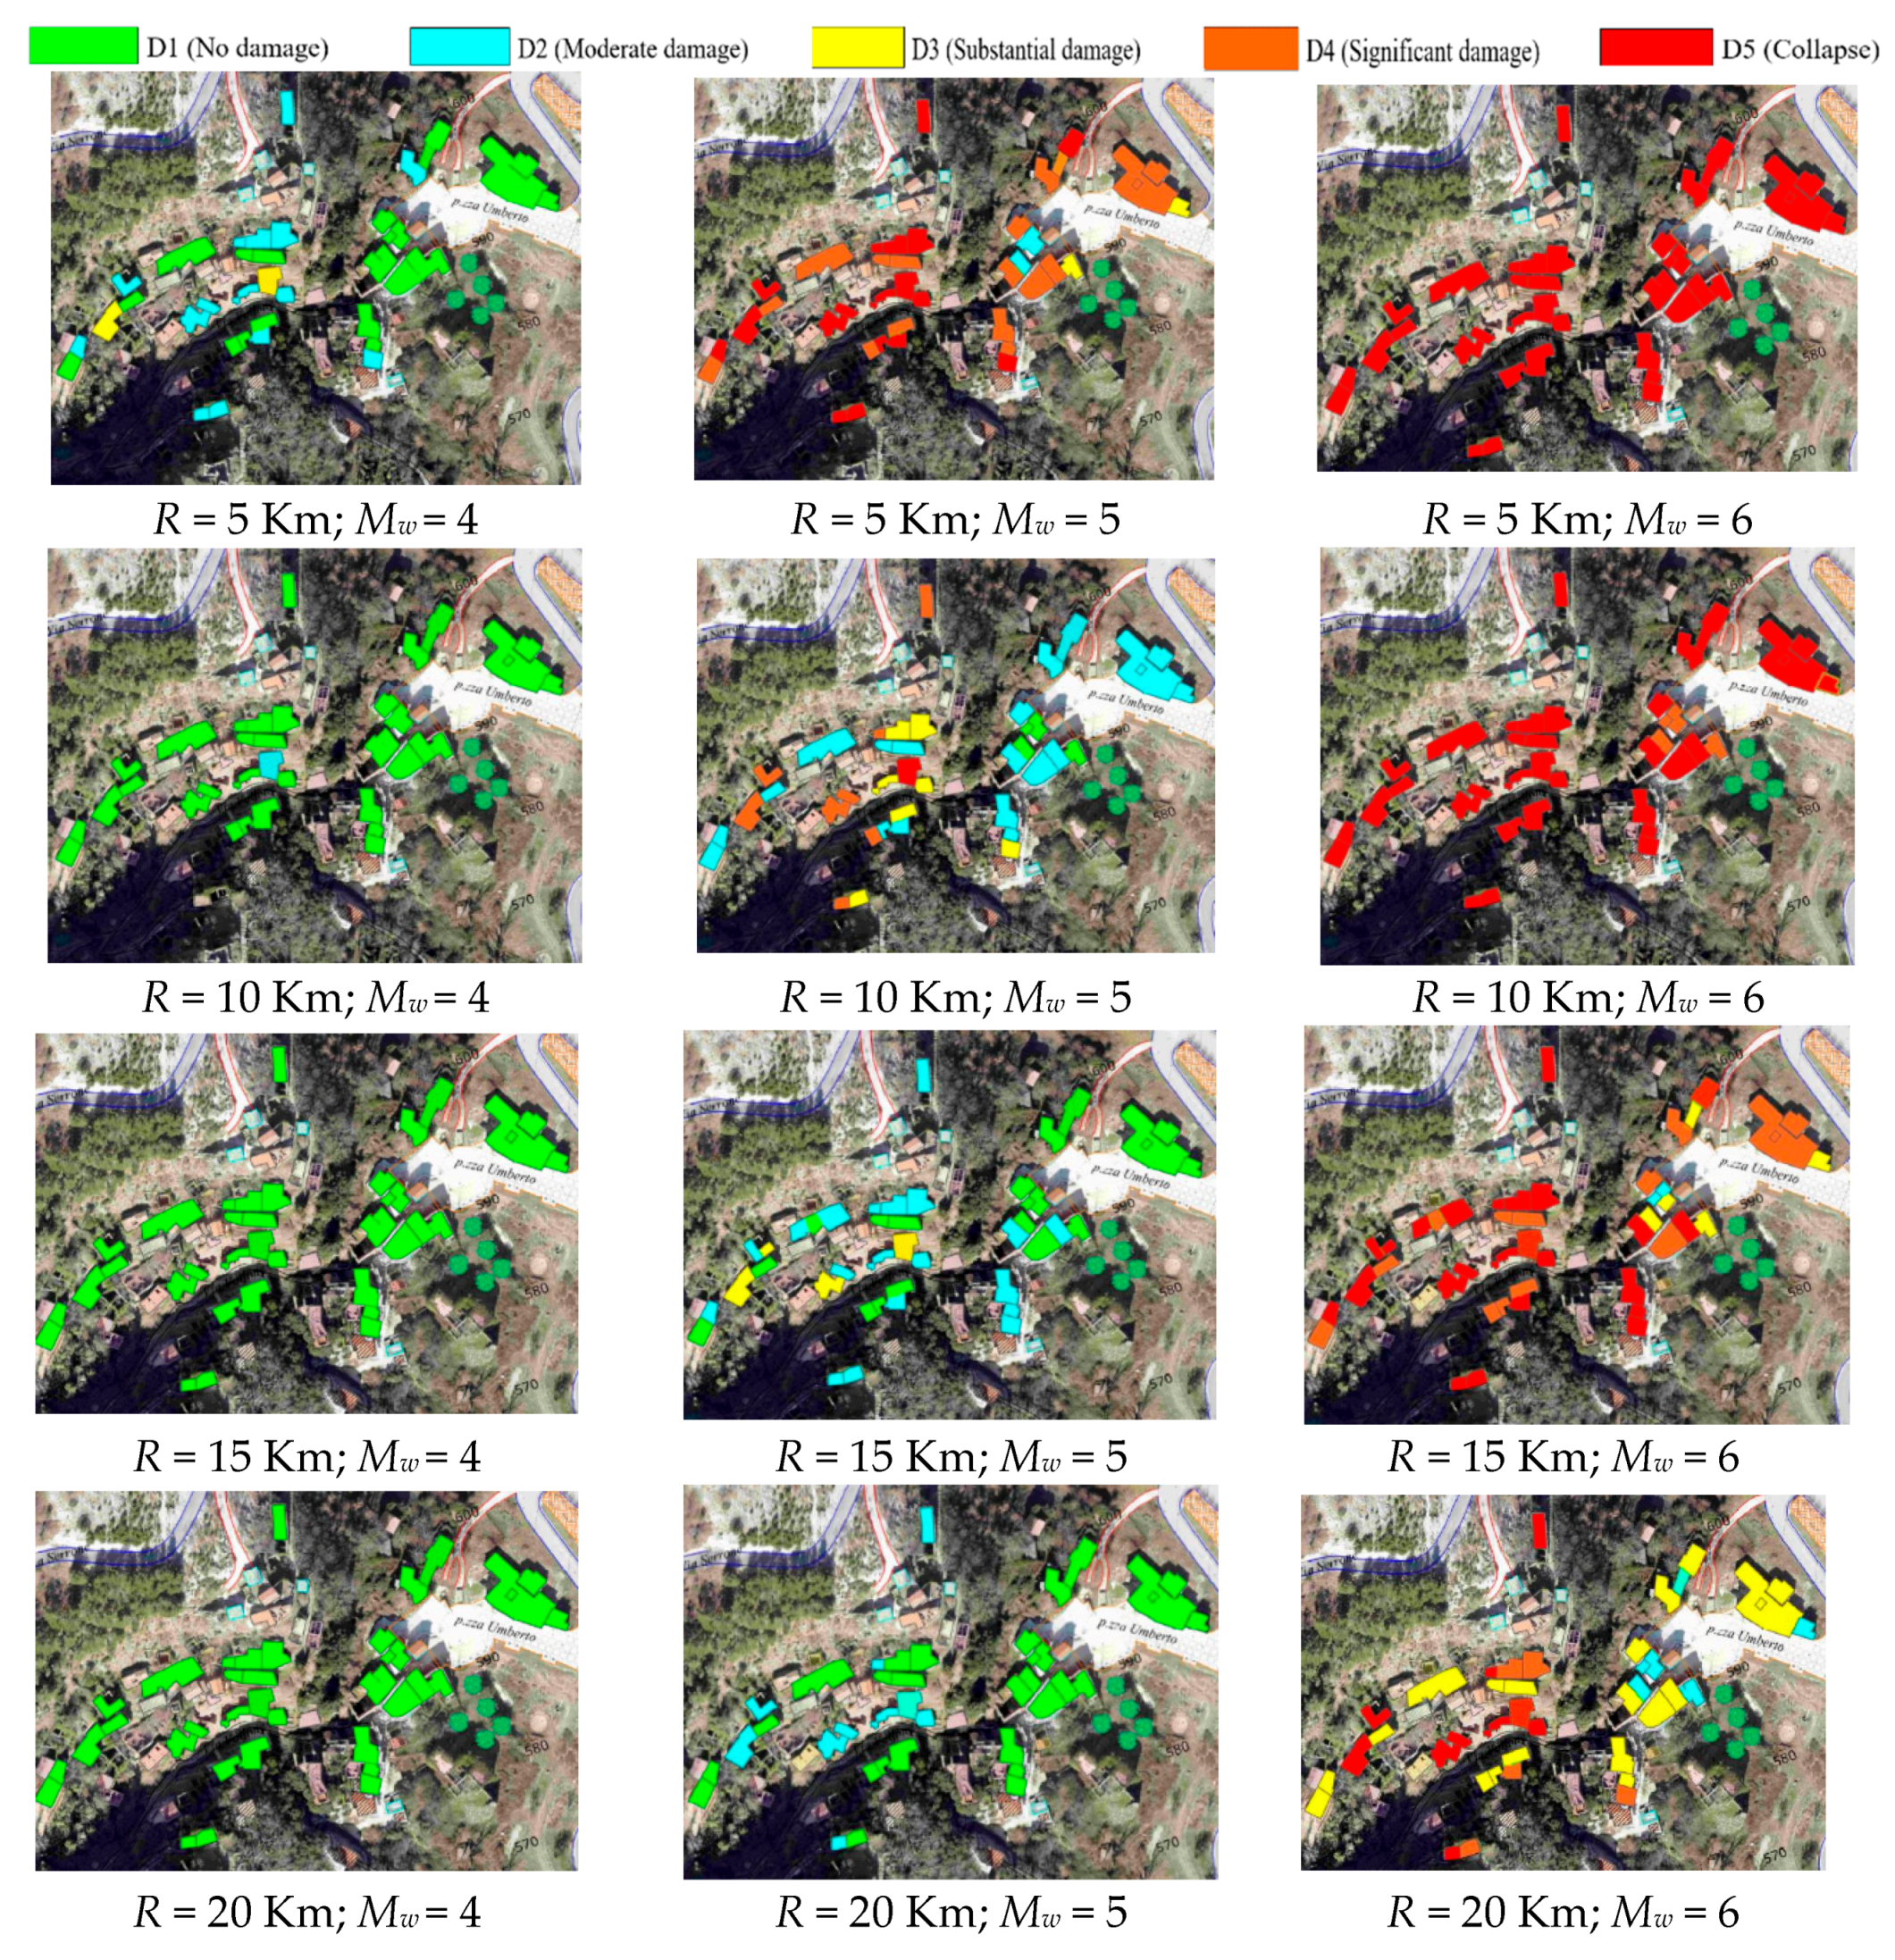
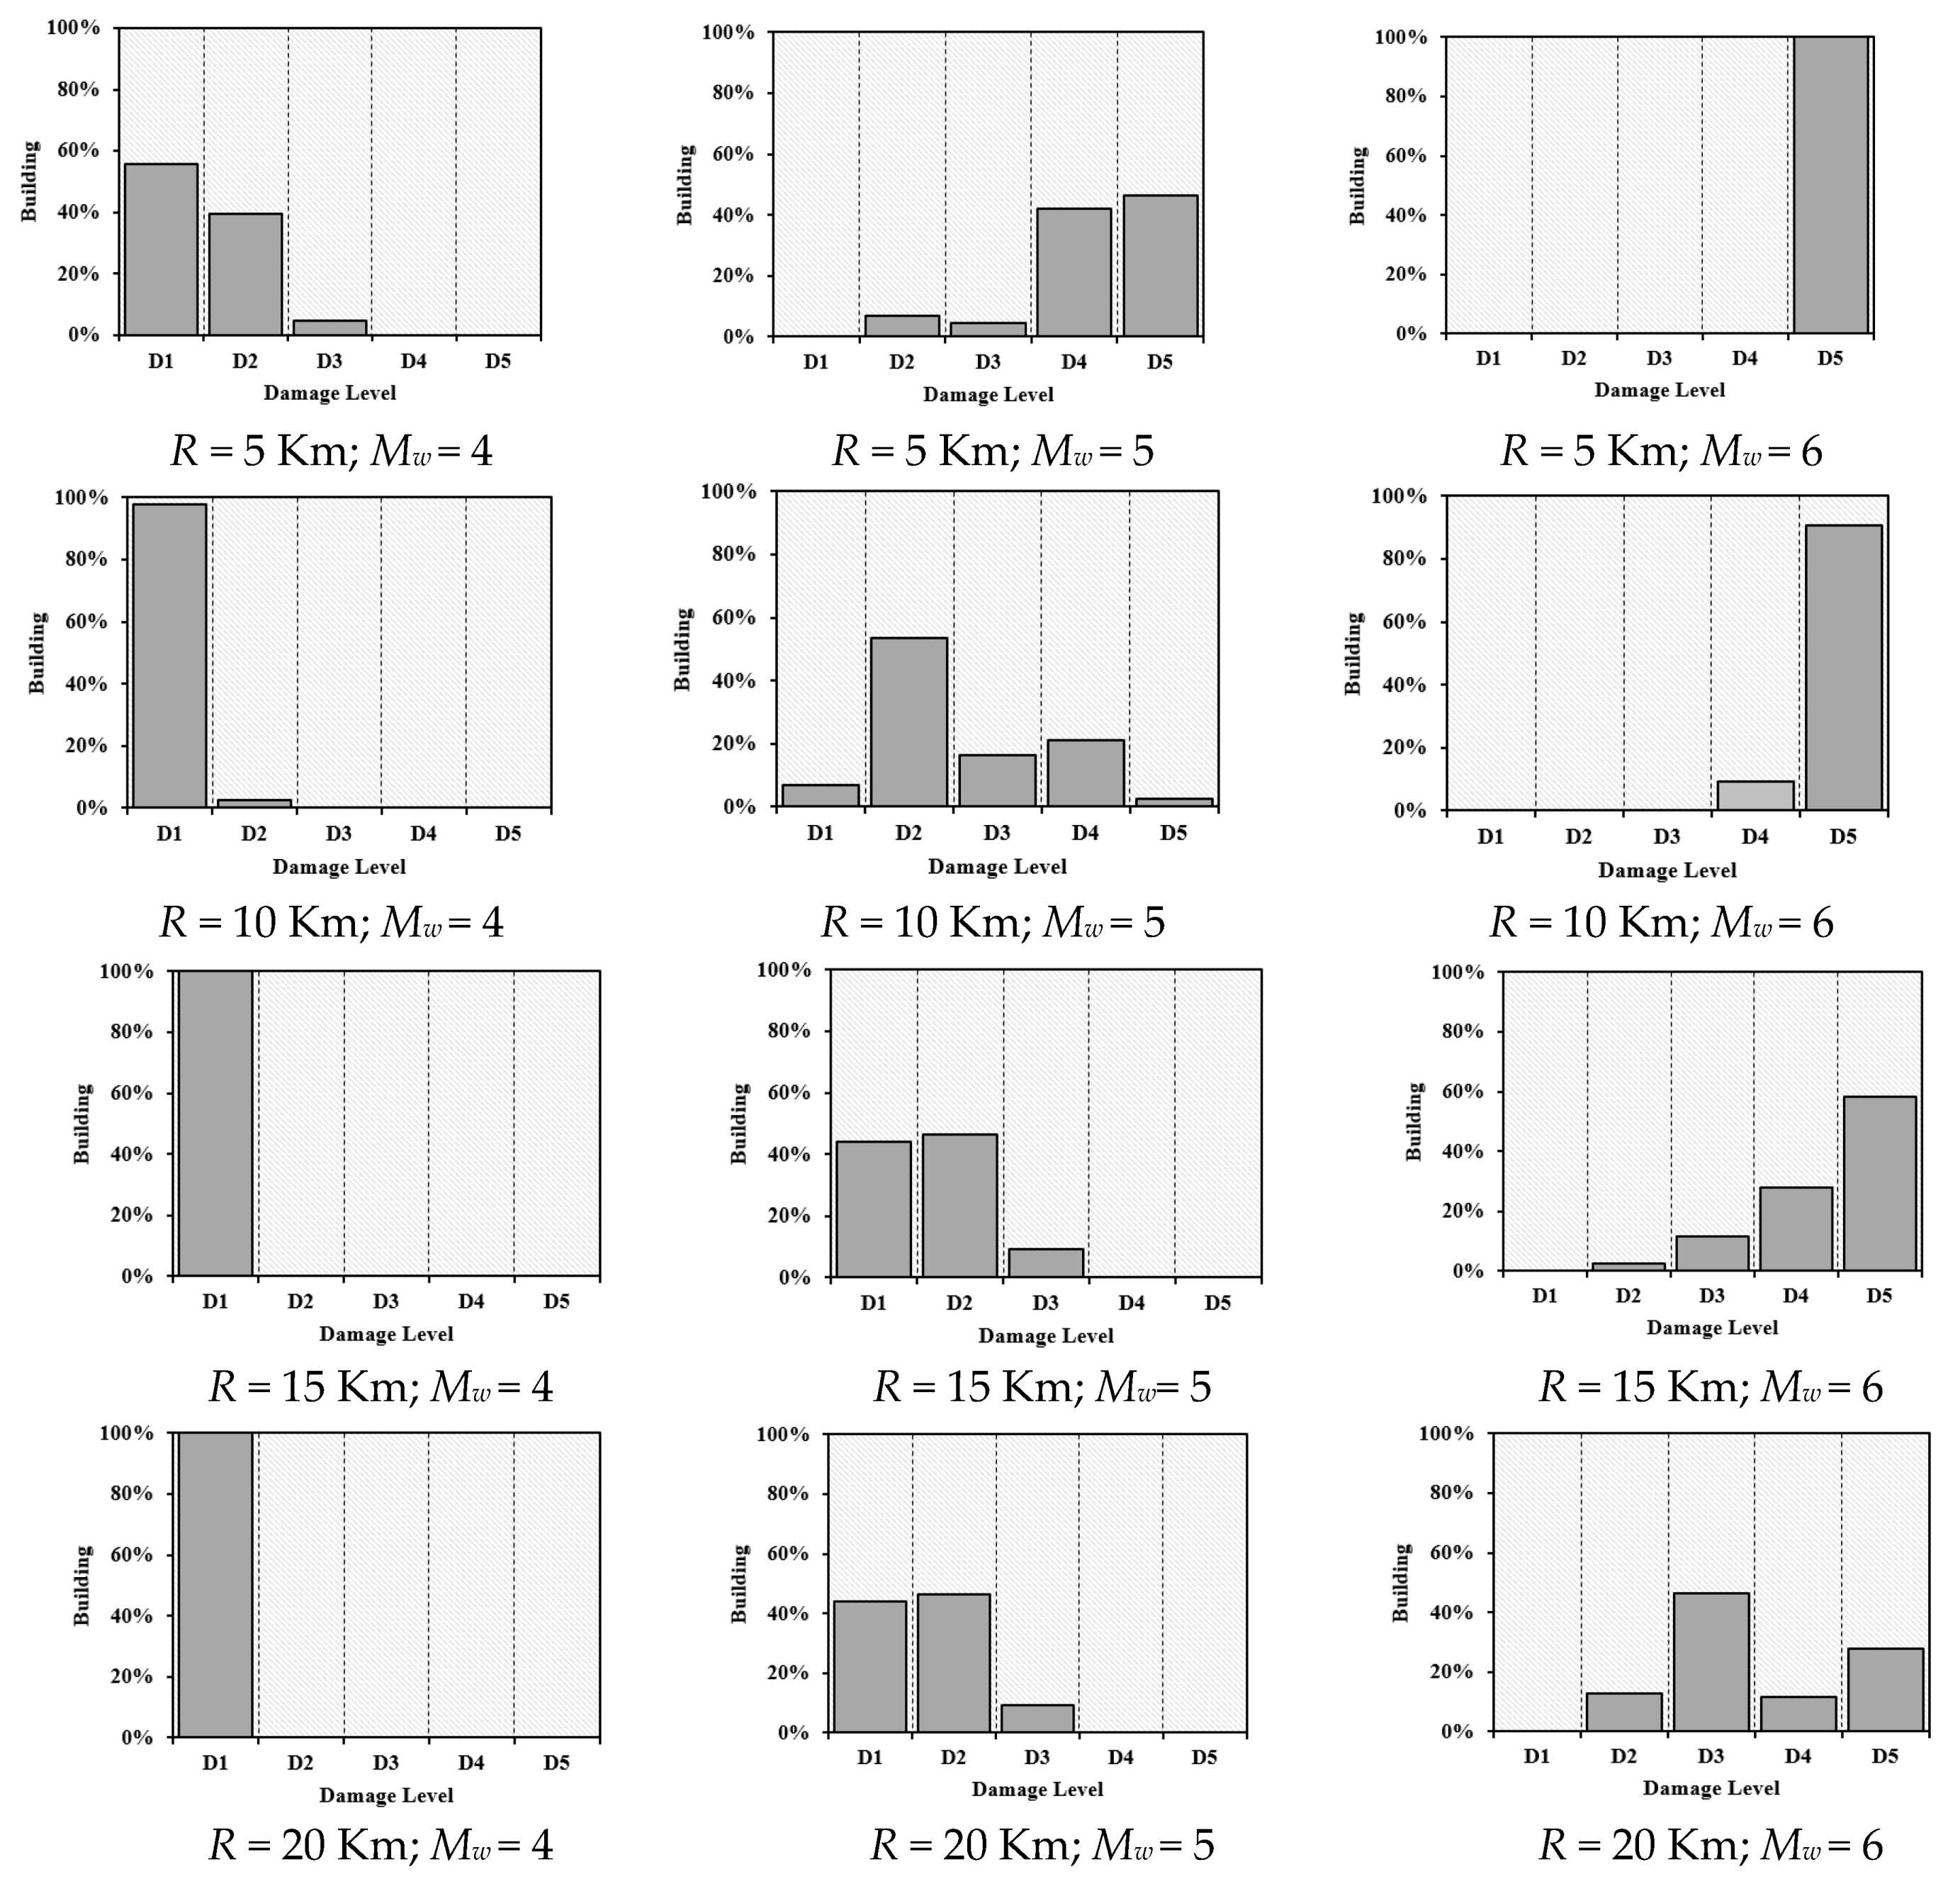
Subsequently, 12 damage scenarios at different magnitudes and site-source distances are evaluated, as shown in Figure 8.
The correlation between the mean damage grade, µD, and the damage thresholds, DK, were developed according to the EMS-98 scale [44].
From the analysis results, it appears that for Mw = 4 about 40% of the building sample suffers damage D2, while for Mw = 6, a damage threshold D5 (collapse) is attained for the entire urban-sector. Instead, when Mw = 5, a more variable damage distribution is achieved.
4. Geo-Hazard Effects
4.1. Local Site Conditions
The analysis of effects induced by the local seismic hazard represents an important issue for a more effective prediction of the damage scenarios of the investigated area and, therefore, for the implementation of risk mitigation plans. In fact, seismic site effects are related to the amplification of seismic waves in superficial geological layers. The surface ground motion may be strongly amplified if the geological conditions are unfavourable (e.g., sediments). Consequently, the study of local site effects is an important aspect to take into account for the assessment of seismic hazard and physical vulnerability of buildings, since damage due to earthquakes may thus be aggravated.
According to Reference [20], site effects are estimated by a macroseismic approach, which allows us to determine the expected damage through the calibration of a suitable local amplification coefficient.
Even though it is considered a discrete quantity, the macroseismic intensity is the main parameter for directly correlating the seismic input to damage. Furthermore, as previously analysed, a scenario analysis aims to estimate the damage level at the territorial scale instead of predicting the response of a certain structure at a specific site [45].
4.2. Geological and Geotechnical Classification of the Study Area
Focusing on the case study, the area of the historic centre of Senerchia is located to the southwest of the town, geographically in the foothills of the Magnone limestone-dolomite mountain. This area belongs to the Western area of the Southern Apennine Range (Picentini mountains), on the right of the High Valley of Sele.
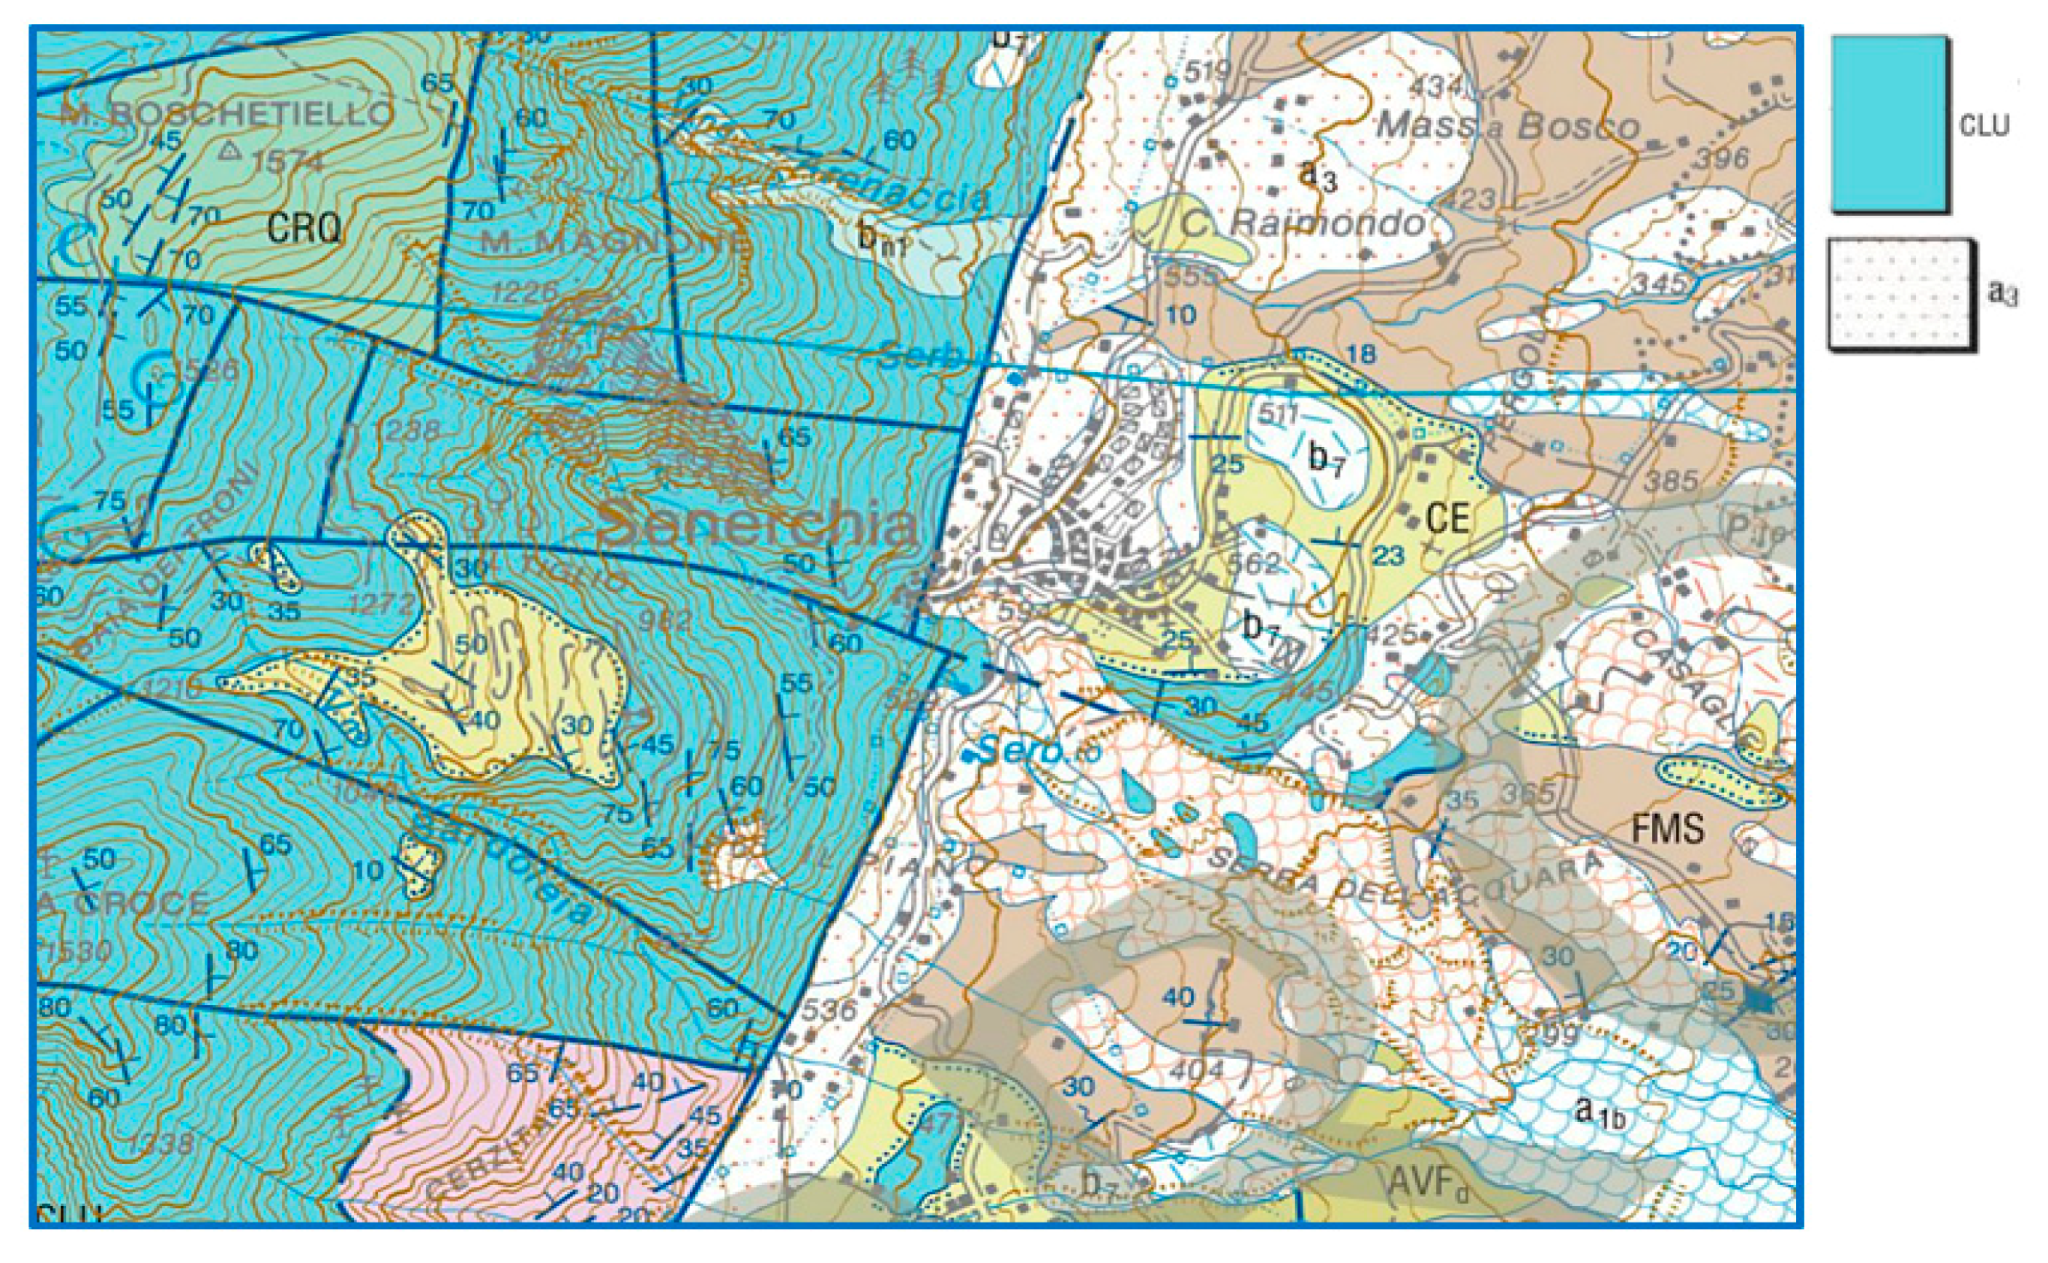
The territory is characterised by the presence of heterogeneous deposits composed of more or less regular alternations of lithotypes. These deposits have a propensity for failure induced by pre-existing discontinuity surfaces with various ages and dimensions. In particular, as shown in Figure 9, the municipal territory mainly consists of two distinct areas, i.e., limestone and dolomite limestone (CLU) and deposits of ground debris (a3).
For the seismic microzonation of this historic centre, data from on-site surveys made available by the Municipal Administration are used. Furthermore, on-site tests are carried out to identify the stratigraphy of the ground and the propagation velocity of the seismic waves measured by the geophone.
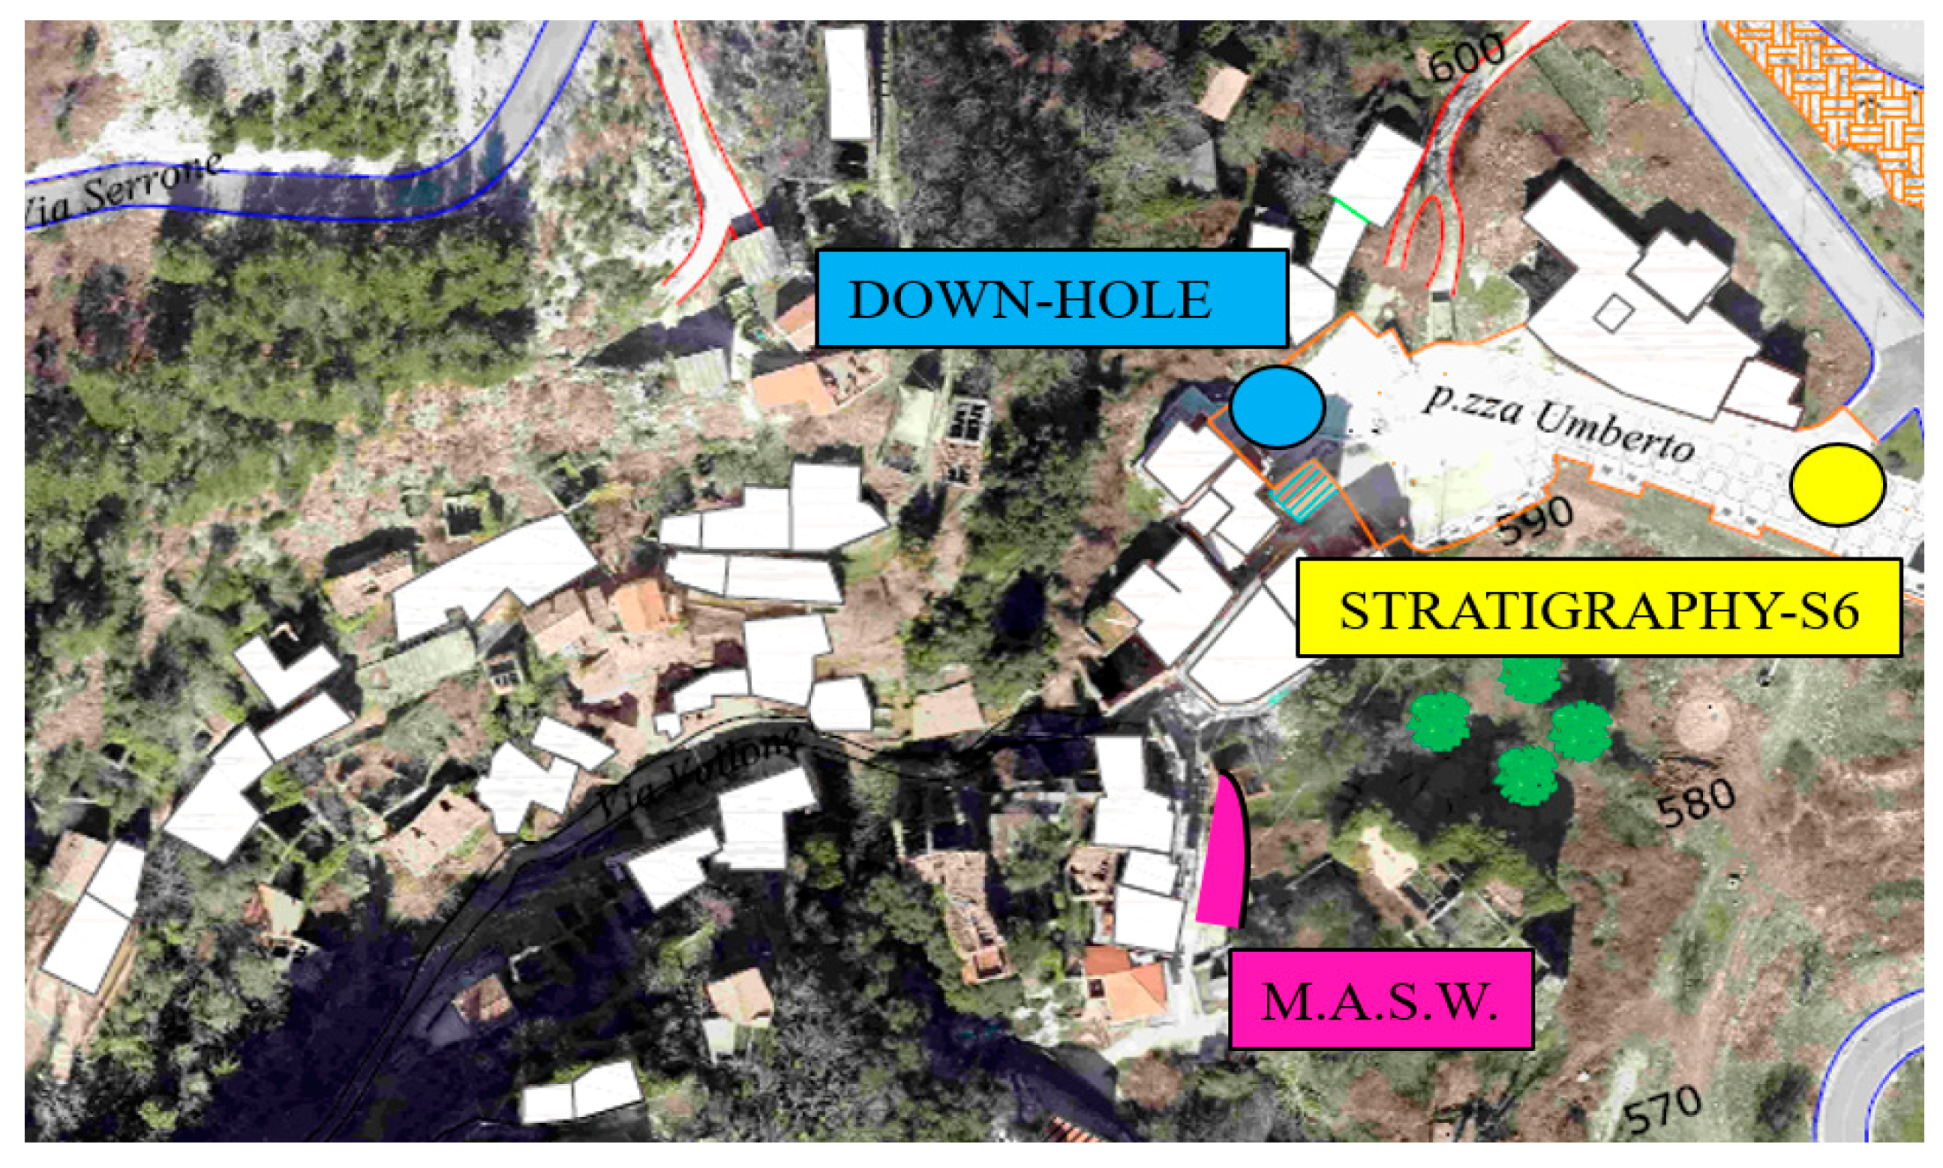
Figure 10 shows the areas where the geological and geotechnical characterisation tests were carried out.
First, the Down-Hole test is performed, aiming at estimating the propagation velocity of the seismic waves. The seismic wave velocity values obtained from the survey show that the soil under examination is of category B [21], i.e., rocks and deposits made of very thick coarse-grained soils or very fine-grained soils.
Subsequently, the M.A.S.W test is carried out. This test consists of placing a series of equidistant geophones on the ground surface, which record the effects generated by external perturbations produced by a source (hammer strike on an instrumented plate). The data acquired and processed by a software show an average propagation velocity of 812 m/s, which corresponds to category A soil (rigid soil) [21].
Finally, the third test is executed by the Municipal Administration of Senerchia. This test, indicated with “S6” in Figure 10, provides a stratigraphy of the ground consisting of deposits of pyroclastic material and calcareous debris. Therefore, the subsoil category associated with this ground type is the C one [21].
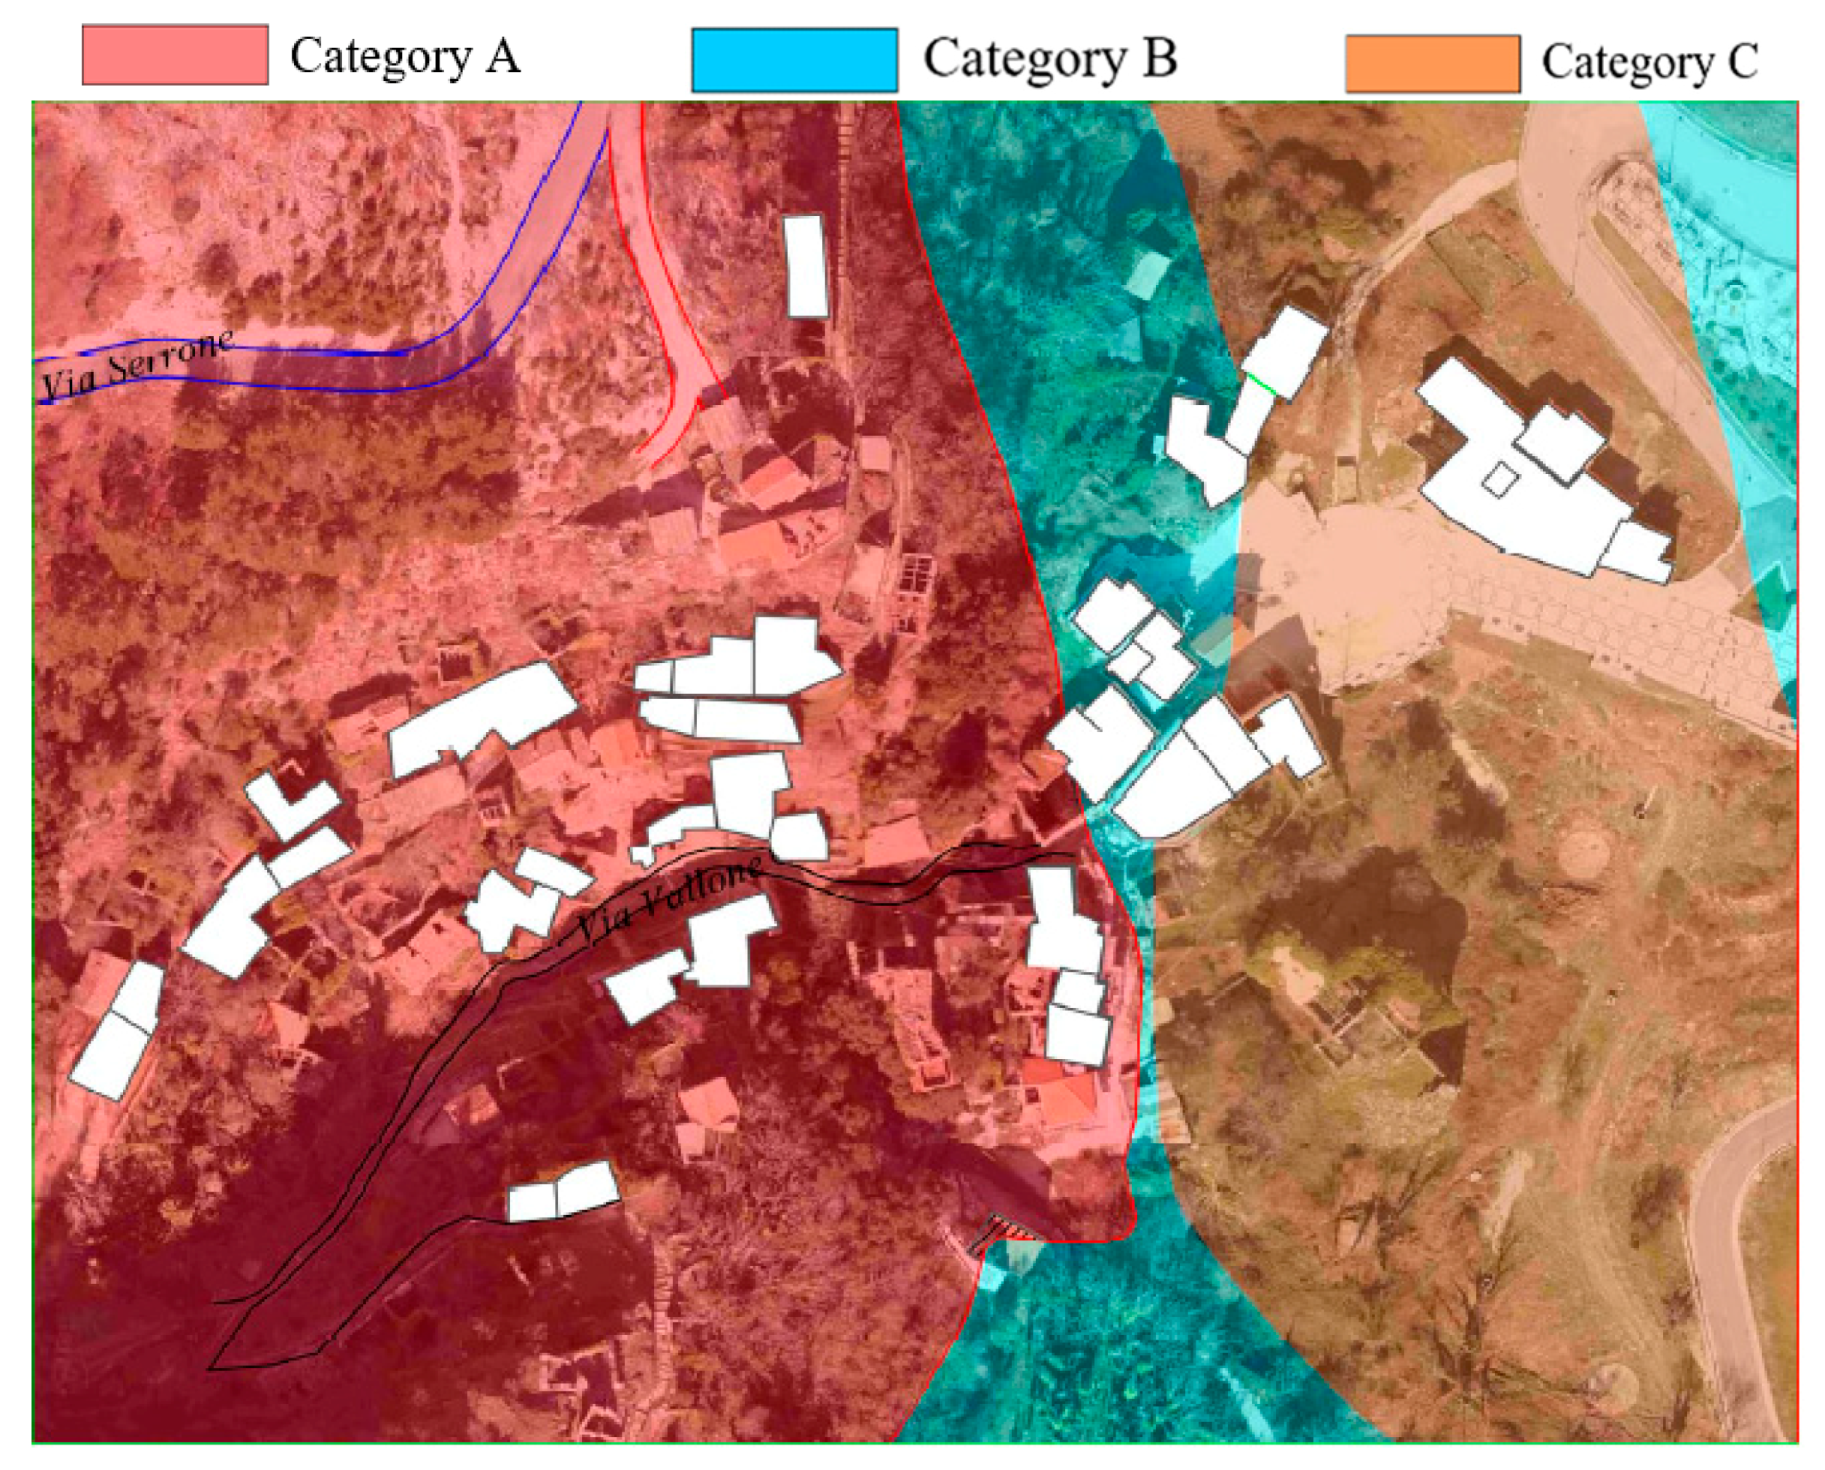
The seismic microzonation study gives rise to the identification of 3 geomorphologic areas, as required by the municipal plan (Figure 11).
4.3. Macroelement Numerical Analysis of an Aggregate Case Study
In the current work a building aggregate typical of the urban tissue of Senerchia is selected as a case study representative of the typological class of buildings within the investigated area (Figure 12).
Parametric non-linear static analyses are conducted with the 3Muri macro-elements software [46]. This software is based on the equivalent frame model, which schematises masonry walls as a set of single-dimension macro-elements represented by columns, beams and nodes [47]. The columns are vertical elements, which support vertical loads transmitted by the beams. The rigid nodes consist of masonry parts, confined between beams and columns, which result in them being undamaged due to the earthquake. In the performed analysis, the evaluation of the seismic risk factor can be defined as the ratio between the seismic demand acceleration, D, and the structure capacity one, C [48].
Subsequently, on the aggregate model described above, the evaluation of an appropriate local seismic amplification coefficient, fPGA, is carried out in order to consider the seismic intensification effects due to different soil categories. This coefficient is defined as the ratio between the factor αA, when the rigid soil (type A) is taken into account, and the factor αSoil, based on the different geological conditions (topographic class and soil category) taken one by one.
The general formula to calculate fPGA is defined as follows:
Moreover, for an accurate assessment of the local seismic response, parametric analyses are performed in the two main directions (X and Y) of the building aggregate by varying the type soil and topography class according to the Italian Code [21].
Therefore, based on the achieved numerical results, the values of fPGA are determined for each soil category (A, B, C, D, E) and for each topographic class, Ti (i = 1, 2, 3, 4). The results are summarized in Table 3 and Table 4, respectively.
The results show that the most unfavourable condition is obtained for the soil class D, which is associated with the local amplification coefficients equal to 1.70 (X direction) and 1.96 (Y direction). Similarly, considering the variation of the topographic category, it can be seen that the worst condition is given by T4 (hillside with slope >30°). Based on the obtained results and depending on the geologic conditions detected for the case study, the mean damage degree μD of the investigated structural units determined in Section 3.3 can be amplified by the maximum fPGA factor between those of the two analysis directions depicted in Table 3 and Table 4 leading to the more correct expected damage grade μD,s:
Consequently, the new damage scenarios for each set of moment magnitudes and distances from the epicentre are plotted (Figure 13).
For a synthetic representation of the damage occurred, Figure 14 shows the damage distribution obtained for the above-described combinations of magnitude and site-source distance.
Comparing the new damage scenario (Figure 14) to that reported in Section 3 (see Figure 8), it is possible to estimate the damage increase due to site effects, which is variable from 2% to 50%, as shown in Table 5.
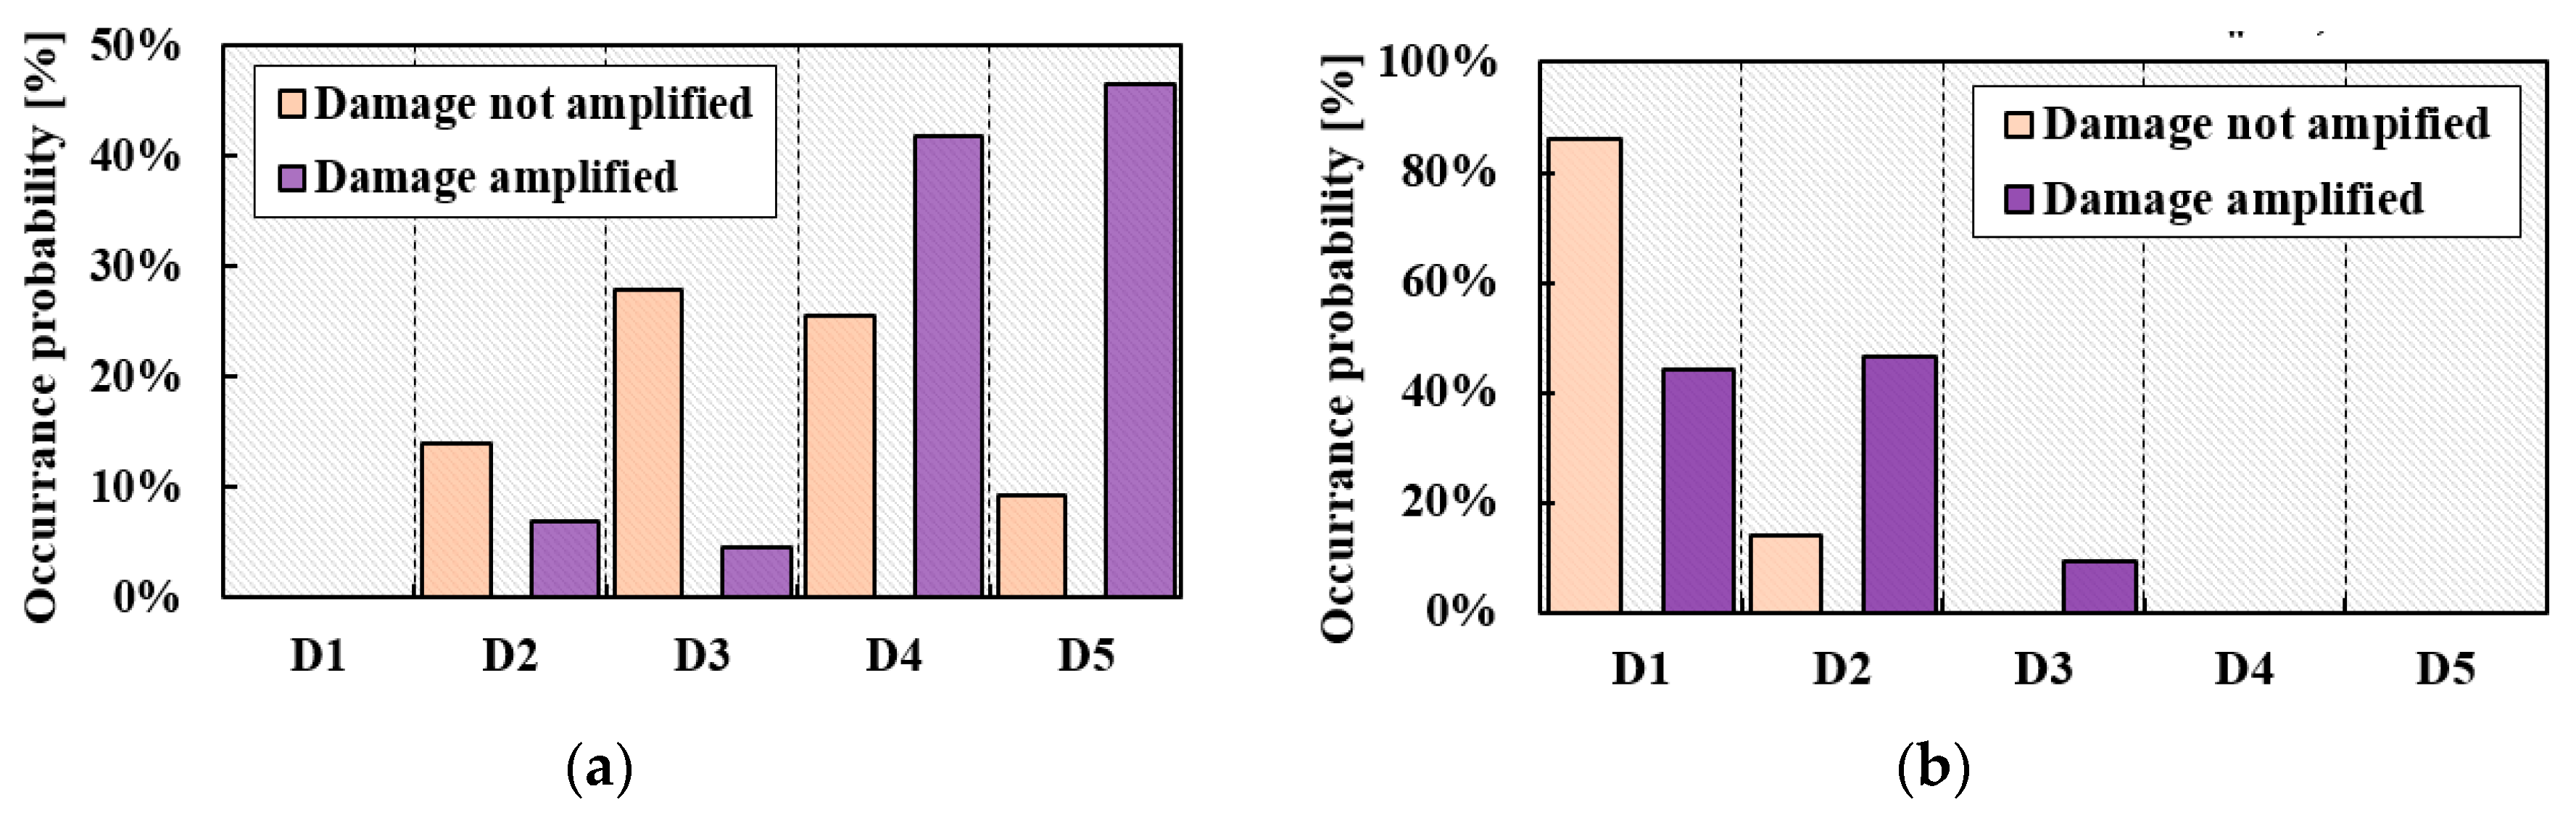
Finally, the expected damages with and without local effects are shown in Figure 15 in the cases of magnitude 5 and epicentre distances of 5 Km and 20 Km.
It is noted that for an epicentre distance value of 5 km and magnitude Mw = 5, when considering the local site effects, damage thresholds D2 and D3 are attained with an occurrence probability less than that of the basic case, when the soil influence is only marginally evaluated. Contrarily, the D4 and D5 damage levels significantly increase due to the site effects. On the other hand, considering the same magnitude and an epicentre distance of 20 km, the site effects reduce the D1 damage level, but increase the D2 threshold and also introduce the D3 one.
5. Final Remarks
The study proposes the first results of a novel methodology to analyse the seismic vulnerability of masonry building aggregates located in historic centres considering the influence of geologic conditions. An urban sector of the historical build-up of Senerchia, in the district of Avellino (Italy), was identified as the study area for the application of the proposed analysis method.
Firstly, the characterisation of the typological classes of the urban sector examined was done by means of the CARTIS form, which has allowed us to classify also the building compounds from the structural point of view. From on-site recognition, the masonry buildings with timber floors were the most recurring typological class.
Subsequently, the seismic vulnerability of the inspected urban sector was estimated through a vulnerability index method conceived for building aggregates. It is worth noting that, on average, the global vulnerability index of the sector is equal to 0.40. Moreover, the mean vulnerability curves of inspected typological classes were obtained in order to evaluate their susceptibility at damage by varying the seismic intensity according to the EMS-98 scale.
From the analysis results, it was detected that, for moderate values of seismic intensity (IEMS-98 < X), the expected damage is not relevant, but for higher values (X < IEMS-98 < XII), the expected damage would cause an incipient collapse of the analysed building sample.
In the next analysis step, the damage scenarios of the investigated urban sector, based on a specific seismic attenuation law, were estimated for different moment magnitudes and site-source distances. The results obtained showed that when the site-source distance increases, the expected damage tends to diminish, attaining a stable condition for large distances.
Contrary, when the magnitude increases, the most unfavourable condition occurred for Mw = 6, when, independently from the epicentre distance, most of the buildings should collapse.
Finally, the parametric numerical analyses on a case study building aggregate were carried out for the definition of local seismic amplification factors, taking into account the different topographic classes and categories of soils defined in the new Italian standard NTC18. These factors have allowed us to increase the expected damages of buildings due to local amplification phenomena linked to geologic conditions. From the new damage scenarios, it was detected that the site effects lead to a damage increment variable from 2% to 50%, which was much more marked at the smallest considered distance. In addition, local seismic effects were considerable for larger magnitudes. In fact, for the magnitude Mw = 4, the global vulnerability averagely increases by 5%, while, for Mw = 5, the site effects produce a mean damage increment of 50%. Moreover, seismic amplification factors due to the soil condition increase the occurrence probability of attaining the largest damage thresholds.
As a conclusion, the seismic vulnerability and risk analysis of the investigated area represent the starting point to extend the method herein implemented—based on the influence of geologic conditions—to the whole territory of Senerchia, as well as to that of other municipalities, for the development of more correct analysis strategies for seismic risk mitigation.
Author Contributions
Methodology, A.F.; Investigation, N.C.; Data Curation, N.C. and A.F.; Writing—Original Draft Preparation, N.C.; Writing—Review & Editing, A.F.
Funding
This research did not receive any external funding.
Acknowledgments
The Authors would like to acknowledge Prof. Antonio Santo from University of Naples “Federico II”, who provided the results of the geological-geotechnical study.
Conflicts of Interest
The authors declare no conflict of interest.
References
- Galli, P.; Camassi, R. Rapporto Sugli Effetti del Terremoto Aquilano del 6 Aprile 2009. Available online: http://www.protezionecivile.gov.it (accessed on 2 January 2019). (In Italian)
- Galli, P.; Castenetto, S.; Peronace, E. Rilievo macrosismico MCS Speditivo 1, Rapporto Finale. Available online: http://www.protezionecivile.gov.it (accessed on 3 January 2019). (In Italian)
- National Institute of Geophysics and Volcanology (INGV). Rapporto Di Sintesi Sul Terremoto in Centro Italia Mw 6.5 del 30 Ottobre 2016. INGV Working Group on the Earthquake in Central Italy, 2016; pp. 1–49. Available online: https://ingvterremoti.files.wordpress.com (accessed on 9 January 2109). (In Italian).
- Barbat, A.H.; Carreño, M.L.; Pujades, L.G.; Lantada, N.; Cardona, O.D.; Marulanda, M.C. Seismic vulnerability and risk evaluation methods for urban areas. A review with application to a pilot area. Struct. Infrastruct. Eng. 2010, 6, 17–38. [Google Scholar] [CrossRef]
- Porter, K.A.; Beck, J.L.; Shaikhutdinov, R. Simplified estimation of economic seismic risk for buildings. Earthq. Spectra 2004, 20, 1239–1263. [Google Scholar] [CrossRef]
- Zuccolo, E.; Vaccari, F.; Peresan, A.; Panza, G.F. Neo-Deterministic and Probabilistic Seismic Hazard Assessments: A Comparison over the Italian Territory. Pure Appl. Geophys. 2011, 168, 69–83. [Google Scholar] [CrossRef]
- Basaglia, A.; Aprile, A.; Spacone, E.; Pilla, F. Performance-based Seismic Risk Assessment of Urban Systems. Int. J. Archit. Herit. 2018, 12, 1131–1149. [Google Scholar] [CrossRef]
- Weißhuhn, P.; Müller, F.; Wiggering, H. Ecosystem Vulnerability Review: Proposal of an Interdisciplinary Ecosystem Assessment Approach. Environ. Manag. 2018, 61, 904–915. [Google Scholar] [CrossRef] [PubMed]
- Cara, S.; Aprile, A.; Pelà, L.; Roca, P. Seismic Risk Assessment and Mitigation at Emergency Limit Condition of Historical Buildings along Strategic Urban Roadways. Application to the “Antiga Esquerra de L’Eixample” Neighborhood of Barcelona. Int. J. Archit. Herit. 2018, 12, 1055–1075. [Google Scholar] [CrossRef]
- Jiménez, B.; Pelà, L.; Hurtado, M. Building survey forms for heterogeneous urban areas in seismically hazardous zones. Application to the historical center of Valparaíso, Chile. Int. J. Archit. Herit. 2018, 12, 1076–1111. [Google Scholar] [CrossRef]
- Formisano, A.; Florio, G.; Landolfo, R.; Mazzolani, F.M. Numerical calibration of a simplified procedure for the seismic behaviour assessment of masonry building aggregates. In Proceedings of the 13th International Conference on Civil, Structural and Environmental Engineering Computing, Crete, Greece, 6–9 September 2011; p. 28. [Google Scholar]
- Formisano, A.; Chieffo, N.; Fabbrocino, F.; Landolfo, R. Seismic vulnerability and damage of Italian historical centre: A case study in the Campania region. AIP Conf. Proc. 2017, 1863, 450007. [Google Scholar]
- Rapone, D.; Brando, G.; Spacone, E.; De Matteis, G. Seismic vulnerability assessment of historic centers: Description of a predictive method and application to the case study of scanno (Abruzzi, Italy). Int. J. Archit. Herit. 2018, 12, 1171–1195. [Google Scholar] [CrossRef]
- Clementi, F.; Gazzani, V.; Poiani, M.; Lenci, S. Assessment of seismic behaviour of heritage masonry buildings using numerical modelling. J. Build. Eng. 2016, 8, 29–47. [Google Scholar] [CrossRef]
- Angelillo, M.; Lourenço, P.B.; Milani, G. Masonry behaviour and modelling. In Mechanics of Masonry Structures; CISM International Centre for Mechanical Sciences, Courses and Lectures; Angelillo, M., Udine, Eds.; Springer: Vienna, Austria, 2014; Volume 551, pp. 1–26. [Google Scholar]
- Formisano, A.; Marzo, A. Simplified and refined methods for seismic vulnerability assessment and retrofitting of an Italian cultural heritage masonry building. Comput. Struct. 2017, 180, 13–26. [Google Scholar] [CrossRef]
- Sá, L.; Morales-Esteban, A.; Durand Neyra, P. The 1531 earthquake revisited: Loss estimation in a historical perspective. Bull. Earthq. Eng. 2018, 16, 1–27. [Google Scholar] [CrossRef]
- D’Ayala, D.; Ansal, A. Non linear push over assessment of heritage buildings in Istanbul to define seismic risk. Bull. Earthq. Eng. 2012, 10, 285–306. [Google Scholar] [CrossRef]
- Evangelista, L.; del Gaudio, S.; Smerzini, C.; d’Onofrio, A.; Festa, G.; Iervolino, I.; Landolfi, L.; Paolucci, R.; Santo, A.; Silvestri, F. Physics-based seismic input for engineering applications: A case study in the Aterno river valley, Central Italy. Bull. Earthq. Eng. 2017, 15, 2645–2671. [Google Scholar] [CrossRef]
- Giovinazzi, S. Geotechnical hazard representation for seismic risk analysis. Bull. N. Z. Earthq. Eng. 2009, 42, 221–234. [Google Scholar]
- Ministerial Decree, DM 20/02/2018. “Updating of Technical Standards for Construction”. Available online: http://www.gazzettaufficiale.it/eli/gu/2018/02/20/42/so/8/sg/pdf (accessed on 3 January 2018). (In Italian).
- Calvanese, F.; Carchedi, F.; D’Amelio, R. Emigrazione e immigrazione in Campania: Il caso dell’Alto Sele. In Materiali; Ediesse: Roma, Italy, 2005; p. 336. [Google Scholar]
- Scognamiglio, L.; Tinti, E.; Emolo, U.R.A.; Gallovic, F. Progetto S3—Scenari di Scuotimento in aree di Interesse Prioritario e/o Strategico. 2007. Available online: http://esse3.mi.ingv.it (accessed on 8 January 2019).
- Pantosti, D.; Schwartz, D.P.; Valensise, G. Paleoseismology along the 1980 surface rupture of the irpinia fault: Implications for earthquake recurrence in the southern Apennines, Italy. J. Geophys. Res. Solid Earth 1993, 98, 6561–6577. [Google Scholar] [CrossRef]
- Ameri, G.; Emolo, A.; Pacor, F.; Gallovič, F. Ground-Motion simulations for the 1980 M 6.9 Irpinia earthquake (Southern Italy) and scenario events. Bull. Seismol. Soc. Am. 2011, 101, 1136–1151. [Google Scholar] [CrossRef]
- Pulinets, S.A.; Biagi, P.; Tramutoli, V.; Legen’ka, A.D.; Depuev, V.K. Irpinia earthquake 23 November 1980—Lesson from nature reviled by joint data analysis. Ann. Geophys. 2007, 50, 61–78. [Google Scholar] [CrossRef]
- Pasquale, G.; Matteis, R.; Romeo, A.; Maresca, R. Earthquake focal mechanisms and stress inversion in the Irpinia Region (Southern Italy). J. Seismol. 2009, 13, 107–124. [Google Scholar] [CrossRef]
- Mangalathu, S.; Jeon, J.; Padgett, J.E.; Desroches, R. ANCOVA-based grouping of bridge classes for seismic fragility assessment. Eng. Struct. 2016, 123, 379–394. [Google Scholar] [CrossRef]
- Zuccaro, G.; Della Bella, M.; Papa, F. Caratterizzazione tipologico strutturali a scala nazionale. In Proceedings of the 9th National Conference ANIDIS, L’ingegneria Sismica, Italy, 20–23 September 1999. [Google Scholar]
- Formisano, A.; Florio, G.; Landolfo, R.; Mazzolani, F.M. Numerical calibration of an easy method for seismic behaviour assessment on large scale of masonry building aggregates. Adv. Eng. Softw. 2015, 80, 116–138. [Google Scholar] [CrossRef]
- Formisano, A.; Chieffo, N.; Mosoarca, M. Seismic Vulnerability and Damage Speedy Estimation of an Urban Sector within the Municipality of San Potito Sannitico (Caserta, Italy). Open Civ. Eng. J. 2017, 1106–1121. [Google Scholar] [CrossRef]
- Benedetti, D.; Petrini, V. Sulla vulnerabilita sismica di edifici in muratura: Proposta su un metodo di valutazione. L’industria Delle Costr. 1984, 149, 64–72. [Google Scholar]
- Giovinazzi, S.; Lagomarsino, S. A Macroseismic Method for the Vulnerability Assessment of Buildings. In Proceedings of the 13th World Conference on Earthquake Engineering, Vancouver, BC, Canada, 1–6 August 2004. [Google Scholar]
- Lagomarsino, S. On the vulnerability assessment of monumental buildings. Bull. Earthq. Eng. 2006, 4, 445–463. [Google Scholar] [CrossRef]
- Maio, R.; Ferreira, T.M.; Vicente, R.; Estêvão, J. Seismic vulnerability assessment of historical urban centres: Case study of the old city centre of Faro, Portugal. J. Risk Res. 2016, 19, 551–580. [Google Scholar] [CrossRef]
- Elnashai, A.S.; Di Sarno, L. Fundamentals of Earthquake Engineering, 1st ed.; Elnashai, A.S., Di Sarno, L., Eds.; p. 374. Available online: https://fac.ksu.edu.sa/sites/default/files/fundamentals_of_earthquake_engineering.pdf (accessed on 2 January 2019).
- Vilanova, S.P.; Fonseca, J.F.B.D. Probabilistic seismic-hazard assessment for Portugal. Bull. Seismol. Soc. Am. 2007, 97, 1702–1717. [Google Scholar] [CrossRef]
- Toro, G.R.; Abrahamson, N.A.; Schneider, J.F. Model of Strong Ground Motions from Earthquakes in Central and Eastern North America: Best Estimates and Uncertainties. Seismol. Res. Lett. 1997, 68, 41–57. [Google Scholar] [CrossRef]
- Atkinson, G.M.; Boore, D.M. Stochastic point-source modeling of ground motions in the Cascadia region. Seismol. Res. Lett. 1997, 74–85. [Google Scholar] [CrossRef]
- Atkinson, G.M.; Kaka, S.L.I. Relationships between felt intensity and instrumental ground motion in the Central United States and California. Bull. Seismol. Soc. Am. 2007, 97, 497–510. [Google Scholar] [CrossRef]
- Ambraseys, N.N.; Simpson, K.A.; Bommer, J.J. Prediction of Horizontal Response Spectra in Europe. Earthq. Eng. Struct. Dyn 1996, 25, 371–400. [Google Scholar] [CrossRef]
- Crespellani, T.; Garzonio, C.A. Seismic risk assessment for the preservation of historical buildings in the city of Gubbio. In Geotechnical engineering for the preservation of monuments and historic sites. In Proceedings of the International Symposium on Geotechnical Engineering for the Preservation of Monuments and Historic Sites, Napoli, Italy, 3–4 October 1997. [Google Scholar]
- Locati, M. DBMI15, the 2015 Version of the Italian Macroseismic Database, 2016 (In Italian). Available online: https://emidius.mi.ingv.it (accessed on 2 January 2019).
- Grünthal, G. European Macroseismic Scale 1998. Available online: http://lib.riskreductionafrica.org/bitstream/handle/123456789/1193/1281.European%20Macroseismic%20Scale%201998.pdf?sequence=1 (accessed on 7 January 2019).
- Formisano, A. Local- and global-scale seismic analyses of historical masonry compounds in San Pio delle Camere (L’Aquila, Italy). Nat. Hazards 2017, 86, 465–487. [Google Scholar] [CrossRef]
- S.T.A data srl, “3Muri 10.9.0—User Manual”. Available online: www.3muri.com/documenti/brochure/it/3Muri10.9.0_IT.pdf (accessed on 11 January 2019). (In Italian).
- Maio, R.; Vicente, R.; Formisano, A.; Varum, H. Seismic vulnerability assessment of an old stone masonry building aggregate in San Pio delle Camere, Italy. In Proceedings of the 2nd European Conference on Earthquake Engineering and Seismology, Istanbul, Turkey, 24–29 August 2014. [Google Scholar]
- Formisano, A. Theoretical and Numerical Seismic Analysis of Masonry Building Aggregates: Case Studies in San Pio Delle Camere (L’Aquila, Italy). J. Earthq. Eng. 2017, 21, 227–245. [Google Scholar] [CrossRef]
Figure 1.
The geographical localisation of the municipality of Senerchia.

Figure 2.
The Irpinia earthquake effects [23]: (a) time history main shock; (b) distribution of seismic intensities.
Figure 2.
The Irpinia earthquake effects [23]: (a) time history main shock; (b) distribution of seismic intensities.
Figure 3.
The fault mechanisms that occurred in the 1980 Irpinia earthquake.
Figure 4.
The street views of some building typologies inside the inspected historical centre of Senerchia.
Figure 4.
The street views of some building typologies inside the inspected historical centre of Senerchia.
Figure 5.
The study area: (a) urban sectors; (b) building inventory within the C01 sector.

Figure 6.
The mean typological vulnerability curves for examined buildings.
Figure 7.
The historical earthquakes selected for the case study area: (a) Area Nolana; (b) Irpinia; (c) Potentino [43].
Figure 7.
The historical earthquakes selected for the case study area: (a) Area Nolana; (b) Irpinia; (c) Potentino [43].
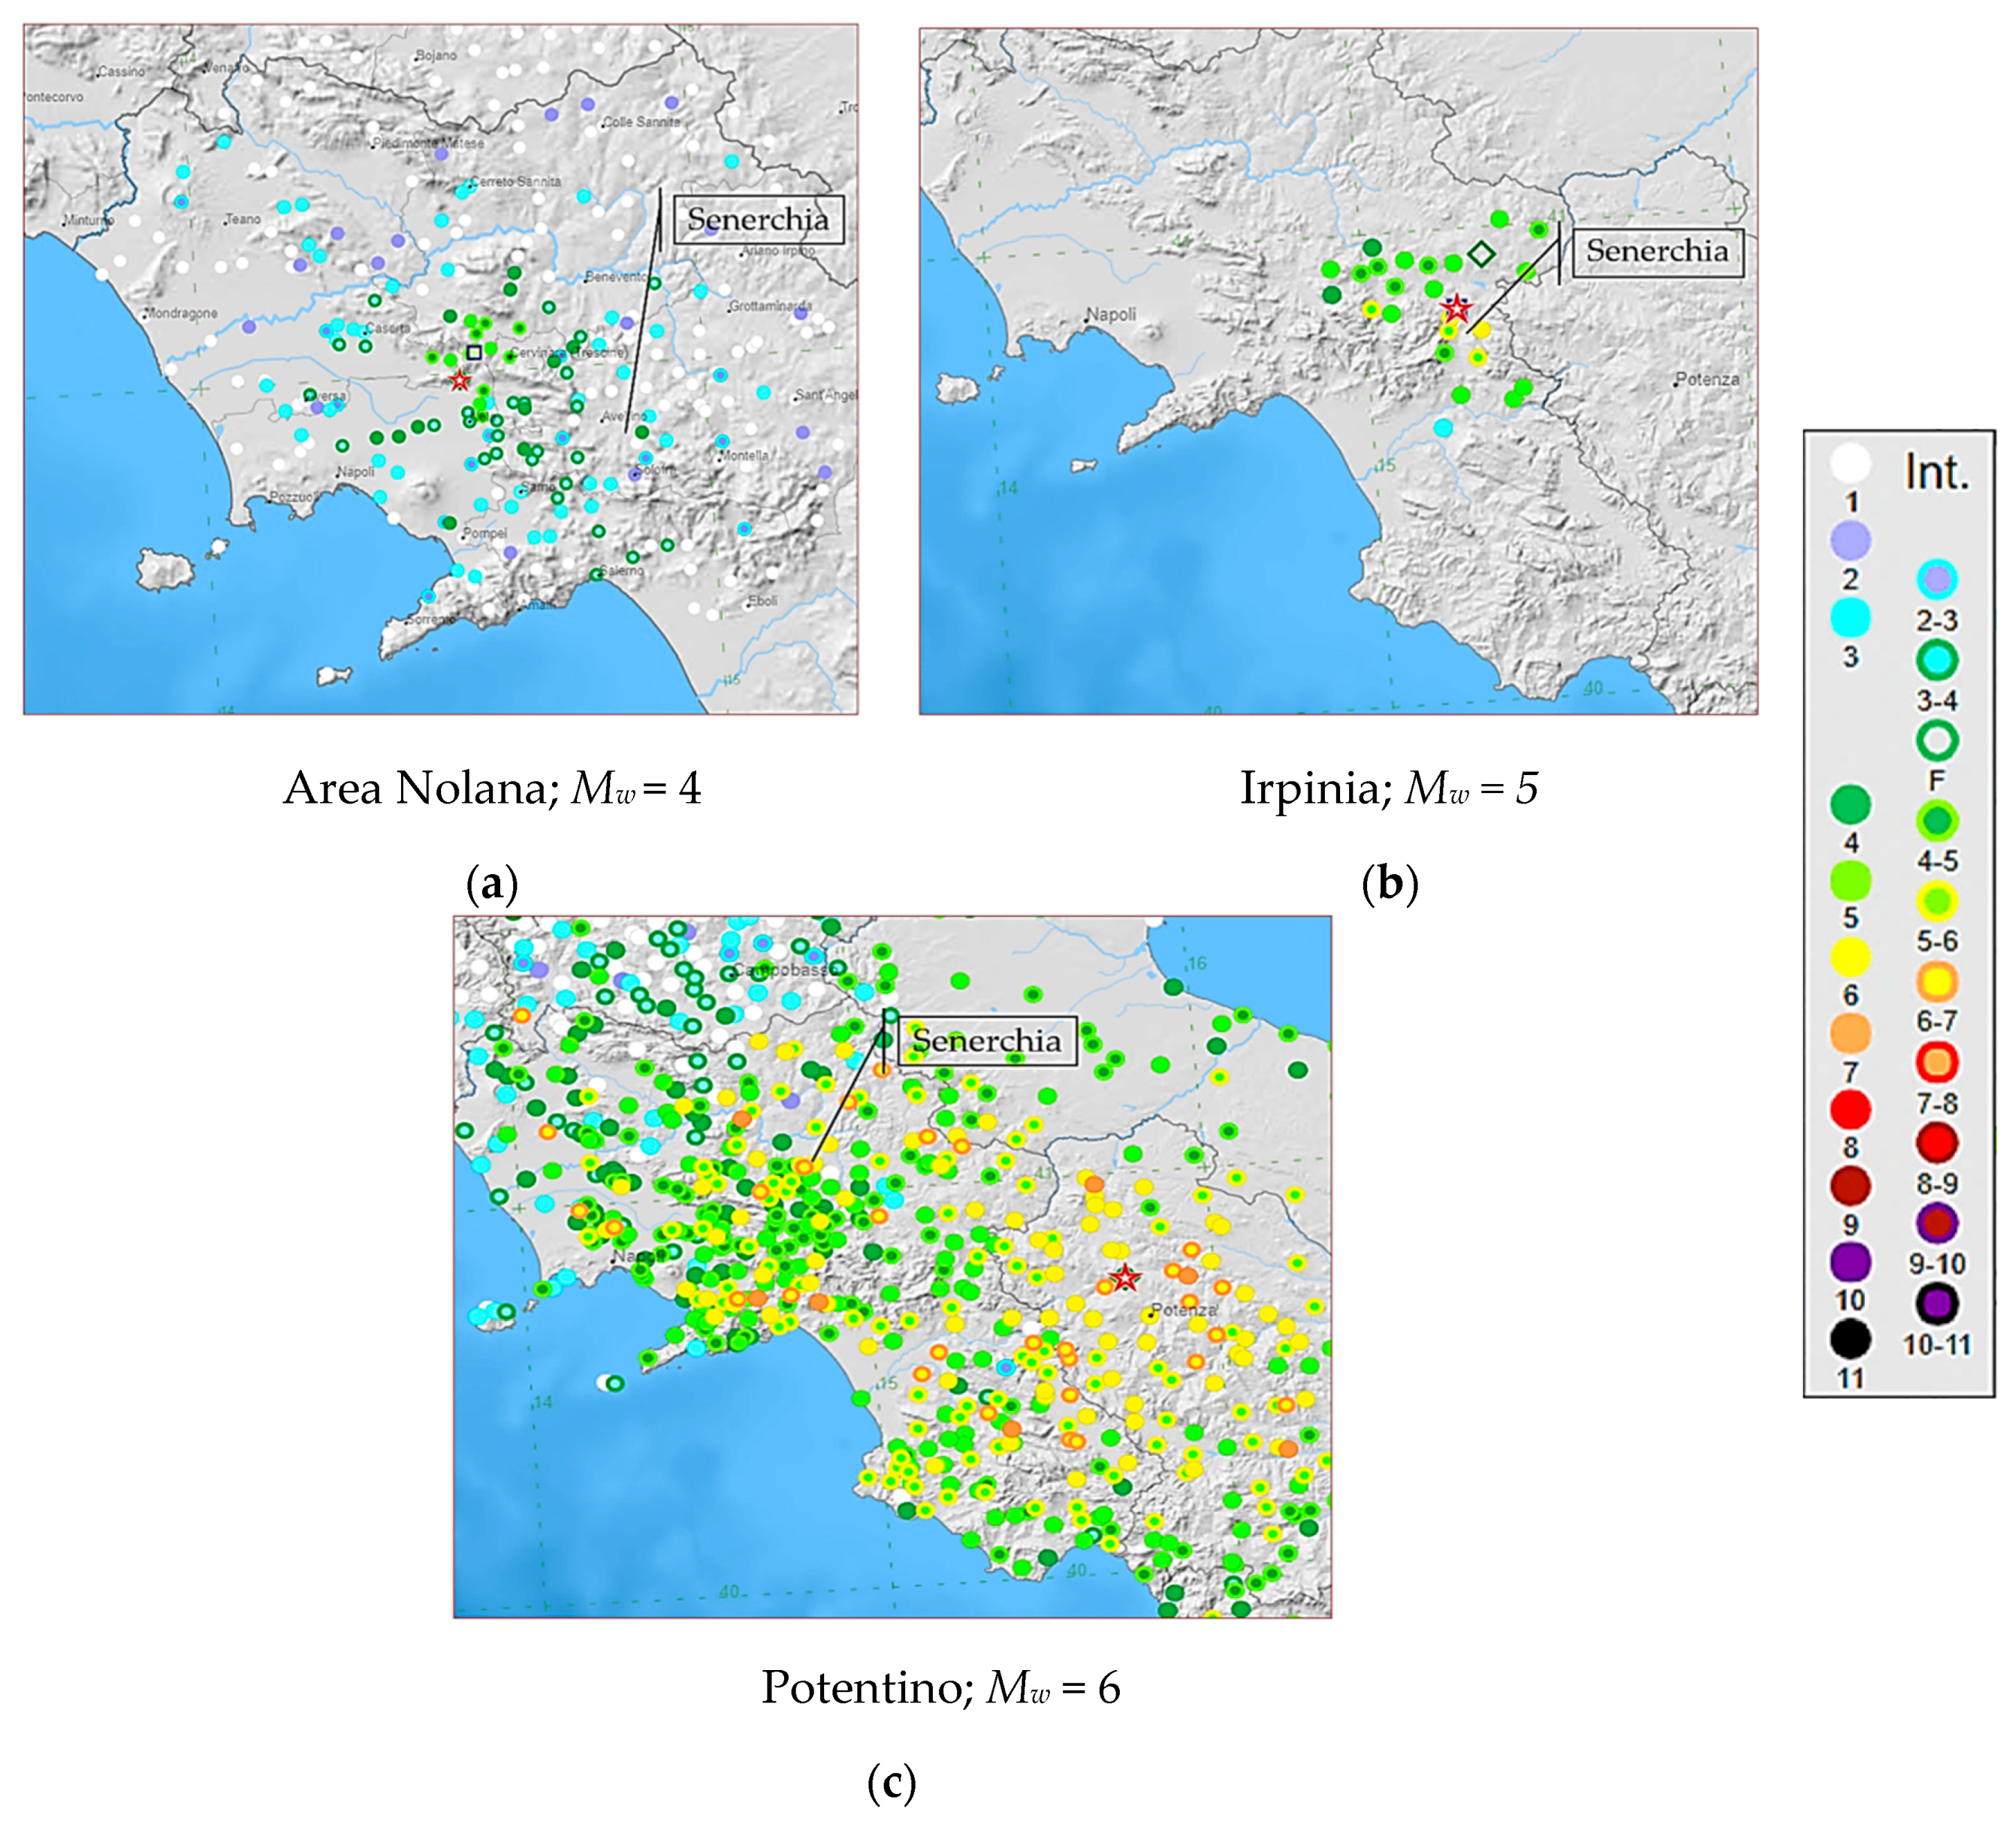
Figure 8.
The seismic impact damage scenarios in the investigated urban area.
Figure 9.
The geology of the study area.

Figure 10.
The identification of the in-situ tests.
Figure 11.
The geomorphologic characterisation of the area of Senerchia.

Figure 12.
The identification and structural macroelement model of a typical urban aggregate.
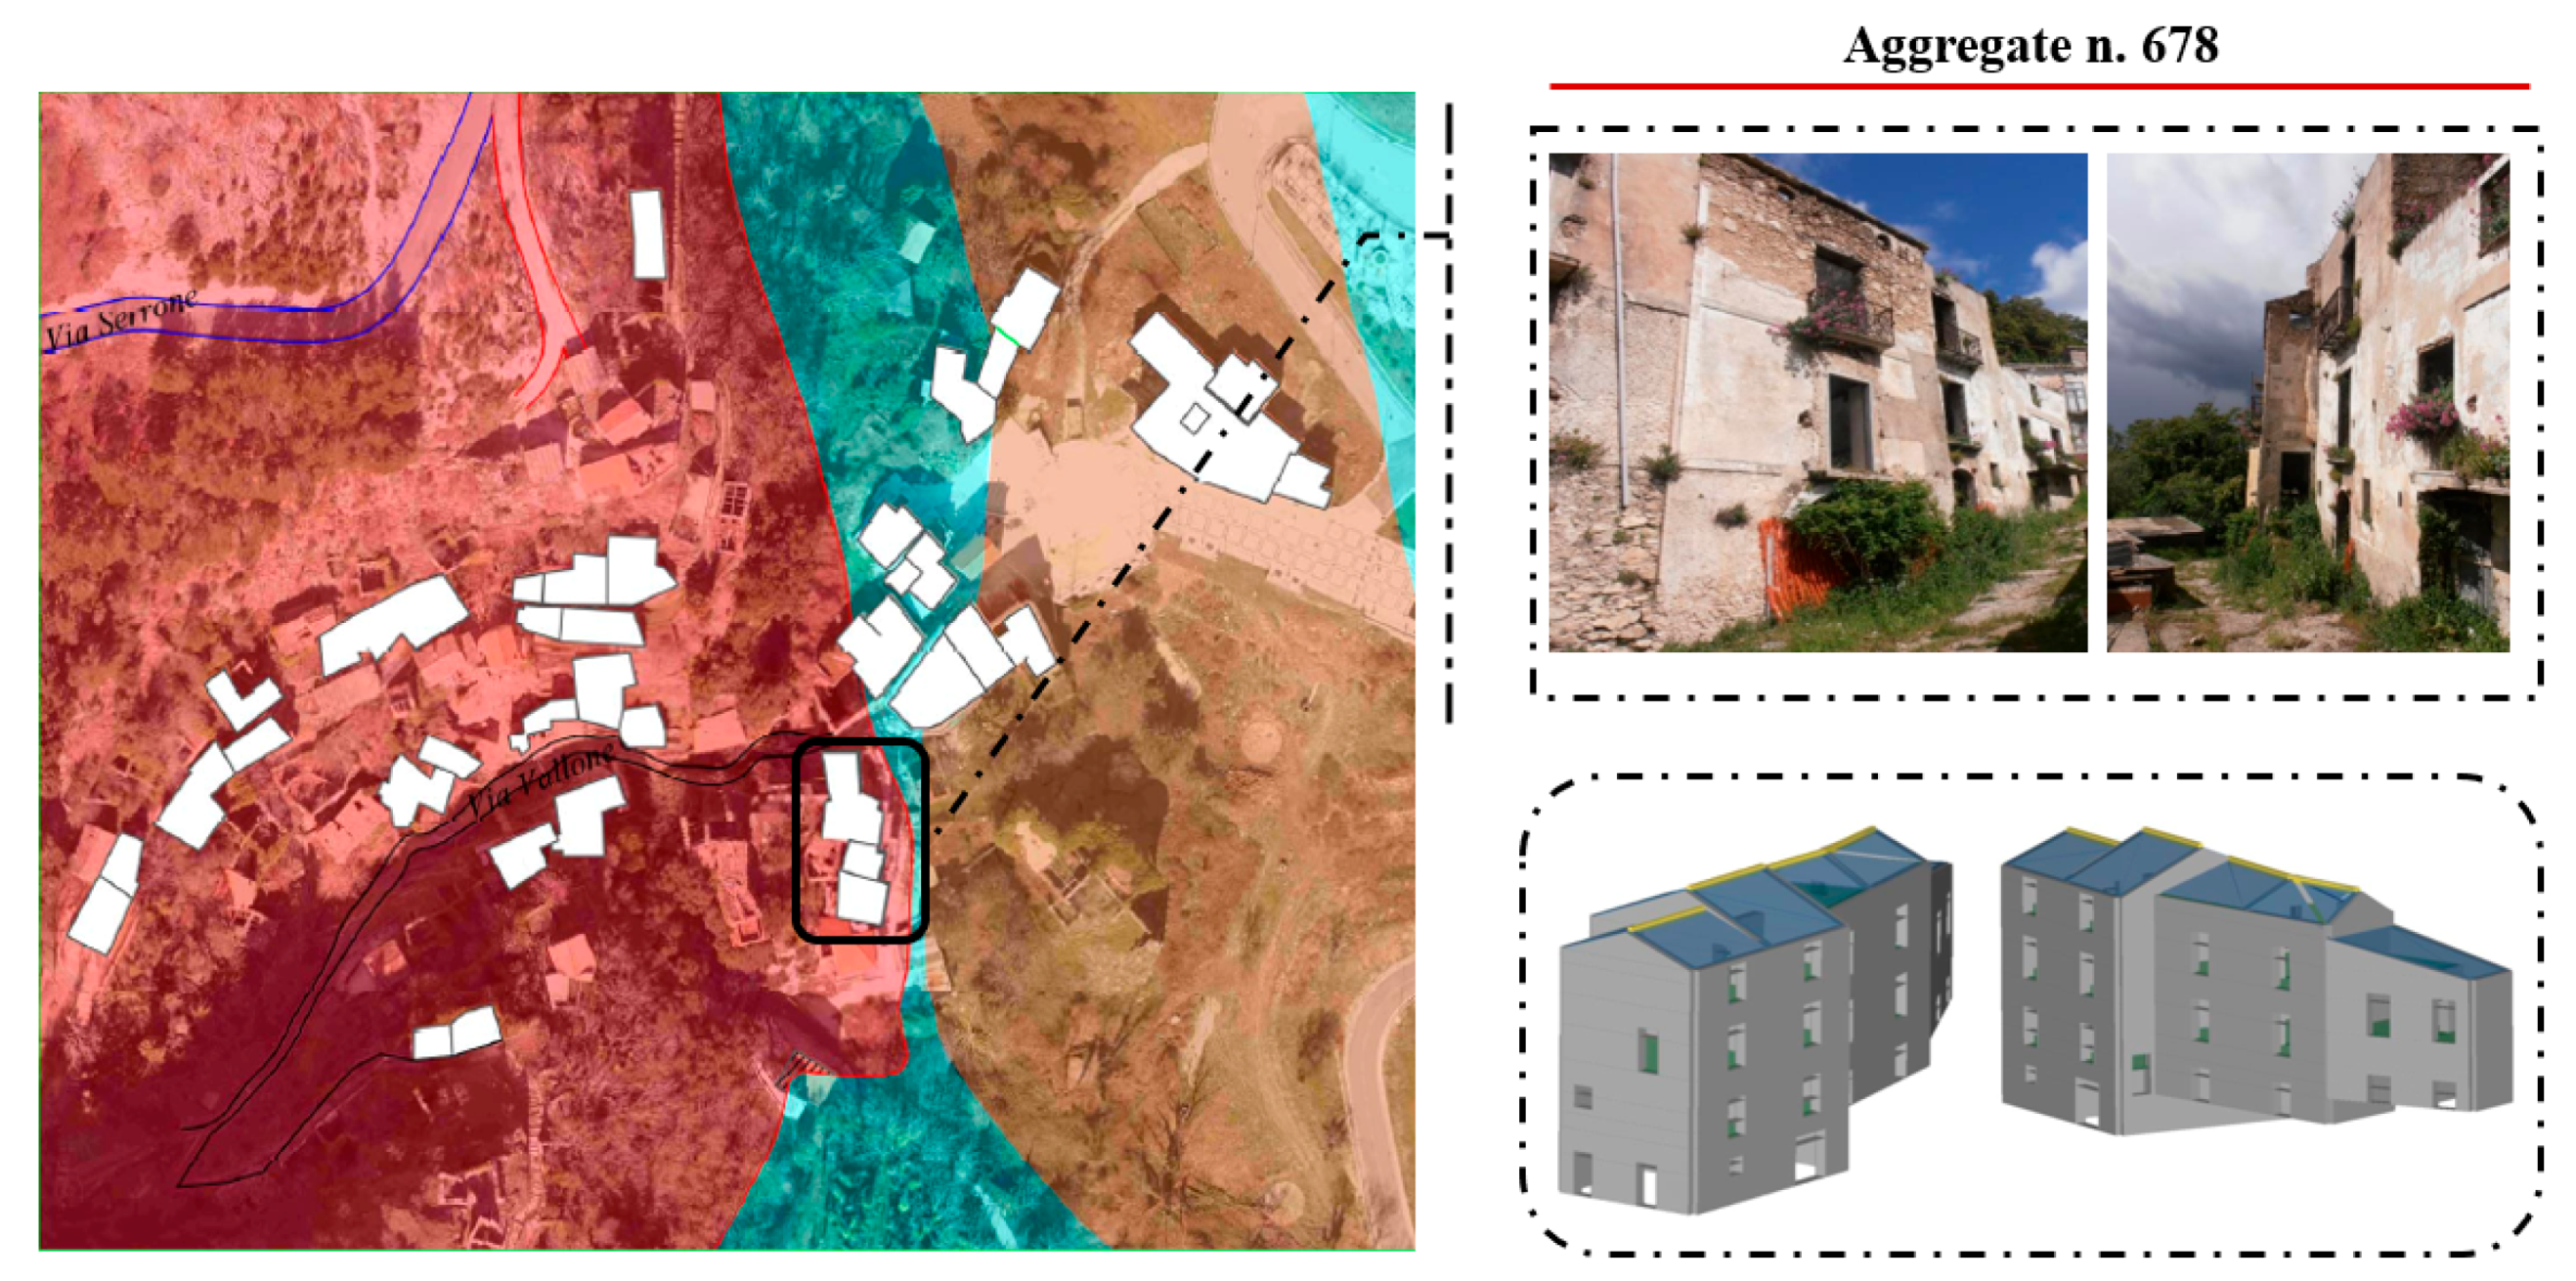
Figure 13.
The new seismic damage scenarios considering the local amplification factor due to the geologic conditions.
Figure 13.
The new seismic damage scenarios considering the local amplification factor due to the geologic conditions.

Figure 14.
The damage distribution considering local seismic amplification effects.
Figure 15.
The damage scenarios with and without local seismic effects: comparison of results for Mw = 5 and R = 5 Km (a) and Mw = 5 and R = 20 Km (b).
Figure 15.
The damage scenarios with and without local seismic effects: comparison of results for Mw = 5 and R = 5 Km (a) and Mw = 5 and R = 20 Km (b).


Table 1.
The vulnerability form for historical building aggregates.
| Parameters | Class Score, Si | Weight, Wi | |||
|---|---|---|---|---|---|
| A | B | C | D | ||
| 1. Organization of vertical structures | 0 | 5 | 20 | 45 | 1.00 |
| 2. Nature of vertical structures | 0 | 5 | 25 | 45 | 0.25 |
| 3. Location of the building and type of foundation | 0 | 5 | 25 | 45 | 0.75 |
| 4. Distribution of plan resisting elements | 0 | 5 | 25 | 45 | 1.50 |
| 5. In-plane regularity | 0 | 5 | 25 | 45 | 0.50 |
| 6. Vertical regularity | 0 | 5 | 25 | 45 | 0.50 |
| 7. Type of floor | 0 | 5 | 15 | 45 | 0.80 |
| 8. Roofing | 0 | 15 | 25 | 45 | 0.75 |
| 9. Details | 0 | 0 | 25 | 45 | 0.25 |
| 10. Physical conditions | 0 | 5 | 25 | 45 | 1.00 |
| 11. Presence of adjacent building with different height | −20 | 0 | 15 | 45 | 1.00 |
| 12. Position of the building in the aggregate | −45 | −25 | −15 | 0 | 1.50 |
| 13. Number of staggered floors | 0 | 15 | 25 | 45 | 0.50 |
| 14. Structural or typological heterogeneity among adjacent S.U. | −15 | −10 | 0 | 45 | 1.20 |
| 15. Percentage difference of opening areas among adjacent facades | −20 | 0 | 25 | 45 | 1.00 |
Table 2.
The correlation between the moment magnitude, Mw, and macroseismic intensity, IEMS-98.
| Magnitude Mw | Macroseismic Intensity IEMS-98 | |||
|---|---|---|---|---|
| R = 5 Km | R = 10 Km | R = 15 Km | R = 20 Km | |
| 4 | VII | VI | V | IV |
| 5 | VIII | VII | VII | VI |
| 6 | X | IX | VIII | VII |
Table 3.
The effect of the soil category variation on the local seismic amplification factor.
| Soil Category | αsoil | fPGA,X | fPGA,Y | |
|---|---|---|---|---|
| X Direction | Y Direction | |||
| A | 0.614 | 0.420 | - | - |
| B | 0.487 | 0.322 | 1.26 | 1.30 |
| C | 0.410 | 0.269 | 1.50 | 1.56 |
| D | 0.361 | 0.214 | 1.70 | 1.96 |
| E | 0.388 | 0.252 | 1.58 | 1.66 |
Table 4.
The effect of the topographic class variation on the local seismic amplification factor.
| Top. Category | αsoil | fPGA,X | fPGA,Y | |
|---|---|---|---|---|
| X Direction | Y Direction | |||
| T1 | 0.614 | 0.420 | - | - |
| T2 | 0.512 | 0.349 | 1.20 | 1.20 |
| T3 | 0.512 | 0.349 | 1.20 | 1.20 |
| T4 | 0.439 | 0.299 | 1.40 | 1.40 |
Table 5.
The global damage increases when considering the local site effects.
| Magnitude Mw | Global Damage Increase (%) | |||
|---|---|---|---|---|
| R = 5 Km | R = 10 Km | R = 15 Km | R = 20 Km | |
| 4 | 5 | 2 | - | - |
| 5 | 50 | 42 | 28 | 14 |
| 6 | - | 20 | 49 | 47 |
© 2019 by the authors. Licensee MDPI, Basel, Switzerland. This article is an open access article distributed under the terms and conditions of the Creative Commons Attribution (CC BY) license (http://creativecommons.org/licenses/by/4.0/).
Share and Cite
MDPI and ACS Style
Chieffo, N.; Formisano, A. Geo-Hazard-Based Approach for the Estimation of Seismic Vulnerability and Damage Scenarios of the Old City of Senerchia (Avellino, Italy). Geosciences 2019, 9, 59. https://doi.org/10.3390/geosciences9020059
AMA Style
Chieffo N, Formisano A. Geo-Hazard-Based Approach for the Estimation of Seismic Vulnerability and Damage Scenarios of the Old City of Senerchia (Avellino, Italy). Geosciences. 2019; 9(2):59. https://doi.org/10.3390/geosciences9020059
Chicago/Turabian StyleChieffo, Nicola, and Antonio Formisano. 2019. "Geo-Hazard-Based Approach for the Estimation of Seismic Vulnerability and Damage Scenarios of the Old City of Senerchia (Avellino, Italy)" Geosciences 9, no. 2: 59. https://doi.org/10.3390/geosciences9020059
Note that from the first issue of 2016, this journal uses article numbers instead of page numbers. See further details here.