Bench-Scale Experiments on Effects of Pipe Flow and Entrapped Air in Soil Layer on Hillslope Landslides

1
Sediment Disaster Prevention Technology Center, Kinki Regional Bureau, MLIT, Ichinono 3027-6, Nachikatsuura-cho, Wakayama Prefecture, Higashimuro-gun 649-5302, Japan
2
National Institute for Land and Infrastructure Management, MLIT, Asahi 1, Ibaraki Prefecture, Tsukuba City 305-0804, Japan
3
CTI Engineering Co., LTD., Onigakubo 1047-27, Ibaraki Prefecture, Tsukuba City 300-2651, Japan
*
Author to whom correspondence should be addressed.
Geosciences 2019, 9(3), 138; https://doi.org/10.3390/geosciences9030138
Submission received: 31 December 2018
/
Revised: 11 March 2019
/
Accepted: 15 March 2019
/
Published: 21 March 2019
(This article belongs to the Special Issue Mountain Landslides: Monitoring, Modeling, and Mitigation)
Abstract
:Soil pipes are commonly found in landslide scarps, and it has been suggested that build-up of pore water pressure due to clogged soil pipes influences landslide initiation. Several researchers have also suggested that entrapped air in the soil layer increases the pore water pressure. We carried out bench-scale model experiments to investigate the influence of soil pipes and entrapped air on the build-up of pore water pressure. We installed a water supply system consisting of an artificial rainfall simulator, and used a water supply tank to supply water to the model slope and artificial pipe. We used two types of artificial pipe: A straight pipe, and a confluence of three pipes. Furthermore, we placed a layer of silica sand on top of the model slope to investigate the effect of entrapped air in the soil layer on the build-up of pore water pressure. Silica sand is finer than the sand that we used for the bulk of the model slope. Our results indicate that, although artificial pipes decrease the pore water pressure when the amount of water supplied was smaller than the pipe drainage capacity, the pore water pressure increased when the water supply was too large for the artificial pipe to drain. In particular, the confluence of pipes increased the pore water pressure because the water supply exceeded the drainage capacity. The results also indicate that entrapped air increases the pore water pressure in the area with relatively low drainage capacity, too. Based on these results, we found that although soil pipes can drain a certain amount of water from a soil layer, they can also increase the pore water pressure, and destabilize slopes. Furthermore, entrapped air enhances the trend that the pore water pressure can increase in the area with relatively low drainage capacity, as pore water pressure increases when too much water is supplied, and the artificial pipe cannot drain all of it.
1. Introduction
It has been observed that soil pipes are often located at the sites of landslides [1,2,3,4]. Based on field observations at the sites of landslides in previous studies, it has been suggested that there is a relationship between the presence of soil pipes and the incidence of landslides. Moreover, Uchida et al. [5] reported that soil pipes have been observed in natural vegetated hillslopes with a variety of soil types, such as brown forest soil, clay loam decomposed granite, silt and loam soil, peaty podzol, etc. In particular, it has been pointed out that soil pipes influence hillslope hydrological processes, such as runoff from soil pipe outlets [4,6]. For example, Kitahara [4] and Jones [6] indicated that the amount of pipe flow plays a large role in the runoff from the side hillslopes on river discharge, thus influencing river flow in first order streams. Numerical simulations have been carried out to elucidate the roles of soil pipes in landslides and the hydrological processes of hillslopes. Kosugi et al. [7] showed that the pore water pressure increases with the length of clogged soil pipes. Tsutsumi et al. [8] carried out numerical simulations to verify the effect of soil pipe roughness on the hydrological features of soil pipes using finite element methods (FEMs), and showed that locations where the pipe is very rough affect the flow through the soil pipe and piezometric head. Moreover, Uchida and Mizuyama [9] carried out field observations and numerical simulations, and concluded that the buildup of pore water pressure and decreasing slope safety factor caused by the clogging of the soil pipes supports the hypothesis that soil pipes affect landslides induced by peak rainfall.
However, there are several limitations to understanding the influence of soil pipes on landslides and hydrological processes through only the use of field investigations and numerical simulations. In field observations, it can be very difficult to comprehend the hydraulic conditions during the landslide process such as the build-up of pore water pressure using piezometers, owing to a lack of prior spatial information with regard to its occurrence. In the numerical simulation, it is also quite difficult to estimate the parameters such as hydraulic conductivity or flow discharge of the soil pipes in hill slopes. Hence, model experiments have been carried out to clarify the influence of soil pipes on runoff generation during and after rainfall, fluctuations in groundwater levels, and buildup of pore water pressure on landslide occurrence [1,10,11,12,13,14,15]. Pierson [1] found that the pore water pressure is higher when the end of a pipe is closed. Tada et al. [10] carried out model experiments with a valve representing a clog, and found that although pipes stabilize model slopes when their lower ends are open to air, soil pipes destabilize model slopes when they become clogged. Similar results have been reported in other experiments [1,11,15].
Recently, Yamasaki et al. [16] discussed the influence of the air in the soil pipe on the water flow in a closed pipe. They also indicated that the soil pipe flow occurs only when soil air can escape freely from the soil pipe to the atmosphere, and air entrapment in the soil pipes may be affected by soil water and air flow in the soil matrix around the soil pipe. Moreover, several researchers argued about the effects of entrapped air in the soil layer on hydrological processes (e.g., [16,17,18,19,20,21]). These studies revealed that the entrapped air contributed rapid increase of pore water pressure and enhanced hillslope discharge through field observation and laboratory experiments.
So, it has been considered that the entrapped pore air in the soil layer could induce slope instability, because of a quick and large groundwater table increase [19,20,21]. For example, Liu et al. [21] pointed that pore air pressure by rainfall infiltration can increase sharply at difference locations and that the pore air pressure can also cause a rapid decrease in the slope safety factor by numerical simulation. They also indicated that pore air pressure throughout the whole unsaturated zone has the same value, which means that the air pressure could spread quickly to the whole sample by laboratory experiment.
Thus, to understand the influence of soil pipe on the build-up of the pore water pressure, we need to discuss the effects of soil pipe and entrapped air together on the build-up of the pore water pressure.
However, it is difficult to confirm whether previous model experiments perfectly describe the features of soil pipes that have been observed in field research. Hence, we focus on three main factors in this paper. The first factor is the form of the soil pipe. Most previous model experiments were carried out with straight pipes. However, soil pipes in mountain slopes branch and merge repeatedly [4,22,23]. The second factor is whether the flow in the soil pipe is under pressure. To understand the effects of pipes on the build-up of pore water pressure, we need to consider the pressured flow. There has been one study showing that the pressure in a pipe flow depends on the pipe drainage capacity [22]. Moreover, it has been pointed out that pipe flow discharge depends on the water content of the surrounding soil and upstream of the pipe [24,25]. However, previous experiments were carried out with model slopes that were up to one to two metres in length, and the water supply system consisted of an artificial rainfall simulator, or supplied a fixed amount of water to the top of the model slope. Hence, it is difficult to determine whether the water content upstream of the soil pipe affects the flow in the soil pipe or the build-up of pore water pressure. The third factor to consider is the entrapped air. Previous reports have noted that entrapped air in the soil layer can increase the pore water pressure [16,17,18,19,20,21]. As Yamasaki et al. [16] noted, soil pipes usually contain relatively large voids. However, there have been few experiments on the interactions between the build-up of pore water pressure between soil pipes and entrapped air.
Based on the above, we tested cases with branching and merging pipes so that we could investigate the influence of the confluence of pipes. We also installed a tank to supply water to the pipe and considered the influence of the pressured flow through the pipe on the build-up of pore water pressure. Furthermore, we used finer sand on the model slope to investigate the influence of air trapped in the soil on the build-up of pore water pressure.
2. Materials and Methods
We constructed experimental equipment to process acryl glass and prepared material to use in the experimental equipment and water supply system. We ensured that our setup, which contained two tanks, yielded results consistent with those obtained from an artificial rainfall simulator. In this section, we explain the installation of the equipment, sensors, and measuring system.
2.1. Equipment of Model Experiment and Measurement System
2.1.1. Model Slope
We set up slopes at two different angles (25 and 30 degrees). The 25-degree slope was 162.3-cm long, 30-cm wide, and had a soil layer depth of 20 cm. The 30-degree slope was 158.3-cm long, 30-cm wide, and had a soil layer depth of 20 cm (Figure 1). The model slopes both comprised four layers. Each layer was compacted to make it as even as possible. Here, we compacted each soil layer 40 times to a thickness of 5 cm in each case. To prevent the soil layer from sliding, we affixed the sand which was used in all experiments to the side walls of the model slope and crosspieces were attached to the bottom of the model slope.
2.1.2. Materials
The particle size distribution of the dry experimental material, which we assessed, using a sieve, is shown in Figure 2. We collected samples from the remaining material and measured saturated hydraulic conductivity (4.53 × 10⁻³ cm/s). We measured cohesion (0.03 kgf /cm2) and peak internal friction angle (35.9°) using a triaxial compression test.
We used the same material in all cases. We put the material in a mesh bag after the experiment, and used gravity drainage to dehydrate the sand for 16-17 hours. We measured the effective porosity of the initial condition sand. We set the sand box (34 cm × 47 cm × 20 cm) using the same compaction method and measured effective porosity. The effective porosity is 18%. We checked effects of model slope setting on experimental results in the Section 2.2.
We placed 3 cm of silica sand on the surface of the model slope in Cases 4–6 so that we could assess the effects of entrapped air on landslide initiation. The particle size of silica sand is 0.003–0.3 mm. Hence, silica sand is much finer than the material used for the model slope. Furthermore, we carried out an experiment to test how effectively silica sand can entrap air in the soil layer. Figure 3 shows a schematic of the equipment used for this experiment, in which we tested two cases. In one case, we used the material sand pile and placed silica sand on top. In the other case, we only used the material sand pile. Acrylic cylinders were used for soil piles. Diameter and height of sand piles are 9 and 20 cm. The bottom of the sand pile was connected with a steel mesh to move air and water, and the top of the sand pile was free. Then, we put these sand piles in the water tank. Water level in the water tank was raised to the same level as the sand pile surface. Then, we monitored air flow rate from the sand piles using the flowmeter for air (FD-A1 by KEYENCE). Figure 4 shows the result of this experiment. In no silica sand pile, the air flow rate was 0.5 to 1.4 ml/s. And total discharge air volume in 600 s was around 3160 mL. In silica sand case, the air flow rate was almost zero until 200 s since the start of experiment. Then, the air flow rate increased, but the air flow rate was smaller than that of no silica case. Total air flow volume in 600 s was 2560 ml and 81% of no silica case. This indicates that the 600 mL of air might be entrapped in the sand pile in the silica sand case. Based on these results, we confirmed that silica sand can entrap air in the soil layer.
2.1.3. Artificial Pipe
To evaluate the influence of the soil pipe on the buildup of pore water pressure, it is necessary to investigate both the supply and drainage capabilities of the pipe. Then we perforated the artificial pipe so that it could be supplied with and drain water, and we opened the outlet of the artificial pipe. Here, we selected the density of the holes based on previous studies [10,11,12,13,14,15] and a preliminary experiment. We carried out the preliminary experiment to investigate appropriate geometry and density of holes to allow the artificial pipe to supply water to, and drain water from the model slope. As a result we set the size of the holes to 4 mm and the density to 0.49 holes cm−2. These values are consistent with the values used in previous studies. We made Φ = 4-mm holes every 2 cm in the longitudinal direction, and every 1 cm in the circumferential direction on the pipe. We used an artificial pipe made of vinyl chloride. The inner diameter of the vinyl chloride pipe was 13 mm. According to the results of our experiments to evaluate flow through the pipe, the drainage ability of the pipe was 0.048 ℓ/s when the supplied water level was 10 cm and 0.088 ℓ/s when the supplied water level was 20 cm in the case of the pipe described above on the 25-degree model slope. In this experiment, although we perforated the artificial pipe with 4-mm holes, we did not observe any soil dropping into the artificial pipe during the experiments.
We also used confluent pipes (hereafter “confluence pipe”). We connected two pipes to a straight pipe. The two side pipes were 7.5 cm from the side walls and curved 10 cm at upstream of the confluence to the central pipe (Figure 1). The distance of confluence point was 80 cm from the upper side of the central pipe.
The artificial pipe was installed 3.4 cm above, and ran parallel to the bottom of the model slope. We installed the artificial pipes prior to constructing the model slope.
2.1.4. Water Supply System
The water supply system consisted of an artificial rainfall simulator and a water supply tank, which plays a role in creating subsurface flow. We attached a spray nozzle so that the artificial rainfall simulator could create a mist, thus preventing raindrops from impacting the soil layer. We used this type of artificial rainfall simulator in all cases. The water supply tank consisted of a lower tank and a higher tank. The lower tank was connected to the model slope via a nonwoven fabric. The higher tank was connected directly to the artificial pipe. In Cases 2 and 5, the central pipe was connected to the higher tank (Figure 1). We supplied water to the equipment from a water pool using a pump (Figure 1).
2.1.5. Water Supply Conditions
The artificial rainfall simulator can produce 130 mm/h of rainfall (0.0087 ℓ/s).
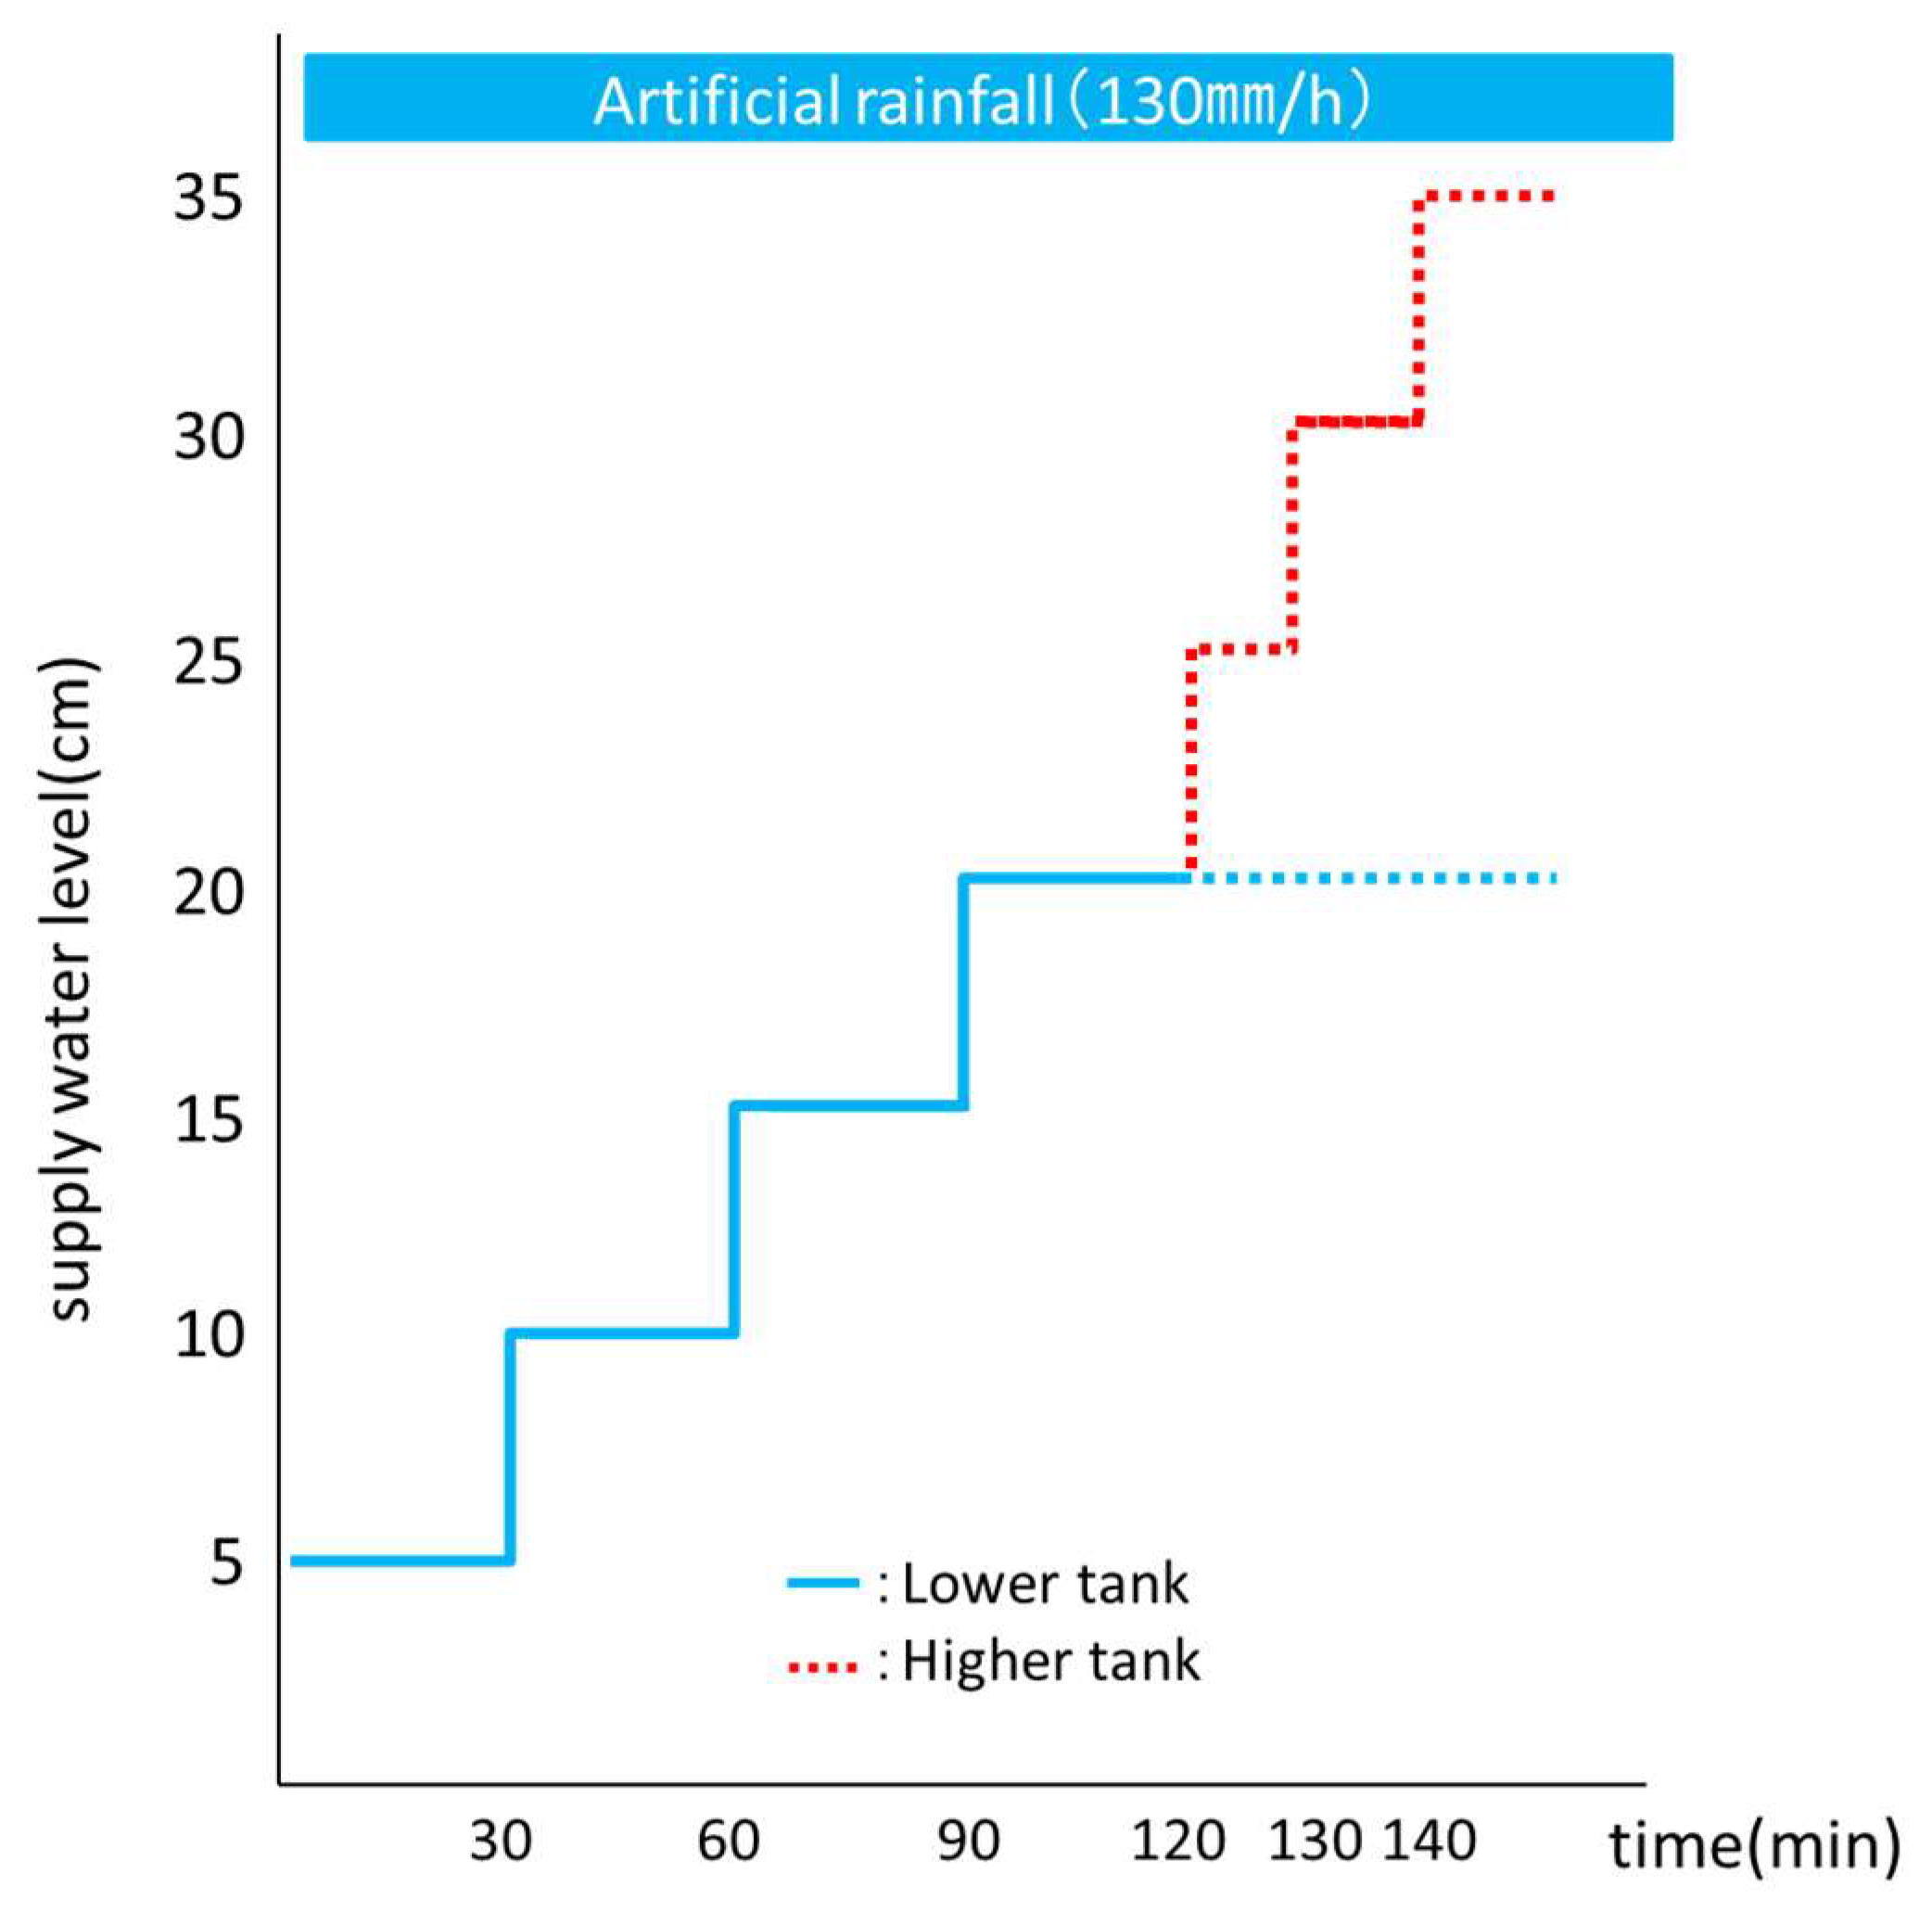
When we supplied water from the lower tank and the higher tank, the water levels corresponded to each other until the water supply level reached 20 cm. As shown in Figure 5, we raised the water levels of both the lower and higher tanks by 5 cm at a time until it reached 20 cm, and raised the water level of only the higher tank by 5 cm at a time beyond 20 cm. The interval for raising the water level was set to 30 min, until the level reached 20 cm, then to 10 min as it increased beyond 20 cm. Each experiment finished when a landslide occurred, or the silica sand on the surface of the model slope flowed away. However, Case 0 was concluded 120 min after the water supply level reached 20 cm which was the maximum level in this case because no landslide occurred.
2.1.6. Measurement System
We measured the pore water pressure manually every 5 min using u-shaped manometers. These sensors were placed at the center of the model slope in the transverse section (Figure 1). We measured the height of the water level in manometers from the bottom of the model slope. We assigned two people to take the measurements. While one person read the value of the manometer, the other person recorded the reading. We took measurements every 5 min, as the minimum measurement interval of this system is 5 min. Here, we could not record the results from every manometer simultaneously, so instead we recorded the manometer values one by one, from the top to the bottom of the slope. Hence, we took these values as our data at the water level. Moreover, we recorded video footage of the experiment to observe the displacement of the soil layer. We also used this video footage to measure the pore water pressure according to the manometer just before the landslide occurred. Furthermore, after the experiment, if a landslide occurred, we measured the depth of the landslide and sketched its form.
2.2. Experiment Cases
We now describe the experimental cases. The conditions of the soil layer were the same in each case. We repeated each experiment two times to verify its repeatability.
- Case 0: No pipe. (25-degree slope)
- Case 1: Straight pipe. (25-degree slope)
- Case 2: Confluence pipe. (25-degree slope)
- Case 3: Straight pipe. (30-degree slope)
- Case 4: Straight pipe with silica sand on surface. (25-degree slope)
- Case 5: Confluence pipe with silica sand on surface. (25-degree slope)
- Case 6: Straight pipe with silica sand on surface. (30-degree slope)
We checked the effects of the model slope setting based on the experimental results. We conducted this two times (Runs 1 and 2) for the same cases (Cases 1 and 4). Figure 6 shows the result of this experiment. We found that the differences in pore water pressure at the same point under same water supply condition were generally from 0.1 to 4.3 cm (from 15 to 72%), although a few manometers showed relatively large differences (e.g., c and g in Case 4). Thus, hereafter we conducted data from Run 1 for each case.
3. Results
3.1. Water Supply Level and Time of Landslide
Table 1 shows the water supply level at which landslides occurred, and the time required for a landslide to occur after the final rise in the supplied water level. In Cases 0, 1, and 4, no landslides occurred until the supplied water level reached 20 cm. In Case 1, a landslide occurred when the water supply level of the lower tank was 20 cm and that of the higher tank was 25 cm. Although no landslide occurred in Case 4, the surface of the model slope flowed away, and the surface erosion formed a gully when the water supply level reached 20 cm. This process finished after 96 min and 42 s. Landslides occurred in Cases 2, 3 and 5 when the water supply level reached 10 cm, and in Case 6 when the water supply level reached 15 cm.
In Cases 1 and 6, landslides occurred 24 and 27 s after the final rise in supplied water level. In Cases 2 and 5, landslides occurred 54 and 48 s after the final rise in the supplied water level. In these cases, landslides occurred relatively soon after the water supply level was raised. In Case 3, a landslide occurred 11 min and 42 s after we raised the water level for the final time. In this case, the landslide occurred a relatively long time after we raised the water supply level.
3.2. Fluctuations in Pore Water Pressure and Landslides
Figure 7 shows the fluctuation in the distribution of the pore water pressure and the shape of the landslide in each case. The final manometer measurements were taken at different times, as the landslides occurred at different times. We also indicated the pressure ratio obtained by dividing the pore water pressure at the time with the pore water pressure at the final time. Figure 8 shows the relationship between the values of the pore water pressure in each case. We classified each landslide in Table 1, in terms of the form of the landslide and displacement before the landslide.
3.2.1. Case 0 (No Pipe, 25 Degree)
The pore water pressure was between 10.6 and 16.6 cm (pressure ratio: between 0.6 and 1.0) when the water supply level from the lower and higher tanks, respectively, was 5 cm (Figure 7a). These values were higher than those in other cases. The pore water pressure then increased to between 11.6 and 16.8 cm (pressure ratio: Between 0.7 and 1.0) when the water supply reached 10 cm, between 11.7 and 16.8 cm (pressure ratio: Between 0.9 and 1.0) when the water supply reached 15 cm, and between 10.6 and 16.8 cm (pressure ratio: 1.0) when the water supply reached 20 cm. The pore water pressure did not change significantly until the water supply level reached 20 cm. During the experiment, although no displacement was observed, part of the flat area at the lower end of the slope began to flow.
3.2.2. Case 1 (Straight Pipe, 25 Degree)
In Case 1, the pore water pressure was between 1.3 and 5.0 cm (pressure ratio: Between 0.2 and 0.4) when the water supply level reached 5 cm, and between 1.4 and 13.0 cm (pressure ratio: Between 0.2 and 0.8) when the water supply level reached 10 cm (Figure 7b). The pore water pressure continued to increase as the water supply level was raised to 15 cm, then 20 cm.
In Case 1, although the flat area at the lower end of the slope flowed partly when the water supply level was 20 cm, no landslide occurred while water was being supplied from either the lower of higher tank. However, a landslide occurred 24 s after we raised the water level to 25 cm using the higher tank, which was directly connected to the center pipe. The surface rupture of the landslide was almost planar, and the maximum depth was 16.3 cm. The average depth was 14.1 cm (Figure 7b).
The pore water pressure was between 7.8 and 17.1 cm just before the landslide occurred and the highest pressure was recorded at manometer e. Although the increase in pore water pressure at the upper part of the model slope (manometers a, b) was relatively low, the increase was significantly higher at the middle of the model slope (manometers e–i) than at the lower end of the model slope.
3.2.3. Case 2 (Confluence Pipe, 25 Degree)
In Case 2, the pore water pressure was between 3.8 and 13.5 cm (pressure ratio: Between 0.7 and 1.1) when the water supply level was 5 cm (Figure 7c). Manometers e and f recorded pressures of 13.5 and 11.8 cm (pressure ratio: 0.9 and 1.0), respectively. These manometers were located downstream from the confluence of the pipes. A landslide occurred 54 s after we raised the water supply level to 10 cm. The form of the landslide resembled an arc. The depth of the landslide was 17.5 cm in the area where it was deepest (Figure 7c), between manometers c and d. The average depth was 10.9 cm.
The pore water pressure was between 5.7 and 15.0 cm just before the landslide occurred. The pore water pressure was high near the confluence of pipes, similar to the stage where the water supply level was 5 cm, and was recorded as 11.2 cm at manometer e and 15.0 cm at manometer f.
3.2.4. Case 3 (Straight Pipe, 30 Degree)
In Case 3, the pore water pressure was between 1.3 and 5.2 cm (pressure ratio: Between 0.1 and 0.7) when the water supply level was 5 cm (Figure 7d). At this time manometer h, which was near the bottom of the slope, indicated the highest pressure. A landslide occurred just after we raised the water supply level to 10 cm. The pore water pressure was between 4.6 and 15.5 cm when the water supply level was 10 cm, and the highest value was recorded at manometer d. The pore water pressure increased throughout the soil layer as the water supply level rose, particularly at the lower half of the hillslope (manometers d–f).
In Case 3, no significant displacement occurred when the water supply level was 5 cm. Displacement-like subsidence occurred after the water supply level was raised to 10 cm (Figure 7d). A landslide occurred 41 min 42 s after the start of the experiment. At that time, the water supply level was 10 cm. The geometry of the slip surface was generally planar. The maximum depth was 16.2 cm and average depth was 10.9 cm (Figure 7d).
3.2.5. Case 4 (Straight Pipe with Silica Sand, 25 Degree)
In Case 4, although the pore water pressure was low throughout the model slope, at between 2.8 and 5.8 cm (pressure ratio: between 0.2 and 0.4) when the water supply level was 5 cm (Figure 7e), it was still higher than in Case 1, i.e., the pipe structure was the same, when the water supply level was 5 cm. The pore water pressure increased to 2.6 and 14.5 cm (pressure ratio: Between 0.4 and 0.9) when the water supply level was 10 cm and to 4.0 and 16.2 cm (pressure ratio: Between 0.6 and 1.0) when the water supply level was 15 cm. At this time, the pore water pressure was between 7.0 and 17.0 cm, and the highest value was recorded at manometer i (Figure 7e). In Case 4, the lower part of the model slope flowed out when the water supply level reached 10 cm. The experiment finished when the water supply level was 20 cm, as the silica sand on the surface of the model slope flowed away (eroded).
3.2.6. Case 5 (Confluence Pipe with Silica Sand)
In Case 5, the pore water pressure was between 2.9 and 13.3 cm (pressure ratio: Between 0.4 and 1.0) when the water supply level was 5 cm (Figure 7f). The pore water pressure was higher in the area around the confluence of the pipes than in other areas. For example, manometers e and f indicated values of 13.2 and 8.0 cm, respectively. This trend was similar to that observed in Case 2. On the other hand, the pore water pressure was high, not only at the confluence of pipes, but also in the upper part of the model slope. Specifically, the readings from manometers c and d were 10.5 and 9.6 cm, respectively.
A landslide occurred just after we raised the water supply level to 10 cm. At this time, the pore water pressure was between 6.5 and 14.4 cm (Figure 7e). In Case 5, a crack occurred between manometers a and b. Furthermore, the surface towards the bottom of the model slope subsided by approximately 1 cm when the water supply level was 5 cm. Then, a landslide occurred after we raised the water supply level to 10 cm. The form of the landslide was circular. The maximum depth was 15.9 cm and the average depth was 7.8 cm (Figure 7e).
3.2.7. Case 6 (Single Pipe with Silica Sand, 30 Degree)
In Case 6, the pore water pressure was between 2.5 and 6.5 cm (pressure ratio: Between 0.2 and 0.7) when the water supply level was 5 cm (Figure 7g). While the pore water pressure was high at the bottom of the slope, it was relatively low in the middle of the model slope, ranging from 3.0 to 6.5 cm (pressure ratio: Between 0.2 and 0.7). The pore water pressure was between 5.7 and 7.7 cm (pressure ratio: Between 0.6 and 0.8) when the water supply level reached 10 cm. A landslide occurred just after we raised the water supply level to 15 cm. At this time, the pore water pressure was between 7.0 and 11.0 cm (Figure 7g). The pore water pressure was relatively high in the middle of the model slope and manometer e read 11.0 cm. This trend differs from that observed when the water supply level was less than 10 cm. In Case 6, no displacement occurred until the water supply level reached 10 cm, and then appeared to stabilize. A landslide occurred across the entire model slope just after we raised the water level to 15 cm. The form of the landslide was generally planar. The maximum depth was 17.4 cm and the average depth was 14.6 cm. The depth of the landslide was deeper than in Case 3.
4. Discussion
4.1. Influence of Pipes and Entrapped Air on Buildup of Pore Water Pressure
In this experiment, we observed that the drainage capacity of soil pipes varied between the flat area below the slope and the confluence of pipes. Hence, the soil pipe drainage capacity decreased at the bottom of the slope, where the longitudinal gradient of the soil pipes decreased significantly. In Case 1, we used the higher tank. The results obtained from manometers f to h in Case 1, and from manometers g and h in Case 3, suggested that the drainage capacity of the soil pipe was lower in the flat area than halfway down the slope. Hence, the pore water pressure increased more readily in the lower part of the hillslope. Moreover, for the confluence pipe, total drainage capacity became small at the confluence due to a decrease of number of soil pipes. Although the area above the confluence of pipes have a high drainage capacity and decrease pore water pressure, the pore water pressure can become high in this area, as seen in the results of manometers e and f in Case 2 and manometers c to f in Case 5. This trend is especially clear when the water supply level is high as seen in the results of manometer e in Case 2 when the water supply level was 10 cm, and manometers c to e in Case 5 when the water supply level was 10 cm. From these results, it can be thought that the flow in the pipe was pressured by the change of longitudinal gradient and the junction of pipe. Consequently, the pore water pressure in the soil was affected by the high pressure in the pipe.
Based on the results obtained from manometers e to i when using the higher tank to pressure the flow in the pipe, the result imply that the pore water pressure can be directly influenced by the flow from the upper hillslope through the soil pipe, apart from at specific locations influenced by the pipes, even though the pore water pressure in the area immediately upstream of the slope from a given location did not change. Hence, the pressure of the flow in the pipe, enhanced the buildup of pore water pressure.
It has been observed that when the end of the soil pipe is open to the air, the pore water pressure is lower than when there is no soil pipe [1,7,10,11,13,15]. In contrast, the pore water pressure increases when the pipes get clogged, or the ends of the pipes are not open to the air. In these cases, the pore water pressure is higher than in the case without pipes for the same water supply level [7,10,13,15]. In this experiment, we found that a decrease in the longitudinal gradient of the artificial pipe, and that a confluence of soil pipes has a similar effect to clogged soil pipes. We conjecture that this is because the effect of the area with a relatively low drainage capacity can propagate increases in the pore water pressure.
Moreover, we carried out experiments with slopes with gradients of 25 and 30 degrees, and we observed that it was easier to increase the pore water pressure in the cases with slopes of 30 degrees rather than 25 degrees. Although there are several possible explanations about the processes of this result, we consider that the longitudinal change of drainage capacity of soil pipe should be a key factor of this result. The longitudinal change of drainage capacity of soil pipe in 30 degree slope was larger than that of 25 degree slope. Thus, pore water pressure easily increased in a 30 degree slope, because the flow in the pipe was easily pressured by a relatively large change of drainage capacity of the soil pipe. In the downstream flat area (manometers f to i) in Case 4, and near the confluence of pipes (manometers c to e) in Case 5, the pore water pressure increased more than in other areas. It has been suggested that when the surface of the soil layer is saturated, the pore water pressure is higher than under unsaturated conditions due to the entrapped air [16,17,18,19,20,21]. There is a possibility that entrapped air increases the pore water pressure, where we observed increases in the pore water pressure in Cases 4, 5, and 6, which had poor permeability due to the layer of silica sand on the surface of the model slope. The effect of the entrapped air was clear in areas with relatively low drainage capability. This may be due to the fact that the air in the soil layer is compressed, which increases the pore water pressure. In turn, this increases the pressure in the pipe and the amount of water entering the soil layer from the pipe.
It was easier to increase the pore water pressure in the cases with the confluence pipe, than in the cases with the straight pipe. It has been mentioned previously that soil pipes often have merges and branches. Based on these observations, we believe that, in addition to clogs in pipes, it is necessary to analyze the safety of hillslopes based on the confluence of pipes. However, it is also necessary to investigate the influence of confluence of pipes on the buildup of pore water pressure in the field. We do not have enough data to discuss these effects, so a detailed field investigation is necessary.
4.2. Influence of Soil Pipes on the Timing and Geometry of Landslides
First, we discuss the effect of the pipe on landslide timing and form by comparing Case 0 to Case 1. In these cases, no clear displacement or landslide occurred until the water supply level reached 20 cm. However, in Case 1, when we set the water supply level in the higher tank to 25 cm, a landslide occurred. Here, when we used a higher tank, we expected the pressure in the pipe to increase. This implies that the presence of pipes in the soil layer has an effect on landslide occurrence.
Second, we discuss the effects of the soil pipe structure, i.e., straight pipe or confluence pipe. The results of our comparison between Cases 1 and 2, and Cases 4 and 5, show that landslides occurred when the water supply level was lower in the cases with confluence pipes than in the cases with straight pipes. These results imply that the confluence of soil pipes has a significant effect on the deterioration of the stability of the slope. Although in Cases 2 and 5 the landslide was rotational, and was deepest upstream of the confluence of pipes, in Cases 1 and 6 the surface of the landslide was generally planar. Therefore, the structure of the soil pipe can give impacts on not only the timing, but also the geometry of landslides.
It has been suggested that the clogging of a soil pipe induced the decrease of the time taken to induce a landslide, and the increase of the depth of the landslide, near a clog [10]. This is similar to our results indicating that the role of confluence of a soil pipe and the longitudinal change of drainage capacity of soil pipe gave similar impacts on landslide occurrence.
4.3. Influence of Entrapped Air on the Timing and Form of Landslides
The water supply level was 10 cm when landslides occurred in Cases 2 and 5, which can be included by the confluence of pipes. There was no clear difference between these cases in terms of water supply level. However, we believe that a displacement occurred when the water supply level reached 5 cm in Case 5, as the air entrapped by the silica sand destabilized the surface of the model slope early. Based on a comparison between Cases 3 and 6, which were both 30-degree slopes with only one straight pipe, landslides occurred when the water supply level was 15 cm in Case 3, and 10 cm in Case 6, and the silica sand on the surface of the model slope destabilized earlier in Case 6 than in Case 3. Although it is difficult to compare Case 1 to Case 4, which both had 25-degree slopes with only one straight pipe, it is conceivable that entrapped air destabilized the model slope early, in which case we regard the gully erosion observed in Case 4 as destabilization. The difference in the landslide forms between Cases 2 and 5, and Cases 3 and 6, are not clear. Based on the above, although entrapped air may contribute to destabilizing the slopes, it seems to have little effect on the form of the landslide.
Continued seepage was observed to compress the air in an experiment with a uniform layer of soil and no pipe. The entrapped air increased the pore water pressure, especially around the flat area of the model slope, thus inducing a landslide [19].
As landslides occurred earlier in Cases 5 and 6, which included silica sand, than in Cases 1 and 2, which did not have silica sand, it is possible that entrapped air increased the pore water pressure. In terms of the form of the landslide, a previous study only used an artificial rainfall simulator as a water supply system. In this case, a small landslide occurred at the toe of the model slope, where the pore water pressure was high, and then the landslide propagated upstream [19]. In our experiments, all the landslides occurred all at once, although prior displacement was observed in Case 5. This suggests that the air in the soil layer compacted rapidly due to the pipe. The entrapped air contributed to the increase in pore water pressure and thus affected the occurrence of landslides.
4.4. Landslide Mechanisms
In this experiment, we found that the pipe’s ability to drain water affects whether landslides occur. In short, when less water is supplied, the pipe can drain all of the water, as in the early stages of Case 1, where the pore water pressure is low and thus the pipe contributes to stabilizing the model slope. On the other hand, the pore water pressure is higher around flat areas downstream of model slopes, such as in Case 0. However, the slope destabilizes when more water is supplied than the pipe can drain, such as in the final stages of Case 1. The increase in the pore water pressure propagated upstream to the transition area, which was downstream of the model slope, where less water could drain.
We believe that the entire model slope will also destabilize if the flow in the pipe is pressurized directly by the higher tank and the pore water pressure increases, as in Case 1. This suggests that a mountainous slope can be destabilized by soil pipes, as pipes are often connected to other pipes some distance away [22,23,24,25].
In Cases 2 and 5, in which we used three pipes (although, we would expect the three pipes to contribute to the stabilization of the slope when the amount of supplied water was smaller than their drainage capacity), the pore water pressure increased rapidly around the confluence of pipes. This is because three pipes supply more water to one downstream pipe than a single pipe. At this point, the pore water pressure increased locally around the confluence of pipes (manometers c–e), but did not increase in other areas. This is why the landslide was deeper in this area than in other areas. It has been noted that soil pipes repeatedly merge and branch [4,22,23], and mountainous slopes can be destabilized by this merging and branching.
5. Conclusions
We investigated the effects of the confluence of pipes and entrapped air on landslides by measuring the pore water pressure just prior to landslides, and by assessing the form and timing of landslides. Planar landslides were observed in cases with one straight pipe, whereas rotational landslides occurred in cases with a confluence of three pipes; these were deepest around the confluence of pipes. This demonstrates that the confluence of pipes leads to locally high pore water pressure, thus influencing landslides.
The time taken for a landslide to occur was considerable with only one pipe, because the drainage of the pipe helped to stabilize the slope in the early stages of the increasing water levels. However, there were many cases in which landslides occurred as soon as the water supply level was raised.
The pore water pressure was high near the transition area downstream of the model slope in the cases where air was trapped in the soil layer. Furthermore, we observed that the pore water pressure was high near the confluences of pipes in Case 2. However, we also observed high pore water pressures in other areas in Case 5. This implies that water in the soil layer collects in the pipe, thus increasing the pore water pressure.
This experiment implies the importance of the drainage capacity of pipes. In the future, it will be necessary to investigate the relationship between the conditions of the soil layers (soil pipes and entrapped air), the water supply conditions, and landslide occurrences.
We should also consider the effect of storage discharge in soil layers, as this influences the saturation and destabilization of the soil layer. In the future, we would like to investigate the stabilization effects of storage discharge in soil layers and the effects of soil pipes and entrapped air on landslides.
Author Contributions
Investigation, H.N. and H.T.; writing—original draft, Y.T.; writing—review & editing, T.U.
Funding
This research received no external funding.
Conflicts of Interest
The authors declare no conflict of interest. The funders had no role in the design of the study; in the collection, analyses, or interpretation of data; in the writing of the manuscript, or in the decision to publish the results.
References
- Pierson, T.C. Soil pipes and slope stability. Q. J. Eng. Geol. Hydrogeol. 1983, 16, 1–11. [Google Scholar] [CrossRef]
- McDonnell, J.J. The influence of macropores on debris flow initiation. Q. J. Eng. Geol. 1990, 23, 325–331. [Google Scholar] [CrossRef]
- Verachtert, E.; van den Eeckhaut, M.; Martinez-Murillo, J.F.; Nadal-Romero, E.; Poesen, J.; Devoldere, S.; Wijnanta, N.; Deckers, J. Impact of soil characteristics and land use on pipe erosion in a temperature humid climate: Field studies in Belgium. Geomorphology 2012, 192, 1–14. [Google Scholar] [CrossRef]
- Kitahara, H. A Study on the Characteristics of Soil Pipes Influencing Water Movement in Forested Slopes. Bull. For. For. Prod. Res. Inst. 1995, 367, 63–115. (In Japanese) [Google Scholar]
- Uchida, T.; Kosugi, K.; Mizuyama, T. Effect of pipeflow on hydrological process and its relation to landslide: A review of pipeflow studies in forested headwater catchment. Hydrol. Process. 2001, 15, 2151–2174. [Google Scholar] [CrossRef]
- Jones, J.A.A. Soil piping and catchment response. Hydrol. Process. 2010, 24, 1548–1566. [Google Scholar] [CrossRef]
- Kosugi, K.; Uchida, T.; Mizuyama, T. Numerical calculation of soil pipe flow and its effect on water dynamics in a slope. Hydrol. Process. 2004, 18, 777–789. [Google Scholar] [CrossRef]
- Daizo Tsutsumi, R.; Sidle, C.; Kosugi, K. Development of a simple lateral preferential flow model with steady state application in hillslope soils. Water Resour. Res. 2005, 41, 1–15. [Google Scholar]
- Uchida, T.; Mizuyama, T. The contribution of pipeflow on shallow landslide initiation at steep hillslopes. In International Congress Interpraevent 2002 in the Pacific Rim—Matsumoto/Japan; Congress Publication: Matsumoto City, Nagano Prefecture, Japan, 2002; Volume 2, pp. 559–569. [Google Scholar]
- Tada, Y.; Okumura, T.; Kubota, T. Examination of the influence of soil pipes on slope failure. J. Jpn. Soc. Eros. Control Eng. 2002, 55, 12–20. (In Japanese) [Google Scholar]
- Sidle, R.C.; Kitahara, H.; Terajima, T.; Nakai, Y. Experimental studies on the effects of pipeflow on throughflow partitioning. J. Hydrol. 1995, 165, 207–219. [Google Scholar] [CrossRef]
- Sharma, R.H.; Konietzky, H. Instrumented failure of hillslope model with soil-pipes. Geomorphology 2011, 130, 272–279. [Google Scholar] [CrossRef]
- Wilson, G.V.; Fox, G.V. Pore-Water Pressures Associated with Clogging of Soil Pipes: Numerical Analysis of Laboratory Experiments. Soil Sci. Soc. Am. J. 2013, 77, 1168–1181. [Google Scholar] [CrossRef]
- Fox, G.A.; Felice, R.G.; Midgley, T.L.; Wilson, G.V.; Al-Madhhachi, A.T. Laboratory soil piping and internal erosion experiments: Evaluation of a soil piping model for low-compacted soil. Earth Surf. Process. Landf. 2014, 39, 1137–1145. [Google Scholar] [CrossRef]
- Sharma, R.H. Laboratory experiments on the influence of soil pipes on slope failure. Landslide 2015, 12, 345–353. [Google Scholar] [CrossRef]
- Yamasaki, T.; Imoto, H.; Nishimura, T. Determination of the role of entrapped air in water flow in a closed soil pipe using a laboratory experiment. Hydrol. Process. 2017, 31, 3740–3749. [Google Scholar] [CrossRef]
- Marui, A. Rainfall-Runoff Process and Function of Subsurface Water Storage in a Layered Hillslope. Geogr. Rev. Jpn. 1661, 64, 145–1661. (In Japanese) [Google Scholar] [CrossRef]
- Lieden, D.R.; Dixon, R.M. Water table position as affected by soil air pressure. Water Resour. Res. 1975, 11, 139–143. [Google Scholar]
- Yagi, N.; Yatabe, R.; Yamamoto, K. Slope Failure due to seepage of rainwater. J. Jpn. Soc. Civ. Eng. 1983, 330, 107–114. (In Japanese) [Google Scholar] [CrossRef]
- Chen, P.; Mirus, B.; Lu, N.; Gobt, J.W. Effects of Hydraulic Hysteresis on Stability of Infinite Slopes under Steady Infiltration. J. Geotech. Geoenviron. Eng. 2017, 143, 04017041. [Google Scholar] [CrossRef]
- Liu, G.; Tong, F.; Zhao, Y.; Tian, B. A force transfer mechanism for triggering landslides during rainfall infiltration. J. Mt. Sci. 2018, 15, 2480–2491. [Google Scholar] [CrossRef]
- Terajima, T.; Sakamoto, T.; Shirai, T. Morphology structure and flow phases in soil pipes developing in forested hillslopes underlain by a Quaternary sand-gravel formation, Hokkaido, northern mail island in Japan. Hydrol. Process. 2000, 14, 713–726. [Google Scholar] [CrossRef]
- Holden, J. Hydrological connectivity of soil pipes determined by ground-penetrating radar tracer detection. Earth Surf. Process. Landf. 2004, 29, 437–442. [Google Scholar] [CrossRef] [Green Version]
- Uchida, T. Clarifying the role of pipe flow on shallow landslide initiation. Hydrol. Process. 2004, 18, 375–378. [Google Scholar] [CrossRef]
- Nieber, J.L.; Sidle, R.C. How do disconnected macropores in sloping soils facilitate preferential flow? Hydrol. Process. 2010, 24, 1582–1594. [Google Scholar] [CrossRef]
Figure 1.
Overview of the equipment. We prepared slopes with two different gradients and set the depth of the soil layer to 20 cm. The water supply system consists of the higher and lower tanks, and artificial rainfall simulator. We supplied water from the water pool to the artificial rainfall simulator and the higher and lower tanks using a pump. We pierced the artificial pipe, which was made of vinyl chloride, so that water could pass through it. We installed the artificial pipe at the bottom of the model slope. Moreover, we measured the pore water pressure with a manometer attached to the bottom of the model slope.

Figure 2.
Grain size distribution of material. For this experiment, we used sand with particle sizes from 0.003 mm to 10 mm. We measured the distribution of the dry sand using a sieve.
Figure 2.
Grain size distribution of material. For this experiment, we used sand with particle sizes from 0.003 mm to 10 mm. We measured the distribution of the dry sand using a sieve.

Figure 3.
Overview of equipment used to assess how silica sand entraps air. We prepared a vertical acrylic cylinder to construct the soil layer, as shown above. In this case we layered 3 cm of silica sand on top of the normal sand, and in the other case we used only sand. We increased the water level from the bottom of the cylinder and measured the volume of air flow using an air flowmeter.

Figure 4.
Air flow results. The volume of air flow in the case with silica sand was smaller than that in the case with no silica sand for the entirety of the experiment, although the volume of air flow in the case with silica sand increased after approximately 200 s.
Figure 4.
Air flow results. The volume of air flow in the case with silica sand was smaller than that in the case with no silica sand for the entirety of the experiment, although the volume of air flow in the case with silica sand increased after approximately 200 s.

Figure 5.
Water supply conditions. The water supply system supplied water in a manner consistent with artificial rainfall simulators. Artificial rainfall simulators can supply water at a rate of 130 mm/h. We increased the water level by 5 cm every 30 min until 20 cm, 5 cm every 10 min beyond 20 cm. We used the lower tank and higher tank until the water level reached 20 cm, then the higher tank as the water level increased beyond 25 cm.

Figure 6.
Comparison of pore water pressure at the same pint under the same water supply condition between Runs 1 and 2. The legend (a,b) indicates each manometer. The trend of each manometer was similar generally in two times.
Figure 6.
Comparison of pore water pressure at the same pint under the same water supply condition between Runs 1 and 2. The legend (a,b) indicates each manometer. The trend of each manometer was similar generally in two times.

Figure 7.
The distribution of the pore water pressure and the form of the landslide in each case. The figure shows that the pore water pressure, which we measured, increased as the water supply level rose over 30 min passing. (a) The pore water pressure was already high after 30 min, and did not vary significantly afterwards. (b,d,e,g) The pore water pressure was low after 30 min and increased with the water supply level. (b,e) pore water pressure was high around the transitional area of degree at 60 min passing especially. (c,f) The pore water pressure was high around the confluence of the artificial pipes after 30 min. (a,c,f) show that the form of the landslide was planar, while (b,e) show that the form of the landslide was rotational. (d) shows that the surface of the model slope flowed away.

Figure 8.
The relationship between the pore water pressure ratio in each case. Red break line means that the pressure ratio is 1. The pore water pressure of Case 2 was higher than Case 1, generally. The pore water pressure of Case 4 was also higher than Case 1, generally. This result implies that the influence of the confluence of pipe and entrapped air on the buildup of pore water pressure.


Table 1.
Experimental conditions and water supply level when each landslide occurred, the elapsed time and the time at which the landslide took place after the water level was raised. Circles indicate that the case included silica sand, and crosses indicate that silica sand was layered on the model slope.
| Case No. | Type of Artificial Pipe | Slope Angle | Silica Sand | Displacement before Landslide | Supply Water Level When Displacement Occurred | Supply Water Level When Landslide Occurred | Elapsed Time from Setting the Last Water Level to Landslide or Destabilization | Elapsed Time from Start of Experiment | ||
|---|---|---|---|---|---|---|---|---|---|---|
| Lower Tank | Higher Tank | Lower Tank | Higher Tank | |||||||
| 1 | Straight | 25° | × | Flow downstream of the model slope | 20 cm | 20 cm | 20 cm | 25 cm | 24 s | 120 min 24 s |
| 2 | Confluence | 25° | × | - | - | - | 10 cm | 10 cm | 54 s | 30 min 54 s |
| 3 | Straight | 30° | × | Soil layer sinking | 10 cm | 10 cm | 10 cm | 10 cm | 11 min 42 s | 41 min 42 s |
| 4 | Straight | 25° | ○ | Flow downstream of the model slope | 10 cm | 10 cm | 20 cm | 20 cm | 6 min 42 s | 96 min 42 s |
| 5 | Confluence | 25° | ○ | Soil layer sinking Cracks between manometer a and b | 5 cm | 5 cm | 10 cm | 10 cm | 48 s | 30 min 48 s |
| 6 | Straight | 30° | ○ | - | - | - | 15 cm | 15 cm | 24 s | 60 min 24 s |
© 2019 by the authors. Licensee MDPI, Basel, Switzerland. This article is an open access article distributed under the terms and conditions of the Creative Commons Attribution (CC BY) license (http://creativecommons.org/licenses/by/4.0/).
Share and Cite
MDPI and ACS Style
Tanaka, Y.; Uchida, T.; Nagai, H.; Todate, H. Bench-Scale Experiments on Effects of Pipe Flow and Entrapped Air in Soil Layer on Hillslope Landslides. Geosciences 2019, 9, 138. https://doi.org/10.3390/geosciences9030138
AMA Style
Tanaka Y, Uchida T, Nagai H, Todate H. Bench-Scale Experiments on Effects of Pipe Flow and Entrapped Air in Soil Layer on Hillslope Landslides. Geosciences. 2019; 9(3):138. https://doi.org/10.3390/geosciences9030138
Chicago/Turabian StyleTanaka, Yasutaka, Taro Uchida, Hitoshi Nagai, and Hikaru Todate. 2019. "Bench-Scale Experiments on Effects of Pipe Flow and Entrapped Air in Soil Layer on Hillslope Landslides" Geosciences 9, no. 3: 138. https://doi.org/10.3390/geosciences9030138
Note that from the first issue of 2016, this journal uses article numbers instead of page numbers. See further details here.