Uplift Evidences Related to the Recession of Groundwater Abstraction in a Pyroclastic-Alluvial Aquifer of Southern Italy


Abstract
:1. Introduction
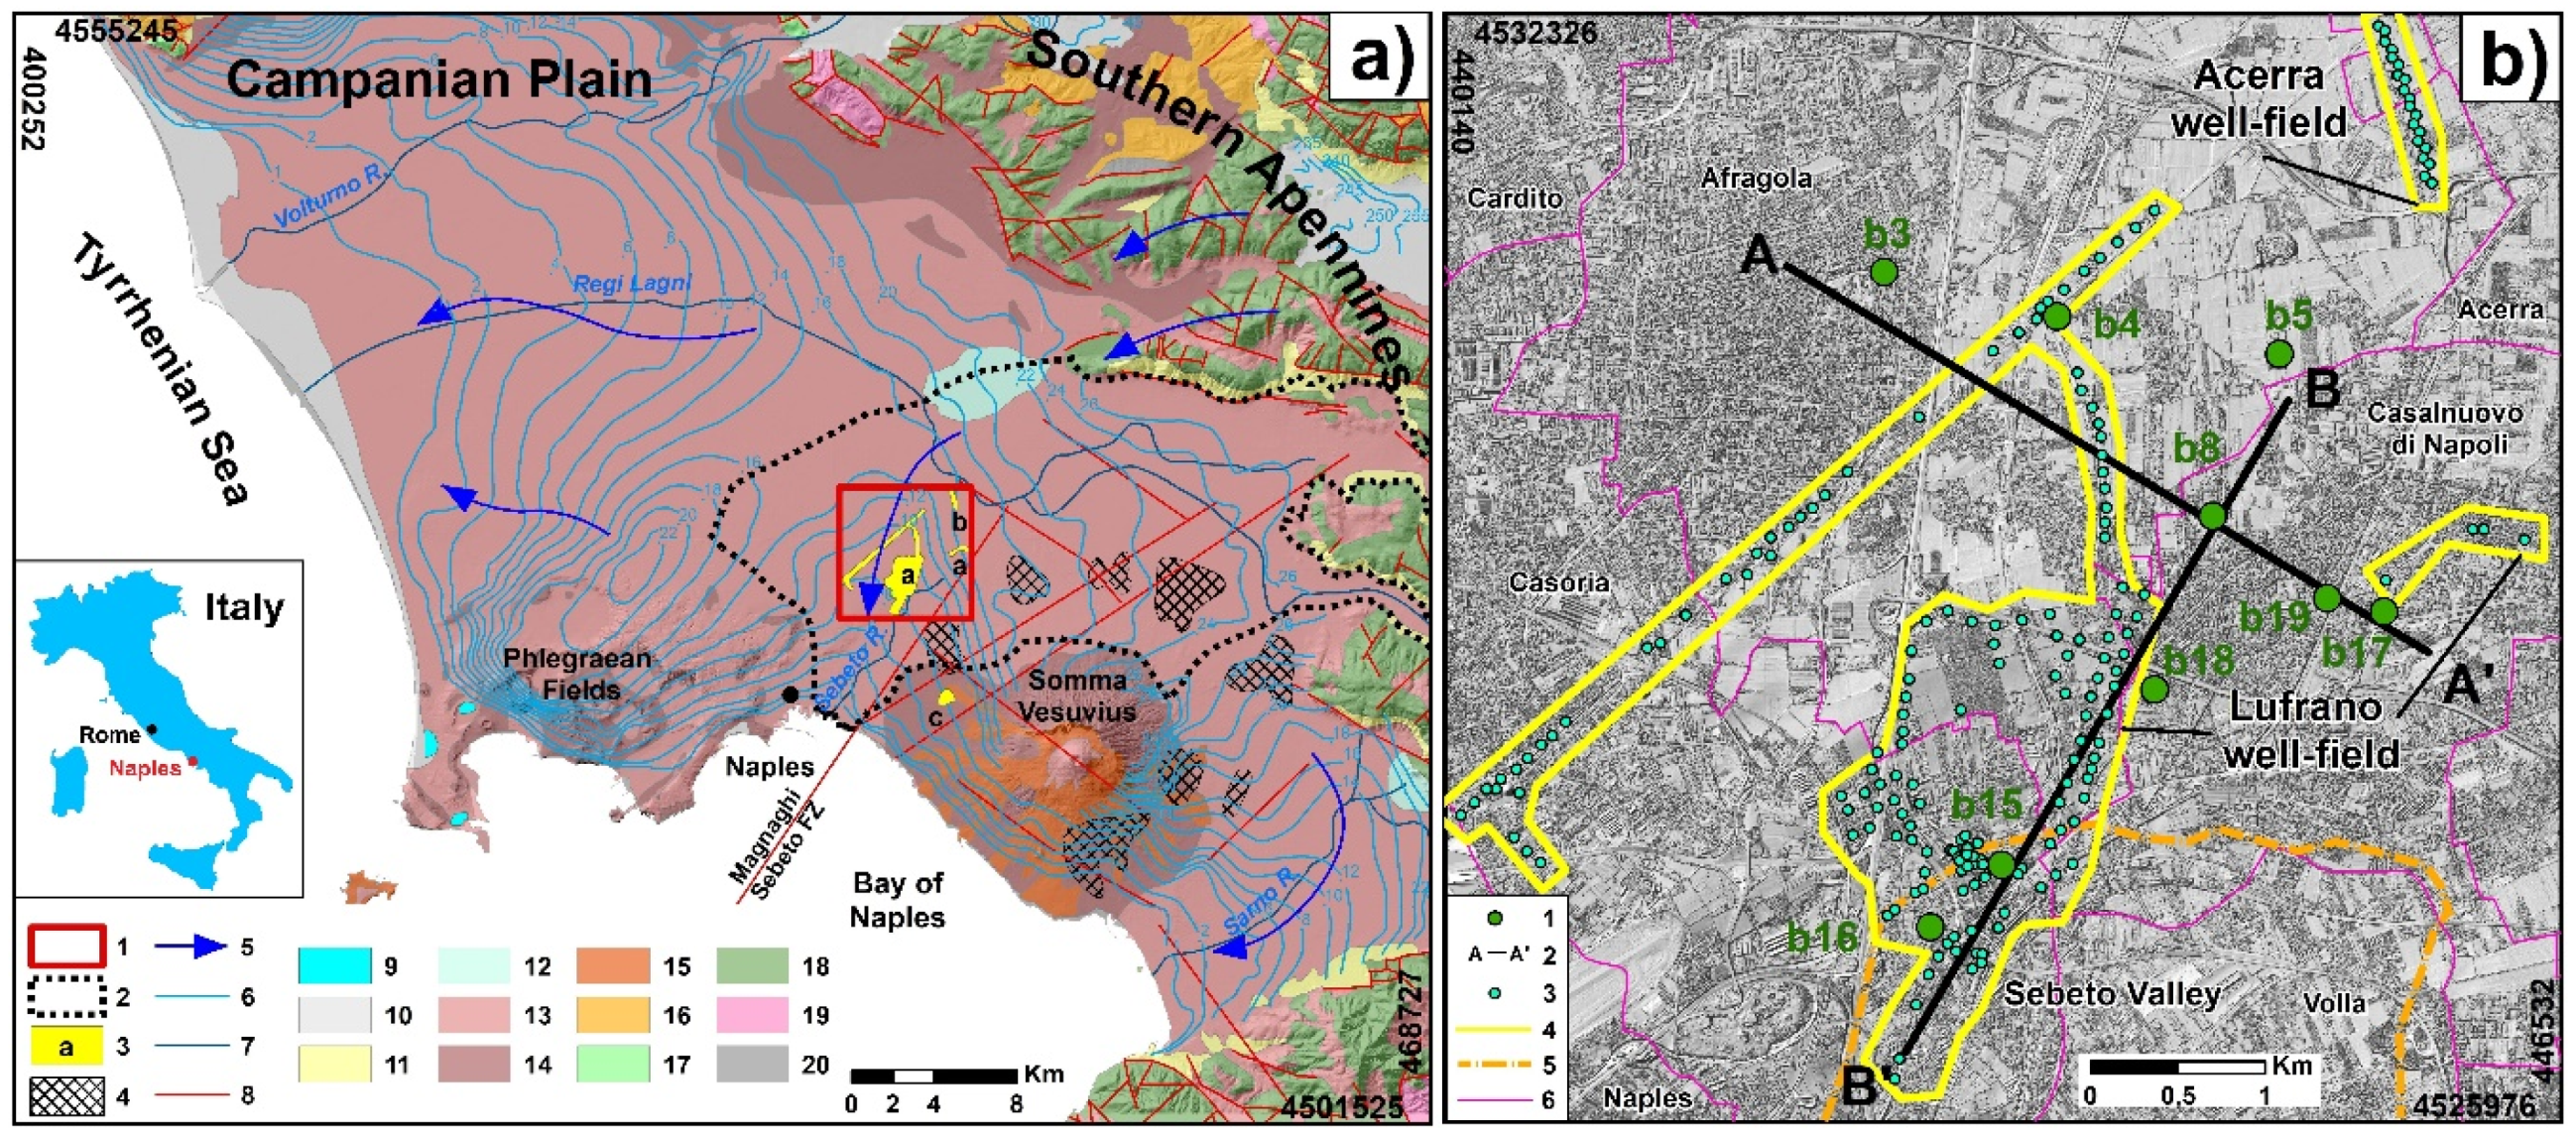
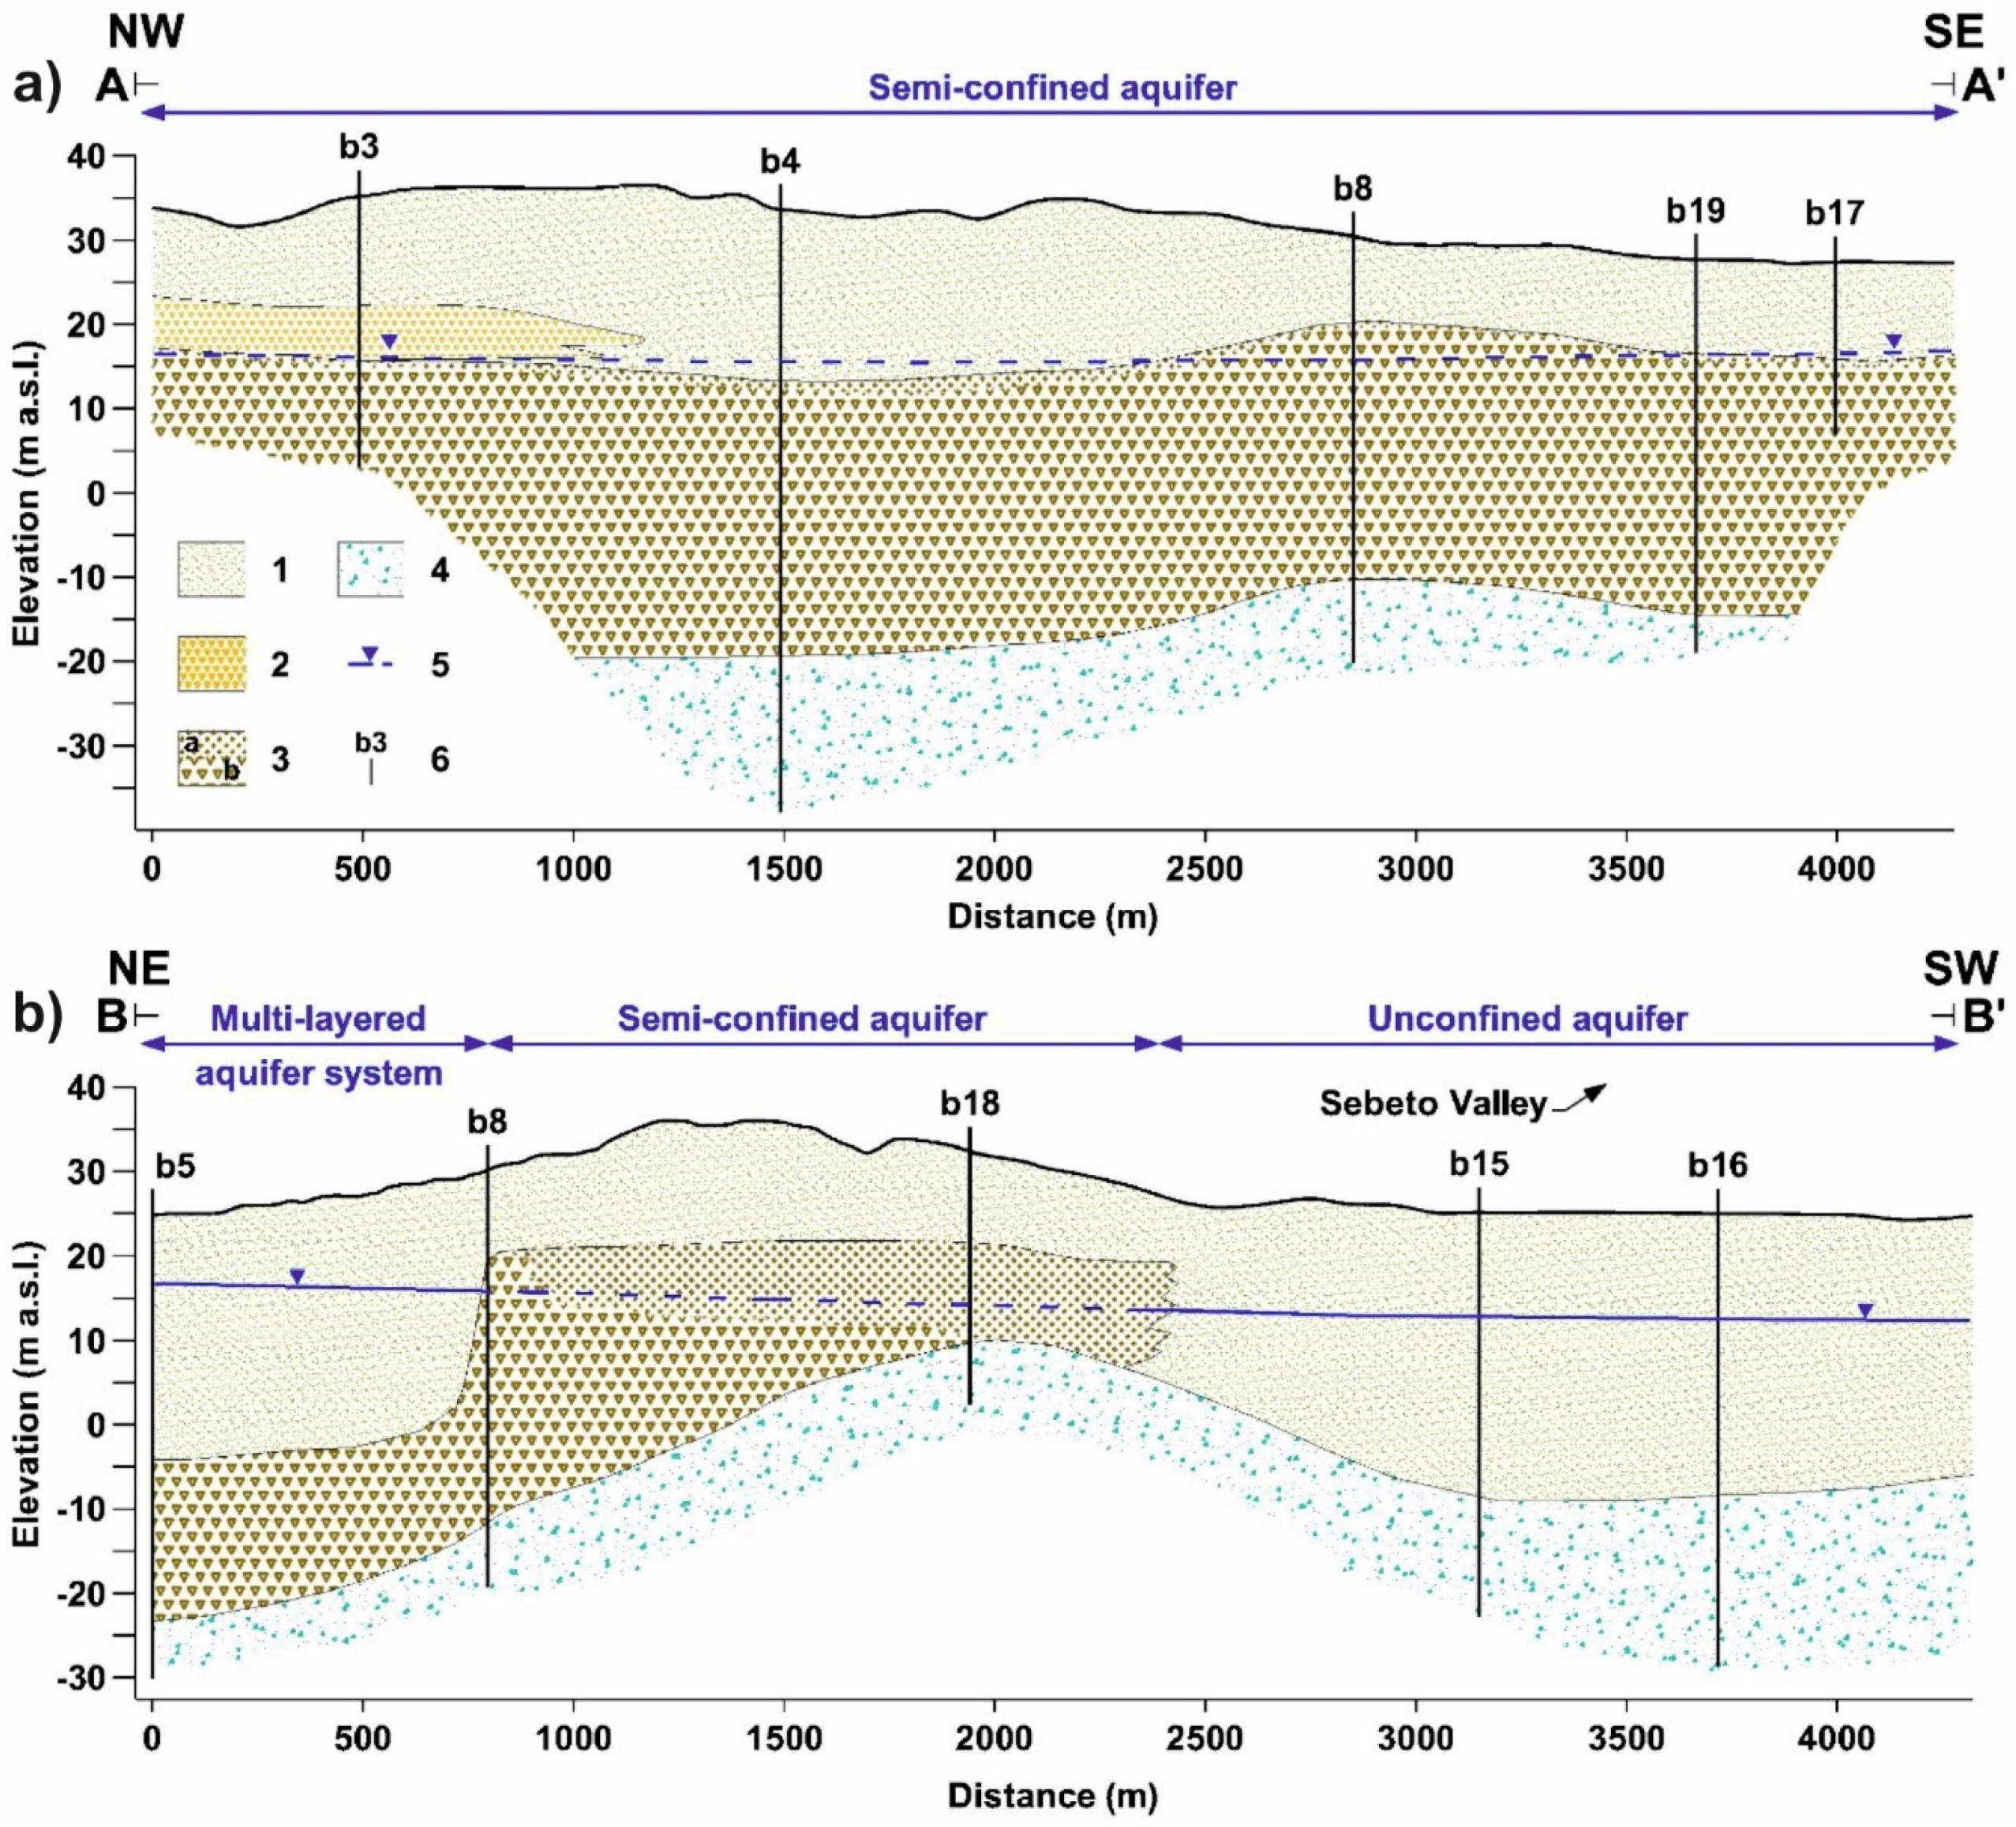
2. Study Area
3. Data and Methods
3.1. Hydrogeological Data
3.2. DInSAR Data
4. Results
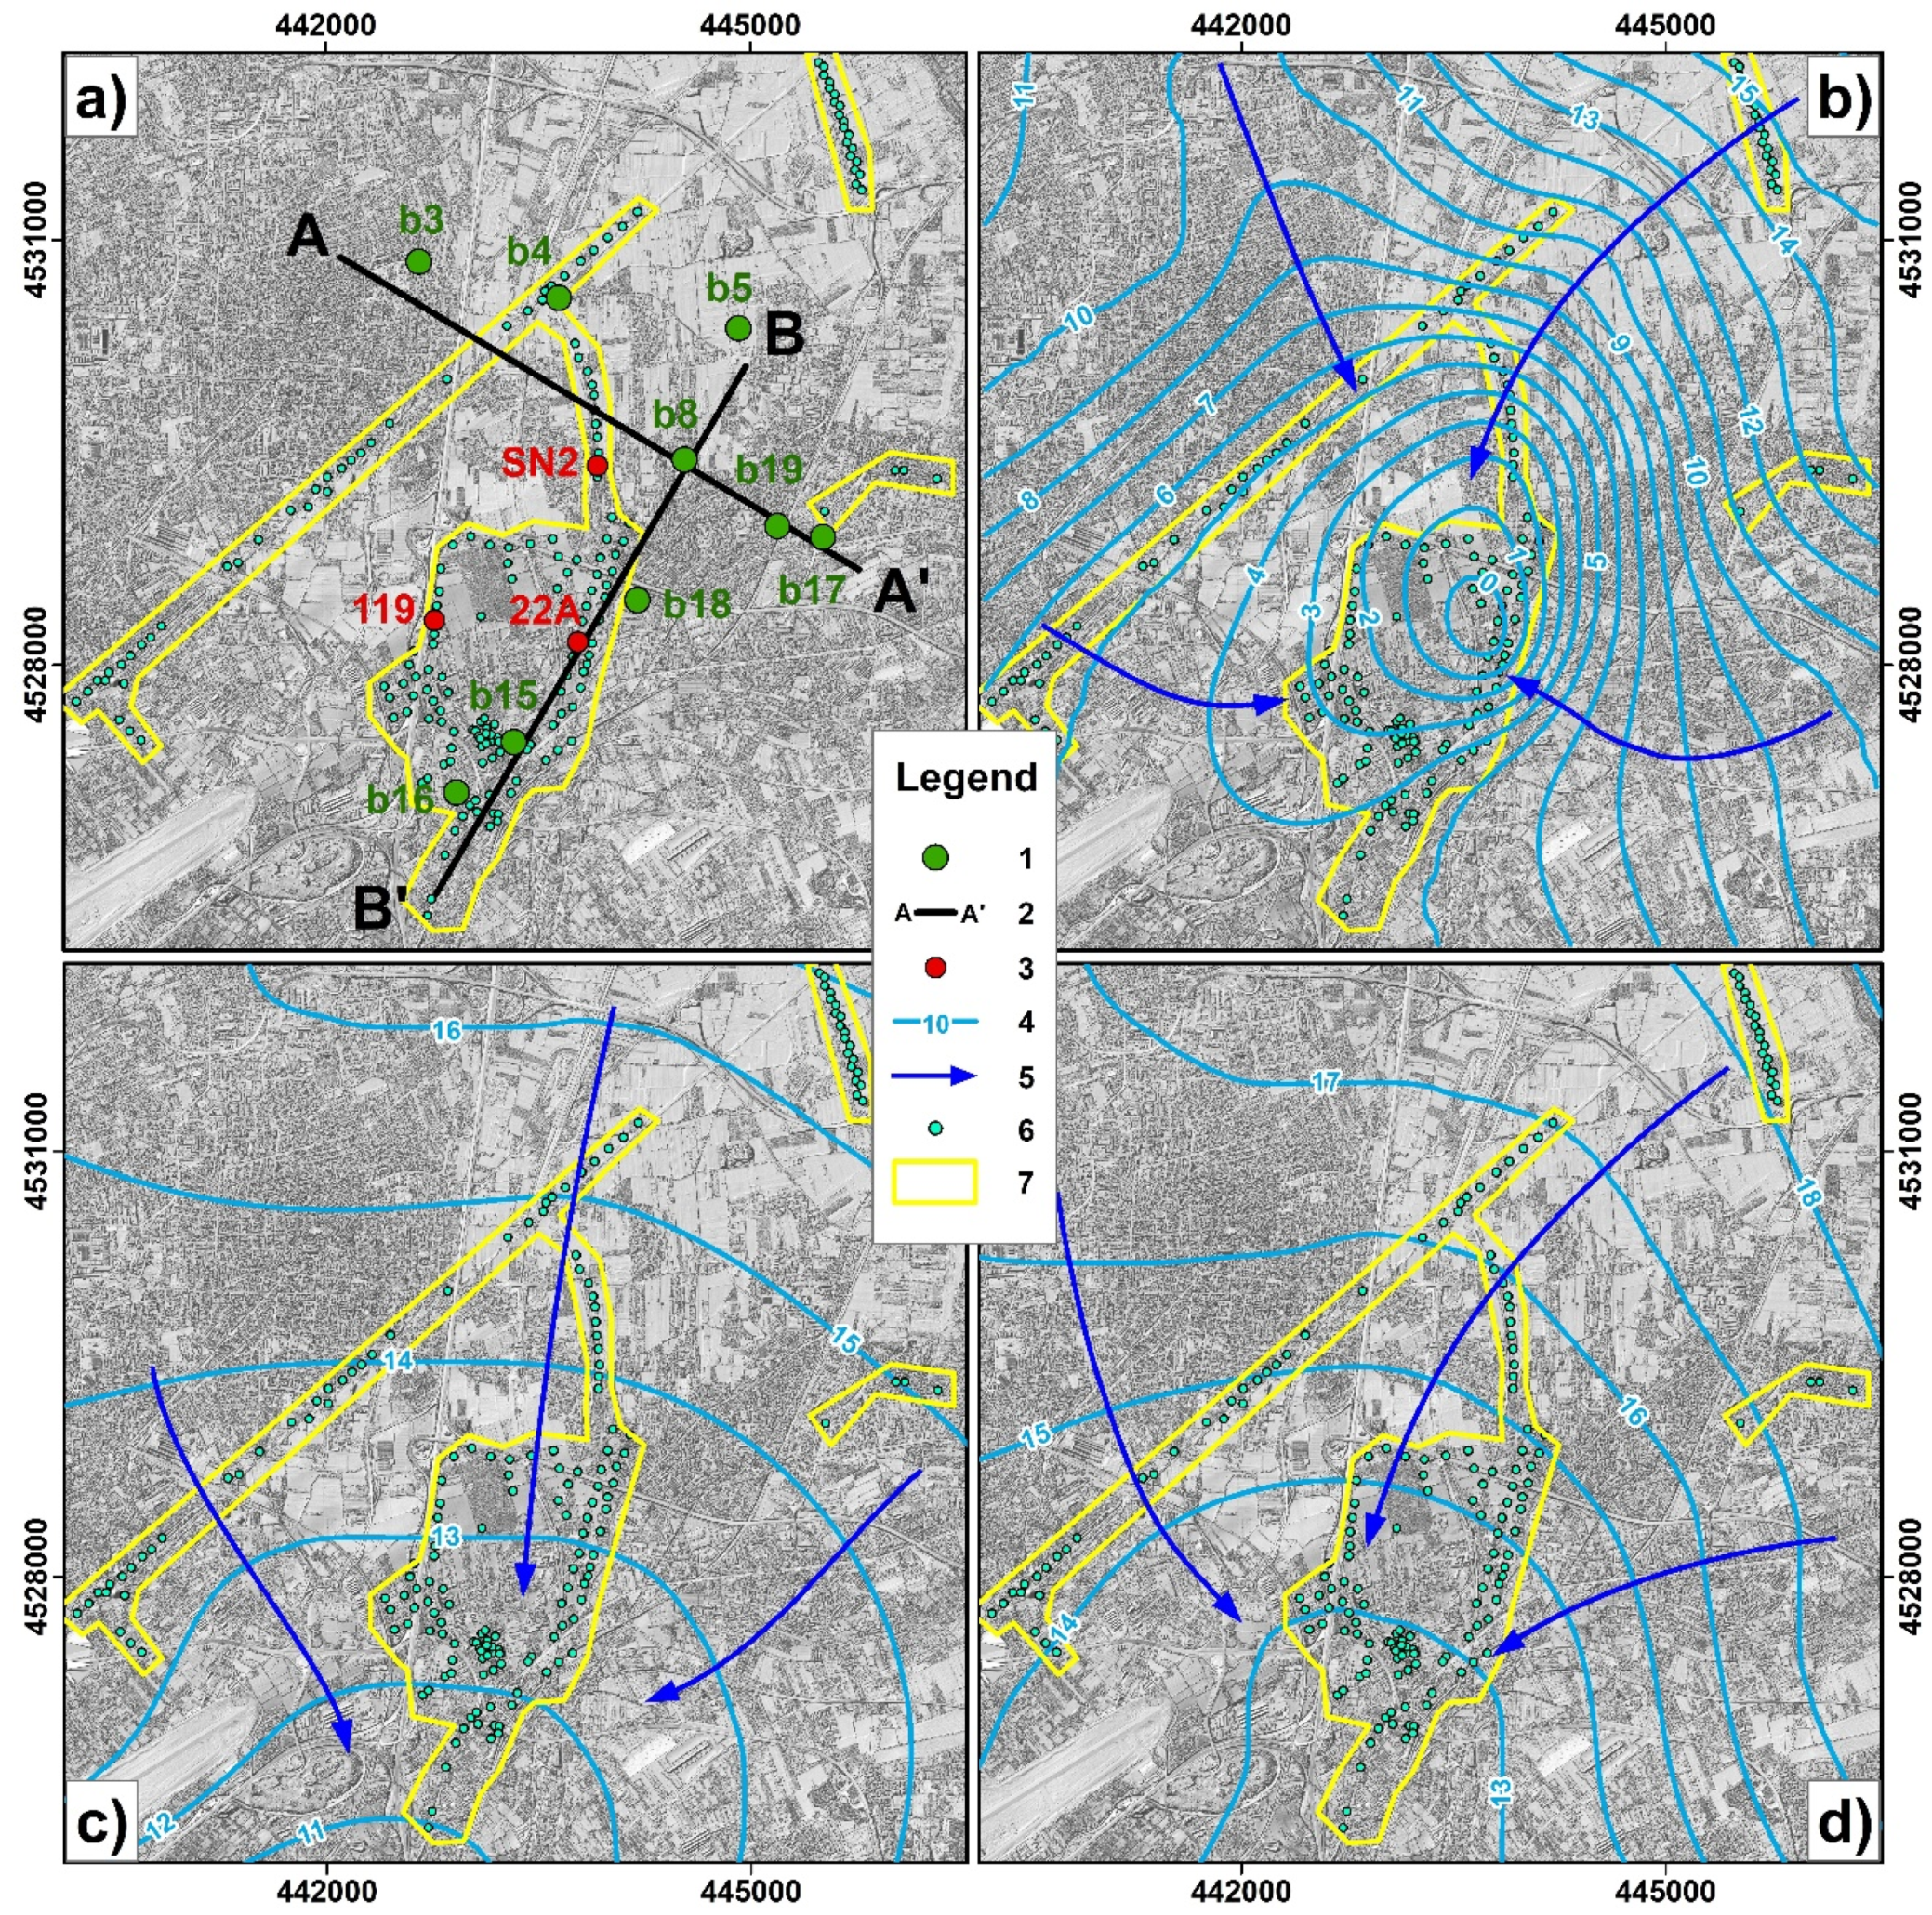
4.1. Piezometric Head Variation Maps
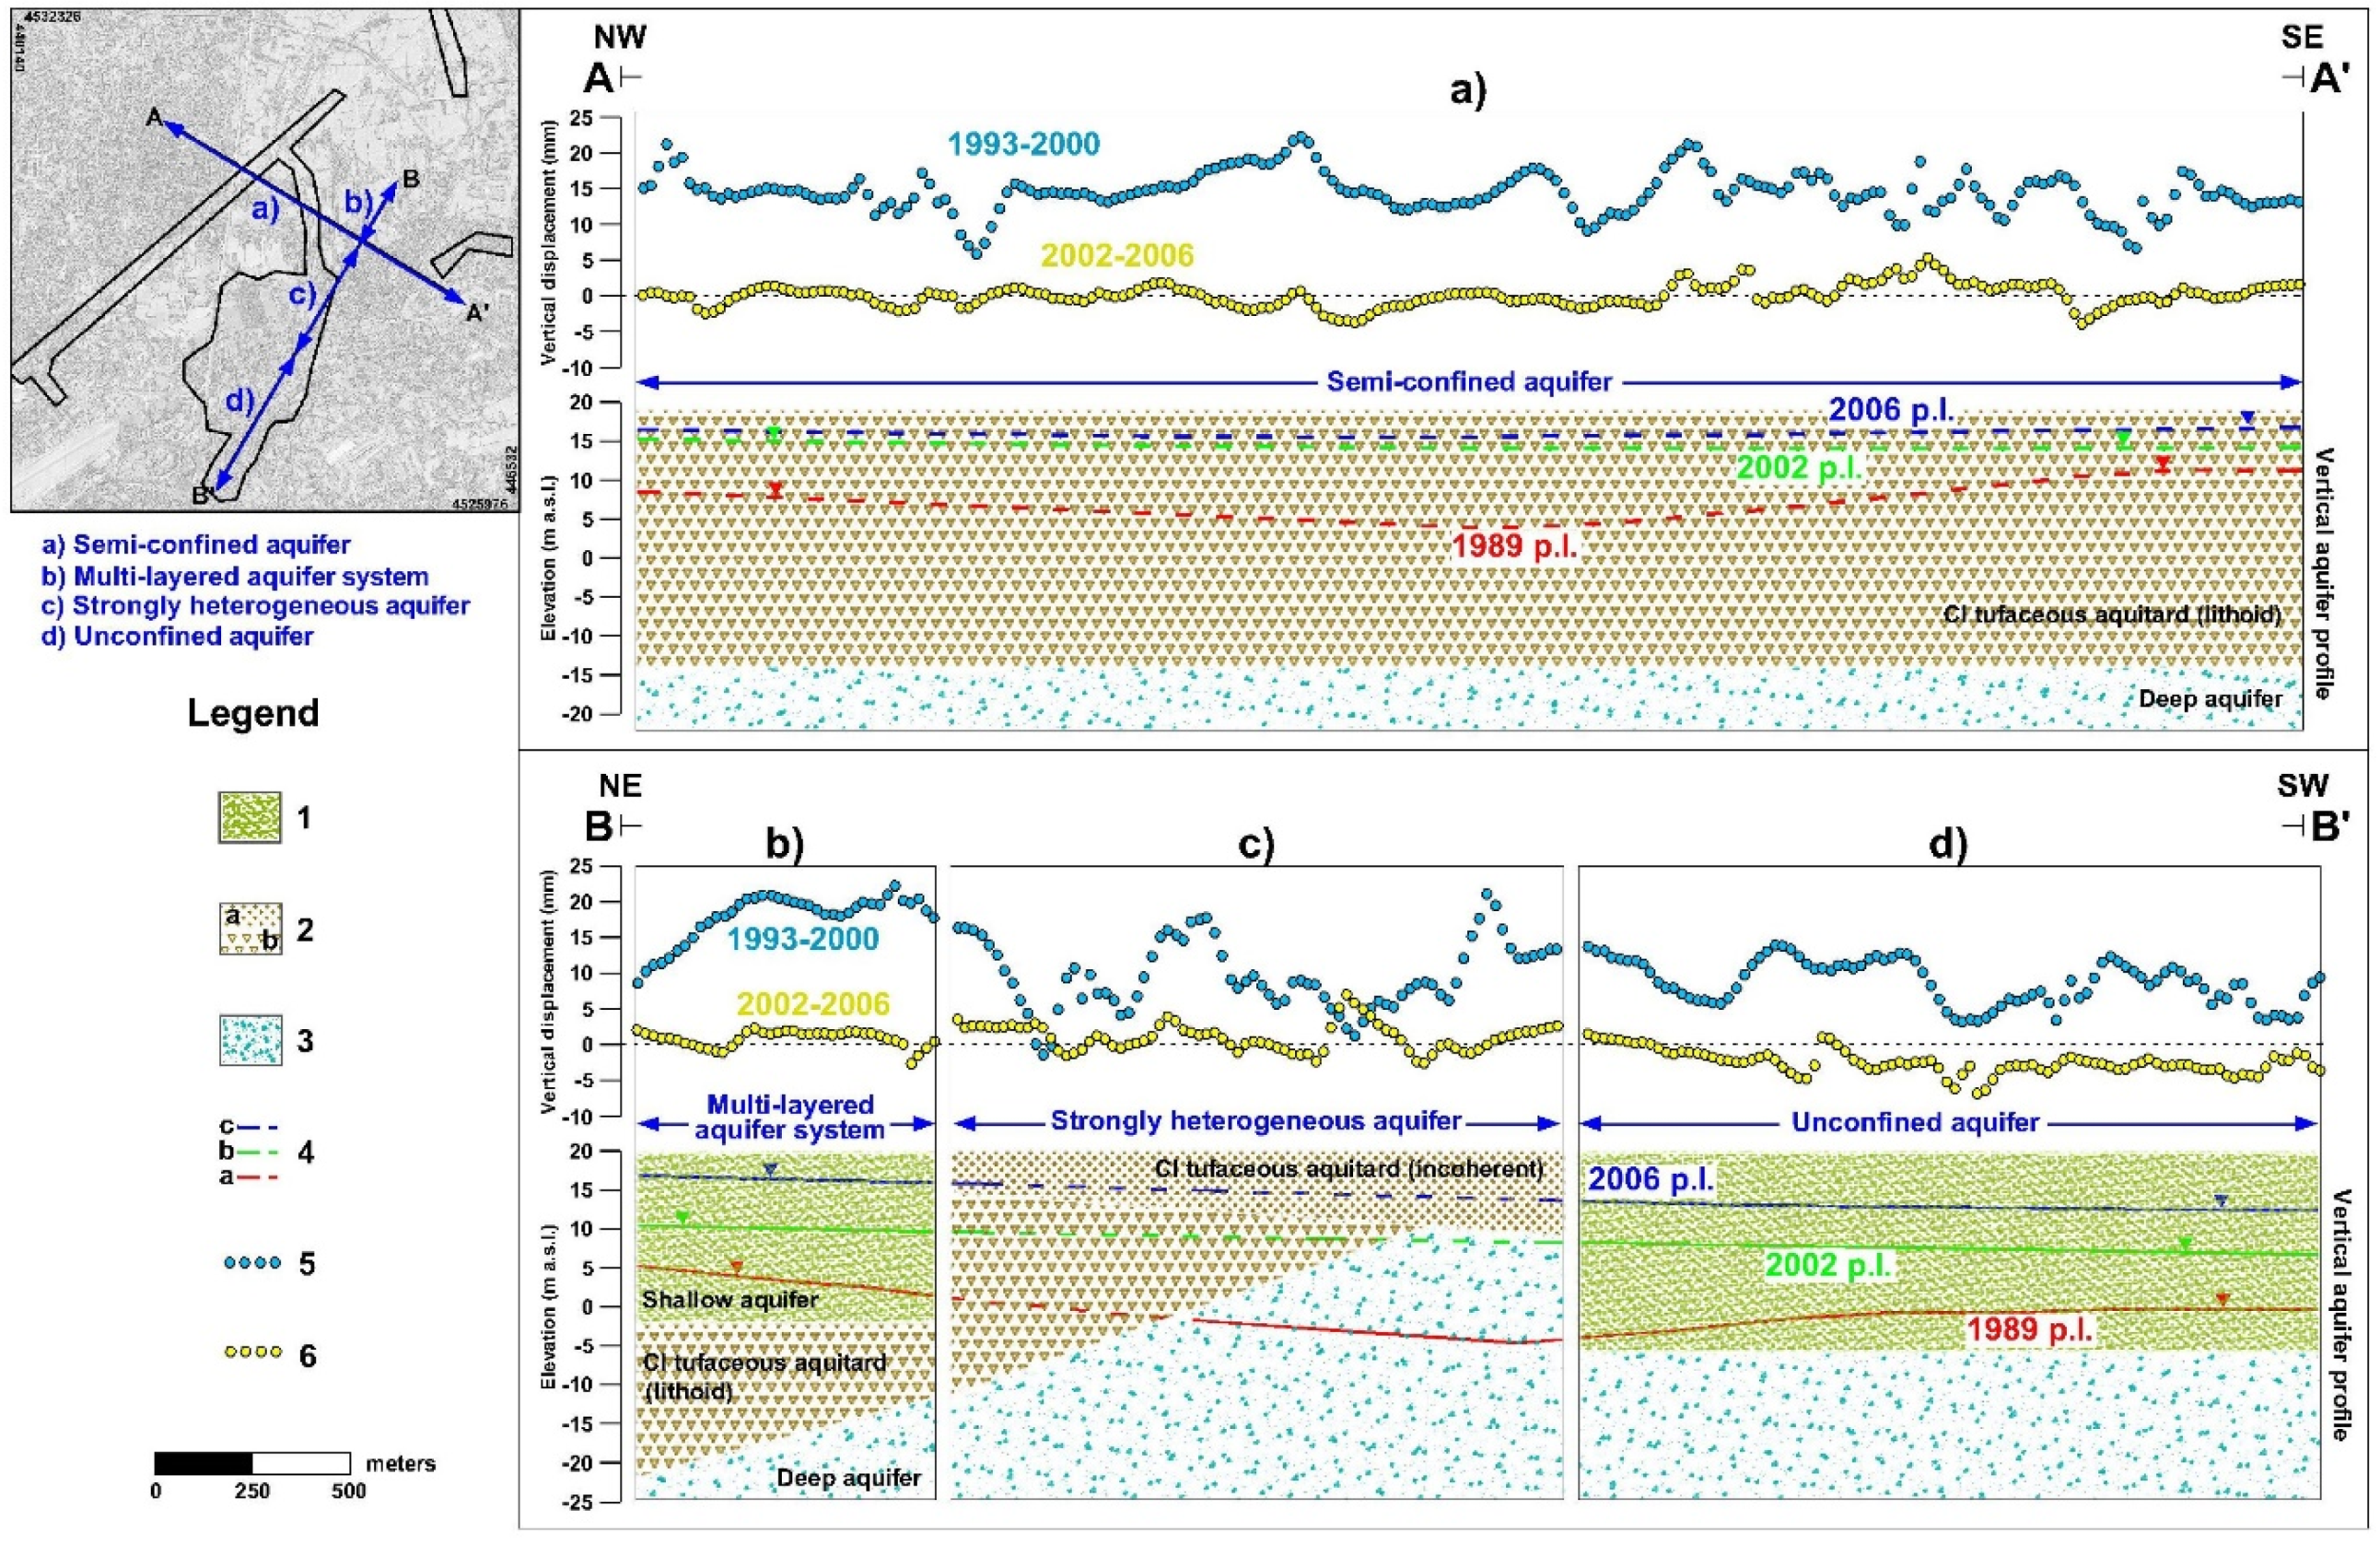
4.2. Satellite-Based Deformation Maps
5. Discussion
6. Conclusions
Author Contributions
Funding
Acknowledgments
Conflicts of Interest
References
- Chen, Y.G.; Liu, T.K. Holocene uplift and subsidence along an active tectonic margin southwestern Taiwan. Quat. Sci. Rev. 2000, 19, 923–930. [Google Scholar] [CrossRef]
- Perrone, G.; Morelli, M.; Piana, F.; Fioraso, G.; Nicolò, G.; Mallen, L.; Cadoppi, P.; Balestro, G.; Tallone, S. Current tectonic activity and differential uplift along the Cottian Alps/Po Plain boundary (NW Italy) as derived by PS-InSAR data. J. Geodyn. 2013, 66, 65–78. [Google Scholar] [CrossRef] [Green Version]
- Meltzner, A.J.; Sieh, K.; Abrams, M.; Agnew, D.C.; Hudnut, K.W.; Avouac, J.P.; Natawidjaja, D.H. Uplift and subsidence associated with the great Aceh-Andaman earthquake of 2004. J. Geophys. Res. Solid Earth 2006, 111. [Google Scholar] [CrossRef] [Green Version]
- Chini, M.; Bignami, C.; Stramondo, S.; Pierdicca, N. Uplift and subsidence due to the 26 December 2004 Indonesian earthquake detected by SAR data. Int. J. Remote Sens. 2008, 29, 3891–3910. [Google Scholar] [CrossRef]
- Galloway, D.L.; Jones, D.R.; Ingebritsen, S.E. Land Subsidence in the United States; US Geological Survey: Reston, VA, USA, 1999.
- González-Morán, T.; Rodrıguez, R.; Cortes, S.A. The Basin of Mexico and its metropolitan area: Water abstraction and related environmental problems. J. S. Am. Earth Sci. 1999, 12, 607–613. [Google Scholar] [CrossRef]
- Amin, A.; Bankher, K. Causes of land subsidence in the Kingdom of Saudi Arabia. Nat. Hazards 1997, 16, 57–63. [Google Scholar] [CrossRef]
- Carminati, E.; Martinelli, G. Subsidence rates in the Po Plain, northern Italy: The relative impact of natural and anthropogenic causation. Eng. Geol. 2002, 66, 241–255. [Google Scholar] [CrossRef]
- Lofgren, B.E.; Klausing, R.L. Land Subsidence Due to Ground-Water Withdrawal, Tulare-Wasco Area, California; US Government Printing Office: Washington, DC, USA, 1969.
- Wilkinson, W.B. Groundwater Problems in Urban Areas; Tomas Telford: London, UK, 1994. [Google Scholar]
- Terranova, C.; Ventura, G.; Vilardo, G. Multiple causes of ground deformation in the Napoli metropolitan area (Italy) from integrated Persistent Scatterers DinSAR, geological, hydrological, and urban infrastructure data. Earth Sci. Rev. 2015, 146, 105–119. [Google Scholar] [CrossRef]
- Biot, M.A. General theory of three dimensional consolidation. J. Appl. Phys. 1941, 12, 155–164. [Google Scholar] [CrossRef]
- Allen, D.R.; Mayuga, M.N. The mechanics of compaction and rebound, Wilmington Oil Field, Long Beach, California, U.S.A. In Proceedings of the Tokyo Symposium on Land Subsidence 2; International Association of Scientific Hydrology and UNESCO, Tokyo, Japan, 17–24 September 1969; pp. 410–423. [Google Scholar]
- Donnelly, L.J. A review of international cases of fault reactivation during mining, subsidence and fluid abstraction. Q. J. Eng. Geol. Hydrog. 2009, 42, 73–94. [Google Scholar] [CrossRef]
- Strozzi, T.; Wegmuller, U. Land subsidence in Mexico City mapped by ERS differential SAR interferometry. In Proceedings of the IEEE 1999 International Geoscience and Remote Sensing Symposium IGARSS’99 (Cat. No. 99CH36293), Hamburg, Germany, 28 June–2 July 1999; Volume 4, pp. 1940–1942. [Google Scholar]
- Osmanoğlu, B.; Dixon, T.H.; Wdowinski, S.; Cabral-Cano, E.; Jiang, Y. Mexico City subsidence observed with persistent scatterer InSAR. Int. J. Appl. Earth Obs. 2011, 13, 1–12. [Google Scholar] [CrossRef]
- Tomás, R.; Herrera, G.; Delgado, J.; Lopez-Sanchez, J.M.; Mallorquí, J.J.; Mulas, J. A ground subsidence study based on DInSAR data: Calibration of soil parameters and subsidence prediction in Murcia City (Spain). Eng. Geol. 2010, 111, 19–30. [Google Scholar] [CrossRef]
- Zeni, G.; Bonano, M.; Casu, F.; Manunta, M.; Manzo, M.; Marsella, M.; Pepe, A.; Lanari, R. Long-term deformation analysis of historical buildings through the advanced SBAS-DInSAR technique: The case study of the city of Rome, Italy. J. Geophys. Eng. 2011, 8, S1–S12. [Google Scholar] [CrossRef]
- Milillo, P.; Giardina, G.; DeJong, M.; Perissin, D.; Milillo, G. Multi-temporal InSAR structural damage assessment: The London crossrail case study. Remote Sens. 2018, 10, 287. [Google Scholar] [CrossRef]
- Bonì, R.; Cigna, F.; Bricker, S.; Meisina, C.; McCormack, H. Characterisation of hydraulic head changes and aquifer properties in the London Basin using Persistent Scatterer Interferometry ground motion data. J. Hydrol. 2016, 540, 835–849. [Google Scholar] [CrossRef] [Green Version]
- Bonì, R.; Bosino, A.; Meisina, C.; Novellino, A.; Bateson, L.; McCormack, H. A methodology to detect and characterize uplift phenomena in urban areas using Sentinel-1 data. Remote Sens. 2018, 10, 607. [Google Scholar] [CrossRef]
- Allocca, V.; Celico, P. Hydrodynamics scenarios in the eastern plain of Naples (Italy), in the last century: Causes and hydrogeological implications. G. Geol. Appl. 2008, 9, 175–198. [Google Scholar]
- Celico, P.; Esposito, L.; de Gennaro, M.; Mastrangelo, E. La falda ad Oriente della città di Napoli: Idrodinamica e qualità delle acque. Geol. Romana 1994, 30, 653–660. [Google Scholar]
- Allocca, V.; Coda, S.; De Vita, P.; Iorio, A.; Viola, R. Rising groundwater levels and impacts in urban and semirural areas around Naples (southern Italy). Rend. Online Soc. Geol. It. 2016, 41, 14–17. [Google Scholar]
- Coda, S.; Tessitore, S.; Di Martire, D.; Calcaterra, D.; De Vita, P.; Allocca, V. Coupled ground uplift and groundwater rebound in the metropolitan city of Naples (southern Italy). J. Hydrol. 2019, 569, 470–482. [Google Scholar] [CrossRef]
- Rolandi, G.; Bellucci, F.; Heizler, M.T.; Belkin, H.E.; De Vivo, B. Tectonic controls on the genesis of ignimbrites from the Campanian volcanic zone, southern Italy. Miner. Petrol. 2003, 79, 3–31. [Google Scholar] [CrossRef]
- Bellucci, F. Nuove conoscenze stratigrafiche sui depositi vulcanici del sottosuolo del settore meridionale della Piana Campana. Boll. Soc. Geol. It. 1994, 113, 395–420. [Google Scholar]
- Ortolani, F.; Aprile, F. Principali caratteristiche stratigrafiche e strutturali dei depositi superficiali della Piana Campana. Boll. Soc. Geol. It. 1985, 104, 195–206. [Google Scholar]
- Costanzo, M.R.; Nunziata, C. Lithospheric vs. models in the Campanian Plain (Italy) by integrating Rayleigh wave dispersion data from noise cross-correlation functions and earthquake recordings. Phys. Earth Planet. Inter. 2014, 234, 45–59. [Google Scholar] [CrossRef]
- Cinque, A.; Ascione, A.; Caiazzo, C. Distribuzione spazio-temporale e caratterizzazione della fogliazione quaternaria in Appennino meridionale. In Le Ricerche del GNDT nel Campo della Pericolosità Sismica; Galadini, F., Meletti, C., Rebez, A., Eds.; CNR—Gruppo Nazionale per la Difesa dai Terremoti: Rome, Italy, 2000; pp. 203–218. [Google Scholar]
- Santangelo, N.; Romano, P.; Ascione, A.; Ermolli, E.R. Quaternary evolution of the Southern Apennines coastal plains: A review. Geol. Carpath. 2017, 68, 43–56. [Google Scholar] [CrossRef]
- Bianco, F.; Castellano, M.; Milano, G.; Ventura, G.; Vilardo, G. The Somma–Vesuvius stress field induced by regional tectonics: Evidences from seismological and mesostructural data. J. Volcanol. Geoth. Res. 1998, 82, 199–218. [Google Scholar] [CrossRef]
- Lanari, R.; De Natale, G.; Berardino, P.; Sansosti, E.; Ricciardi, G.P.; Borgstrom, S.; Capuano, P.; Pingue, P.; Troise, C. Evidence for a peculiar style of ground deformation inferred at Vesuvius volcano. Geophys. Res. Lett. 2002, 29, 1292. [Google Scholar] [CrossRef]
- De Vita, P.; Allocca, V.; Celico, F.; Fabbrocino, S.; Mattia, C.; Monacelli, G.; Musilli, I.; Piscopo, V.; Scalise, A.R.; Summa, G.; et al. Hydrogeology of continental southern Italy. J. Maps 2018, 14, 230–241. [Google Scholar] [Green Version]
- Esposito, L. Nuove conoscenze sulle caratteristiche idrogeochimiche della falda ad Oriente della città di Napoli (Campania). Q. Geol. Appl. 1998, 5. [Google Scholar]
- De Vivo, B.; Rolandi, G.; Gans, P.B.; Calvert, A.; Bohrson, W.A.; Spera, F.J.; Belkin, A.E. New constraints on the pyroclastic eruption history of the Campanian volcanic plain (Italy). Miner. Petrol. 2001, 73, 47–65. [Google Scholar] [CrossRef]
- Geological Survey of Italy (SGI) Database. Available online: http://www.isprambiente.gov.it/en/databases/soil-and-territory (accessed on 1 March 2019).
- Celico, P.; de Paola, P. La falda dell’area napoletana: Ipotesi sui meccanismi naturali di protezione e sulle modalità di inquinamento. In Atti Giornata di Studio “Acque per Uso Potabile”; CI ESSE I Centro Scientifico Internazionale: Milan, Italy, 1992; pp. 387C–412C. [Google Scholar]
- Autorità di Bacino Regionale Nord Occidentale della Campania. Il Contributo al Piano di Tutela delle Acque della Regione Campania; Grafica Montese snc: Naples, Italy, 2004; Volume I–III. [Google Scholar]
- Dati, F. Emungimenti e Subsidenza nell’Area Nord-Orientale di Napoli. Master’s Thesis, Università degli Studi di Napoli Federico II, Naples, Italy, 2006. [Google Scholar]
- Costabile, S. The national geoportal: The not-ordinary plan of environmental remote sensing. GEOmedia 2010, 14, 3. (In Italian) [Google Scholar]
- Di Martire, D.; Paci, M.; Confuorto, P.; Costabile, S.; Guastaferro, F.; Verta, A.; Calcaterra, D. A nation-wide system for landslide mapping and risk management in Italy: The second Not-ordinary Plan of Environmental Remote Sensing. Int. J. Appl. Earth Obs. 2017, 63, 143–157. [Google Scholar] [CrossRef]
- Ferretti, A.; Prati, C.; Rocca, F. Permanent scatterers in SAR interferometry. IEEE T. Geosci. Remote 2001, 39, 8–20. [Google Scholar] [CrossRef] [Green Version]
- Costantini, M.; Falco, S.; Malvarosa, F.; Minati, F. A new method for identification and analysis of persistent scatterers in series of SAR images. In Proceedings of the IGARSS 2008–2008 IEEE International Geoscience and Remote Sensing Symposium, IEEE, Boston, MA, USA, 6–11 July 2008; Volume 2, pp. 2–449. [Google Scholar]


| Displacement Rate | ERS1/2 1993–2000 | ENVISAT 2002–2006 |
|---|---|---|
| Highest value | 12.25 mm/yr | 5.40 mm/yr |
| Lowest value | −15.44 mm/yr | −16.20 mm/yr |
| Mean value | 0.87 mm/yr | −0.62 mm/yr |
| Standard deviation | 0.62 | 0.65 |
| PS density | 183.8 PSs/km2 | 192.5 PSs/km2 |
| Vertical Displacement | ERS1/2 1993–2000 | ENVISAT 2002–2006 |
|---|---|---|
| Highest displacement | 63.60 mm | 19.81 mm |
| Lowest displacement | −73.58 mm | −95.39 mm |
| Mean displacement | 7.94 mm | −5.11 mm |
| Standard deviation | 2.7 | 2.6 |
© 2019 by the authors. Licensee MDPI, Basel, Switzerland. This article is an open access article distributed under the terms and conditions of the Creative Commons Attribution (CC BY) license (http://creativecommons.org/licenses/by/4.0/).
Share and Cite
Coda, S.; Confuorto, P.; De Vita, P.; Di Martire, D.; Allocca, V. Uplift Evidences Related to the Recession of Groundwater Abstraction in a Pyroclastic-Alluvial Aquifer of Southern Italy. Geosciences 2019, 9, 215. https://doi.org/10.3390/geosciences9050215
Coda S, Confuorto P, De Vita P, Di Martire D, Allocca V. Uplift Evidences Related to the Recession of Groundwater Abstraction in a Pyroclastic-Alluvial Aquifer of Southern Italy. Geosciences. 2019; 9(5):215. https://doi.org/10.3390/geosciences9050215
Chicago/Turabian StyleCoda, Silvio, Pierluigi Confuorto, Pantaleone De Vita, Diego Di Martire, and Vincenzo Allocca. 2019. "Uplift Evidences Related to the Recession of Groundwater Abstraction in a Pyroclastic-Alluvial Aquifer of Southern Italy" Geosciences 9, no. 5: 215. https://doi.org/10.3390/geosciences9050215