
Exploring the Impact of Silicosis Incidence on Tuberculosis Mortality and Morbidity: A Multi-Country Study


Department of Family and Community Medicine, College of Medicine, Taibah University, Al-Madinah al-Munawwarah 42353, Saudi Arabia
Med. Sci. 2023, 11(4), 63; https://doi.org/10.3390/medsci11040063
Submission received: 16 August 2023
/
Revised: 3 September 2023
/
Accepted: 19 September 2023
/
Published: 1 October 2023
(This article belongs to the Section Pneumology and Respiratory Diseases)
Abstract
:Introduction: There are several risk factors attributed to tuberculosis (TB) mortality and morbidity. There are few studies and systematic reviews showing the association of silicosis and tuberculosis at a country level. Very limited studies have been conducted using multi-country data in studying the association of incidence of silicosis with TB mortality and morbidity. Hence, the aim of this research was to explore the association of incidence of silicosis and other important risk factors with TB mortality and morbidity using multi-country data. Methods: Data from 217 WHO region countries were utilized, sourcing TB-related statistics from the Institute of Health Metrics and Evaluation and additional risk factors from the Demographic and Health Survey, Global Burden of Disease, and World Bank for 2019. Regression analysis was conducted to examine the association between silicosis incidence and TB outcomes. Results: The study found an average silicosis incidence of 121.92 per 100,000 population. Additionally, 62.69% of the sample population are exposed to air pollution from solid fuel cooking. Sanitation access stands at an average of 59.67%. Regression outcomes indicate that while alcohol consumption’s influence on TB is not statistically significant, a unit increase in silicosis incidence significantly elevates TB deaths (235.9, p = 0.005), YLL (9399.3, p = 0.011), and YLD (910.8, p = 0.002). Conclusion: The burden of silicosis is found to be one of the important determinants of deaths, YLL, and YLD due to tuberculosis. Country-specific strategies to prevent and control silicosis is a need of the hour.
1. Introduction
Tuberculosis continues to be an important and major public health threat in low- and middle-income countries [1,2,3,4]. It was also prevailing as a leading cause of death from a single infectious agent ranking above HIV until the outbreak of COVID pandemic [2]. It was estimated that there were 10 million people with TB worldwide [2], and around 45 million with disability-adjusted life years (DALYs) [3]. Two-thirds of people affected with TB live in eight countries: India (27%), China (9%), Indonesia (8%), the Philippines (6%), Pakistan (5%), Nigeria (4%), Bangladesh (4%), and South Africa (3%), as reported in the WHO global TB report 2018 [1]. The same eight countries continue to be in the same place, with most TB cases affected in the Southeast Asian (43%), African (25%), and Western Pacific (18%) WHO regions, with smaller proportions living in the Eastern Mediterranean (8.3%), the Americas (3%), and Europe (2.3%) [2].
Approximately 122 million DALYs are attributed to incident tuberculosis, and it included 58 million DALYs due to post-tuberculosis sequalae [5]. Disruptions in TB-related health services due to the COVID-19 pandemic also contribute to TB morbidity, disability, and mortality [6,7].
The recent global TB report has highlighted five selected risk factors such as undernutrition, HIV infection, alcohol use disorders, smoking for incidence of TB, and diabetes. There are several other risk factors including indoor air pollution, housing conditions, and overcrowding, which are considered the important determinants of TB incidence and its further consequences.
There is a bidirectional association observed between tuberculosis and nutrition, i.e., individuals with a lower BMI for their age are considered to have higher odds of developing tuberculosis, and individuals who contracted TB would also lose weight. The undernutrition may reactivate latent TB or progress with primary infection [8].
Another important factor is HIV infection, which increases the risk of developing tuberculosis by 5 to 10%, compared to individuals without HIV [9]. The co-existence of HIV and TB further worsens both diseases [10].
Housing location, structure, and type, including slum residence, poor ventilation, kutcha (roof), dung floor, and crowding, significantly contributed to the incidence of TB [11,12,13]. A study showed higher prevalence of TB among people living in slum areas compared to non-slum areas. A high standard of living was negatively correlated with TB prevalence, and there was a less prevalence of TB with an improvement in the standard of living in slum areas. National level data showed that more than half of the incident TB cases was reduced when there was an additional window in a house [12].
Occupation-related health hazards exhibited that high silica exposure can lead to onset of tuberculosis worsen it if it adds on to the pre-existing TB. Importantly, this association is highly observed in low-income countries. Evidence showing the association of silicosis and TB from 19th century itself, but it has not received much attention [14]. Studies also showed that the prevention and control of silica exposure will be helpful in the prevention and control of TB [15].
The association of silicosis and tuberculosis morbidity and mortality is shown through cross-sectional studies; however, the focus on the issue is less. The use of a larger dataset for studying the same is also less. Hence, this study is aimed at studying the relationship of silicosis and tuberculosis morbidity and mortality in terms of years of life lost due to tuberculosis and disability-adjusted life years (DALYs) due to TB using multi-country data.
2. Methods
2.1. Study Design and Population
This study is a cross-sectional analysis examining the population across 217 countries, representing all continents and World Health Organization (WHO) regions. Our aim is to investigate the association between silicosis incidence and tuberculosis (TB) mortality and morbidity on a global scale.
2.2. Health Outcomes
The primary health outcomes of interest are TB mortality and morbidity. To quantify TB mortality, we used two specific measures: the number of TB-related deaths and Years of Life Lost (YLL) due to TB. For quantifying TB morbidity, we utilized Years Lived with Disability (YLD) as a measure.
2.3. Data Sources
TB measures: data for the outcome variables, specifically TB deaths, YLL, and YLD, were obtained from the Institute of Health Metrics and Evaluation (IHME).
Covariates and mediators: data for various covariates and possible mediators, including sanitation levels, clean drinking water availability, indoor air pollution, and overcrowding, were sourced from the Demographic and Health Survey (DHS), Global Burden of Disease studies, and World Bank for the year 2019. See Supplementary Table S1 for a comprehensive list of variables and their respective data sources.
2.4. Variables
Dependent variables: TB deaths, YLL, and YLD due to TB across 217 countries.
Independent variable: the primary independent variable is the incidence rate of silicosis in these countries.
Covariates: additional covariates include sanitation levels, availability of clean drinking water, indoor air pollution levels (measured through clean cooking fuel usage), and overcrowding rates. See Table 1 for the list of variables used.
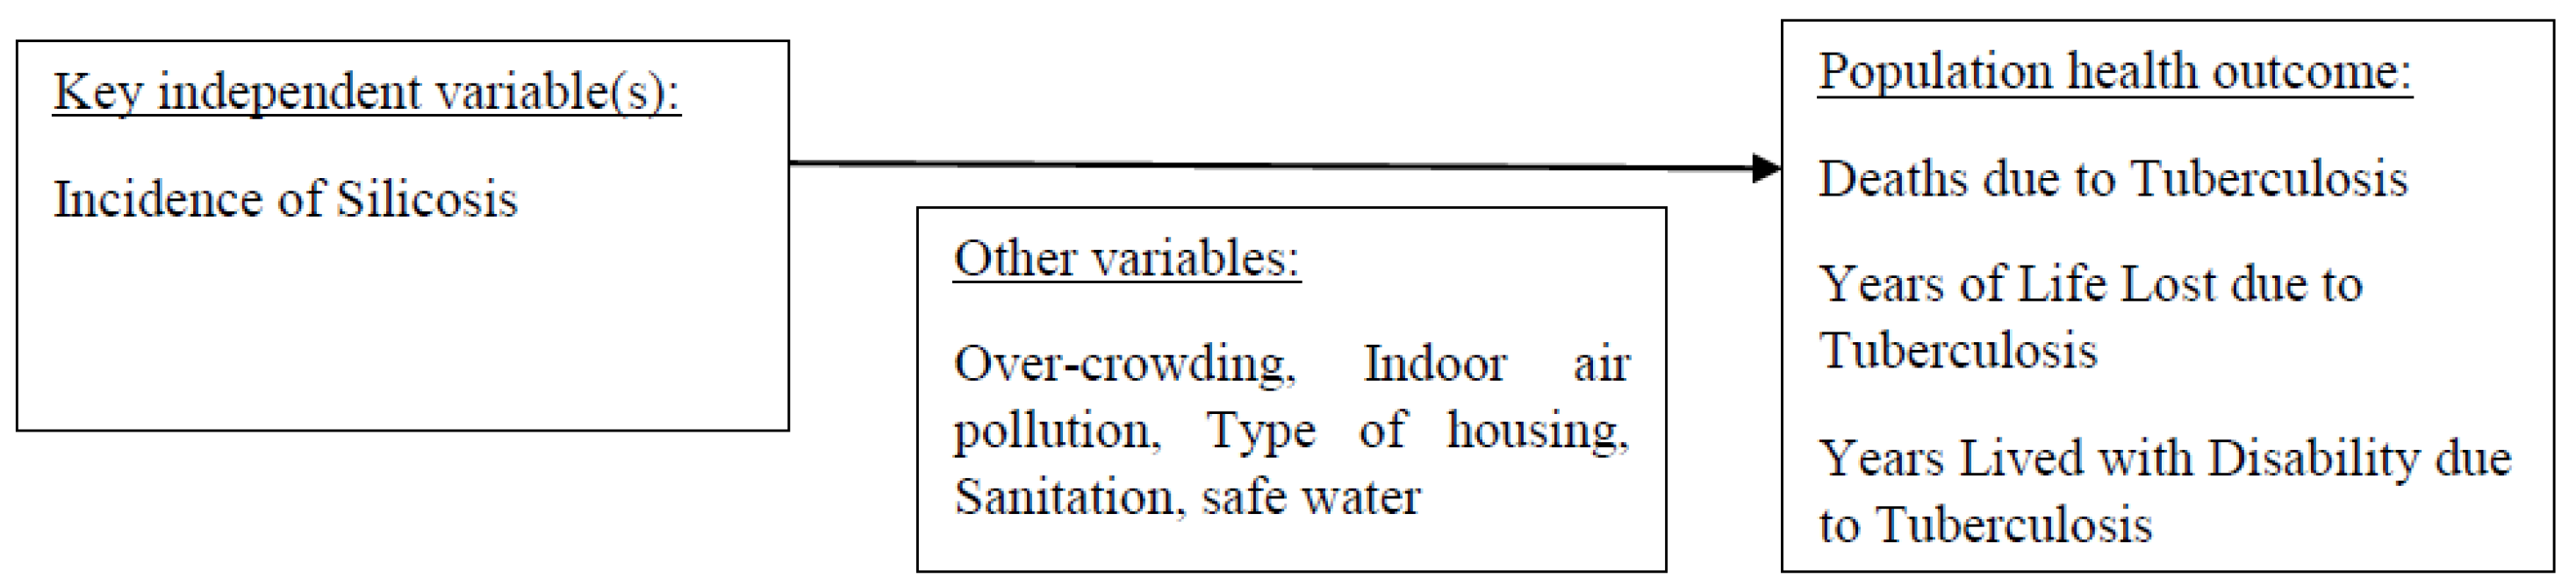
2.5. Analytic Framework
The analytic framework, detailing the relationships between these variables, is illustrated in Figure 1.
2.6. Statistical Analysis
Descriptive analysis: initial descriptive analyses were performed to understand the basic trends and distributions in the data.
Linear regression: we employed Ordinary Least Squares (OLS) regression analysis to investigate the impact of silicosis incidence and other covariates on TB mortality and morbidity.
Rationale for OLS: OLS was chosen because it is effective for understanding directed dependencies among different variables, allowing us to estimate the linear relationships between them.
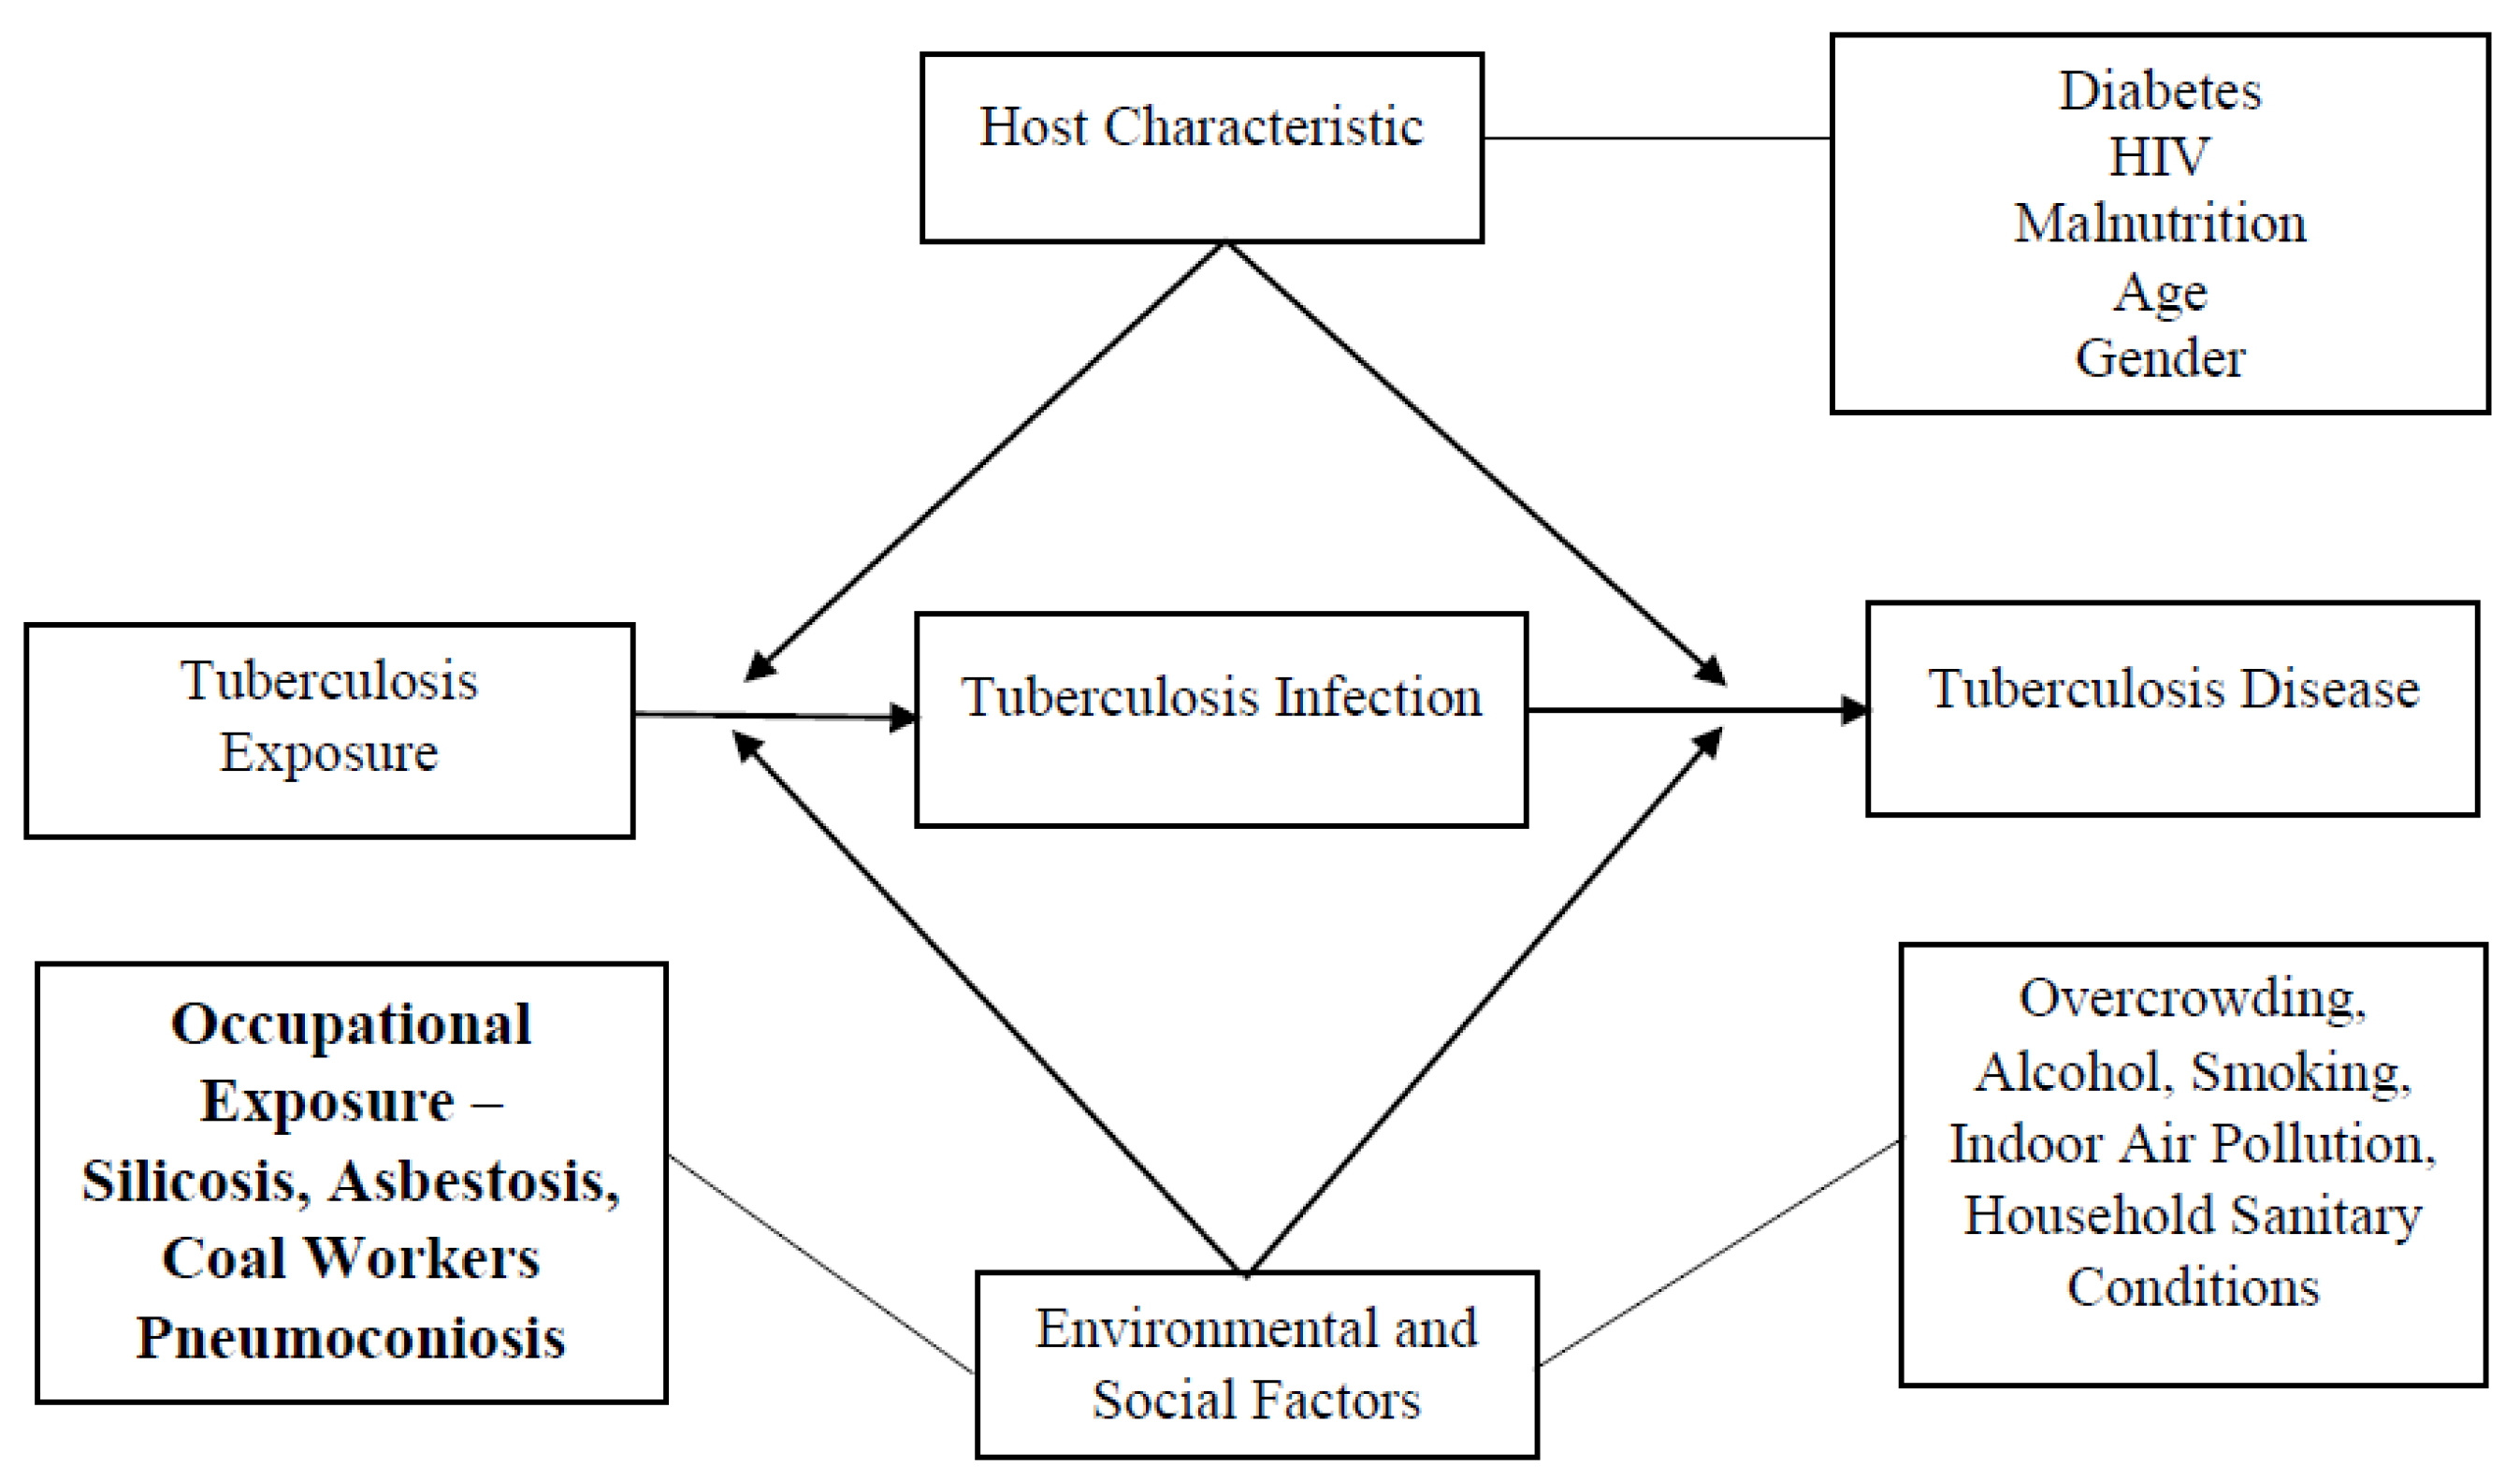
2.7. Conceptual Framework
The study is guided by a conceptual framework that outlines the potential occupational exposures leading to TB, which is presented in Figure 2.
3. Results
Descriptive Statistics
The descriptive statistics for the whole sample of 217 countries is provided in Table 1. Globally, the average incidence of silicosis in the sample is 121.92 per 100,000 population. The average proportion of population having access to adequate sanitation is 59.67%. Globally, the prevalence of malnutrition is 10.37%. A total of 28.16% of the population is below the national poverty lines. Overcrowding is present in 24.41% of the population, who have only one room in the house for sleeping, with 2.57% of the households having more than seven persons sleeping in the same room. A total of 24.29% of the population are exposed to smoking in the household daily. A total of 62.69% of the population are exposed to air pollution due to the use of solid fuels for cooking.
Table 2 provides the descriptive statistics of the different variables by country. In some countries such as China, the incidence of silicosis is 32,205 per 100,000 population, while in other countries such as the Bahamas, Andorra, and Cyprus, it is 0 per 100,000 population. Poverty head count varied from 76.4% in South Sudan to only 0.6% in China. The prevalence of malnutrition varied from 43% in Madagascar to just 3% in some countries like Sweden and New Zealand. A total of 19.8% of the population in Uganda lived in houses with dung floors, while 0.1% of population in Afghanistan lived in houses with dung floors. A total of 13.3% of the households in Nicaragua were found to have more than seven persons sleeping per room, while only 0.1% of the households in Albania had overcrowding in the house. See SI, Supplementary Table S2 for the data on the incidence of TB, prevalence of TB, deaths due to tuberculosis, YLLs due to tuberculosis, and YLD due to tuberculosis in different countries.
Table 3 shows the linear regression analysis on the effect of the incidence of silicosis and other factors on mortality due to tuberculosis. For every unit increase in incidence of silicosis per 100,000 population, the number of deaths due to tuberculosis increases by 235.86 and it is statistically significant (p = 0.005). For every 1% of people using safely managed sanitation services in the country, the death due to tuberculosis decreases by 154. For a 1% increase in the prevalence of malnutrition in the country, the deaths due to tuberculosis increases by 155.31. A 1% increase in the total alcohol consumption per capita leads to an increase of 2025.25 tuberculosis deaths. For every 1% increase in the proportion of the population below the poverty line in the country, the number of deaths due to tuberculosis increases by 27.17. For every 1% increase in the percentage of population living in households with adequate handwashing facilities, there is a 57.41 decrease in the number of tuberculosis deaths. A 1% increase in the proportion of people living in houses with dung floors, leads to an increase of 153.44 deaths due to tuberculosis. For every 1% increase in the proportion of households with more than seven persons sleeping per room, there is an increase of 1494.05 in the number of tuberculosis deaths. All of the independent variables except the incidence of silicosis are not statistically significant.
Table 4 shows the linear regression analysis of the effect of the incidence of silicosis and other factors on the years of life lost (YLL) due to tuberculosis. For every unit increase in incidence of silicosis per 100,000 population, the YLL due to tuberculosis increases by 9399.24 years, and this is statistically significant (p = 0.011). For a 1% in the proportion of people using safely managed sanitation services in the country, the YLL due to tuberculosis decreases by 8419. For a 1% increase in the prevalence of malnutrition in the country, the YLL due to tuberculosis increases by 7269.69. A 1% increase in the total alcohol consumption per capita leads to an increase of 90,100.11 YLLs due to tuberculosis. For every 1% increase in the proportion of the population below the poverty line in the country, the YLL due to tuberculosis increases by 2397.44. For every 1% increase in the percentage of population living in households with adequate handwashing facilities, there is a 1712.70 decrease in YLL due to tuberculosis. For every 1% increase in the proportion of households with more than seven persons sleeping per room, there is an 83,127.44 increase in the YLLs due to tuberculosis. All of the independent variables except the incidence of silicosis are not statistically significant.
Table 5 shows the linear regression analysis on the effect on the incidence of silicosis and other factors on the years lived with disability (YLD) due to tuberculosis. For every unit increase in incidence of silicosis per 100,000 population, the YLD due to tuberculosis increases by 233.74 years, and this is statistically significant (p = 0.002). For every unit increase in incidence of silicosis per 100,000 population, the YLD due to tuberculosis increased by 910.76 years, and this is statistically significant. For a 1% increase in the proportion of people using safely managed sanitation services in the country, the YLD due to tuberculosis decreased by 912.55. For a 1% increase in the prevalence of malnutrition in the country, the YLD due to tuberculosis increases by 35.06%. A 1% increase in the total alcohol consumption per capita leads to an increase of 7450.92 YLDs due to tuberculosis. For every 1% increase in the proportion of the population below the poverty line in the country, the YLDs due to tuberculosis increases by 299.46 years. For every 1% increase in the percentage of the population living in households with adequate handwashing facilities, there is a 47.02 decrease in YLDs due to tuberculosis. For every 1% increase in the proportion of households with more than seven persons sleeping per room, there is an 8468.54 increase in the YLDs due to tuberculosis. All of the independent variables except the incidence of silicosis are not statistically significant.
4. Discussion
Tuberculosis (TB), caused by the bacteria Mycobacterium tuberculosis (Mtb), is one of the world’s top ten causes of death, and the greatest cause of death from a single infectious agent. M. tuberculosis is predicted to infect around 1.7 billion people, which is almost 22% of the world’s population [16]. The goal of this study was to look into tuberculosis-related mortality and morbidity. This is the first study ever done to look into incidence of silicosis among prognostic effects of TB such as YLL and DALYs. Occupational hazards, particularly silicosis, were discovered to be potential factors that cause or worsen tuberculosis.
This study showed that incidence of silicosis among tuberculosis patients was found to be 121.92 per 100,000 in the population investigated in 217 nations. The prevalence of silicosis was found to be higher in China, but lowest in the Bahamas, Andorra, and Cyprus. A systematic review and meta-analysis also suggesting strong evidence of an elevated risk of tuberculosis with radiological silicosis [17]. Silicosis is still a major health concern in many countries. Evidence shows that patients with silicosis have a higher risk of developing pulmonary tuberculosis than those without the disease [18] and also higher odds of dying among persons with tuberculosis [19,20].
Household sanitation, air pollution, and health are some of the other potential variables. According to the World Health Organization [21], exposure to household air pollution nearly doubles the risk of paediatric pneumonia and accounts for 45 percent of all pneumonia deaths in children under the age of five. Adults account for 28% of the population. Our findings showed that use of solid fuels in cooking causes indoor air pollution that affects 62.69 percent of the population.
Only 0.1 percent of houses in Albania reported overcrowding, but 13.3% of Nicaraguan households had more than seven people sleeping in each room. According to a study conducted in India by Singh et al., family members who were routinely (daily) exposed to smoke (second-hand smoke) inside the house were more likely to get tuberculosis than those who did not smoke inside the house. Further, it demonstrated that homes with finished walls are less likely to contract tuberculosis than those with mud walls [22]. Tuberculosis is more likely to spread in houses that share toilets with other households, whereas regression analysis showed that safely managed sanitation has a major contribution towards decreasing deaths due to TB, YLL, and also YLD due to TB, but it failed to achieve statistical significance.
Another primary determinant that is more responsible for the incidence of tuberculosis is nutritional status of the population. Malnutrition was observed to be present in an average of 10.37 (11.28) percent of the population. Malnutrition rates ranged from 43 percent in Madagascar to only 3 percent in countries like Sweden and New Zealand. Berhanu et al. discovered that 57.17 percent of TB patients were underweight, and 88.52 percent of them were anaemic, whereas 23.37 percent of non-TB inhabitants were malnourished [23]. Dimpal et al. investigated the link between multidimensional poverty and tuberculosis in India and discovered that the prevalence of tuberculosis is much higher among the multidimensional poor in India than in the multidimensional non-poor [24].
Another important condition that co-exists and further worsens TB is HIV, and our finding showed that it is prevalent among 1.78 (4.17) percent of the study population. Of the 10,000,000 people diagnosed with tuberculosis worldwide, 862, 000 tested positive for HIV [25]. There is a disruption in health services for tuberculosis due to the COVID pandemic and further changes in the health management of the countries. It is estimated that there around 1.5 million people died from TB in 2020, including 214,000 among HIV-positive people. The projections by WHO also suggest that there would be high incidence of TB and deaths due to TB in 2021 and 2022 [26].
Another co-epidemic of TB is diabetes, and it is on the rise worldwide, currently affecting 536.6 million people globally [27]. In our study, diabetes was reported among 8.33 percent of people (4.73) on average. Patients with TB-DM had a greater risk of treatment failure and mortality than those with TB alone, according to studies conducted by Gautam et al. and Khalil et al. in South Asia and Egypt, respectively [28,29].
The burden of tuberculosis mortality continues to hinder socio-economic progress in poor nations, with the Southeast Asian, Western Pacific, and African areas accounting for more than 90% of TB deaths in 2016 [30]. Although there are well-established links between social factors and TB morbidity and death, there are few investigations on the underlying processes that link social determinants to TB treatment outcomes and effective interventions.
Patient and community/social factors are two types of factors linked to patient survival in patients with tuberculosis. Most patient factors can be defined in terms of the health system in the CSDH paradigm, whereas community/social factors are linked to structural determinants of health and health disparities. Age, sex, alcohol usage, cigarette smoking, past history of TB treatment, HIV co-infection, and concomitant diseases, as well as TB diagnostic technologies and treatment regimens, are all factors to consider. The existence of education, work, access to health care, and protection against catastrophic cost associated with TB morbidity are all structural determinants of health linked to TB survival [31]. This is in agreement with our findings that when proper sanitation was practiced, there was a decrease in the mortality among the TB population.
The incidence of silicosis was found to be statistically significantly linked with mortality among tuberculosis patients, among the probable causes of TB addressed. According to a study conducted by Nasrullah et al. in the United States from 1968 to 2006, among pulmonary tuberculosis patients, silicosis patients had a greater mortality rate than non-silicosis patients. This emphasizes the importance of paying attention to silicosis prevention in the general population [15]. A 13-year national cohort observational research programme was conducted in Taiwan to investigate the prognostic influence of tuberculosis on patients with occupational lung disease. Despite Taiwan’s low prevalence of occupational lung disorders, patients with those diseases had a greater rate of tuberculosis (TB) than the overall population [32].
Deaths from silicosis outbreaks are continuously being reported in both developing and developed countries, and silica exposure from various industries is still a major occupational health problem. The third-biggest cause of YLL in the country is death from tuberculosis [33]. A Serbian study used YLL to quantify the burden of tuberculosis, and discovered that the incidence of tuberculosis was higher in males than females [34]. Furthermore, as people get older, TB incidence and death, as well as DALY rates, rise [35]. In our investigation, silicosis was found to be a substantial contributor to YLL in the population investigated, despite the fact that other factors were not. To back up these findings, twelve-year longitudinal research in Turkey looked at premature mortality among people with pulmonary tuberculosis, and discovered that silicosis was one of the factors involved [36].
The impact of silicosis incidence and other factors on the number of years spent with disability by tuberculosis was investigated in this study. In the population investigated, the incidence of silicosis has been found to be directly related to the YLD, owing to tuberculosis. The YLD due to tuberculosis was found to be directly linked to malnutrition and house sanitation. This link, however, was not statistically significant. According to a study conducted by Tarrant County Public Health, a total of 1189 DALYS were lost by 177 persons affected with TB, which included 23% from YLL, 2% from acute YLD, and 75% were from chronic YLD. This indicates the not only the burden is high and also pulmonary impairment after was observed to be the important cause for the burden [37].
According to a systematic review which included 131 unique studies, mental health disorders (23.1%), respiratory impairment (20.7%), musculoskeletal impairment (17.1%), hearing impairment (14.5%), visual impairment (9.8%), renal impairment (5.7%), and neurological impairment (1.6%) were shown to be the most common types of disabilities [38]. The silica exposure or silicosis may impair the body organs including the pulmonary impairment, hence screening for silica exposure is important when an individual seeks health care with symptoms for suspected TB. A high proportion of people in South Africa are exposed to silica dust, followed by countries like India, China, and Brazil [39,40,41]. A review and meta-analysis also showed that the estimated effect is more uncertain for silica exposure without radiological silicosis and, hence, suggestive of a need for cohort studies aiming to studying silica exposure at different threshold levels in different settings, and also to assess the association of silicosis and tuberculosis [17].
5. Conclusions
The burden of silicosis is found to be one of the important determinants of deaths, YLL, and YLD due to tuberculosis. This study demonstrated that there is a significant association of silicosis and TB. Hence there is a dire need for the multi-level strategies to prevent tuberculosis and, importantly, to frame national level measures to prevent and control silica exposure, thereby preventing tuberculosis in high-TB-burden countries.
6. Strengths and Limitations
The primary strengths of this investigation stem from the utilization of secondary data sourced from several international agencies, known for their reliable and robust data collection methodologies, alongside adequate quality control measures. Conversely, the key limitations of this study are also tethered to the use of secondary data. This is a common drawback in any study relying on secondary data, as the scope of the study becomes confined by the previously collected data and the survey methodology employed. The nature of the questions posed in the survey restricts the breadth of our research inquiries to align with the available data for analysis. Additionally, this study employed cross-sectional data, lacking a temporal follow-up. The cross-sectional characteristic of the data significantly limits the study, as it only enables the examination of associations, rather than establishing a direct causation between mortality and morbidity due to tuberculosis and occupational exposure to silicosis. The inability of cross-sectional data to infer causal relations primarily arises from the absence of temporality, thereby hindering the assessment of outcome alterations over time.
Supplementary Materials
The following supporting information can be downloaded at: https://www.mdpi.com/article/10.3390/medsci11040063/s1. Table S1: A comprehensive list of variables and their respective data sources; Table S2: The data on the incidence of TB, prevalence of TB, deaths due to tuberculosis, YLLs due to tuberculosis, and YLD due to tuberculosis in different countries.
Funding
This research received no external funding.
Institutional Review Board Statement
Not applicable.
Informed Consent Statement
Not applicable.
Data Availability Statement
The datasets used for the current study are available from the corresponding author on reasonable request.
Conflicts of Interest
The author declares that he has no competing interest.
References
- World Health Organization. Global Tuberculosis Report 2019; World Health Organization: Geneva, Switzerland, 2019; Available online: https://apps.who.int/iris/bitstream/handle/10665/329368/9789241565714-eng.pdf (accessed on 15 December 2021).
- World Health Organization. Global Tuberculosis Report 2021; World Health Organization: Geneva, Switzerland, 2021. [Google Scholar]
- GBD 2017 DALYs and HALE Collaborators. Global, regional, and national disability-adjusted life-years (DALYs) for 359 diseases and injuries and healthy life expectancy (HALE) for 195 countries and territories, 1990–2017: A systematic analysis for the Global Burden of Disease Study 2017. Lancet 2018, 392, 1859–1922. [Google Scholar] [CrossRef] [PubMed]
- GBD Tuberculosis Collaborators. Global, regional, and national burden of tuberculosis, 1990–2016: Results from the Global Burden of Diseases, Injuries, and Risk Factors 2016 Study. Lancet Infect. Dis. 2018, 18, 1329–1349. [Google Scholar] [CrossRef] [PubMed]
- Menzies, N.A.; Quaife, M.; Allwood, B.W.; Byrne, A.L.; Coussens, A.K.; Harries, A.D.; Marx, F.M.; Meghji, J.; Pedrazzoli, D.; Salomon, J.A.; et al. Lifetime burden of disease due to incident tuberculosis: A global reappraisal including post-tuberculosis sequelae. Lancet Glob. Health 2021, 9, e1679–e1687. [Google Scholar] [CrossRef] [PubMed]
- Alene, K.A.; Wangdi, K.; Clements, A.C. Impact of the COVID-19 pandemic on tuberculosis control: An overview. Trop. Med. Infect. Dis. 2020, 5, 123. [Google Scholar] [CrossRef] [PubMed]
- McQuaid, C.F.; McCreesh, N.; Read, J.M.; Sumner, T.; Houben, R.M.G.J.; White, R.G.; Harris, R.C.; CMMID COVID-19 Working Group. The potential impact of COVID-19-related disruption on tuberculosis burden. Eur. Respir. J. 2020, 56, 2001718. [Google Scholar] [CrossRef] [PubMed]
- Semba, R.D.; Darnton-Hill, I.; De Pee, S. Addressing tuberculosis in the context of malnutrition and HIV coinfection. Food Nutr. Bull. 2010, 31, 345–364. [Google Scholar] [CrossRef]
- Kumarasamy, N.; Vallabhaneni, S.; Flanigan, T.P.; Mayer, K.H.; Solomon, S. Clinical profile of HIV in India. Indian J. Med Res. 2005, 121, 377–394. [Google Scholar]
- Narasimhan, P.; Wood, J.; Macintyre, C.R.; Mathai, D. Risk factors for tuberculosis. Pulm. Med. 2013, 2013, 828939. [Google Scholar] [CrossRef]
- Dhanaraj, B.; Papanna, M.K.; Adinarayanan, S.; Vedachalam, C.; Sundaram, V.; Shanmugam, S.; Sekar, G.; Menon, P.A.; Wares, F.; Swaminathan, S. Prevalence and risk factors for adult pulmonary tuberculosis in a metropolitan city of south India. PLoS ONE 2015, 10, e0124260. [Google Scholar] [CrossRef]
- Marimuthu, P. Tuberculosis prevalence and socio-economic differentials in the slums of four metropolitan cities of India. Indian J. Tuberc. 2016, 63, 167–170. [Google Scholar] [CrossRef]
- Rao, V.G.; Bhat, J.; Yadav, R.; Sharma, R.K.; Muniyandi, M. A comparative study of the socioeconomic risk factors for pulmonary tuberculosis in the Saharia tribe of Madhya Pradesh, India. Trans. R. Soc. Trop. Med. Hyg. 2018, 112, 272–278. [Google Scholar] [CrossRef] [PubMed]
- WHO and the Global Occupational Health Network. Elimin. Silicosis 2007, 12, 1–18. Available online: https://www.who.int/occupational_health/publications/newsletter/gohnet12e.pdf?ua=1 (accessed on 12 December 2021).
- Nasrullah, M.; Mazurek, J.M.; Wood, J.M.; Bang, K.M.; Kreiss, K. Silicosis Mortality with Respiratory Tuberculosis in the United States, 1968–2006. Am. J. Epidemiol. 2011, 174, 839–848. [Google Scholar] [CrossRef] [PubMed]
- World Health Organization. The Top 10 Causes of Death 2020. Available online: https://www.who.int/en/news-room/fact-sheets/detail/the-top-10-causes-of-death (accessed on 16 December 2021).
- Ehrlich, R.; Akugizibwe, P.; Siegfried, N.; Rees, D. The association between silica exposure, silicosis and tuberculosis: A systematic review and meta-analysis. BMC Public Health 2021, 21, 953. [Google Scholar] [CrossRef]
- Targeted tuberculin testing and treatment of latent tuberculosis infection. MMWR Morb. Mortal. Wkly. Rep. 2000, 49, 1–51.
- Calvert, G.M.; Rice, F.L.; Boiano, J.M.; Sheehy, J.W.; Sanderson, W.T. Occupational silica exposure and risk of various diseases: An analysis using death certificates from 27 states of the United States. Occup. Environ. Med. 2003, 60, 122–129. [Google Scholar] [CrossRef]
- Chen, G.X.; Burnett, C.A.; Cameron, L.L.; Alterman, T.; Lalich, N.R.; Tanaka, S.; Althouse, R.B. Tuberculosis mortality and silica exposure: A case–control study based on a national mortality database for the years 1983–1992. Int. J. Occup. Environ. Health 1997, 3, 163–170. [Google Scholar] [CrossRef]
- World Health Organization. Household Air Pollution and Health. 2021. Available online: https://www.who.int/news-room/fact-sheets/detail/household-air-pollution-and-health (accessed on 17 December 2021).
- Singh, S.K.; Kashyap, G.C.; Puri, P. Potential effect of household environment on prevalence of tuberculosis in India: Evidence from the recent round of a cross-sectional survey. BMC Pulm. Med. 2018, 18, 66. [Google Scholar] [CrossRef]
- Feleke, B.E.; Feleke, T.E.; Biadglegne, F. Nutritional status of tuberculosis patients, a comparative cross-sectional study. BMC Pulm. Med. 2019, 19, 182. [Google Scholar] [CrossRef]
- Pathak, D.; Vasishtha, G.; Mohanty, S.K. Association of multidimensional poverty and tuberculosis in India. BMC Public Health 2021, 21, 2065. [Google Scholar] [CrossRef]
- MacNeil, A.; Glaziou, P.; Sismanidis, C.; Date, A.; Maloney, S.; Floyd, K. Global Epidemiology of Tuberculosis and Progress Toward Meeting Global Targets—Worldwide, 2018. MMWR Morb. Mortal. Wkly. Rep. 2020, 69, 281–285. [Google Scholar] [CrossRef] [PubMed]
- World Health Organization. Available online: https://www.who.int/news/item/14-10-2021-tuberculosis-deaths-rise-for-the-first-time-in-more-than-a-decade-due-to-the-covid-19-pandemic (accessed on 16 December 2021).
- International Diabetes Federation. IDF Atlas 10th Edition 2021. Available online: https://diabetesatlas.org/idfawp/resource-files/2021/07/IDF_Atlas_10th_Edition_2021.pdf (accessed on 17 December 2021).
- Gautam, S.; Shrestha, N.; Mahato, S.; Nguyen, T.P.A.; Mishra, S.R.; Berg-Beckhoff, G. Diabetes among tuberculosis patients and its impact on tuberculosis treatment in South Asia: A systematic review and meta-analysis. Sci. Rep. 2021, 11, 2113. [Google Scholar] [CrossRef] [PubMed]
- Khalil, N.H.; Ramadan, R.A. Study of risk factors for pulmonary tuberculosis among diabetes mellitus patients. Egypt. J. Chest Dis. Tuberc. 2016, 65, 817–823. [Google Scholar] [CrossRef]
- Global Tuberculosis Report. 2017. Available online: https://www.who.int/tb/publications/global_report/gtbr2017_main_text.pdf (accessed on 16 December 2021).
- World Health Organization. A Conceptual Framework for Action on the Social Determinants of Health. World Health Organization. 2010. Available online: https://apps.who.int/iris/handle/10665/44489 (accessed on 16 December 2021).
- Hung, C.L.; Su, P.L.; Ou, C.Y. Prognostic effect of tuberculosis on patients with occupational lung diseases: A 13-year observational study in a nationwide cohort. Medicine 2016, 95, e4748. [Google Scholar] [CrossRef]
- Report of the Joint TB Monitoring Mission, India. 2015. Available online: http://www.tbonline.info/media/uploads/documents/jmmdraft2015.pdf (accessed on 18 December 2021).
- Zorana Gledovic, Z.; Vlajinac, H.; Pekmezovic, T.; Grujicic-Sipetic, S.; Grgurevic, A.; Pesut, D. Burden of tuberculosis in Serbia. Am. J. Infect. Control. 2006, 34, 676–679. [Google Scholar] [CrossRef]
- Selvaraju, S.; Thiruvengadam, K.; Watson, B.; Thirumalai, N.; Malaisamy, M.; Vedachalam, C.; Swaminathan, S.; Padmapriyadarsini, C. Long-term Survival of Treated Tuberculosis Patients in Comparison to a General Population in South India: A Matched Cohort Study. Int. J. Infect. Dis. 2021, 110, 385–393. [Google Scholar] [CrossRef]
- Altundaş Hatman, E.; Acar Karagül, D.; Kuman Oyman, E.; Tüzün, B.; Şimşek, K.O.; Kılıçaslan, Z. Premature Deaths Due to Silicosis in Turkey, 2006-2017: A Twelve-Year Longitudinal Study. Balk. Med. J. 2021, 38, 374–381. [Google Scholar] [CrossRef]
- Pasipanodya, J.G.; McNabb, S.J.; Hilsenrath, P.; Bae, S.; Lykens, K.; Vecino, E.; Munguia, G.; Miller, T.L.; Drewyer, G.; Weis, S.E. Pulmonary impairment after tuberculosis and its contribution to TB burden. BMC Public Health 2010, 10, 259. [Google Scholar] [CrossRef]
- Alene, K.A.; Wangdi, K.; Colquhoun, S.; Chani, K.; Islam, T.; Rahevar, K.; Morishita, F.; Byrne, A.; Clark, J.; Viney, K. Tuberculosis related disability: A systematic review and meta-analysis. BMC Med. 2021, 19, 203. [Google Scholar] [CrossRef]
- Ehrlich, R.I.; Montgomery, A.; Akugizibwe, P.; Gonsalves, G. Health implications of changing trends in the origins and characteristics of mineworkers in South Africa, 1973–2012. BMC Public Health 2017, 8, 93. [Google Scholar] [CrossRef]
- Brouwer, D.H.; Rees, D. Can the South African milestones for reducing exposure to respirable crystalline silica and silicosis be achieved and reliably monitored? Front. Public Health 2020, 8, 107. [Google Scholar] [CrossRef] [PubMed]
- Rees, D.; Silica, M.J. Parkes’ Occupational Lung Disorders, 4th ed.; Newman Taylor, A., Cullinan, P., Blanc, P., Pickering, A., Eds.; CRC Press: Boca Raton, FL, USA, 2016; Chapter 18; pp. 187–205. [Google Scholar]
Figure 1.
Analytic framework.

Figure 2.
Conceptual framework of occupational exposure and tuberculosis disease.


Table 1.
Descriptive statistics for whole sample.
| Variables | Definition | Mean (SD) |
|---|---|---|
| Silicosis | Incidence of silicosis | 121.92 (1124.04) |
| Sanitation | Percentage of the population using safely managed sanitation services | 59.67 (29.91) |
| Malnutrition | Prevalence of malnutrition | 10.37 (11.28) |
| Alcohol consumption | Total alcohol consumption per capita | 6.01 (4.14) |
| Poverty | Poverty headcount ratio—percentage of population below national poverty lines | 28.16 (17.08) |
| Handwashing facilities | Population living in household with handwashing facility | 39.32 (22.49) |
| Unsanitary household conditions | Population living in houses with dung floors | 3.02 (4.24) |
| Overcrowding | Households with more than seven persons sleeping per room | 2.57 (3.41) |
| Smoking | Population smoking in the household daily | 24.29 (15.94) |
| Diabetes | Prevalence of diabetes | 8.33 (4.73) |
| HIV | Prevalence of HIV | 1.78 (4.17) |
| Overcrowding in house | Population with one room for sleeping | 24.41 (13.74) |
| Indoor air pollution | Population using solid fuel for cooking | 62.69 (33.66) |
Table 2.
Descriptive statistics by country.
| S. No | Country | Incidence of Silicosis | People Using Safely Managed Sanitation Services | Prevalence of Malnutrition | Total Alcohol Consumption per Capita | Poverty Headcount Ratio | Population Living in Household with Handwashing Facility | Population Living in Houses with Dung Floors | Households with More than 7 Persons Sleeping per Room |
|---|---|---|---|---|---|---|---|---|---|
| 1 | Afghanistan | 56 | 26 | 0.2 | 54.5 | 51.1 | 0.1 | 5.7 | |
| 2 | Albania | 26 | 48 | 4 | 7.2 | 14.3 | 0.1 | ||
| 3 | Algeria | 104 | 18 | 3 | 0.9 | 5.5 | |||
| 4 | American Samoa | 0 | |||||||
| 5 | Andorra | 0 | 100 | 11 | |||||
| 6 | Angola | 56 | 17 | 6.9 | 32.3 | 0.1 | 3.7 | ||
| 7 | Antigua and Barbuda | 0 | 6.4 | ||||||
| 8 | Argentina | 167 | 51 | 4 | 9.7 | 42.9 | |||
| 9 | Armenia | 12 | 69 | 3 | 5.5 | 26.4 | 2.9 | 0.2 | 0.1 |
| 10 | Aruba | ||||||||
| 11 | Australia | 217 | 74 | 3 | 10.5 | ||||
| 12 | Austria | 63 | 100 | 3 | 12 | 13.3 | |||
| 13 | Azerbaijan | 20 | 21 | 3 | 4.4 | 6 | 0.8 | ||
| 14 | The Bahamas | 0 | 4.8 | ||||||
| 15 | Bahrain | 4 | 91 | 1.1 | |||||
| 16 | Bangladesh | 552 | 39 | 10 | 0 | 24.3 | 58.3 | 0 | 0.5 |
| 17 | Barbados | 1 | 4 | 9.7 | |||||
| 18 | Belarus | 36 | 74 | 3 | 11.4 | 4.8 | |||
| 19 | Belgium | 25 | 89 | 3 | 11.1 | 14.8 | |||
| 20 | Belize | 0 | 6 | 6.2 | |||||
| 21 | Benin | 10 | 8 | 2.8 | 38.5 | 47.9 | 1.2 | 1.8 | |
| 22 | Bermuda | 0 | |||||||
| 23 | Bhutan | 3 | 65 | 0.4 | 8.2 | ||||
| 24 | Bolivia | 26 | 53 | 13 | 4.4 | 37.2 | 3.2 | ||
| 25 | Bosnia and Herzegovina | 31 | 40 | 3 | 7.2 | 16.9 | |||
| 26 | Botswana | 11 | 29 | 6.6 | 19.3 | ||||
| 27 | Brazil | 937 | 49 | 3 | 7.4 | 0.6 | |||
| 28 | British Virgin Islands | ||||||||
| 29 | Brunei Darussalam | 1 | 3 | 0.5 | |||||
| 30 | Bulgaria | 87 | 72 | 3 | 12.7 | 23.8 | |||
| 31 | Burkina Faso | 18 | 14 | 12 | 41.4 | 80.5 | 6.7 | 0.9 | |
| 32 | Burundi | 25 | 7.2 | 64.9 | 93 | 0.9 | 0.3 | ||
| 33 | Cabo Verde | 1 | 15 | 5.6 | 35 | ||||
| 34 | Cambodia | 25 | 6 | 6.6 | 17.7 | 16.7 | 0 | 7.7 | |
| 35 | Cameroon | 25 | 5 | 5.7 | 37.5 | 61.8 | 0.1 | 1 | |
| 36 | Canada | 399 | 84 | 3 | 8.9 | ||||
| 37 | Cayman Islands | ||||||||
| 38 | Central African Republic | 13 | 14 | 48 | 2.4 | 62 | 1.6 | ||
| 39 | Chad | 12 | 10 | 32 | 1.4 | 42.3 | 22.4 | 1.3 | 4 |
| 40 | Channel Islands | 82 | |||||||
| 41 | Chile | 167 | 79 | 3 | 9.1 | 10.8 | |||
| 42 | China | 32205 | 70 | 3 | 7 | 0.6 | |||
| 43 | Colombia | 352 | 18 | 9 | 5.7 | 42.5 | 0.4 | ||
| 44 | Comoros | 2 | 0.7 | 42.4 | 37.4 | 2.2 | 2.4 | ||
| 45 | Dem. Rep. Congo | 240 | 13 | 42 | 2 | 63.9 | 1 | 3.3 | |
| 46 | Congo, Rep. | 13 | 38 | 9.3 | 40.9 | 12.2 | 1.4 | ||
| 47 | Costa Rica | 32 | 30 | 3 | 4.9 | 30 | |||
| 48 | Cote d’Ivoire | 24 | 15 | 2.7 | 39.5 | 45.2 | 0.4 | 1.8 | |
| 49 | Croatia | 36 | 68 | 3 | 9.2 | 18.3 | |||
| 50 | Cuba | 22 | 37 | 3 | 5.8 | ||||
| 51 | Curacao | ||||||||
| 52 | Cyprus | 0 | 77 | 3 | 10.8 | 14.7 | |||
| 53 | Czech Republic | 126 | 85 | 3 | 14.4 | 10.1 | |||
| 54 | Denmark | 3 | 92 | 3 | 10.3 | 12.5 | |||
| 55 | Djibouti | 3 | 37 | 16 | 0.4 | 21.1 | |||
| 56 | Dominica | 0 | 6 | 11.2 | |||||
| 57 | Dominican Republic | 12 | 8 | 6.7 | 21 | 0.4 | |||
| 58 | Ecuador | 36 | 42 | 12 | 4.2 | 33 | |||
| 59 | Egypt, Arab Rep. | 220 | 67 | 5 | 0.4 | 32.5 | 10.8 | 0.3 | |
| 60 | El Salvador | 35 | 9 | 3.9 | 26.2 | ||||
| 61 | Equatorial Guinea | 2 | 7.2 | 76.8 | |||||
| 62 | Eritrea | 13 | 1.4 | 69 | 9.6 | 13.4 | |||
| 63 | Estonia | 6 | 93 | 3 | 9.2 | 21.7 | |||
| 64 | Eswatini | 12 | 10 | 58.9 | 9.6 | 1.7 | |||
| 65 | Ethiopia | 227 | 7 | 16 | 2.4 | 23.5 | 52 | 9.9 | 11.5 |
| 66 | Faroe Islands | ||||||||
| 67 | Fiji | 8 | 6 | 3.3 | 29.9 | ||||
| 68 | Finland | 14 | 84 | 3 | 10.8 | 12.2 | |||
| 69 | France | 102 | 79 | 3 | 12.3 | 13.6 | |||
| 70 | French Polynesia | 4 | |||||||
| 71 | Gabon | 5 | 16 | 8.7 | 33.4 | 0.7 | |||
| 72 | Gambia, The | 2 | 29 | 14 | 3.5 | 48.6 | 84.6 | 0.3 | 0.7 |
| 73 | Georgia | 15 | 34 | 9 | 8.3 | 21.3 | |||
| 74 | Germany | 125 | 97 | 3 | 12.9 | 14.8 | |||
| 75 | Ghana | 31 | 13 | 6 | 2.8 | 23.4 | 35.6 | 0.1 | 1.6 |
| 76 | Gibraltar | ||||||||
| 77 | Greece | 1 | 92 | 3 | 10.2 | 17.9 | |||
| 78 | Greenland | 0 | 92 | ||||||
| 79 | Grenada | 0 | 9.5 | ||||||
| 80 | Guam | 2 | |||||||
| 81 | Guatemala | 83 | 17 | 2.5 | 59.3 | 20 | 1.6 | 5.6 | |
| 82 | Guinea | 11 | 1.1 | 43.7 | 52.9 | 11.5 | 1.5 | ||
| 83 | Guinea-Bissau | 2 | 12 | 5.4 | 69.3 | ||||
| 84 | Guyana | 1 | 5 | 6.9 | 0.3 | 1.4 | |||
| 85 | Haiti | 11 | 47 | 2.7 | 58.5 | 63.2 | 0.8 | 1.9 | |
| 86 | Honduras | 42 | 50 | 14 | 3.8 | 48 | 11.1 | 3 | |
| 87 | Hong Kong SAR, China | 86 | 3 | ||||||
| 88 | Hungary | 100 | 88 | 3 | 11.3 | 12.3 | |||
| 89 | Iceland | 0 | 84 | 3 | 9.1 | 8.8 | |||
| 90 | India | 5160 | 46 | 15 | 5.5 | 21.9 | 37.9 | 0.7 | 3.2 |
| 91 | Indonesia | 782 | 7 | 0.6 | 9.4 | 6.4 | 0 | 0.4 | |
| 92 | Iran, Islamic Rep. | 434 | 6 | 1 | |||||
| 93 | Iraq | 111 | 43 | 38 | 0.4 | 18.9 | |||
| 94 | Ireland | 1 | 83 | 3 | 12.9 | 13.1 | |||
| 95 | Isle of Man | ||||||||
| 96 | Israel | 1 | 95 | 3 | 4.2 | ||||
| 97 | Italy | 146 | 96 | 3 | 7.8 | 20.1 | |||
| 98 | Jamaica | 4 | 8 | 4.2 | 19.9 | ||||
| 99 | Japan | 1794 | 81 | 3 | 8 | ||||
| 100 | Jordan | 41 | 82 | 10 | 0.7 | 15.7 | 1.5 | ||
| 101 | Kazakhstan | 74 | 3 | 4.8 | 4.3 | 0.1 | |||
| 102 | Kenya | 120 | 25 | 2.8 | 36.1 | 24.8 | 8.1 | 1.8 | |
| 103 | Kiribati | 1 | 27 | 4 | 0.5 | 21.8 | |||
| 104 | Democratic People’s Republic of Korea, Dem. People’s Rep. | 473 | 42 | 3.8 | |||||
| 105 | Republic of Korea, Rep. | 682 | 100 | 3 | 9.7 | ||||
| 106 | Kosovo | 17.6 | |||||||
| 107 | Kuwait | 10 | 100 | 3 | 0 | ||||
| 108 | Kyrgyz Republic | 13 | 92 | 7 | 6.3 | 25.3 | 14.1 | 0.1 | 0.3 |
| 109 | Lao PDR | 20 | 61 | 5 | 10.7 | 18.3 | |||
| 110 | Latvia | 14 | 83 | 3 | 12.8 | 22.9 | |||
| 111 | Lebanon | 20 | 16 | 9 | 1.7 | 27.4 | |||
| 112 | Lesotho | 11 | 48 | 24 | 4.6 | 49.7 | 43 | 0.7 | |
| 113 | Liberia | 4 | 39 | 6.1 | 50.9 | 23.3 | 1.3 | 1.4 | |
| 114 | Libya | 17 | 22 | 0 | |||||
| 115 | Liechtenstein | 99 | |||||||
| 116 | Lithuania | 15 | 94 | 3 | 13.2 | 20.6 | |||
| 117 | Luxembourg | 0 | 97 | 3 | 12.9 | 17.5 | |||
| 118 | Macao SAR, China | 67 | 4 | ||||||
| 119 | Madagascar | 63 | 10 | 43 | 2 | 70.7 | 1 | 6.2 | |
| 120 | Malawi | 52 | 24 | 17 | 3.6 | 51.5 | 79.2 | 6.4 | 2 |
| 121 | Malaysia | 119 | 77 | 3 | 0.8 | 8.4 | |||
| 122 | Maldives | 1 | 2.2 | 8.2 | 1.8 | 0.9 | |||
| 123 | Mali | 17 | 20 | 10 | 1.3 | 41.9 | 60.9 | 6.5 | 1.2 |
| 124 | Malta | 0 | 92 | 3 | 8 | 17.1 | |||
| 125 | Marshall Islands | 0 | |||||||
| 126 | Mauritania | 4 | 9 | 0 | 31 | 17.5 | |||
| 127 | Mauritius | 4 | 6 | 4.3 | 10.3 | ||||
| 128 | Mexico | 702 | 57 | 7 | 5 | 43.9 | |||
| 129 | Micronesia, Fed. Sts. | 1 | 2.5 | 41.2 | |||||
| 130 | Moldova | 21 | 11.4 | 26.8 | |||||
| 131 | Monaco | 100 | |||||||
| 132 | Mongolia | 8 | 56 | 4 | 8.2 | 28.4 | |||
| 133 | Montenegro | 6 | 45 | 3 | 11.5 | 24.5 | |||
| 134 | Morocco | 101 | 39 | 4 | 0.7 | 4.8 | 0.4 | ||
| 135 | Mozambique | 60 | 31 | 2.3 | 46.1 | 33.1 | 4.2 | 1.4 | |
| 136 | Myanmar | 205 | 61 | 8 | 5.1 | 24.8 | 15.3 | 0.1 | 3.1 |
| 137 | Namibia | 10 | 20 | 5.4 | 17.4 | 45.4 | 1.9 | 1.2 | |
| 138 | Nauru | 3.7 | |||||||
| 139 | Nepal | 78 | 49 | 5 | 2.9 | 25.2 | 53.9 | 7.3 | 1 |
| 140 | The Netherlands | 6 | 97 | 3 | 9.6 | 13.6 | |||
| 141 | New Caledonia | 7 | |||||||
| 142 | New Zealand | 31 | 82 | 3 | 10.6 | ||||
| 143 | Nicaragua | 31 | 19 | 5.2 | 24.9 | 13.3 | |||
| 144 | Niger | 20 | 16 | 0.7 | 40.8 | 0 | 4.9 | ||
| 145 | Nigeria | 169 | 31 | 15 | 10.8 | 40.1 | 57.1 | 0.3 | 1.7 |
| 146 | North Macedonia | 12 | 3 | 6.2 | 21.6 | ||||
| 147 | Northern Mariana Islands | 1 | |||||||
| 148 | Norway | 25 | 65 | 3 | 7.4 | 12.7 | |||
| 149 | Oman | 11 | 8 | 0.8 | |||||
| 150 | Pakistan | 515 | 13 | 0.3 | 21.9 | 31.7 | 2.7 | 10 | |
| 151 | Palau | 24.9 | |||||||
| 152 | Panama | 26 | 8 | 8 | 22.1 | ||||
| 153 | Papua New Guinea | 69 | 25 | 1.4 | 39.9 | 33.6 | 3.4 | ||
| 154 | Paraguay | 30 | 60 | 9 | 7.6 | 26.9 | |||
| 155 | Peru | 107 | 53 | 9 | 6.4 | 20.2 | 1 | ||
| 156 | Philippines | 321 | 61 | 9 | 6.9 | 16.7 | 10.7 | 2.4 | |
| 157 | Poland | 266 | 91 | 3 | 11.7 | 15.4 | |||
| 158 | Portugal | 12 | 85 | 3 | 12 | 17.2 | |||
| 159 | Puerto Rico | 8 | 33 | ||||||
| 160 | Qatar | 8 | 97 | 1.6 | |||||
| 161 | Romania | 300 | 83 | 3 | 11.7 | 23.8 | |||
| 162 | Russian Federation | 841 | 61 | 3 | 11.2 | 12.1 | |||
| 163 | Rwanda | 29 | 35 | 8.9 | 38.2 | 59.3 | 0.2 | 0.2 | |
| 164 | Samoa | 1 | 48 | 5 | 2.7 | 20.3 | |||
| 165 | San Marino | 70 | |||||||
| 166 | Sao Tome and Principe | 0 | 35 | 12 | 5.9 | 66.7 | 0.8 | 1.2 | |
| 167 | Saudi Arabia | 80 | 59 | 4 | 0.2 | ||||
| 168 | Senegal | 14 | 24 | 8 | 0.8 | 46.7 | 26.3 | 1.2 | 1.3 |
| 169 | Serbia | 63 | 18 | 4 | 8.8 | 23.2 | |||
| 170 | Seychelles | 0 | 20.5 | 25.3 | |||||
| 171 | Sierra Leone | 7 | 14 | 26 | 5.7 | 56.8 | 25.5 | 0.8 | 0.7 |
| 172 | Singapore | 32 | 100 | 2 | |||||
| 173 | Sint Maarten (Dutch part) | ||||||||
| 174 | Slovak Republic | 67 | 82 | 4 | 11.1 | 11.9 | |||
| 175 | Slovenia | 23 | 72 | 3 | 11.9 | 12 | |||
| 176 | Solomon Islands | 4 | 17 | 1.8 | 12.7 | ||||
| 177 | Somalia | 38 | 32 | 60 | 0 | ||||
| 178 | South Africa | 419 | 7 | 9.5 | 55.5 | 46.5 | 3.1 | 0.6 | |
| 179 | South Sudan | 23 | 76.4 | ||||||
| 180 | Spain | 52 | 96 | 3 | 12.7 | 20.7 | |||
| 181 | Sri Lanka | 103 | 7 | 4.1 | 4.1 | ||||
| 182 | St. Kitts and Nevis | 8.9 | |||||||
| 183 | St. Lucia | 0 | 10.6 | 25 | |||||
| 184 | St. Martin (French part) | ||||||||
| 185 | St. Vincent and the Grenadines | 0 | 6 | 9.1 | |||||
| 186 | Sudan | 78 | 12 | 0.5 | 46.5 | ||||
| 187 | Suriname | 1 | 25 | 9 | 5.3 | ||||
| 188 | Sweden | 15 | 95 | 3 | 8.9 | 17.1 | |||
| 189 | Switzerland | 8 | 100 | 3 | 11.5 | 16 | |||
| 190 | Syrian Arab Republic | 40 | 0.2 | 35.2 | |||||
| 191 | Tajikistan | 15 | 3.3 | 26.3 | 23.1 | 0.5 | |||
| 192 | Tanzania | 113 | 26 | 25 | 11.3 | 26.4 | 38.1 | 3 | 0.5 |
| 193 | Thailand | 422 | 26 | 8 | 8.3 | 6.2 | |||
| 194 | Timor-Leste | 2 | 23 | 2.2 | 41.8 | 67.1 | 0.6 | 1.4 | |
| 195 | Togo | 7 | 9 | 20 | 2.5 | 55.1 | 1.1 | ||
| 196 | Tonga | 1 | 34 | 0.8 | 22.5 | ||||
| 197 | Trinidad and Tobago | 2 | 7 | 6.7 | |||||
| 198 | Tunisia | 36 | 81 | 3 | 2.1 | 15.2 | |||
| 199 | Turkey | 244 | 78 | 3 | 2 | 15 | 0.5 | ||
| 200 | Turkmenistan | 8 | 4 | 4.9 | |||||
| 201 | Turks and Caicos Islands | ||||||||
| 202 | Tuvalu | 6 | 1.5 | 26.3 | |||||
| 203 | Uganda | 72 | 15.1 | 20.3 | 41.4 | 19.8 | 2.8 | ||
| 204 | Ukraine | 281 | 72 | 3 | 8.3 | 1.1 | 0.1 | 0 | |
| 205 | United Arab Emirates | 30 | 99 | 4 | 3.9 | ||||
| 206 | United Kingdom | 795 | 98 | 3 | 11.4 | 18.6 | |||
| 207 | United States | 3324 | 98 | 3 | 9.9 | ||||
| 208 | Uruguay | 15 | 3 | 6.9 | 11.6 | ||||
| 209 | Uzbekistan | 63 | 3 | 2.6 | 14.1 | 0.5 | 0.7 | ||
| 210 | Vanuatu | 2 | 9 | 2.3 | 15.9 | ||||
| 211 | Venezuela, RB | 199 | 23 | 27 | 4.1 | 33.1 | |||
| 212 | Vietnam | 350 | 7 | 8.7 | 6.7 | 1.5 | |||
| 213 | Virgin Islands (U.S.) | 0 | |||||||
| 214 | West Bank and Gaza | 67 | 29.2 | ||||||
| 215 | Yemen, Rep. | 56 | 19 | 45 | 0.1 | 48.6 | 27.1 | 9.8 | 9 |
| 216 | Zambia | 47 | 6.5 | 54.4 | 39.4 | 4 | 2.2 | ||
| 217 | Zimbabwe | 58 | 26 | 4.7 | 38.3 | 62 | 11.7 | 0.6 |
Table 3.
Linear regression analysis of the factors affecting deaths due to tuberculosis.
| Characteristics | Coefficient | Standard Error | p Value |
|---|---|---|---|
| Incidence of silicosis | 235.86 | 68.21 | 0.005 |
| People using safely managed sanitation services | −154.07 | 334.69 | 0.654 |
| Prevalence of malnutrition | 155.31 | 433.95 | 0.727 |
| Total alcohol consumption per capita | 2025.25 | 1390.63 | 0.173 |
| Poverty headcount ratio | 27.17 | 272.02 | 0.92 |
| Population living in household with handwashing facility | −57.41 | 172.96 | 0.746 |
| Population living in houses with dung floors | 153.44 | 1653.01 | 0.928 |
| Households with more than seven persons sleeping per room | 1494.05 | 1647.13 | 0.384 |
Table 4.
Linear regression analysis of the factors affecting YLL due to tuberculosis.
| Characteristics | Coefficient | Standard Error | p Value |
|---|---|---|---|
| Incidence of silicosis | 9399.34 | 3067.74 | 0.011 |
| People using safely managed sanitation services | −8419.14 | 15,052.99 | 0.587 |
| Prevalence of malnutrition | 7269.69 | 19,517.08 | 0.717 |
| Total alcohol consumption per capita | 90,100.11 | 62,543.77 | 0.178 |
| Poverty headcount ratio | 2397.44 | 12,234.10 | 0.848 |
| Population living in household with handwashing facility | −1712.70 | 7778.96 | 0.830 |
| Households with more than seven persons sleeping per room | 83,127.44 | 74,079.86 | 0.286 |
Table 5.
Linear regression analysis of the factors affecting YLDs due to tuberculosis.
| Characteristics | Coefficient | Standard Error | p Value |
|---|---|---|---|
| Incidence of silicosis | 910.76 | 233.74 | 0.002 |
| People using safely managed sanitation services | −912.55 | 1146.91 | 0.443 |
| Prevalence of malnutrition | 35.06 | 1487.05 | 0.982 |
| Total alcohol consumption per capita | 7450.92 | 334765. | 0.146 |
| Poverty headcount ratio | 299.46 | 932.14 | 0.754 |
| Population living in household with handwashing facility | −47.02 | 592.69 | 0.938 |
| Households with more than seven persons sleeping per room | 8468.54 | 5644.29 | 0.162 |
Disclaimer/Publisher’s Note: The statements, opinions and data contained in all publications are solely those of the individual author(s) and contributor(s) and not of MDPI and/or the editor(s). MDPI and/or the editor(s) disclaim responsibility for any injury to people or property resulting from any ideas, methods, instructions or products referred to in the content. |
© 2023 by the author. Licensee MDPI, Basel, Switzerland. This article is an open access article distributed under the terms and conditions of the Creative Commons Attribution (CC BY) license (https://creativecommons.org/licenses/by/4.0/).
Share and Cite
MDPI and ACS Style
Albadrani, M. Exploring the Impact of Silicosis Incidence on Tuberculosis Mortality and Morbidity: A Multi-Country Study. Med. Sci. 2023, 11, 63. https://doi.org/10.3390/medsci11040063
AMA Style
Albadrani M. Exploring the Impact of Silicosis Incidence on Tuberculosis Mortality and Morbidity: A Multi-Country Study. Medical Sciences. 2023; 11(4):63. https://doi.org/10.3390/medsci11040063
Chicago/Turabian StyleAlbadrani, Muayad. 2023. "Exploring the Impact of Silicosis Incidence on Tuberculosis Mortality and Morbidity: A Multi-Country Study" Medical Sciences 11, no. 4: 63. https://doi.org/10.3390/medsci11040063
Note that from the first issue of 2016, this journal uses article numbers instead of page numbers. See further details here.