Socio-Economic Predictors and Distribution of Tuberculosis Incidence in Beijing, China: A Study Using a Combination of Spatial Statistics and GIS Technology
Abstract
:1. Introduction
2. Materials and Methods
2.1. Study Area and Design
2.2. Data Collection
Ethical Approval
2.3. Statistical Analysis
2.3.1. Descriptive Analysis
2.3.2. Spatial Analysis
2.3.3. Correlation Coefficient Analysis
2.3.4. Spatial Regression Analysis
3. Results
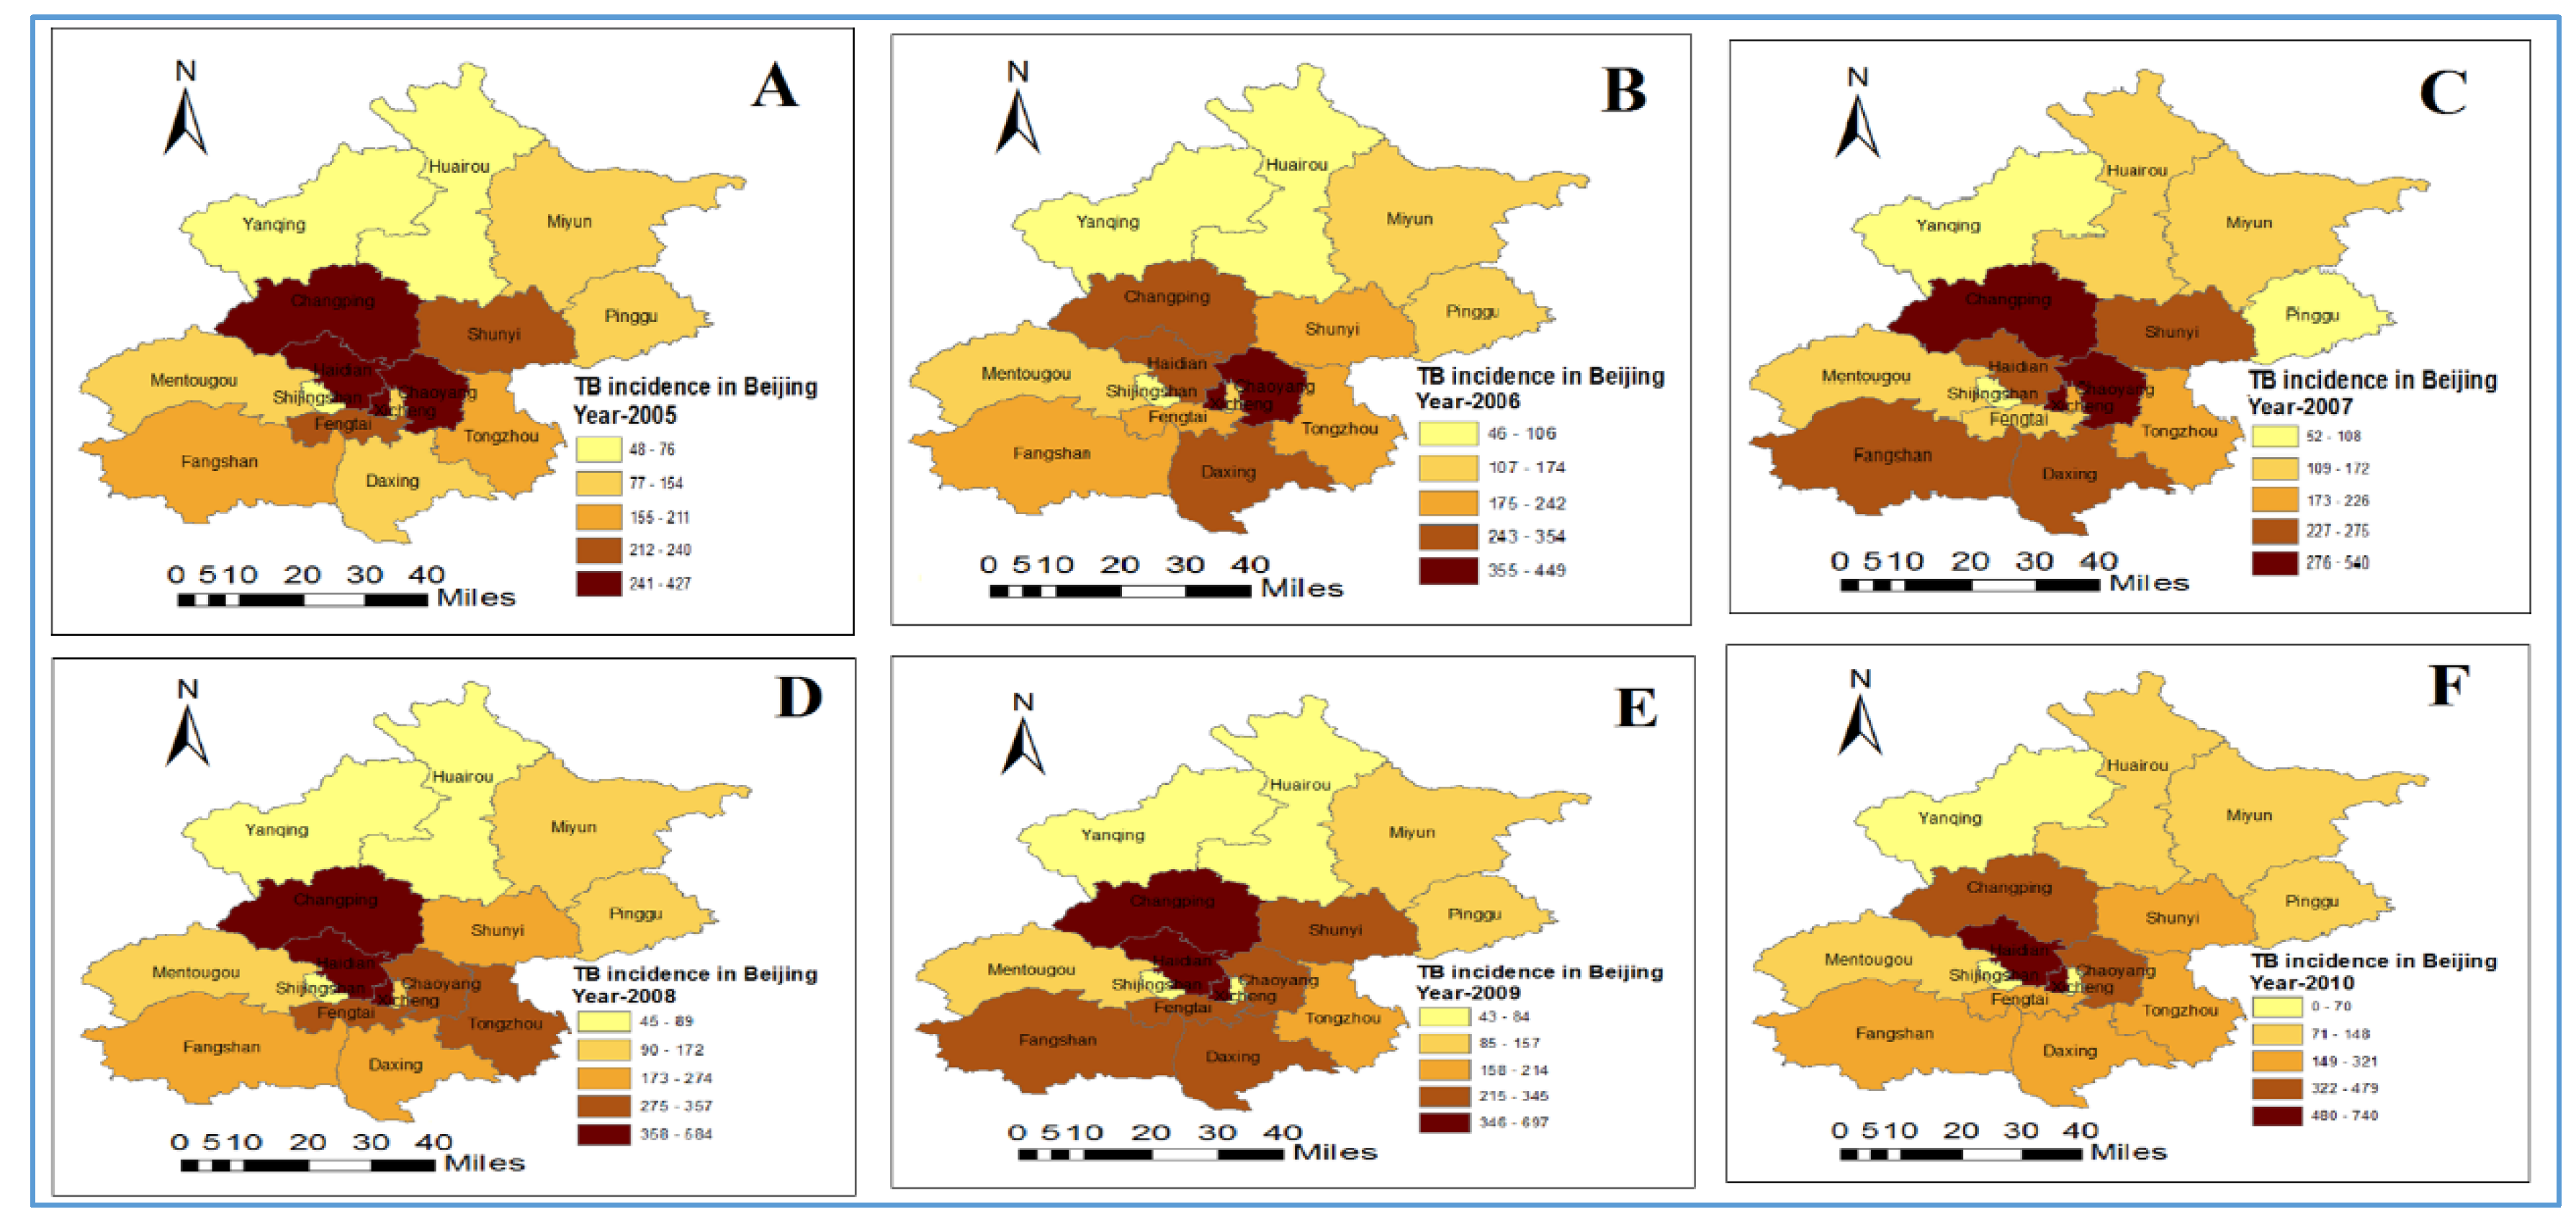
3.1. Distribution and Trend of Tuberculosis Incidence
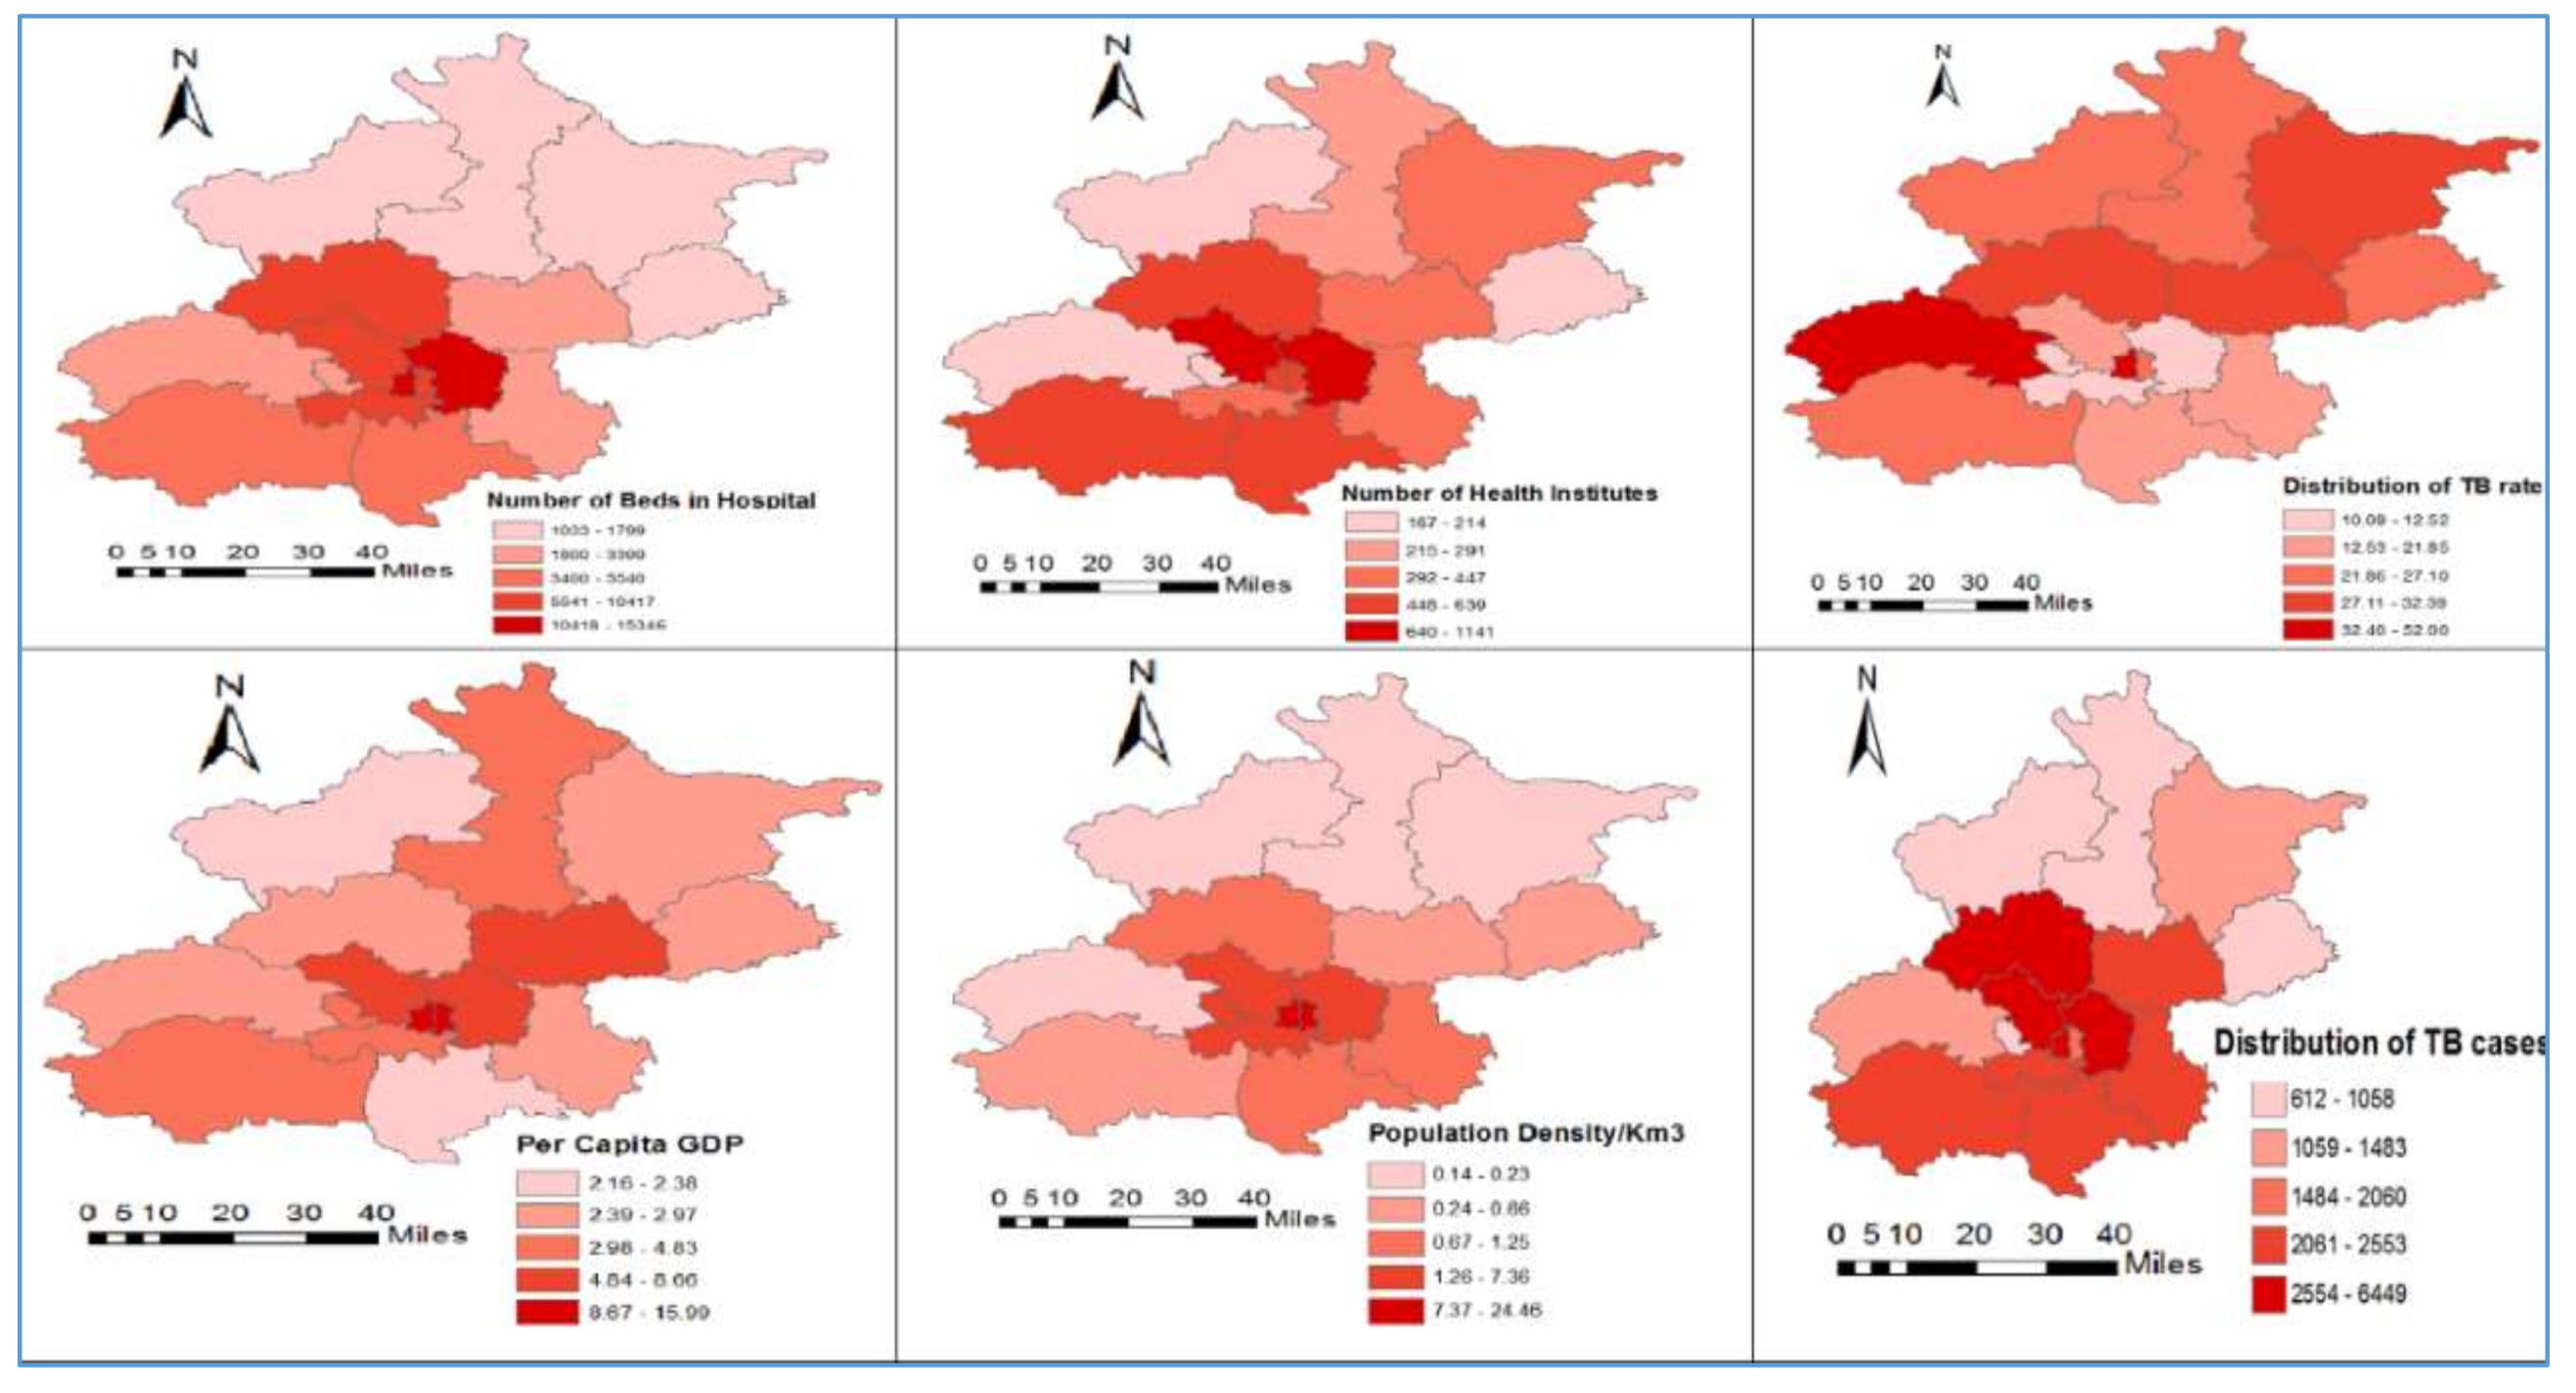
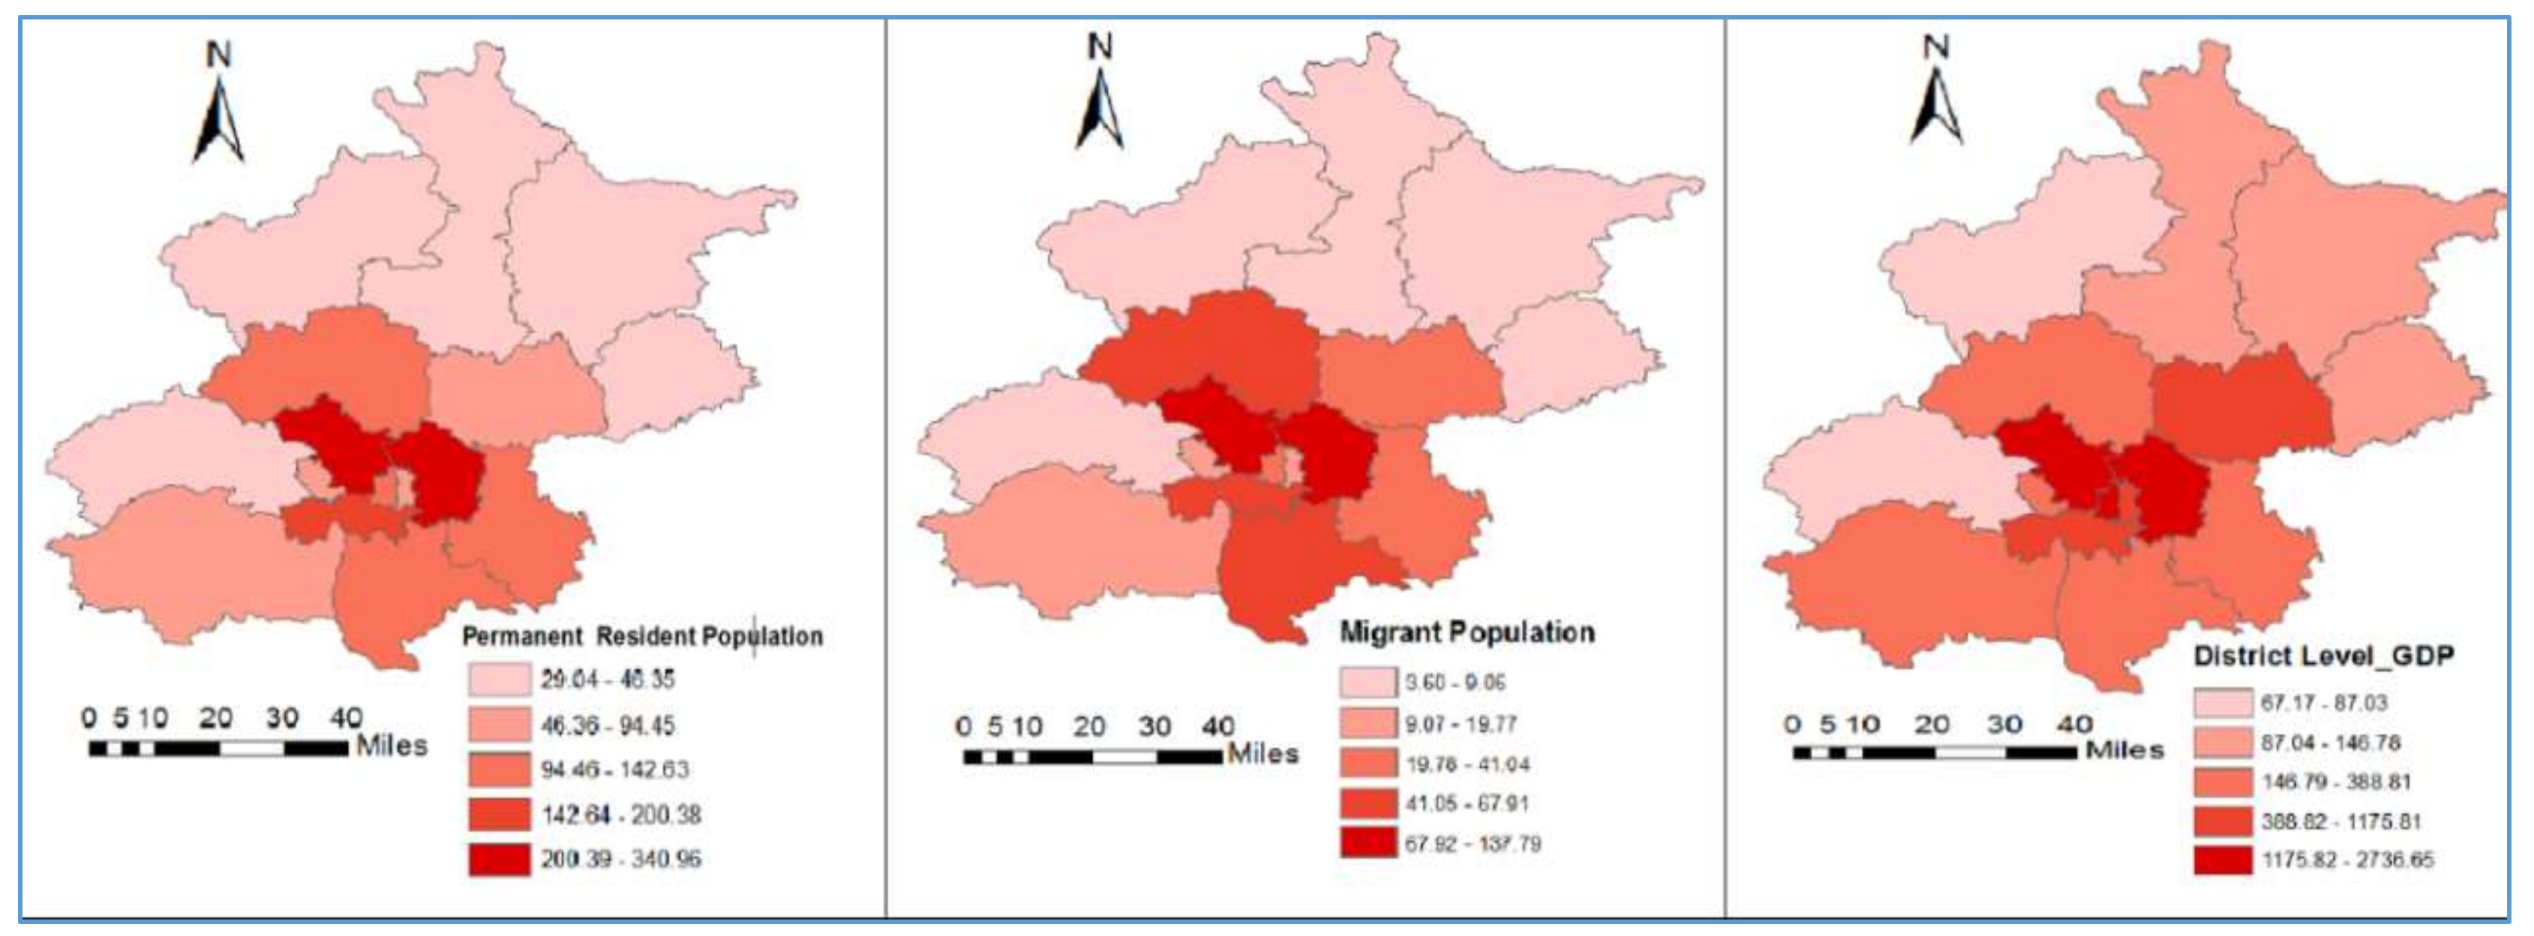
3.2. Description of Variables
3.3. Spatial Pattern of Tuberculosis Incidence
3.4. Correlation Coefficient Analysis
3.5. Spatial Regression Analysis
Statistical Analysis of Residuals from OLS, SLM and SEM
4. Discussion
5. Conclusions
Supplementary Materials
Author Contributions
Conflicts of Interest
References
- World Health Organization. Factsheet of tuberculosis. 2017. Available online: http://who.int/mediacentre/factsheets/fs104/en/ (accessed on 17 July 2017).
- World Health Organization. Tuberculosis WHO Global Tuberculosis Report 2015. Available online: http://who.int/tb/publications/factsheet_global.pdf?ua=1 (accessed on 17 July 2017).
- Reed, G.W.; Choi, H.; Lee, S.Y.; Lee, M.; Kim, Y.; Park, H.; Lee, J.; Zhan, X.; Kang, H.; Hwang, S.; et al. Impact of Diabetes and Smoking on Mortality in Tuberculosis. PLoS ONE 2013, 8, e58044. [Google Scholar] [CrossRef] [PubMed]
- Rehm, J.; Samokhvalov, A.V.; Neuman, M.G.; Room, R.; Parry, C.; Lönnroth, K.; Patra, J.; Poznyak, V.; Popova, S. The association between alcohol use, alcohol use disorders and tuberculosis (TB). A systematic review. BMC Public Health 2009, 9, 450. [Google Scholar] [CrossRef] [PubMed]
- Kim, J. Air pollution and another risk factor of tuberculosis. Korean J. Intern Med. 2014, 29, 170–172. [Google Scholar] [CrossRef] [PubMed]
- Smith, G.S.; Schoenbach, V.J.; Richardson, D.B.; Gammon, M.D. Particulate air pollution and susceptibility to the development of pulmonary tuberculosis disease in North Carolina: An ecological study. Int. J. Environ. Health Res. 2014, 24, 103–112. [Google Scholar] [CrossRef] [PubMed]
- Jia, Z.W.; Jia, X.W.; Liu, Y.X.; Dye, C.; Chen, F.; Chen, C.-S.; Zhang, W.-Y.; Li, X.-W.; Liu, W.; Liu, H.-L. Spatial analysis of tuberculosis cases in migrants and permanent residents, Beijing, 2000–2006. Emerg. Infect. Dis. 2008, 14, 1413–1419. [Google Scholar] [CrossRef] [PubMed]
- Chan-Yeung, M.; Yeh, A.; Tam, C.; Kam, K.; Leung, C.; Yew, W.; Lam, C. Socio-demographic and geographic indicators and distribution of tuberculosis in Hong Kong: A spatial analysis. Int. J. Tuberc. Lung Dis. 2005, 9, 1320–1326. [Google Scholar] [PubMed]
- Myers, W.P.; Westenhouse, J.L.; Flood, J.; Riley, L.W. An ecological study of tuberculosis transmission in California. Am. J. Public Health 2006. [Google Scholar] [CrossRef] [PubMed]
- De Quijano, E.D.; Brugal, M.T.; Pasarín, M.; Galdós-Tangüís, H.; Caylà, J.; Borrell, C. The influence of social inequalities, social unrest and extreme poverty on tuberculosis morbidity in the city of Barcelona. Rev. Esp. Salud Pública 2001, 75, 517–528. [Google Scholar]
- Liu, J.J.; Yao, H.Y.; Liu, E.Y. Analysis of factors affecting the epidemiology of tuberculosis in China. Int. J. Tuberc. Lung Dis. 2005, 9, 450–454. [Google Scholar] [PubMed]
- Disease Control Bureau of the Ministry of Health. Report on the 5th National Tuberculosis Epidemiological Survey in China; Military Medical Science Press: Beijing, China, 2010; pp. 30–37.
- Sun, W.; Gong, J.; Zhou, J.; Zhao, Y.; Tan, J.; Ibrahim, A.N.; Zhou, Y.A. Spatial, Social and Environmental Study of Tuberculosis in China Using Statistical and GIS Technology. Int. J. Environ. Res. Public Health 2015, 12, 1425–1448. [Google Scholar] [CrossRef] [PubMed]
- Narasimhan, P.; Wood, J.; MacIntyre, C.R.; Mathai, D. Risk Factors for Tuberculosis. Pulm. Med. 2013, 2013, 828939. [Google Scholar] [CrossRef] [PubMed]
- Zhang, L.X.; Tu, D.H.; An, Y.S.; Enarson, D.A. The impact of migrants on the epidemiology of tuberculosis in Beijing, China. Int. J. Tuberc. Lung Dis. 2006, 10, 959–962. [Google Scholar] [PubMed]
- Beijing Municipal Bureau of Statistics. Beijing Statistical Yearbook; China Statistics Press: Beijing, China, 2015.
- Beijing Center for Disease Control. The Annual Supervision Report of Infectious Disease and Public Health Emergency in Beijing, 2000–2006. 2016. Available online: http://www.phsciencedata.cn/ActDream/jsp/customer (accessed on 7 April 2016).
- Toungoussova, O.S.; Sandven, P.; Mariandyshev, A.O.; Nizovtseva, N.I.; Bjune, G.; Caugant, D.A. Spread of Drug-Resistant Mycobacterium Tuberculosis Strains of the Beijing Genotype in the Archangel Oblast, Russia. J. Clin. Microbiol. 2002, 40, 1930–1937. [Google Scholar] [CrossRef] [PubMed]
- Hawker, J.I.; Bakhshi, S.S.; Ali, S.; Farrington, C.P. Ecological analysis of ethnic differences in relation between tuberculosis and poverty. BMJ 1990, 319, 1031–1034. [Google Scholar] [CrossRef]
- Serpa, J.A.; Teeter, L.D.; Musser, J.M.; Graviss, E.A. Tuberculosis disparity between US-born blacks and whites, Houston, Texas, USA. Emerg. Infect. Dis. 2009, 15, 899–904. [Google Scholar] [CrossRef] [PubMed]
- Liu, Y.; Li, X.; Wang, W.; Li, Z.; Hou, M.; He, Y.; Wu, W.; Wang, H.; Liang, H.; Guo, X. Investigation of space-time clusters and geospatial hot spots for the occurrence of tuberculosis in Beijing. Int. J. Tuberc. Lung Dis. 2012, 16, 486–491. [Google Scholar] [CrossRef] [PubMed]
- Uthman, O.A. Spatial and temporal variations in incidence of tuberculosis in Africa, 1991 to 2005. World Health Popul. 2008, 10, 5–15. [Google Scholar] [CrossRef] [PubMed]
- Zhou, X.N.; Malone, J.B.; Kristensen, T.K.; Bergquist, R.N. Appli- cation of geographic information systems and remote sensing to schistosomiasis control in China. Acta Trop. 2001, 79, 97–106. [Google Scholar] [CrossRef]
- Yang, G.J.; Vouatsou, P.; Zhou, X.N.; Utzinger, J.; Tanner, M. A review of geographic information system and remote sensing to schistosomisis control of schistosomosis in China. Acta Trop. 2005, 96, 117–129. [Google Scholar] [CrossRef] [PubMed]
- Ministry of Health, Government of China, Beijing Center for Disease Control. Available online: www.bjcdc.org (accessed on 27 September 2017). (In Chinese).
- Data Sharing Infrastructure of Earth System Science. Base Map of Beijing City, China. Available online: http://www.geodata.cn/Portal/2016 (accessed on 17 March 2017).
- ArcGIS Info Software for Geographic Study Version 10.1. Environmental Systems Research Institute: Redlands CA, USA. Available online: www.ersi.com (accessed on 27 March 2017).
- Getis, A. Spatial Interaction and Spatial Autocorrelation: A Cross-product Approach. Environ. Plan. 1991, 23, 1269–1277. [Google Scholar] [CrossRef]
- Cliff, A.D.; Ord, K. Spatial Autocorrelation: A Review of Existing and New Measures with Applications. Econ. Geogr. 1970, 46, 269–292. [Google Scholar] [CrossRef]
- Mukaka, M. A guide to appropriate use of Correlation coefficient in medical research. Malawi Med. J. 2012, 24, 69–71. [Google Scholar] [PubMed]
- Li, X.; Wang, L.; Zhang, J.; Liu, Y.; Zhang, H.; Jiang, S.; Chen, J.; Zhou, X. Exploration of ecological factors related to the spatial heterogeneity of tuberculosis prevalence in P. R. China. Glob. Health Act. 2014, 7, 1654–9880. [Google Scholar] [CrossRef] [PubMed] [Green Version]
- Anselin, L. Exploring Spatial Data with GeoDa: A Workbook, Center for Spatially Integrated Social Science. 2005. Available online: www.csiss.org (accessed on 21 March 2017).
- Anselin, L. Estimation Methods for Spatial Autoregressive Structures. Regional Science Dissertation and Monograph Series; Cornell University: Ithaca, NY, USA, 1980. [Google Scholar]
- Kelejian, H.H.; Robinson, D.P. Spatial correlation: A suggested alternative to the autoregressive model. In New Directions in Spatial Econometrics; Anselin, L., Florax, R.J., Eds.; Springer: Berlin, Germany, 1995. [Google Scholar]
- Kumar, C.; Singh, P.K.; Rai, R.K. Under-Five Mortality in High Focus States in India: A District Level Geospatial Analysis. PLoS ONE 2012, 7, e37515. [Google Scholar] [CrossRef] [PubMed]
- Wubuli, A.; Xue, F.; Jiang, D.; Yao, X.; Upur, H.; Wushouer, Q. Socio-Demographic Predictors and Distribution of Pulmonary Tuberculosis TB in Xinjiang, China: A Spatial Analysis journal. PLoS ONE 2015, 10, e0144010. [Google Scholar] [CrossRef] [PubMed]
- Du, J.; Emilio, D.; Pang, Y.; Ma, Y.; Mi, F.; Liu, Y.; Li, L. Tuberculosis Hospitalization Fees and Bed Utilization in China from 1999 to 2009: The Results of a National Survey of Tuberculosis Specialized Hospitals. PLoS ONE 2015, 10, e0139901. [Google Scholar] [CrossRef] [PubMed]
- Chen, W.; Shu, W.; Wang, M.; Hou, Y.; Xia, Y.; Xu, W.; Bai, L.; Nie, S.; Cheng, S.; Xu, Y. Pulmonary Tuberculosis Incidence and Risk Factors in Rural Areas of China: A Cohort Study. PLoS ONE 2013, 8, e58171. [Google Scholar] [CrossRef] [PubMed]
- Gao, L.; Lu, W.; Bai, L.; Wang, X.; Xu, J.; Catanzaro, A.; Cárdenas, V.; Li, X.; Yang, Y.; Du, J.; et al. Latent tuberculosis infection in rural China: Baseline results of a population-based multi centre, prospective cohort study. Lancet Infect. Dis. 2015, 15, 310–319. [Google Scholar] [CrossRef]
- Kapoor, A.K.; Deepani, V.; Dhall, M.; Kapoor, S. Pattern of socio-economic and health aspects among TB patients and controls. Indian J. Tuberc. 2016, 63, 230–235. [Google Scholar] [CrossRef] [PubMed]
- Ponticiello, A.; Sturkenboom, M.C.; Simonetti, A.; Ortolani, R.; Malerba, M.; Sanduzzi, A. Deprivation, immigration and tuberculosis incidence in Naples, 1996–2000. Eur. J. Epidemiol. 2005, 20, 729–734. [Google Scholar] [CrossRef] [PubMed]
- An, Y.S.; Zhang, L.X.; He, X.X. Impact of immigration on epidemic of tuberculosis in Beijing. Chin. J. Antituberc. Assoc. 2004, 36, 319–323. [Google Scholar]
- Yang, Y.; Li, X.; Zhou, F.; Jin, Q.; Gao, L. Prevalence of drug-resistant tuberculosis in mainland China: A systemic review and meta-analysis. PLoS ONE 2011, 6, e20343. [Google Scholar] [CrossRef] [PubMed]
- Crampin, A.C.; Glynn, J.R.; Fine, P.E. What has Karonga taught us? Tuberculosis studied over three decades. Int. J. Tuberc. Lung Dis. 2009, 13, 153–164. [Google Scholar] [PubMed]
- Viney, K.; O’Connor, J.; Wiegandt, A. The epidemiology of tuberculosis in Pacific Island countries and territories: 2000–2007. Asia Pac. J. Public Health 2011, 23, 86–99. [Google Scholar] [CrossRef] [PubMed]
- Barry, C.; Konstantinos, A. Tuberculosis notifications in Australia, 2007. Commun. Dis. Intell. 2009, 33, 304–315. [Google Scholar]
- Gao, L.; Bai, L.; Liu, J.; Lu, W.; Wang, X.; Li, X.; Du, J.; Chen, X.; Zhang, H.; Xin, H.; et al. Annual risk of tuberculosis infection in rural China: A population-based prospective study. Eur. Respir. J. 2016, 48, 168–178. [Google Scholar] [CrossRef] [PubMed]
- Yates, T.A.; Ayles, H.; Leacy, F.P.; Schaap, A.B.; Boccia, D.; Beyers, N.; Godfrey-Faussett, P.; Floyd, S. Socio-economic gradients in prevalent tuberculosis in Zambia and the Western Cape of South Africa. Trop. Med. Int. Health 2018. [Google Scholar] [CrossRef] [PubMed]
- The World Bank China. Tuberculosis Control Project. 2012. Available online: http://www.worldbank.org/en/news/feature/2010/09/24/china-tuberculosis-control-project0 (accessed on 12 June 2017).


| Variables | Min | Max | Mean | Std. Deviation | Moran’s I | p-Value |
|---|---|---|---|---|---|---|
| Tuberculosis cases (TBC) | 39 | 885 | 256.37 | 183.340 | 0.193 | <0.001 |
| Tuberculosis rate (TBR) | 5.96 | 71.78 | 25.8218 | 12.97541 | −0.010 | 0.446 |
| Number of health institutes (NHI) | 68 | 1337 | 472.40 | 310.911 | 0.210 | <0.001 |
| Number of hospital beds (NHB) | 982 | 19,053 | 5763.34 | 4498.153 | 0.422 | <0.001 |
| Migrant Population (M_P) | 2.0 | 180 | 38.90 | 42.045 | 0.264 | <0.001 |
| Per capita GDP (PC_GDP) | 1.38 | 23.44 | 5.5224 | 4.49726 | 0.254 | <0.001 |
| Population density per 3 km (PD_3) | 0.13 | 25.55 | 4.9954 | 7.35956 | 0.439 | <0.001 |
| Permanent resident ropulation (PRP) | 27.7 | 392.2 | 117.259 | 94.4632 | 0.298 | <0.001 |
| County/district level GDP (C_GDP) | 0.40 | 43.37 | 7.8275 | 9.84348 | 0.305 | <0.001 |
| Years | Moran’s-I | Z Score | p-Value |
|---|---|---|---|
| 2005 | 0.199 | 1.920 | 0.033 |
| 2006 | 0.177 | 1.741 | 0.045 |
| 2007 | 0.118 | 1.627 | 0.059 |
| 2008 | −0.012 | 0.374 | 0.326 |
| 2009 | −0.009 | 0.419 | 0.319 |
| 2010 | 0.062 | 0.897 | 0.168 |
| 2011 | 0.123 | 1.326 | 0.104 |
| 2012 | 0.163 | 1.685 | 0.051 |
| 2013 | 0.100 | 1.354 | 0.107 |
| 2014 | 0.104 | 1.142 | 0.126 |
| Variable | Ordinary Least Squares Model | Spatial Lag Model | Spatial Error Model | |||||||||
|---|---|---|---|---|---|---|---|---|---|---|---|---|
| Coefficient | St.Error | T-Value | p-Value | Coefficient | St-Error | Z-Value | p-Value | Coefficient | St-Error | Z-Value | p-Value | |
| NHI | −0.00528 | 0.00583 | −0.9058 | 0.3664 | −0.005624 | 0.00551 | −1.0197 | 0.307 | 0.002067 | 0.0073 | 0.27953 | 0.779 |
| NHB | 0.00332 | 0.00065 | 5.11351 | <0.001 | 0.003137 | 0.00061 | 5.08384 | <0.001 | 0.004666 | 0.00060 | 7.7630 | <0.001 |
| C_GDP | 0.71719 | 0.28287 | 2.53537 | 0.012 | 0.858366 | 0.27062 | 3.17185 | 0.001 | −0.131481 | 0.32594 | −0.4033 | 0.686 |
| PC_GDP | −0.90688 | 0.53734 | −1.6876 | 0.093 | −1.081062 | 0.51153 | −2.1133 | 0.034 | 1.349843 | 0.60574 | 2.22839 | 0.025 |
| PD_3 | −0.73422 | 0.32684 | −2.2463 | 0.026 | −0.69715 | 0.30916 | −2.2549 | 0.024 | −2.209779 | 0.33873 | −6.5236 | <0.001 |
| PRP | −0.08174 | 0.04392 | −1.8609 | 0.064 | −0.099438 | 0.04152 | −2.3944 | 0.016 | −0.017595 | 0.04182 | −0.4206 | 0.673 |
| M_P | −0.26147 | 0.08852 | −2.9537 | 0.003 | −0.248568 | 0.08481 | −2.9307 | 0.003 | −0.371144 | 0.09248 | −4.0130 | <0.001 |
| Lambda (λ) | 10.57686 | 1.54012 | 6.8675 | <0.001 | ||||||||
| Rho (ρ) | −0.795591 | |||||||||||
| R2 | 0.359035 | 0.397502 | 0.413278 | |||||||||
| Log-likelihood | −601.035 | −594.763 | −591.880 | |||||||||
| AIC | 1218.07 | 1207.53 | 1199.76 | |||||||||
| BPT | 58.9438 | <0.001 | 59.9531 | <0.001 | 16.4445 | 0.0213 | ||||||
| LRT | 12.5443 | <0.001 | 18.3090 | <0.001 | ||||||||
© 2018 by the authors. Licensee MDPI, Basel, Switzerland. This article is an open access article distributed under the terms and conditions of the Creative Commons Attribution (CC BY) license (http://creativecommons.org/licenses/by/4.0/).
Share and Cite
Mahara, G.; Yang, K.; Chen, S.; Wang, W.; Guo, X. Socio-Economic Predictors and Distribution of Tuberculosis Incidence in Beijing, China: A Study Using a Combination of Spatial Statistics and GIS Technology. Med. Sci. 2018, 6, 26. https://doi.org/10.3390/medsci6020026
Mahara G, Yang K, Chen S, Wang W, Guo X. Socio-Economic Predictors and Distribution of Tuberculosis Incidence in Beijing, China: A Study Using a Combination of Spatial Statistics and GIS Technology. Medical Sciences. 2018; 6(2):26. https://doi.org/10.3390/medsci6020026
Chicago/Turabian StyleMahara, Gehendra, Kun Yang, Sipeng Chen, Wei Wang, and Xiuhua Guo. 2018. "Socio-Economic Predictors and Distribution of Tuberculosis Incidence in Beijing, China: A Study Using a Combination of Spatial Statistics and GIS Technology" Medical Sciences 6, no. 2: 26. https://doi.org/10.3390/medsci6020026
APA StyleMahara, G., Yang, K., Chen, S., Wang, W., & Guo, X. (2018). Socio-Economic Predictors and Distribution of Tuberculosis Incidence in Beijing, China: A Study Using a Combination of Spatial Statistics and GIS Technology. Medical Sciences, 6(2), 26. https://doi.org/10.3390/medsci6020026


