

Particulate Matter (PM2.5) and Mould Characteristics in Selected Classrooms Located in Waikato, New Zealand: Preliminary Results


Abstract
:1. Introduction
2. Materials and Methods
2.1. Particle and Mould Assessment
2.2. Location of Study Rooms
2.3. Settle-Plate Exposure Time
2.4. Data Collection
3. Results
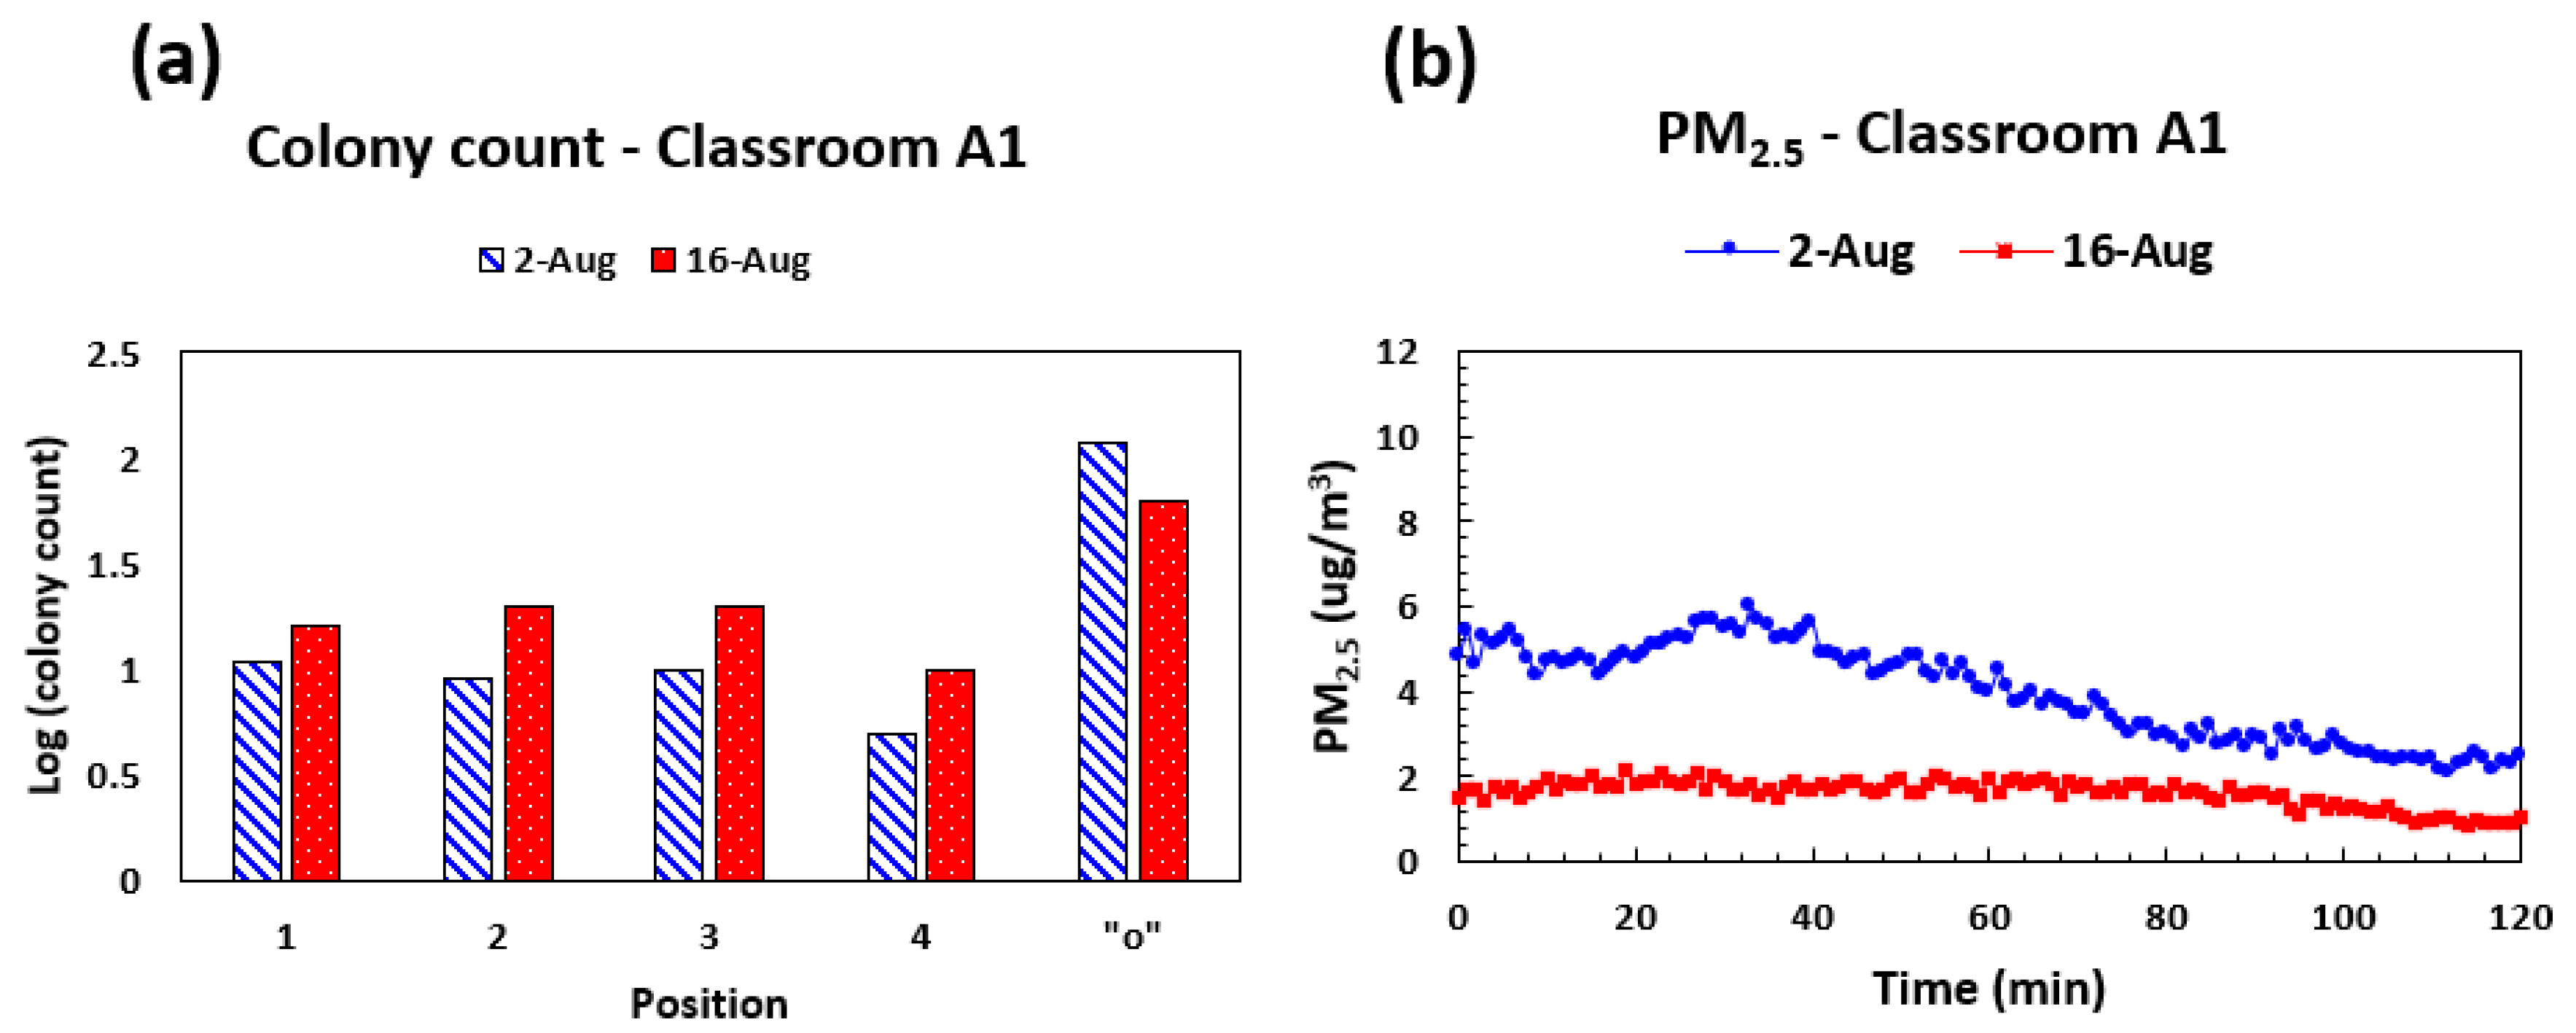
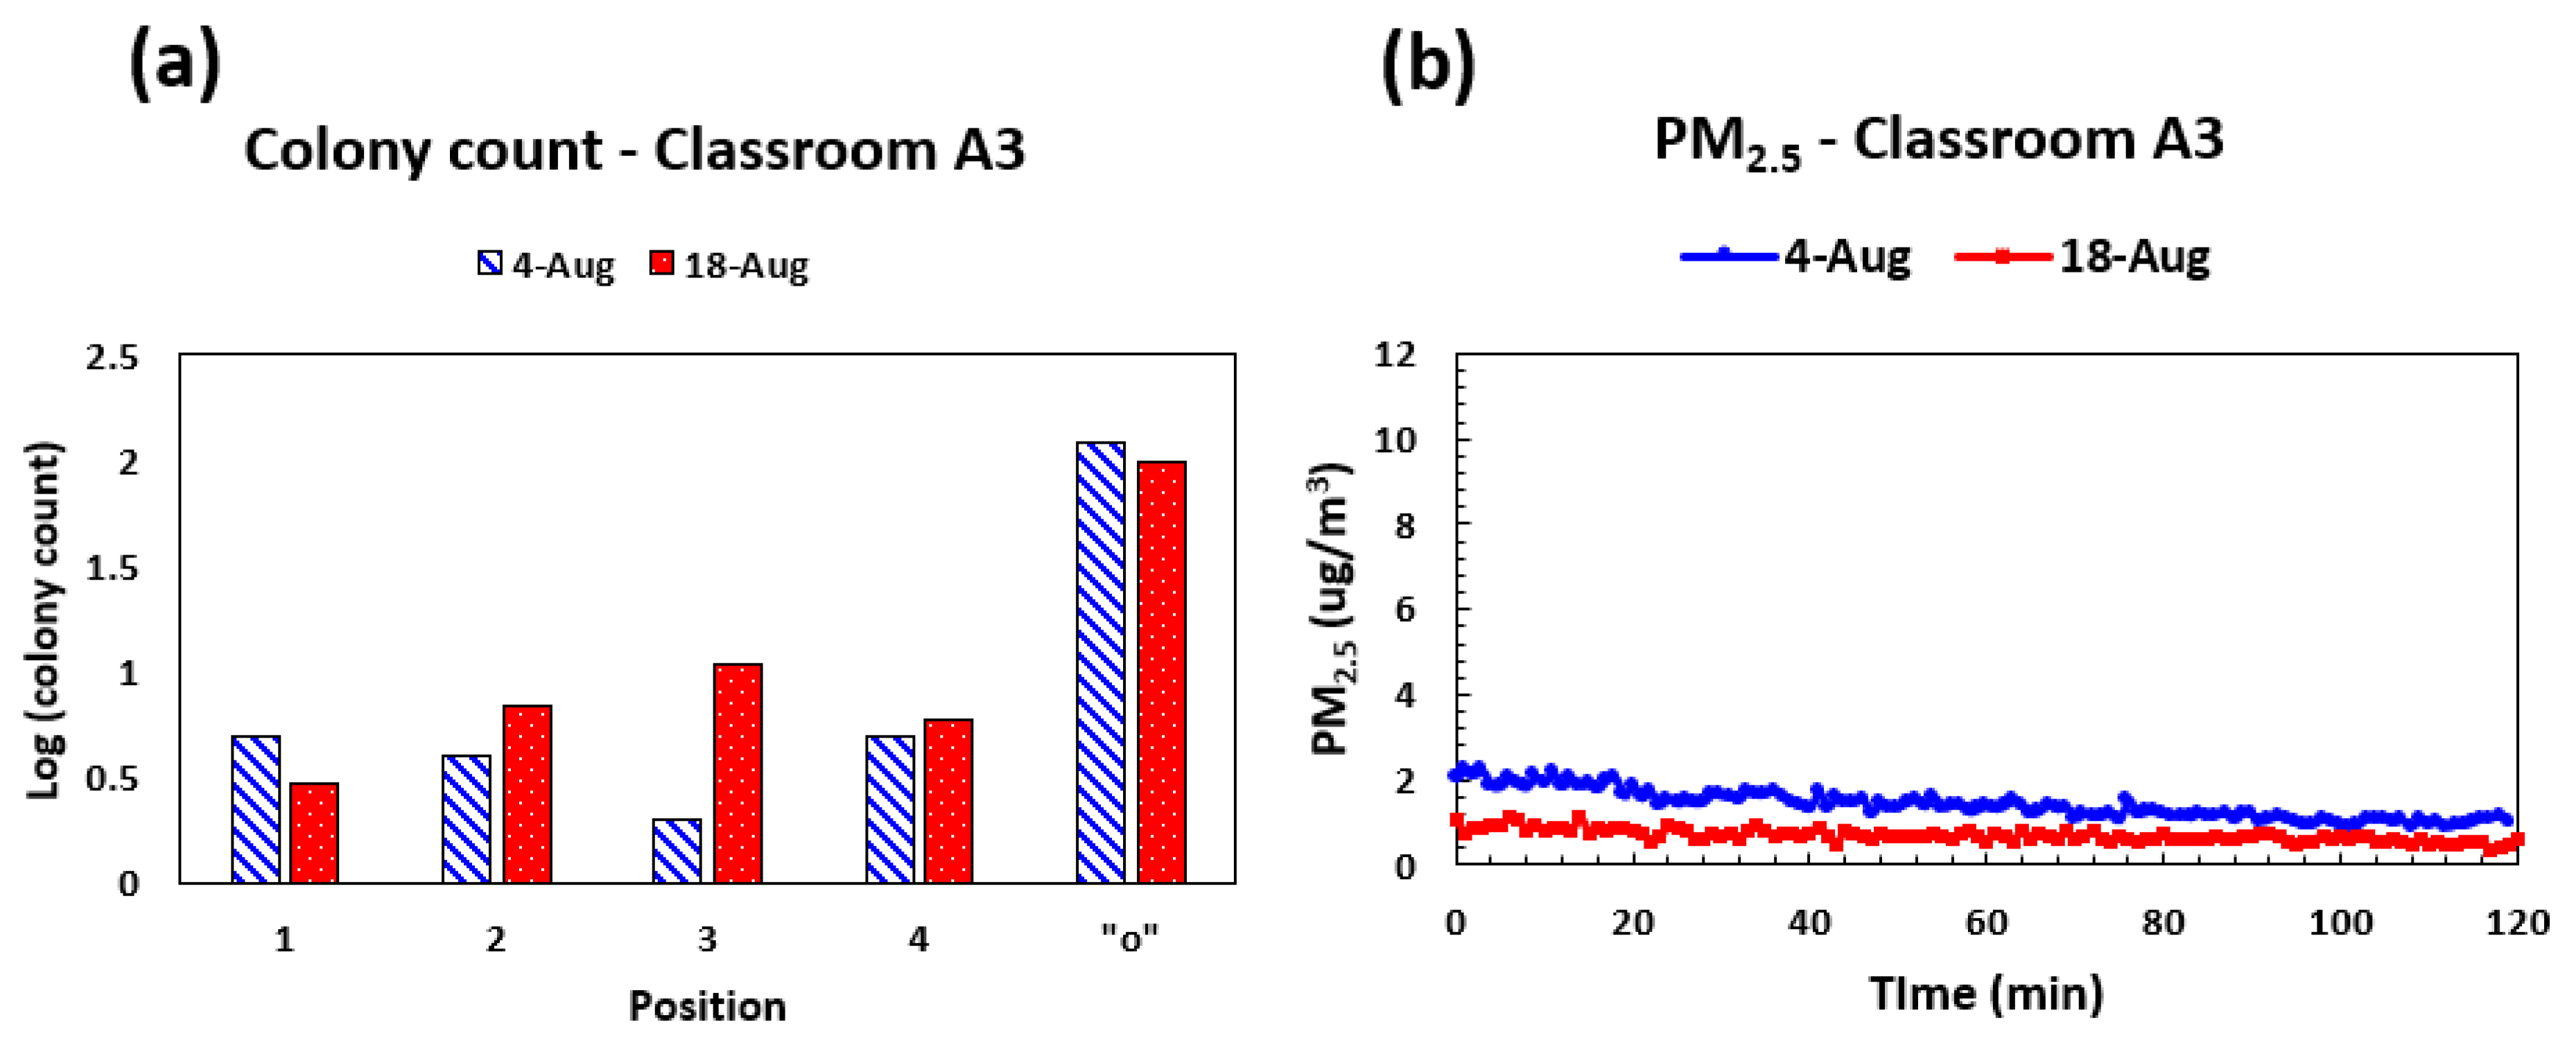
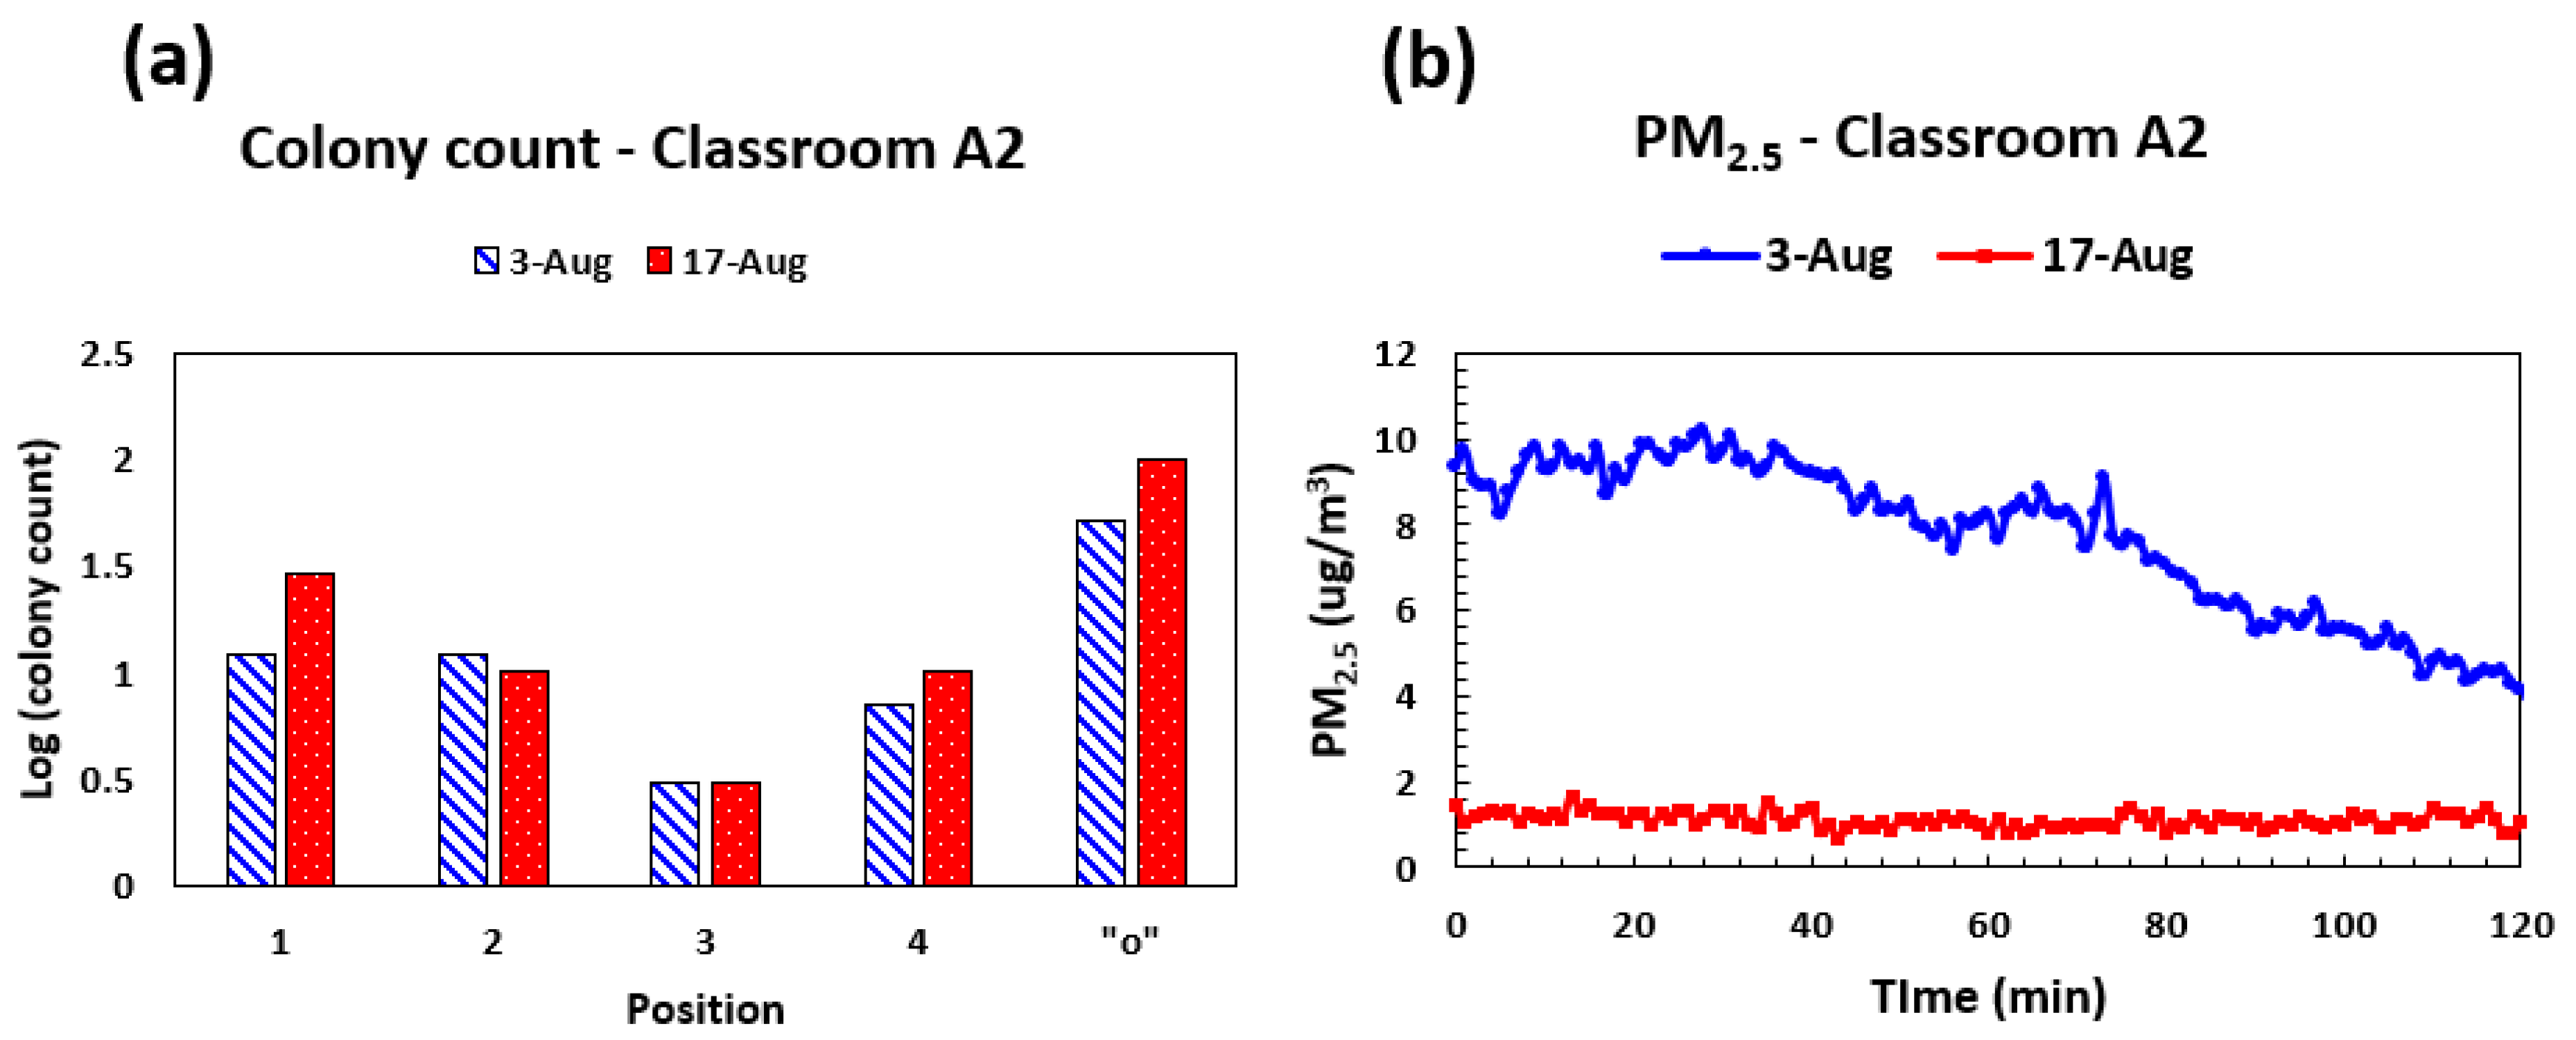
3.1. City-Based Classrooms
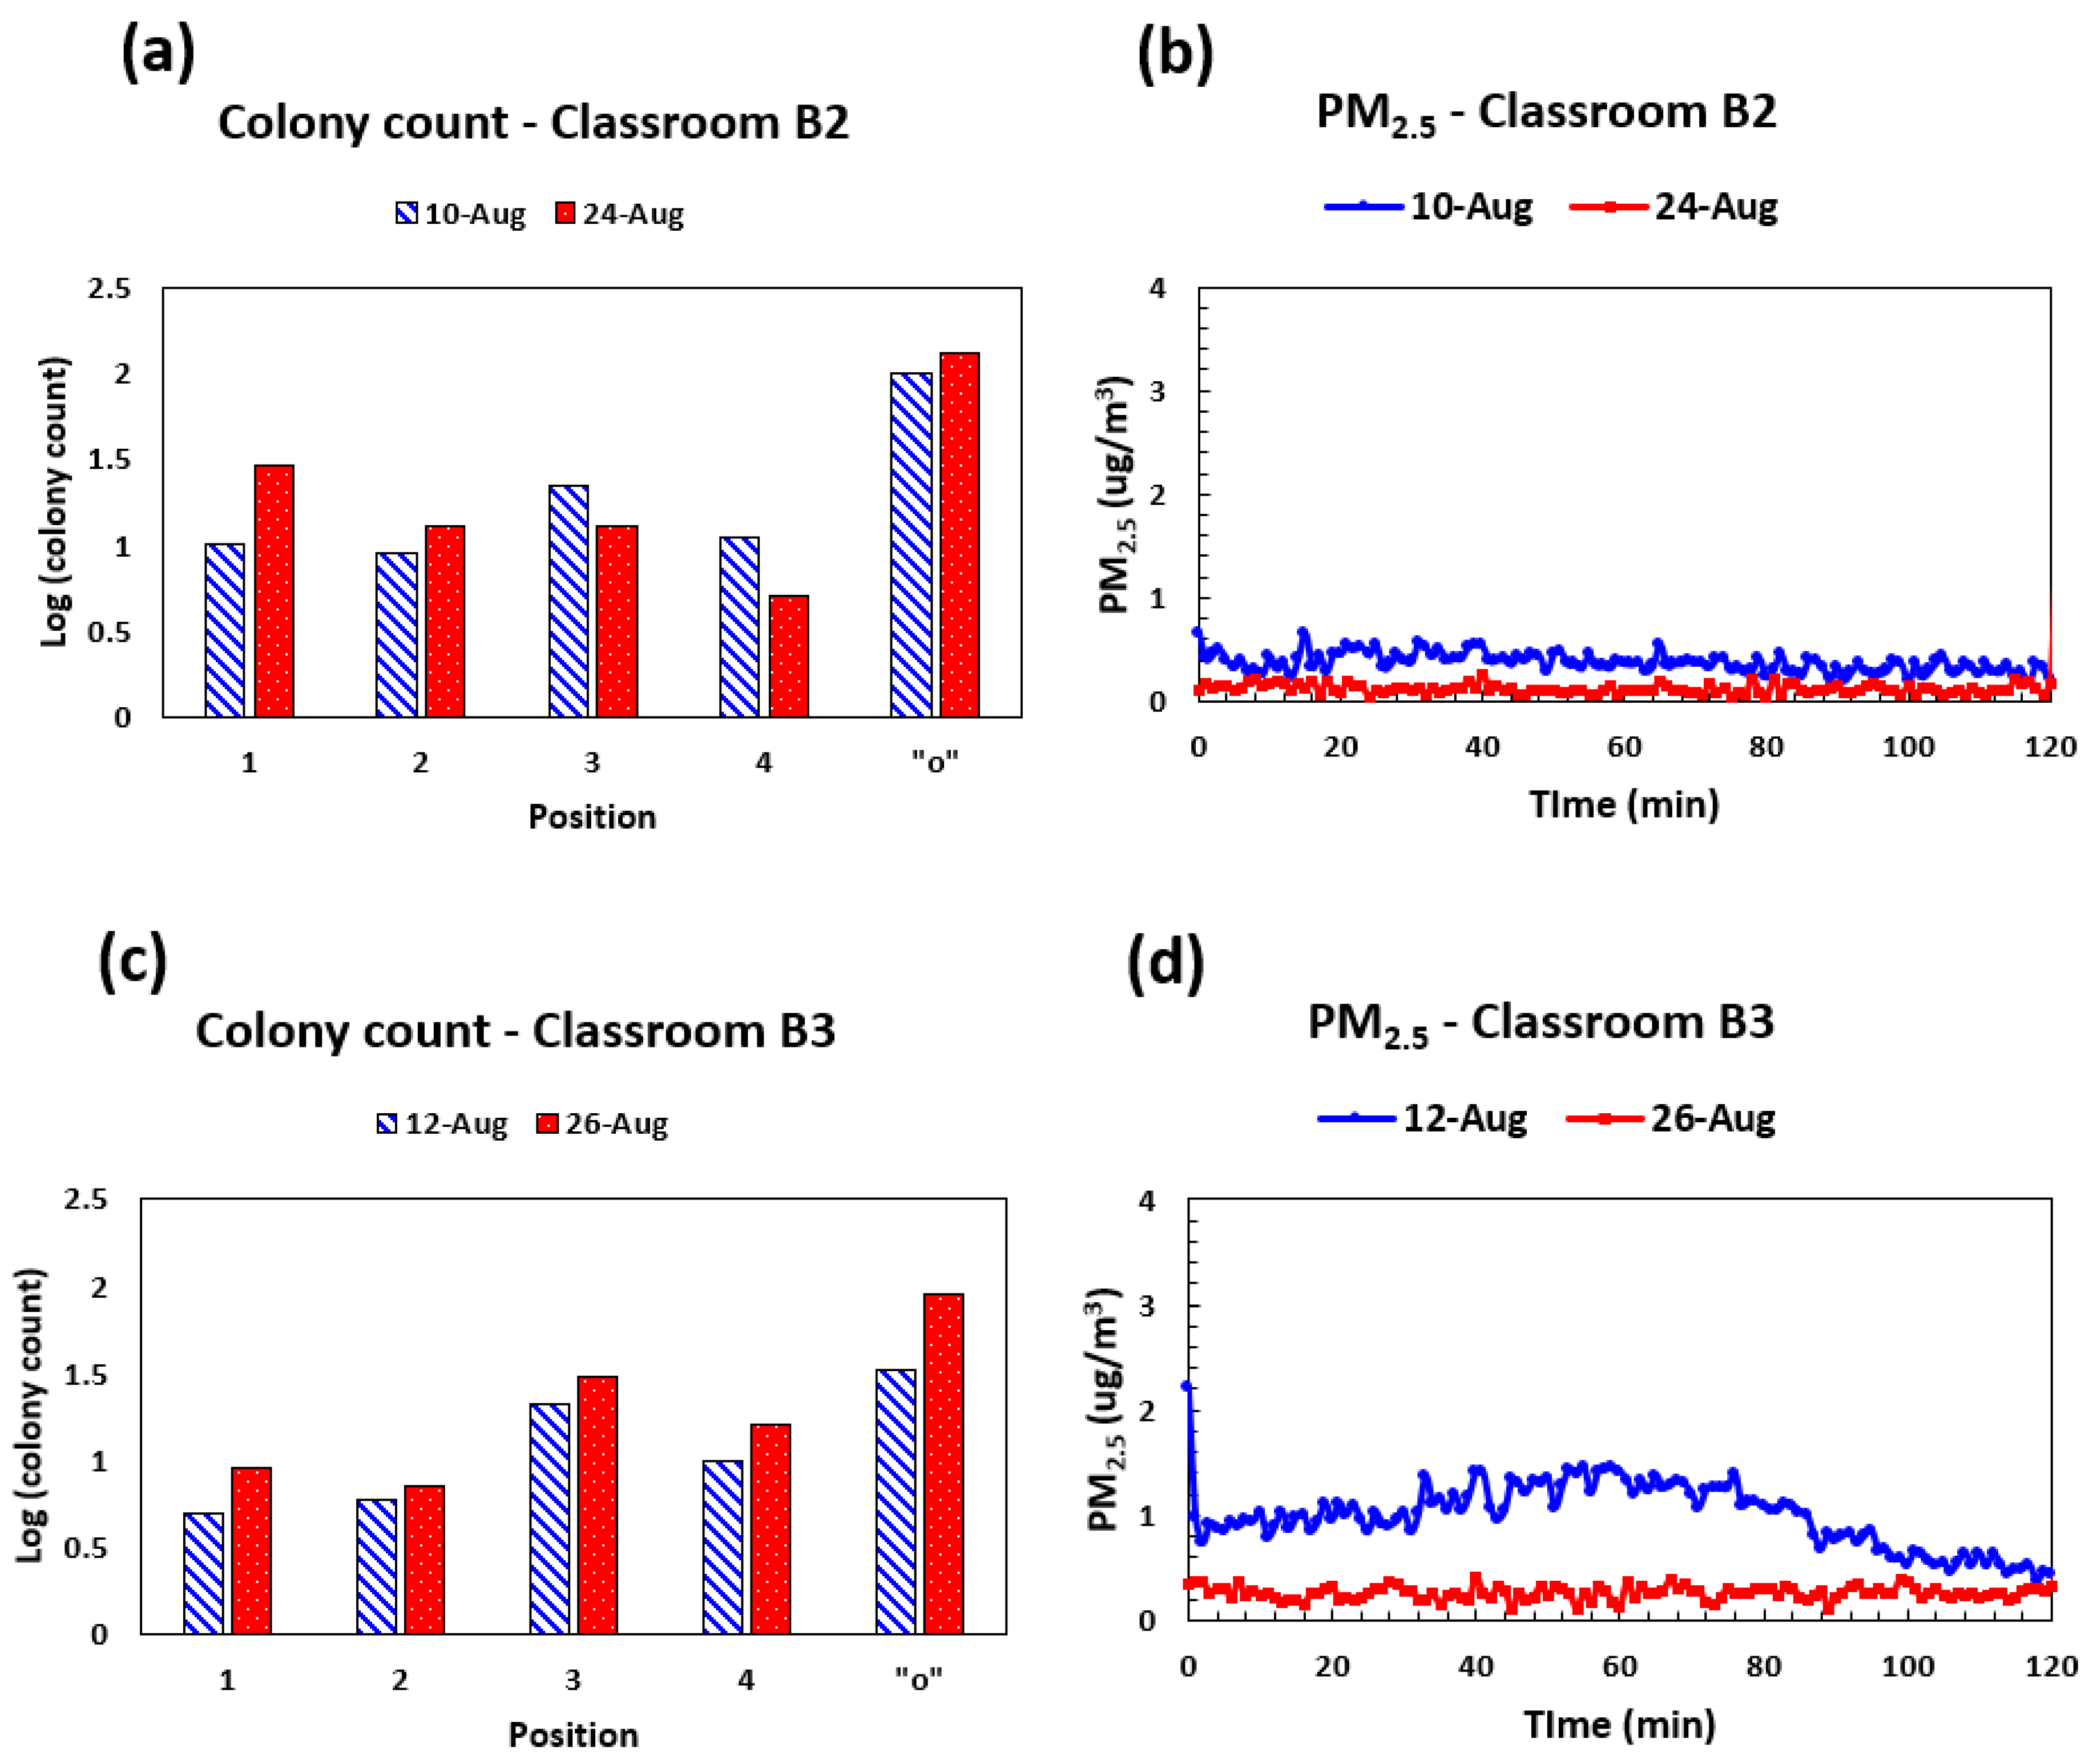
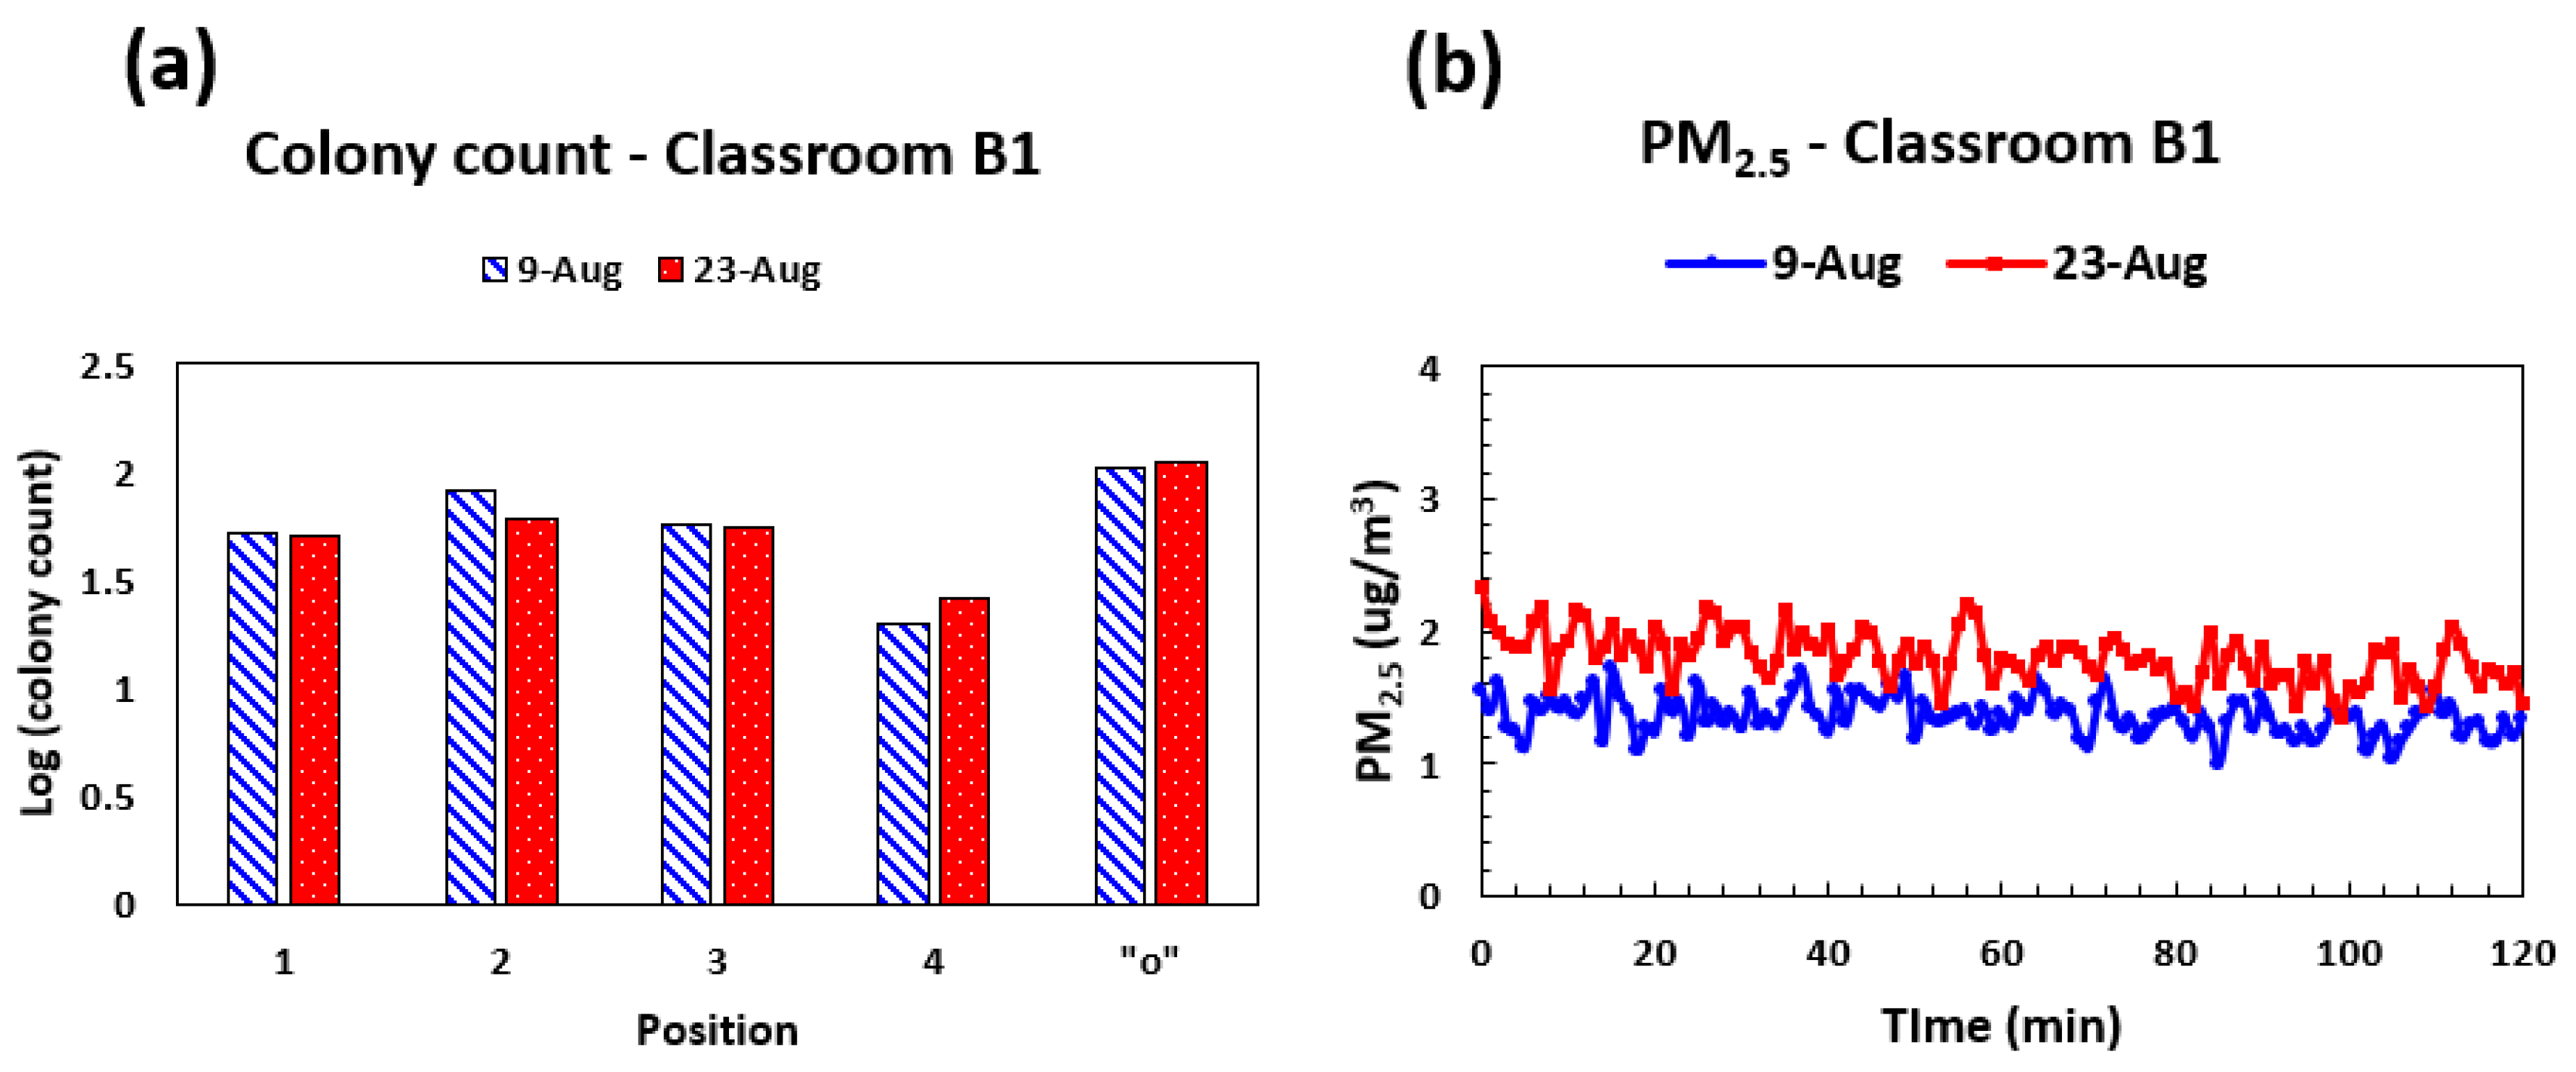
3.2. Semi-Urban Classrooms
4. Discussion
5. Conclusions
Author Contributions
Funding
Data Availability Statement
Acknowledgments
Conflicts of Interest
References
- Agarwal, N.; Meena, C.S.; Raj, B.P.; Saini, L.; Kumar, A.; Gopalakrishnan, N.; Kumar, A.; Balam, N.B.; Alam, T.; Kapoor, N.R.; et al. Indoor air quality improvement in COVID-19 pandemic: Review. Sustain. Cities Soc. 2021, 70, 102942. [Google Scholar] [CrossRef] [PubMed]
- Rodriguez-Morales, A.J.; Bonilla-Aldana, D.K.; Tiwari, R.; Sah, R.; Rabaan, A.A.; Dhama, K. COVID-19, an Emerging Coronavirus Infection: Current Scenario and Recent Developments—An Overview. J. Pure Appl. Microbiol. 2020, 14, 5–12. [Google Scholar] [CrossRef]
- Bashir, M.F.; Ma, B.; Bilal, K.B.; Bashir, M.A.; Tan, D.; Bashir, M. Correlation between climate indicators and COVID-19 pandemic in New York, USA. Sci. Total Environ. 2020, 728, 138835. [Google Scholar] [CrossRef] [PubMed]
- Amoatey, P.; Omidvarborna, H.; Baawain, M.S.; Al-Mamun, A. Impact of building ventilation systems and habitual indoor incense burning on SARS-CoV-2 virus transmissions in Middle Eastern countries. Sci. Total Environ. 2020, 733, 139356. [Google Scholar] [CrossRef]
- Li, J.; Che, W. Challenges and coping strategies of online learning for college students in the context of COVID-19: A survey of Chinese universities. Sustain. Cities Soc. 2022, 83, 103958. [Google Scholar] [CrossRef]
- Liu, X.; Gong, Z.; Miao, K.; Yang, P.; Liu, H.; Feng, Z.; Chen, Z. Attitude and Performance for Online Learning during COVID-19 Pandemic: A Meta-Analytic Evidence. Int. J. Environ. Res. Public Health 2022, 19, 12967. [Google Scholar] [CrossRef] [PubMed]
- Ministry of Education. How to Clean Your Early Learning Service or School During a Pandemic. 14 June 2022; Education in New Zealand. Available online: https://www.education.govt.nz/school/health-safety-and-wellbeing/emergencies-and-traumatic-incidents/pandemic-planning-guide/how-to-clean-your-early-learning-service-or-school-during-a-pandemic/ (accessed on 12 January 2023).
- Klompas, M.; Baker, M.A.; Rhee, C. Airborne Transmission of SARS-CoV-2: Theoretical Considerations and Available Evidence. JAMA 2020, 324, 441–442. [Google Scholar] [CrossRef] [PubMed]
- Stern, R.A.; Al-Hemoud, A.; Alahmad, B.; Koutrakis, P. Levels and Particle Size Distribution of Airborne SARS-CoV-2 at a Healthcare Facility in Kuwait. Sci. Total Environ. 2021, 782, 146799. [Google Scholar] [CrossRef]
- United States Environmental Protection Agency. Particulate Matter (PM) Basics. 18 July 2022; US EPA. Available online: https://www.epa.gov/pm-pollution/particulate-matter-pm-basics (accessed on 12 January 2023).
- Joshi, S. The sick building syndrome. Indian J. Occup. Environ. Med. 2008, 12, 61. [Google Scholar] [CrossRef]
- Terr, A.I. Sick Building Syndrome: Is mould the cause? Med. Mycol. J. 2009, 47, S217–S222. [Google Scholar] [CrossRef]
- Shafaghat, A.; Keyvanfar, A.; Ferwati, M.S.; Alizadeh, T. Enhancing staff’s satisfaction with comfort toward productivity by sustainable Open Plan Office Design. Sustain. Cities Soc. 2015, 19, 151–164. [Google Scholar] [CrossRef]
- Srivastava, S.; Zhao, X.; Manay, A.; Chen, Q. Effective ventilation and air disinfection system for reducing coronavirus disease 2019 (COVID-19) infection risk in office buildings. Sustain. Cities Soc. 2019, 75, 103408. [Google Scholar] [CrossRef] [PubMed]
- United States Environmental Protection Agency. Indoor Air Facts No. 4 (revised) Sick Building Syndrome. US EPA. February 1991. Available online: https://www.epa.gov/sites/default/files/2014-08/documents/sick_building_factsheet.pdf (accessed on 22 December 2022).
- Shim, I.K.; Kim, J.; Won, S.R.; Hwang, E.S.; Lee, Y.; Park, S.; Ryu, J.; Lee, J. Prevalence of sick building syndrome symptoms and subjective–objective indoor air quality of stores in underground shopping districts of Korea. Build. Environ. 2023, 228, 109882. [Google Scholar] [CrossRef]
- Błaszczyk, E.; Rogula-Kozłowska, W.; Klejnowski, K.; Kubiesa, P.; Fulara, I.; Mielżyńska-Švach, D. Indoor air quality in urban and rural kindergartens: Short-term studies in Silesia, Poland. Air Qual. Atmos. Health 2017, 10, 1207–1220. [Google Scholar] [CrossRef]
- National Institute of Environmental Health Sciences. Mold. National Institute of Environmental Health Sciences. 2018. Available online: https://www.niehs.nih.gov/health/topics/agents/mold/index.cfm (accessed on 22 December 2022).
- Centers for Disease Control and Prevention. CDC-Mold-General Information—Basic Facts. Centers for Disease Control and Prevention. 2019. Available online: https://www.cdc.gov/mold/faqs.htm (accessed on 22 December 2022).
- Kaiser, G. 8.4: Fungal Pathogenicity. Biology LibreTexts. 8 March 2016. Available online: https://bio.libretexts.org/Bookshelves/Microbiology/Book%3A_Microbiology_(Kaiser)/Unit_4%3A_Eukaryotic_Microorganisms_and_Viruses/08%3A_Fungi/8.4%3A_Fungal_Pathogenicity (accessed on 22 December 2022).
- Australian National Botanical Gardens. Fungi Dispersal and Spore Release. 2012. Available online: https://www.anbg.gov.au/fungi/dispersal.html (accessed on 22 December 2022).
- CDC. CDC-Mold-General Information: Facts about Stachybotrys chartarum and Other Molds. CDC. 2019. Available online: https://www.cdc.gov/mold/stachy.htm (accessed on 22 December 2022).
- Dyląg, M.; Spychała, K.; Zielinski, J.; Łagowski, D.; Gnat, S. Update on Stachybotrys chartarum—Black Mold Perceived as Toxigenic and Potentially Pathogenic to Humans. Biology 2022, 11, 352. [Google Scholar] [CrossRef]
- Pasquarella, C.; Pitzurra, O.; Savino, A. The index of microbial air contamination. J. Hosp. Infect. 2000, 46, 241–256. [Google Scholar] [CrossRef]
- Al-Rawi, M.; Lazonby, A.; Smith, C. Prototyping a low-cost residential air quality device using ultraviolet germicidal irradiation (UVGI) light. HardwareX. 2022, 11, e00251. [Google Scholar] [CrossRef]
- Strosnider, H.; Kennedy, C.; Monti, M.; Yip, F. Rural and Urban Differences in Air Quality, 2008–2012, and Community Drinking Water Quality, 2010–2015—United States. MMWR. Surveill. Summ. 2017, 66, 1–10. [Google Scholar] [CrossRef]
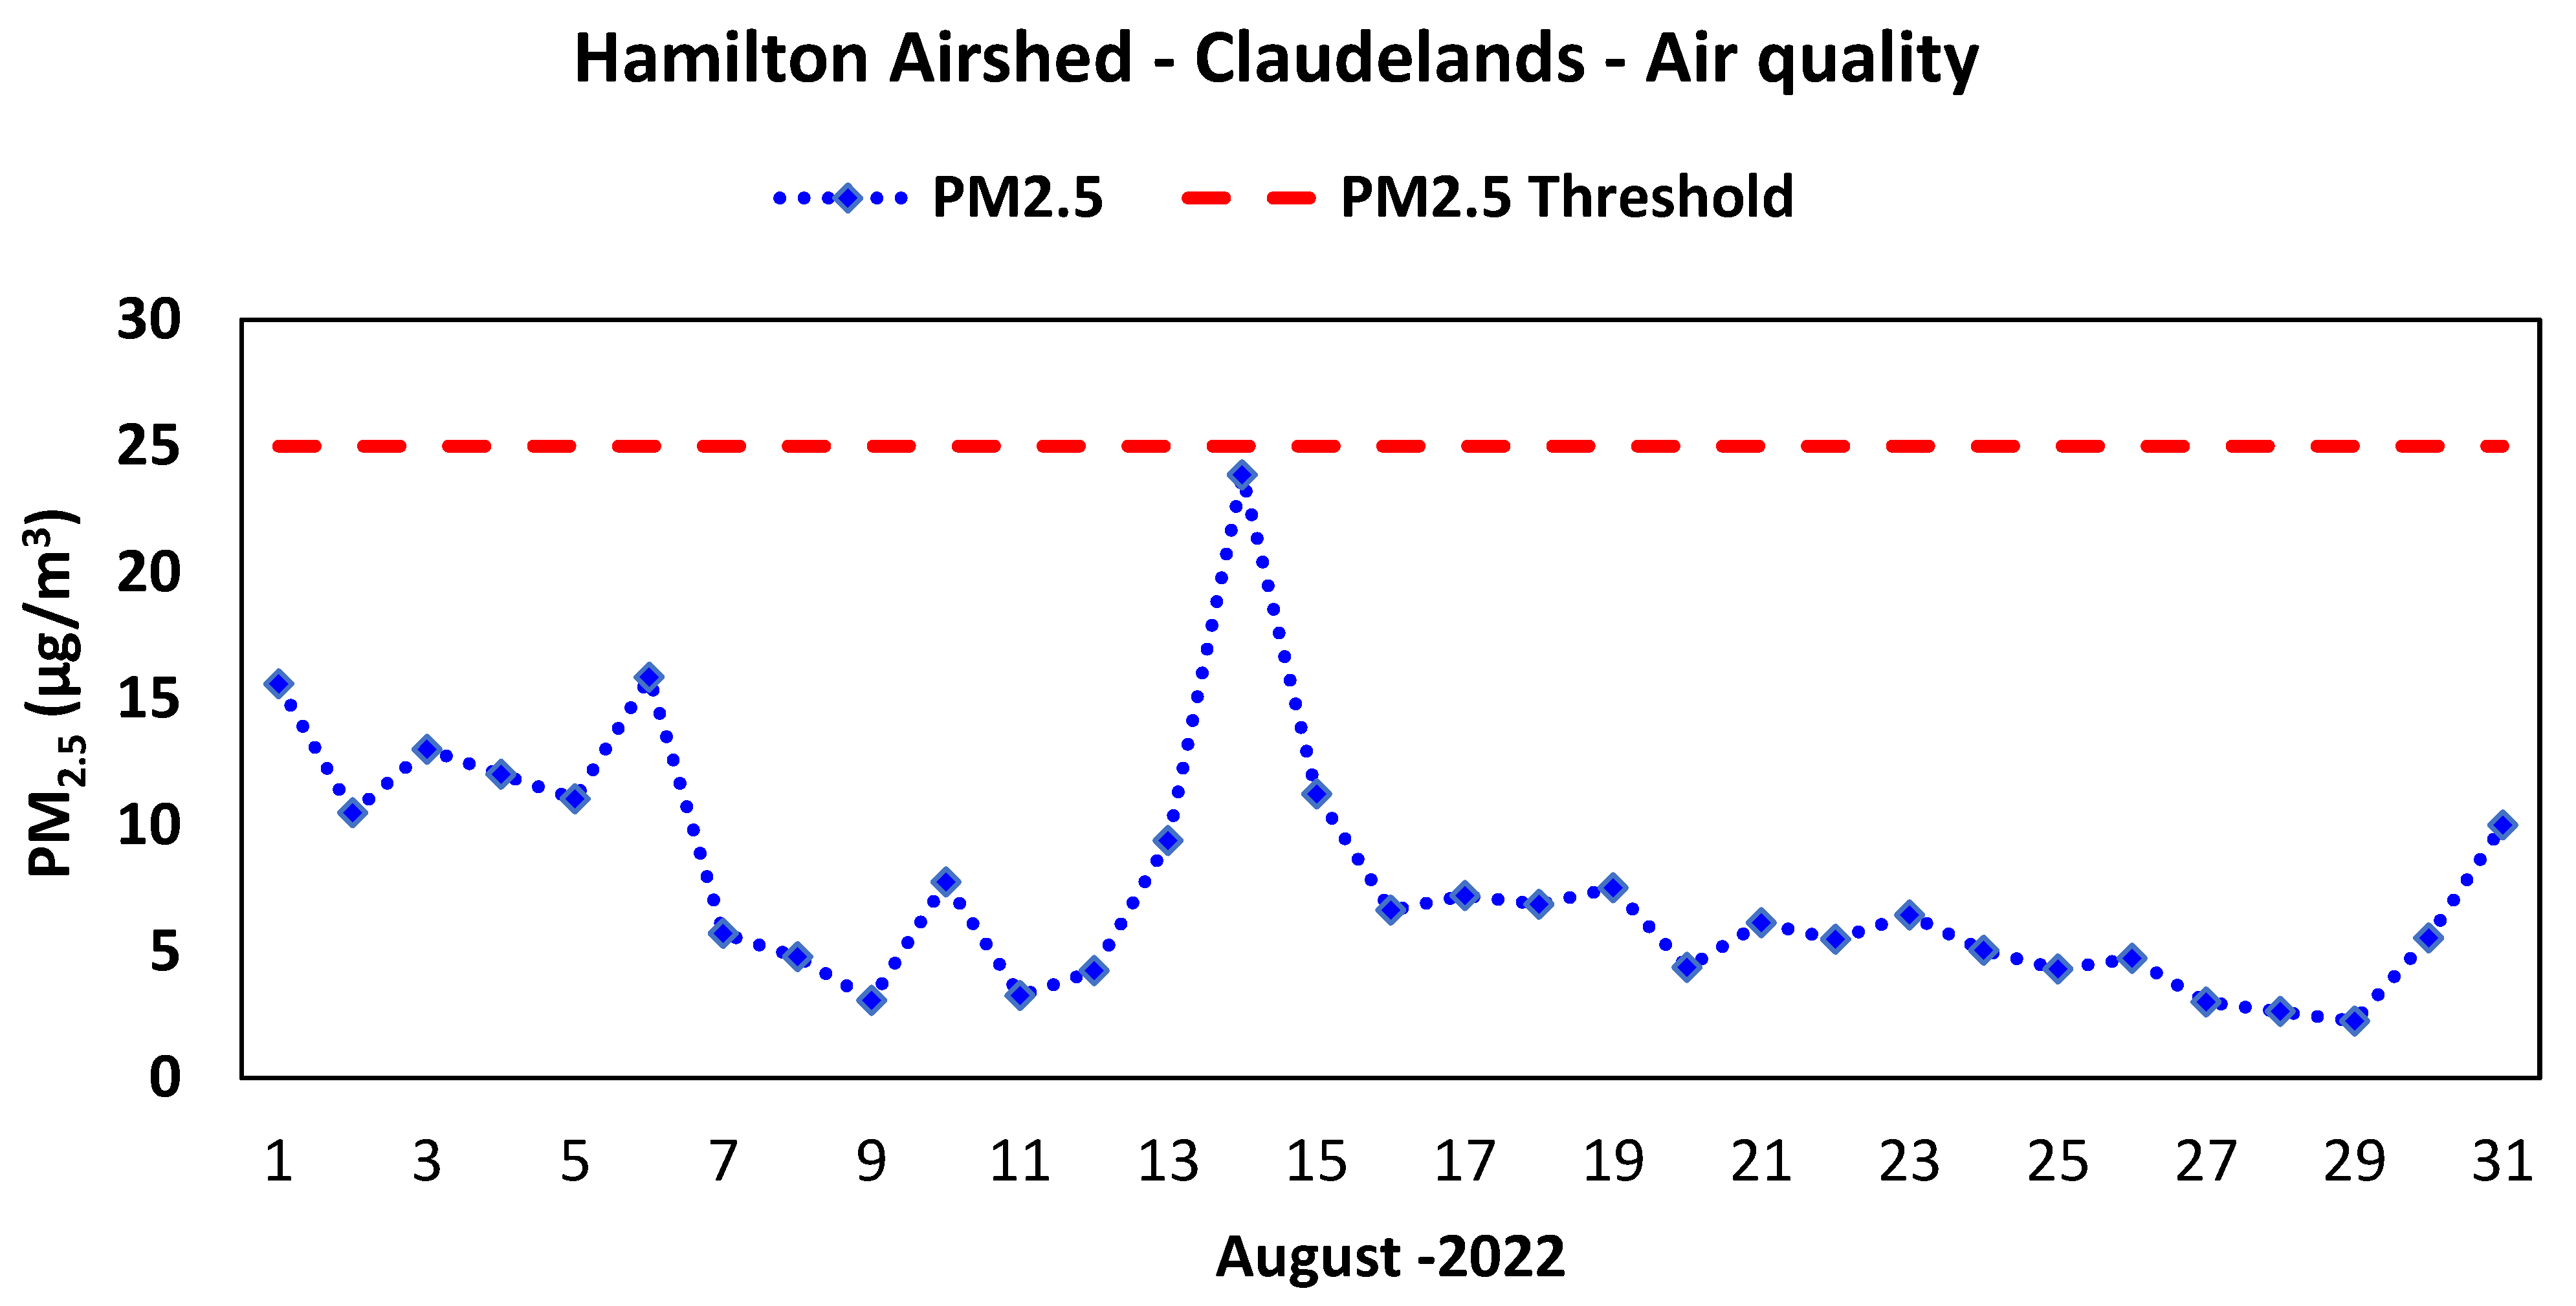
- Waikato Regional Council, Environmental Maps and Data, Hamilton Airshed-Claudelands-Air Quality. Available online: https://waikatoregion.govt.nz/environment/envirohub/environmental-maps-and-data/station/967611/PM2.5?dt=PM+2.5 (accessed on 22 December 2022).
- Rodriguez, A.; De Toro, I.; Mediavilla, M.; Fiñana, M.; Maldonado, R.; Rodríguez-Rodríguez, D.; Leyva, L. Growth promotion efficiency of dehydrated agar settle plates used for monitoring viable particles in grade A environments. Cytotherapy 2017, 19, S88. [Google Scholar] [CrossRef]
- Baxi, S.N.; Muilenberg, M.L.; Rogers, C.A.; Sheehan, W.J.; Gaffin, J.; Permaul, P.; Kopel, L.S.; Lai, P.S.; Lane, J.P.; Bailey, A.; et al. Exposures to molds in school classrooms of children with asthma. Pediatr. Allergy Immunol. 2013, 24, 697–703. [Google Scholar] [CrossRef]
- Stetka, B. The Human Body’s Complicated Relationship with Fungi. NPR. 16 April 2016. Available online: https://www.npr.org/sections/health-shots/2016/04/16/474375734/the-human-body-s-complicated-relationship-with-fungus (accessed on 22 December 2022).
- Ghannoum, M.A.; Jurevic, R.J.; Mukherjee, P.K.; Cui, F.; Sikaroodi, M.; Naqvi, A.; Gillevet, P.M. Characterization of the oral fungal microbiome (mycobiome) in healthy individuals. PLoS Pathog. 2010, 6, e1000713. [Google Scholar] [CrossRef] [PubMed]
- Niu, M.; Hu, W.; Cheng, B.; Wu, L.; Ren, L.; Deng, J.; Shen, F.; Fu, P. Influence of rainfall on fungal aerobiota in the urban atmosphere over Tianjin, China: A case study. Atmos. Environ. X 2021, 12, 100137. [Google Scholar] [CrossRef]
- United States Environmental Protection Agency, US EPA, O. How do I Get Rid of Mold? 19 February 2019. Available online: https://www.epa.gov/mold/how-do-i-get-rid-mold (accessed on 22 December 2022).
- Baxi, S.N.; Sheehan, W.J.; Sordillo, J.E.; Muilenberg, M.L.; Rogers, C.A.; Gaffin, J.; Permaul, P.; Lai, P.S.; Louisias, M.; Petty, C.R.; et al. Association between fungal spore exposure in inner-city schools and asthma morbidity. Ann. Allergy Asthma Immunol. 2019, 122, 610–615. [Google Scholar] [CrossRef] [PubMed]


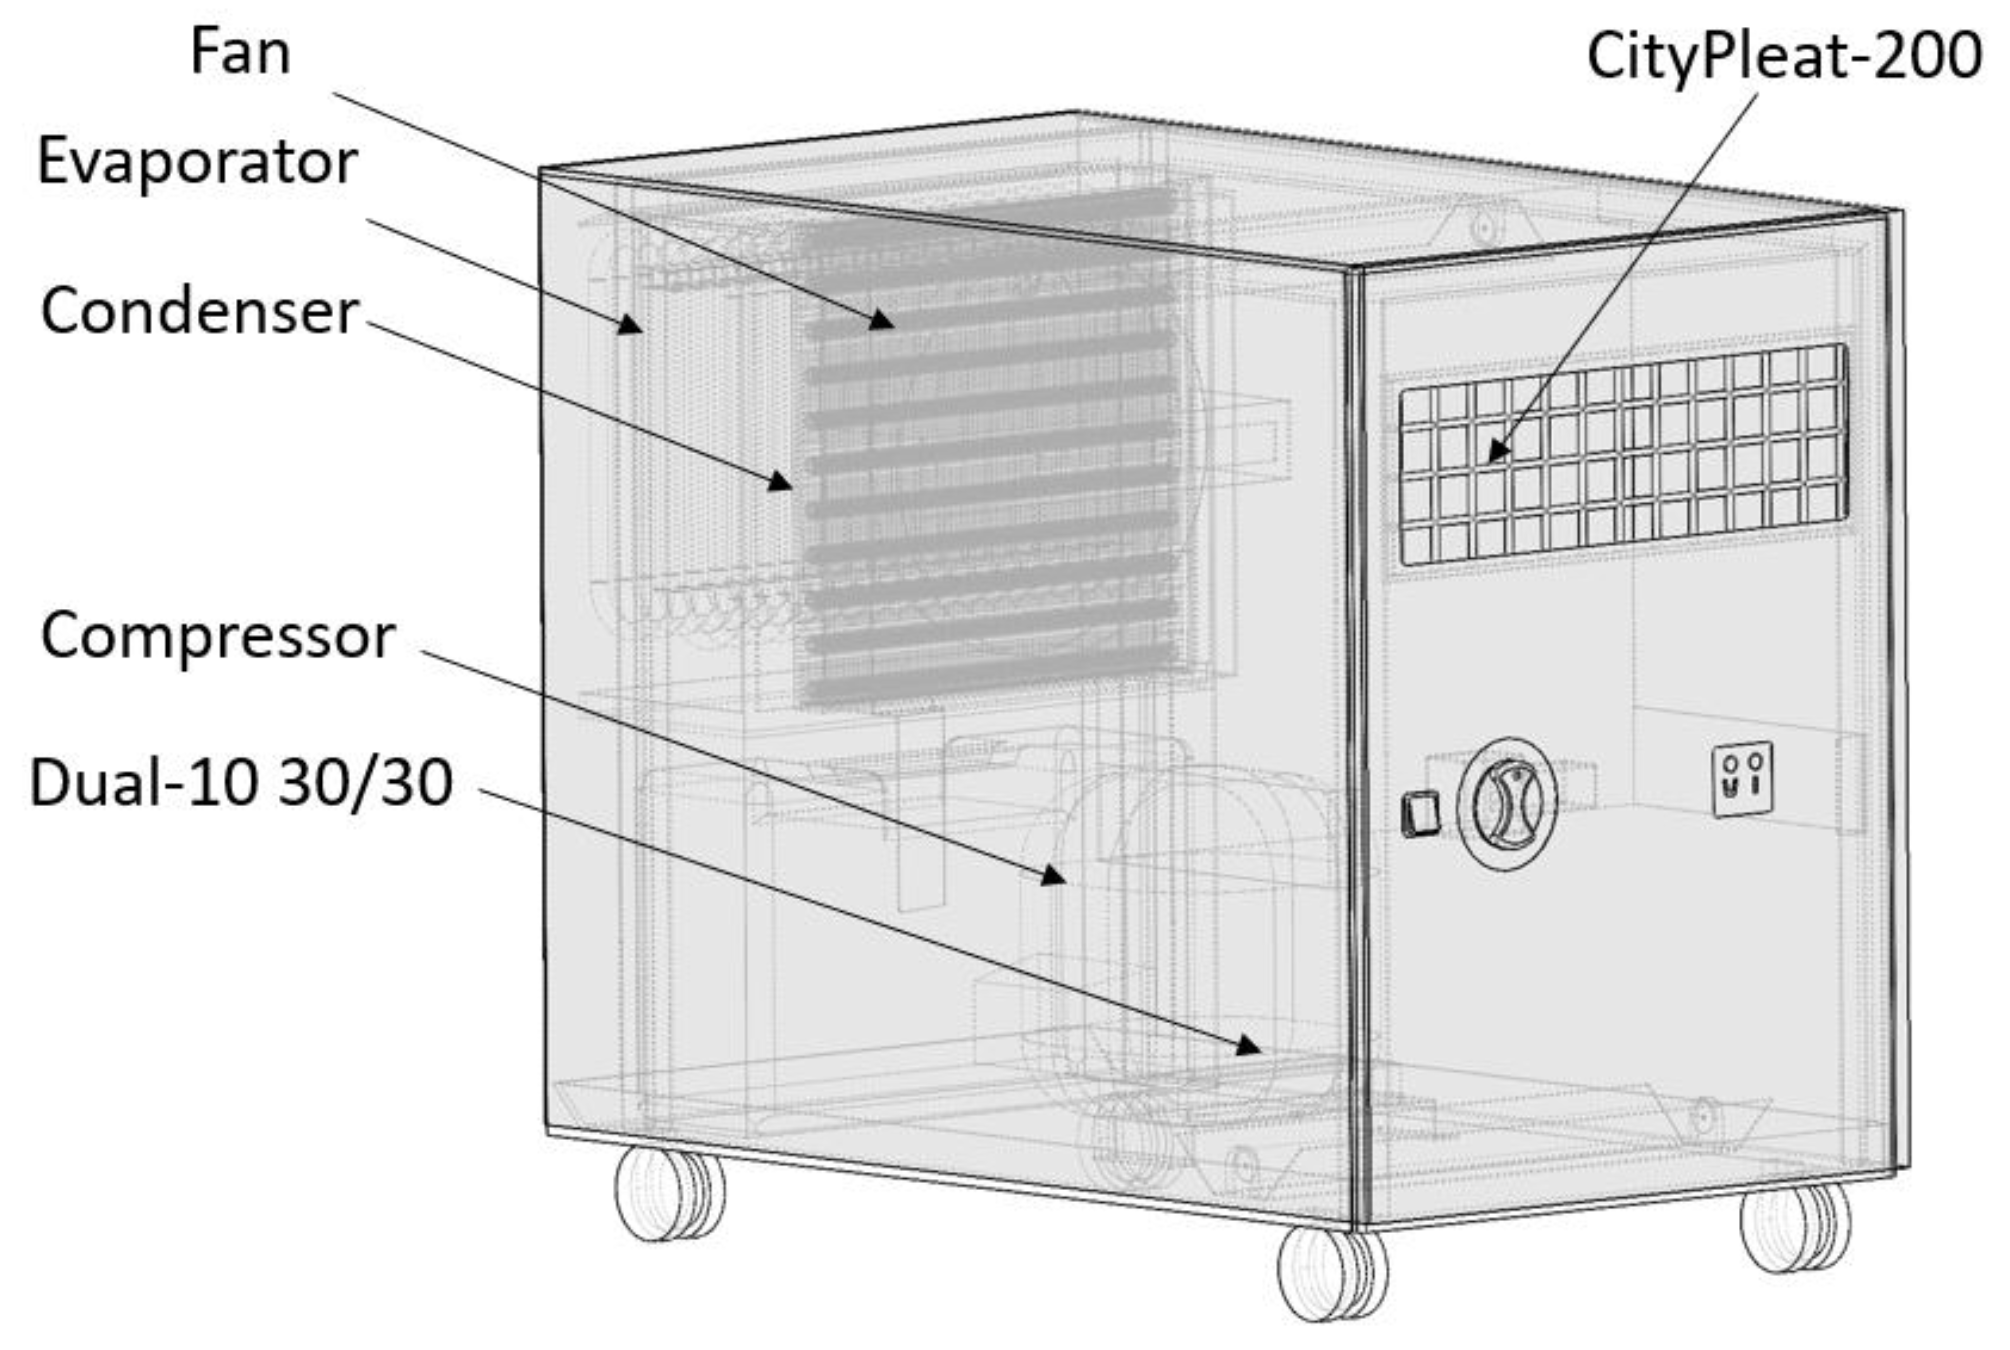
| Filter Type | Dual-30/30 | CityPleat |
|---|---|---|
| Filter Dimensions (Width, Height, Depth) | (289, 594, 44) mm | (289, 594, 44) mm |
| ASHRAE Filter Class | MERV 8 | MERV A 7A |
| Material | Polyester | Synthetic fibre |
| Operation Conditions Max. Temperature Humidity | 100% | 30–70% |
| Weight and Initial Pressure Drop | 0.6 kg, 70 Pa | 0.9 kg, 135 Pa |
| Airflow | 1700 m3/h | 1500 m3/h |
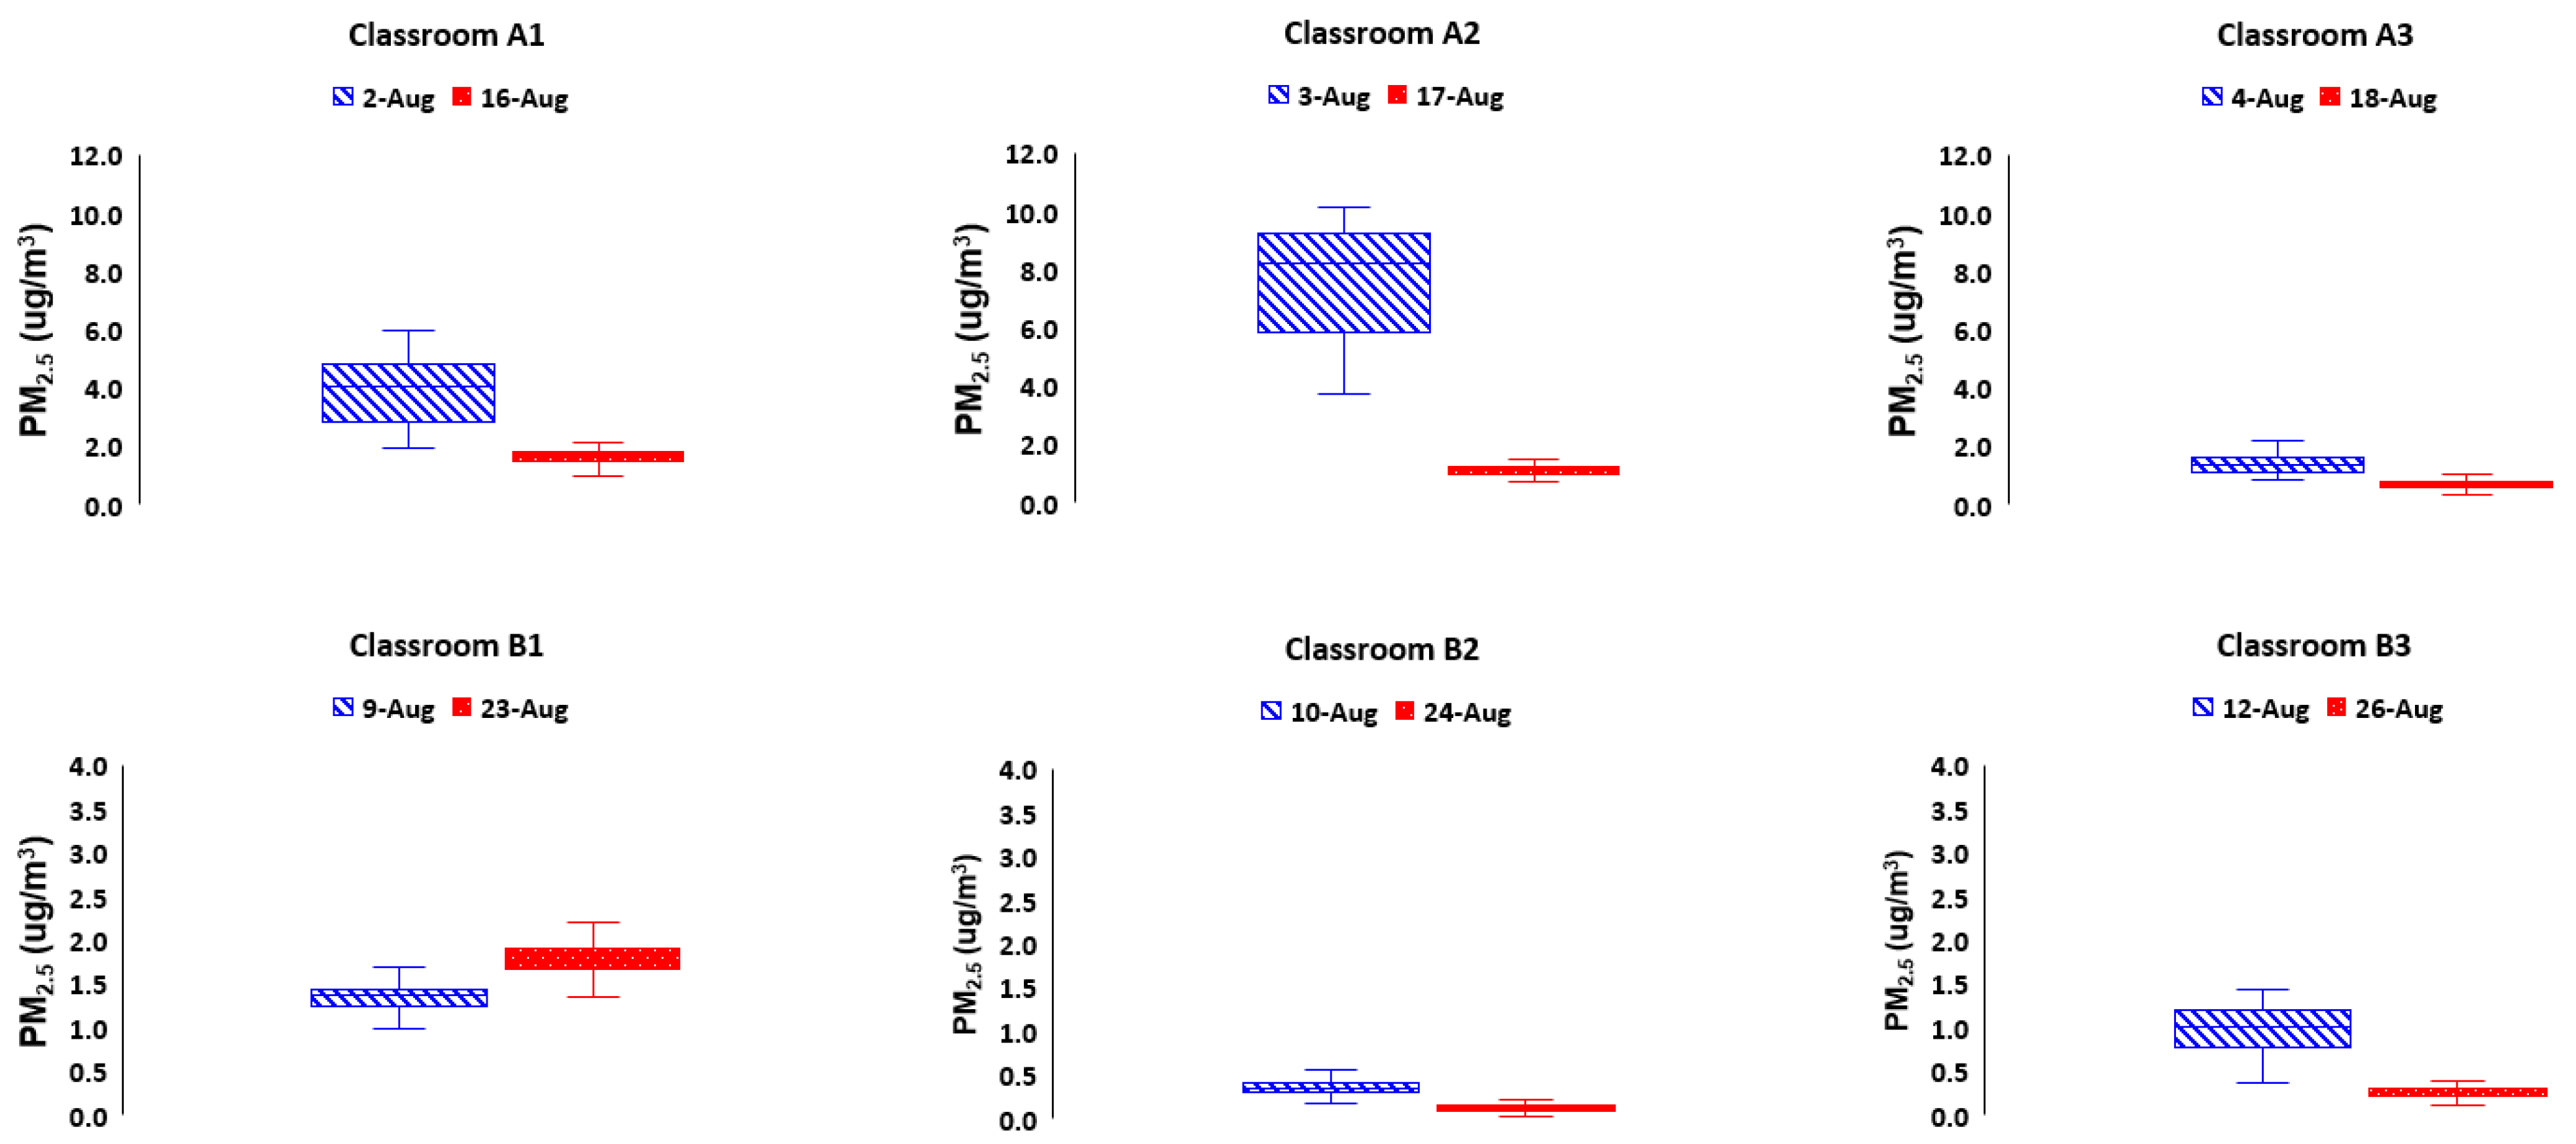
| Classroom | Date | /m3) | Change in Average PM2.5 Concentration (%) |
|---|---|---|---|
| A1 | 2 August 2022 | 3.93 | −59 |
| 16 August 2022 | 1.62 | ||
| A2 | 3 August 2022 | 7.64 | −85 |
| 17 August 2022 | 1.11 | ||
| A3 | 4 August 2022 | 1.39 | −50 |
| 18 August 2022 | 0.70 | ||
| B1 | 9 August 2022 | 1.36 | 33 |
| 23 August 2022 | 1.81 | ||
| B2 | 10 August 2022 | 0.37 | −64 |
| 24 August 2022 | 0.13 | ||
| B3 | 12 August 2022 | 0.98 | −73 |
| 26 August 2022 | 0.26 |
| Classroom | Date | /m3) |
|---|---|---|
| A1 | 2 August 2022 | 7.2 |
| 16 August 2022 | 6.7 | |
| A2 | 3 August 2022 | 21.7 |
| 17 August 2022 | 7.2 | |
| A3 | 4 August 2022 | 3.9 |
| 18 August 2022 | 4.6 | |
| B1 | 9 August 2022 | 2.5 |
| 23 August 2022 | 6.7 | |
| B2 | 10 August 2022 | 2.3 |
| 24 August 2022 | 5.3 | |
| B3 | 12 August 2022 | 2 |
| 26 August 2022 | 4.3 |
Disclaimer/Publisher’s Note: The statements, opinions and data contained in all publications are solely those of the individual author(s) and contributor(s) and not of MDPI and/or the editor(s). MDPI and/or the editor(s) disclaim responsibility for any injury to people or property resulting from any ideas, methods, instructions or products referred to in the content. |
© 2023 by the authors. Licensee MDPI, Basel, Switzerland. This article is an open access article distributed under the terms and conditions of the Creative Commons Attribution (CC BY) license (https://creativecommons.org/licenses/by/4.0/).
Share and Cite
Williams, K.; Jones, R.J.; Al-Rawi, M. Particulate Matter (PM2.5) and Mould Characteristics in Selected Classrooms Located in Waikato, New Zealand: Preliminary Results. Environments 2023, 10, 182. https://doi.org/10.3390/environments10100182
Williams K, Jones RJ, Al-Rawi M. Particulate Matter (PM2.5) and Mould Characteristics in Selected Classrooms Located in Waikato, New Zealand: Preliminary Results. Environments. 2023; 10(10):182. https://doi.org/10.3390/environments10100182
Chicago/Turabian StyleWilliams, Kaia, Rhys J. Jones, and Mohammad Al-Rawi. 2023. "Particulate Matter (PM2.5) and Mould Characteristics in Selected Classrooms Located in Waikato, New Zealand: Preliminary Results" Environments 10, no. 10: 182. https://doi.org/10.3390/environments10100182
APA StyleWilliams, K., Jones, R. J., & Al-Rawi, M. (2023). Particulate Matter (PM2.5) and Mould Characteristics in Selected Classrooms Located in Waikato, New Zealand: Preliminary Results. Environments, 10(10), 182. https://doi.org/10.3390/environments10100182