Article

Effects of Substituting Activated Carbon with Titanium-Dioxide-Coated Cenospheres in Conventional Aquarium Filters

1
Center for Advanced Materials Joining, University of Waterloo, Waterloo, ON N2L 3G1, Canada
2
Department of Biology, University of Waterloo, Waterloo, ON N2L 3G1, Canada
3
Department of Mechanical Engineering, York University, Toronto, ON M3J 1P3, Canada
*
Author to whom correspondence should be addressed.
These authors contributed equally to this work.
Environments 2023, 10(11), 188; https://doi.org/10.3390/environments10110188
Submission received: 4 July 2023 / Revised: 11 October 2023 / Accepted: 24 October 2023 / Published: 31 October 2023
(This article belongs to the Special Issue Photocatalytic Applications in Wastewater Treatment)

Abstract

:
We investigated the effectiveness of TiO2 cenospheres in reducing the concentrations of three common harmful compounds, ammonium, nitrate, and nitrite, in fish aquariums. These cenospheres can contribute to more sustainable and eco-friendly aquarium filtration systems while also improving the health of fish. We designed a 30-day experiment with three treatment groups based on the filter type: (1) a control group with a conventional aquarium filter, (2) a group with a TiO2 cenosphere filter, and (3) a group with a dark TiO2 cenosphere filter. The water quality was the same baseline in all groups, and each tank was monitored daily for changes in temperature, pH, ammonia, nitrate, and nitrite concentrations. We found that the TiO2 cenosphere filter was effective in reducing the concentrations of all three pollutants. By the end of the experimental period, the average concentration of nitrite in the control group was 10.7 µM, while the average concentration in the TiO2 cenosphere filter group dropped 55% to 4.7 µM from the baseline. The average concentration of nitrate was reduced by 17% and ammonia by 28% in the cenosphere-treated group. Hence, the cenospheres were effective in reducing the concentrations of all three pollutants, with the greatest reduction seen for nitrite. These findings support further investigation for incorporating TiO2 cenospheres into aquarium filtration to help reduce the environmental burden of the aquarium industry.

1. Introduction

Applying green chemistry and sustainable alternatives is in high demand across all industrial sectors due, in part, to the large throughput of global waste production [1]. The concept of green chemistry is underpinned by a need to effectively reduce waste and harmful by-products while encouraging the re-use of materials to extend the life cycle of products and maintain profitability. Among strong candidates in green chemistry applications are cenospheres. These particles consist of hollow alumina and silica spheres filled with a mixture of gases such as nitrogen, oxygen, and carbon dioxide [2]. These are naturally occurring components in the fly ash generated in coal-fired power plants [3,4]. These micro-sized, bio-waste spheres are used for a wide range of applications, from concrete [5] to waste containment [6] to water filtration [7]. Our work herein contributes new findings on using TiO2 cenospheres for water filtration in aquariums.
In conventional aquarium filters, the tank can contain biological, chemical, and mechanical filters. The biofilters—or ceramic bio-rings—are capable of supporting water-purifying bacteria. Chemical filters are made of activated carbon to absorb contaminants, and mechanical filters function as physical traps to strain solid waste. However, the current forms of conventional chemical filters require either frequent replacement or cleaning, which leads to both a time-consuming and expensive drawback. Additionally, the effectiveness of filtration significantly decreases as water flow increases [8,9]. We propose a green chemistry alternative using TiO2-coated cenospheres to improve the efficacy of aquarium filters.
Our objective was to determine the effectiveness of TiO2 on the concentrations of ammonium, nitrate, and nitrite in fish aquariums as a better alternative to activated carbon in conventional aquarium filters. We specifically used a UV 3-watt germicidal aquarium-based lamp for this work rather than that of UV LEDs, as the end application is tailored for custom aquarium systems. We compared the water quality filtered with activated carbon with the water quality of 3D-fabricated filters equipped with TiO2-coated cenospheres. The filament of the filters is a blend of polylactic acid (PLA) and polyhydroxyalkanoates (PHA). Both are biodegradable polymers made by bacterial fermentation of either cornstarch or cane sugar. This composite blend is tougher to water exposure than normal PLA yet still very flexible, so its handling in aquarium filters is easy, environmentally feasible, and stable for the life cycle of the filter. The filaments were equipped with TiO2-coated cenospheres, which were used as photocatalysts to reduce the ammonium in the fish tanks; in addition, this compound can degrade nitrite to ammonia, further purifying the water. The water would enter through a nylon mesh, react with the cenospheres, and leave from the side to return to the tanks. UV lamps were fixed on top of the aquariums to be used as a light source. This work represents a more sustainable and eco-friendly alternative to aquarium fish tanks and can be more cost-effective on a larger, long-term scale once optimized.

2. Materials and Methods
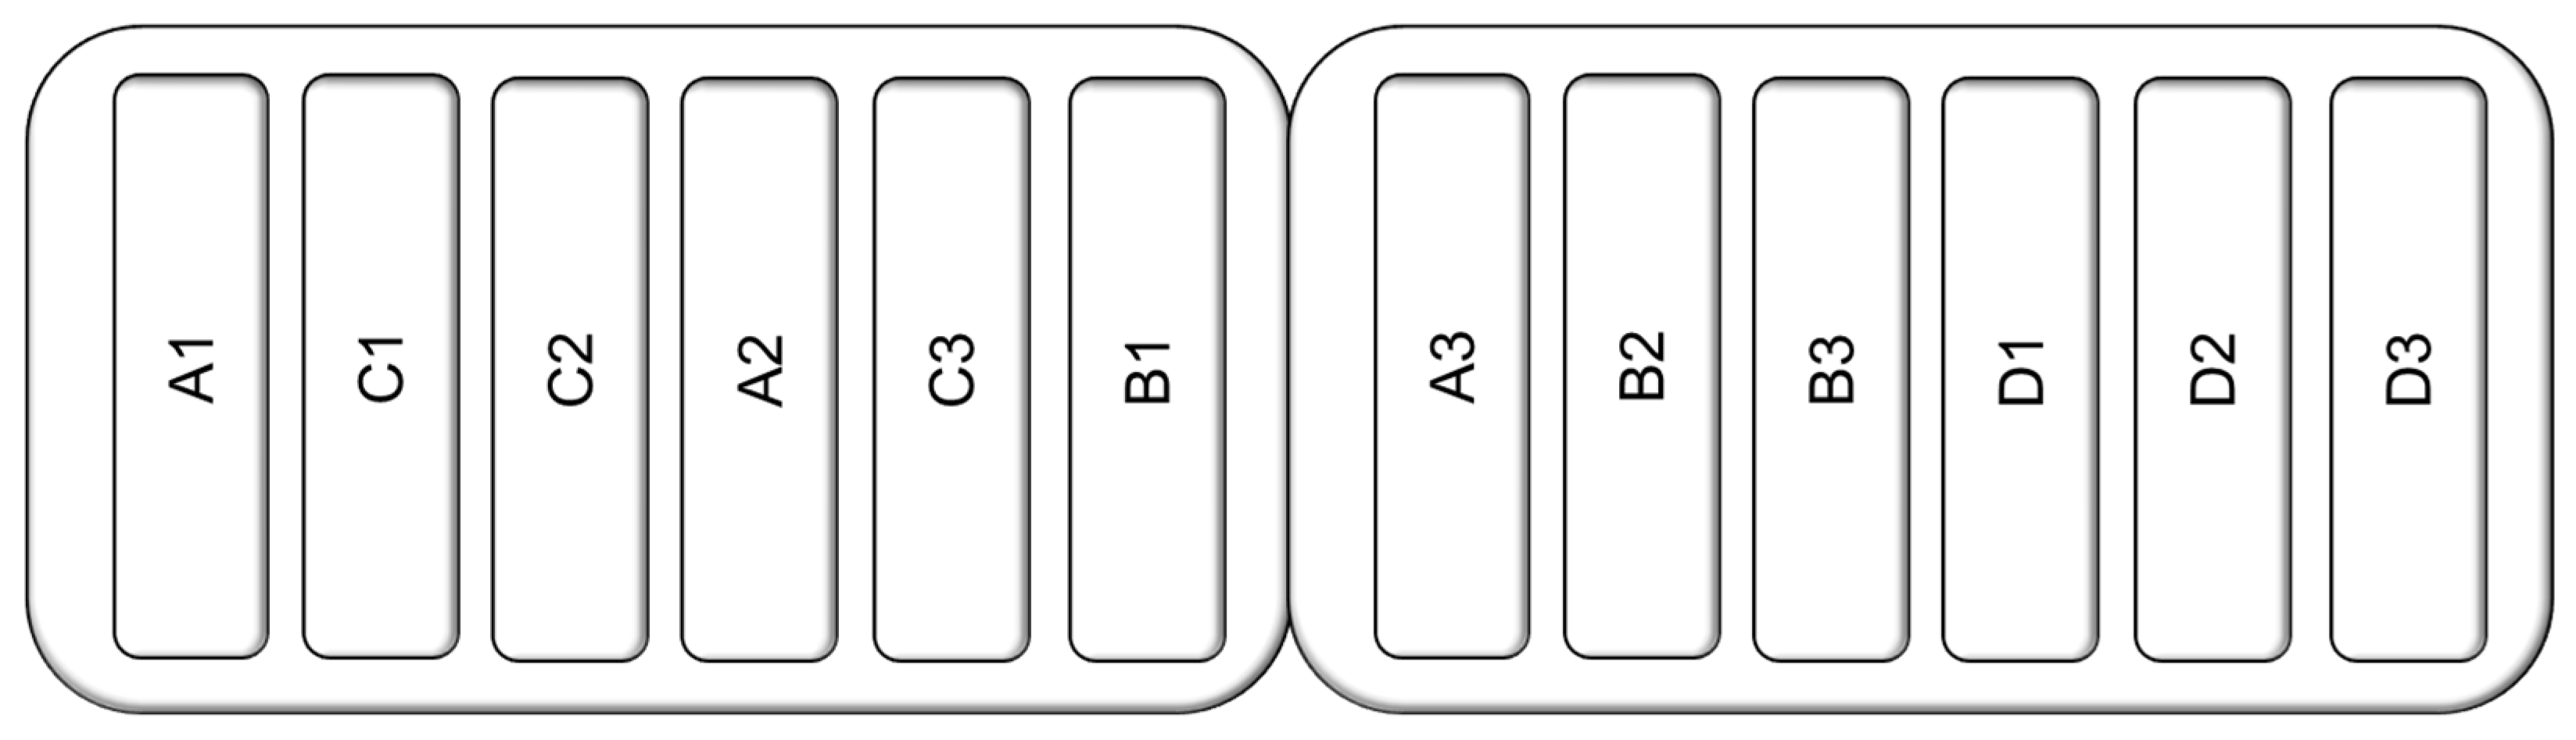
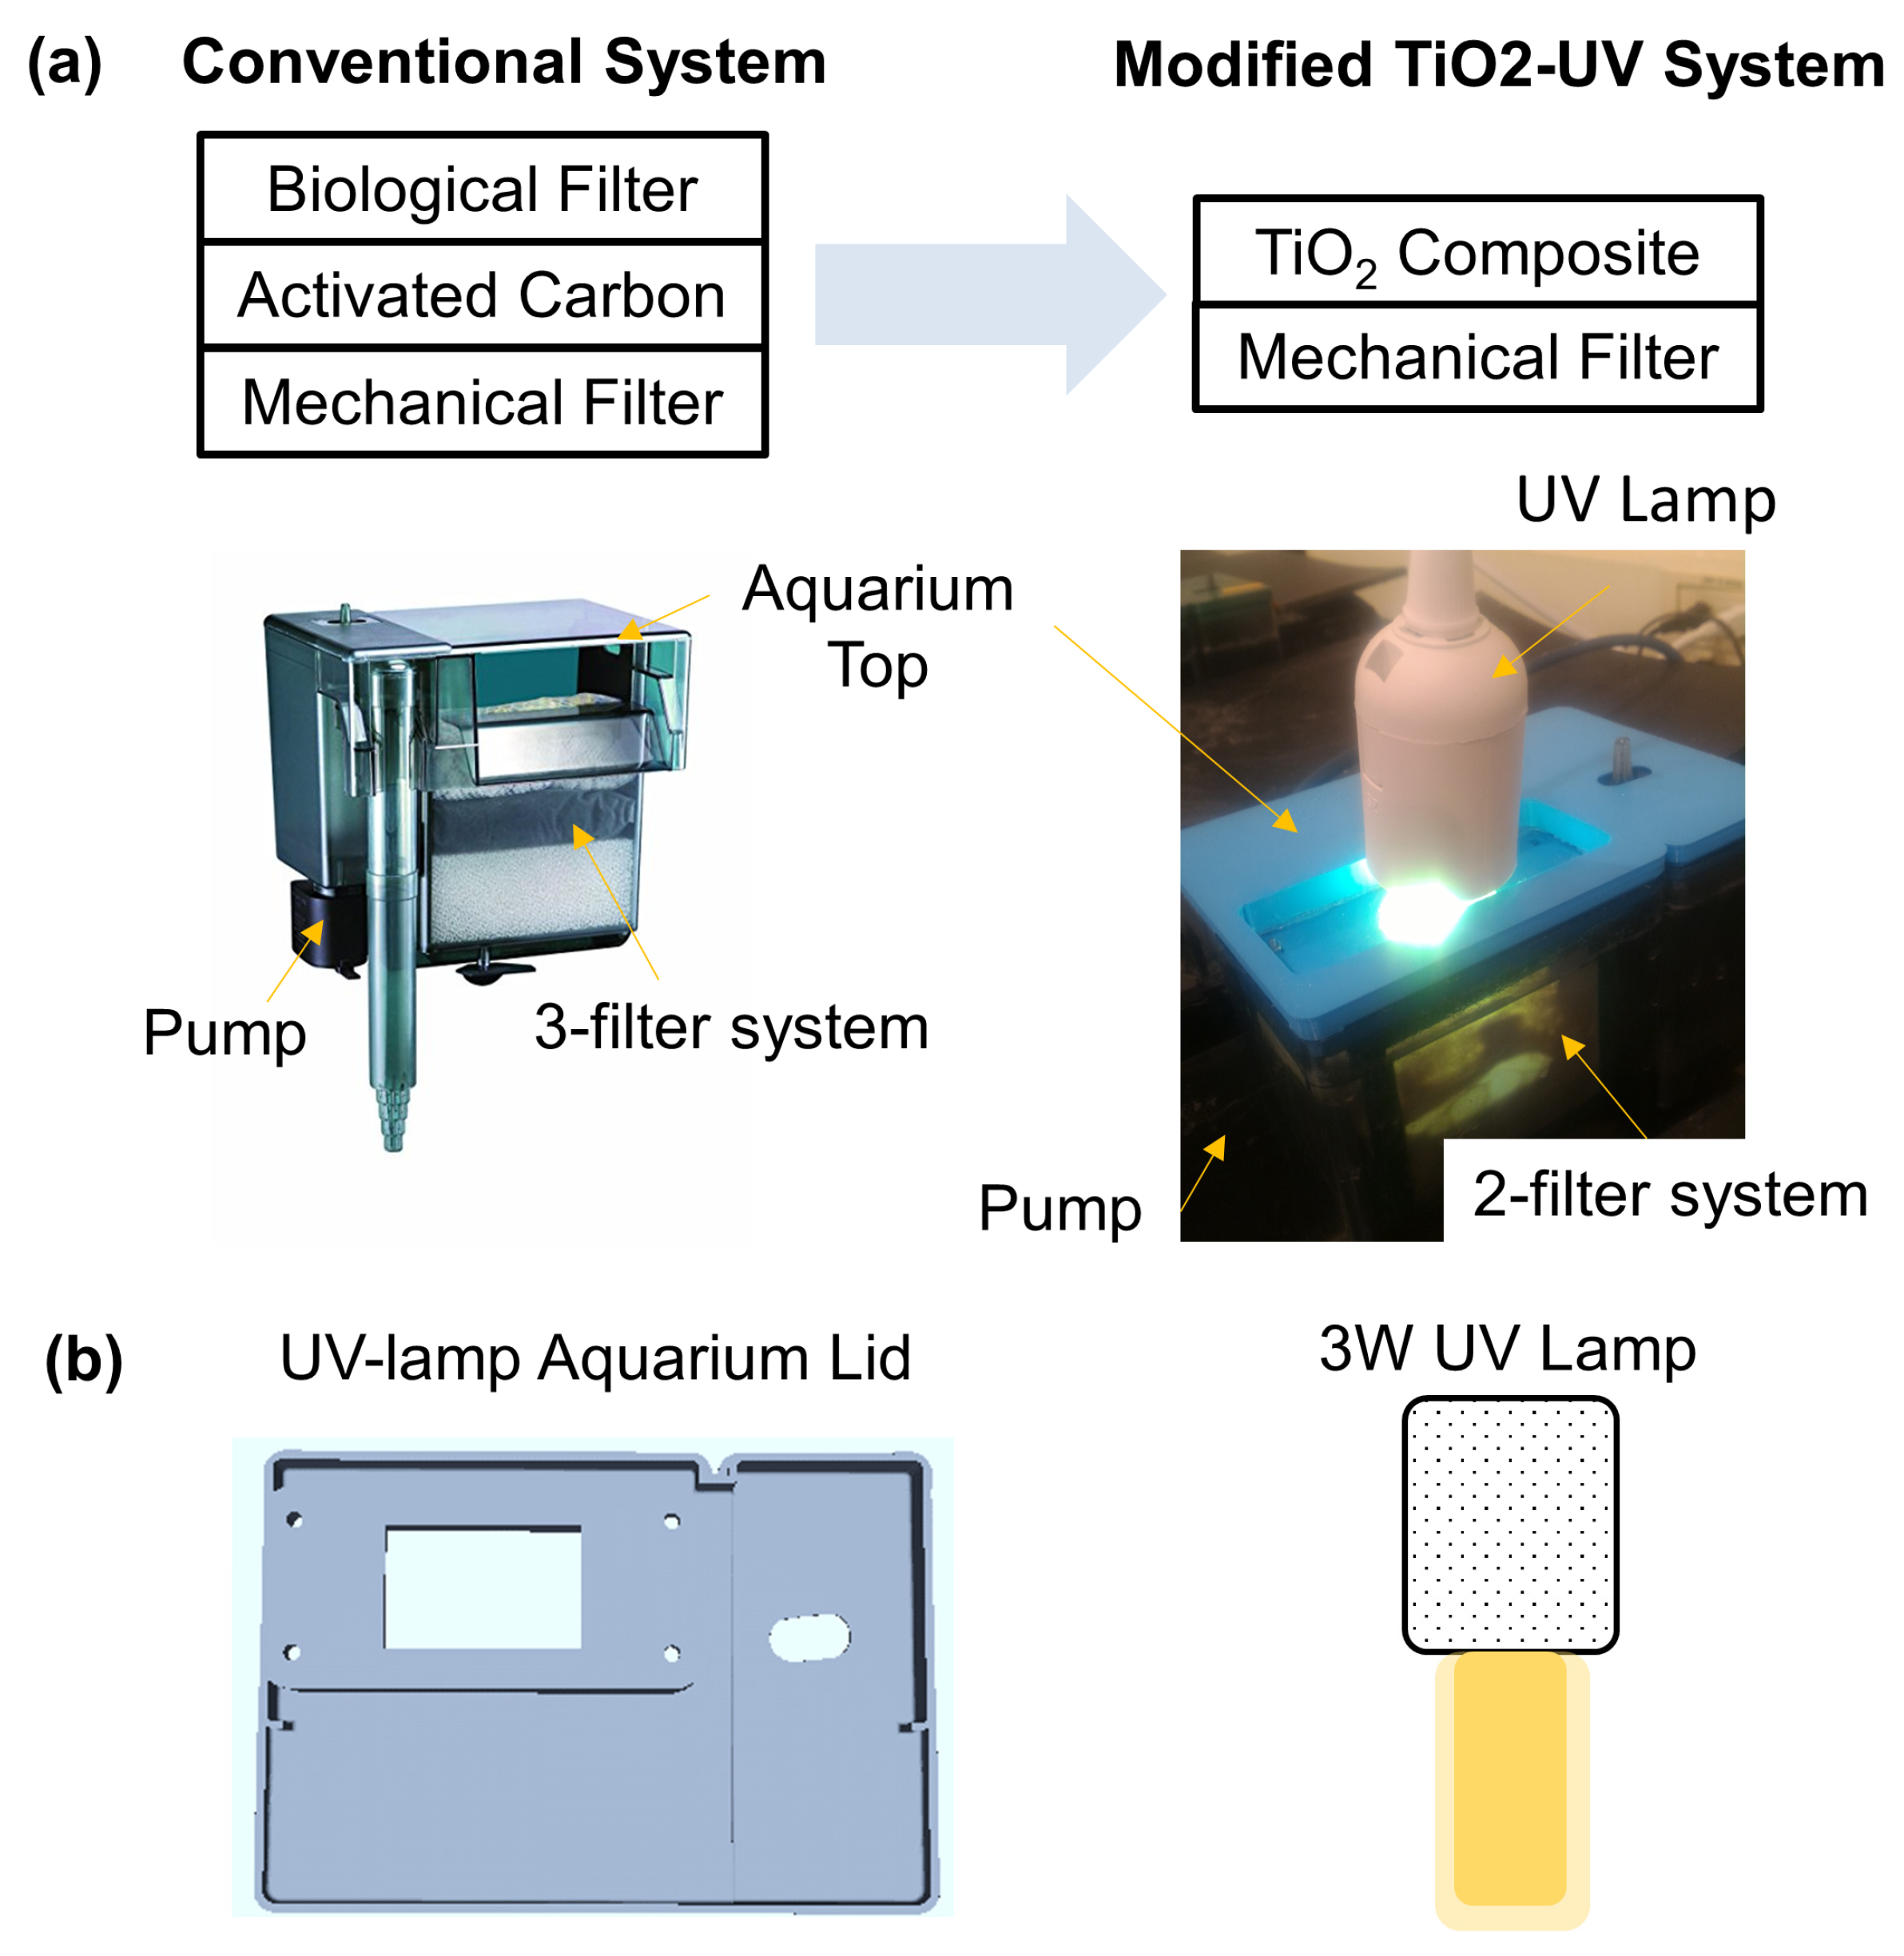
EconoStar 200/600 Cenospheres (Cenostar Corporation, Newburyport, MN, USA). The particle size range, as provided by the manufacturer, is 10–106 µm, where the majority of the sample (55–86%) were within 45–105 µm. Cenospheres had a melting point between 1200–1400 °C and a thermal conductivity of 0.1–0.2 W/mK. Their compositions were 50–60 wt% silica, 22–30 wt% alumina and 1.5–3.0 wt% Iron. All chemicals were obtained from Sigma-Aldrich (St. Louis, MI, USA). Three-dimensional printing models obtained from Luzbot Taz 6 (Lulzbot, Fargo, ND, USA) and Ngen filament (ColorFabb, Belfeld, The Netherlands). Tedpella 2″ × 1″ 1 mm thick quartz slide (Ted Pella, Inc., Redding, CA, USA). Ushio GTL3 3W UV Germicidal lamp with 15 V transformer. Aqueon Bio-ceramic rings and mechanical filter pad, seapora filter floss pad 10″ × 12″ (Big Als Pets, Mississauga, ON, Canada) in 10-gallon aquarium tank.
Preparation of the cenospheres occurred by removing organics from commercial cenospheres via thermal oxidation at 600 °C for 8 h. A total of 15 mL of 0.1 M Titanium (IV) isopropoxide (TTIP) (97%) in 500 mL isopropyl alcohol (IPA) in a 1 L plastic bottle with wide mouth was stirred for 30 min until homogeneous. Afterwards, 100 g of the prepared cenospheres was added, which was subsequently shaken in a shaker for 12 h with magnetic stir rod. MilliQ water (5 mL) was added at a rate of 1 mL/min, and the solution was rotary evaporated to obtain a dry grey powder, which was then left at 100 °C for 1 h, then 600 °C for 8 h to ensure elimination of any excess moisture. The procedure was adapted from work by Jasra et al. [10]. Cenospheres were quantified by measuring the formation of 2-hydroxyterephthalic acid (HTPA) as a probe molecule since it is the product of a hydroxyl radical reaction with Terephthalic acid (TPA). Therefore, TPA degradation was used to track HTPA formation, and fluorescence (SpectraMax M3, Molecular devices, San Jose, CA, USA) was performed using previous protocols from our group [11,12,13]. This form of TPA assay allows to determine the degradation rate of the cenopheres. Approximately 0.831 g of TPA was dissolved in 6 mM NaOH/MilliQ. Cenospheres were added to the solution in order to reach a final concentration of 0.1 g/L. The assay was conducted under light for up to 300 min. Under a wavelength of 315 nm (λex), emission spectra from 350–550 nm were studied as per our previous work [11]. We used the same equation of formation constant rate for HTPA, k1 as in the 2017 study, and the kinetic model is as shown:
d C H T P A d t = k 1 k 2 C H T P A
where CHTPA is the molar concentration of HTPA, k1 is the zero-order HTPA formation rate, and k2 is the pseudo-first-order kinetic degradation rate. The following fitting function was used:
C H T P A = k 1 k 2   ( 1 e k 2 t )
The initial rate constant of k1 was used to compare the photocatalysts. The HTPA formation rate was measured under various pulse frequencies (v = 25 Hz, 5 Hz, 0.5 Hz, and 0.05 Hz) at a constant duty cycle of γ = 50%.
Fathead minnows (Pimephales promelas) males and females, 5–6 cm in length, were obtained from the Laurier Institute for Water Science MacLatchy lab (Wilfrid Laurier University, Waterloo, ON, Canada) and were acclimated for two weeks with conventional filters prior to changing the filters for the experiment. Ten fish were kept per tank, with a photoperiod of 12 h with dawn and dusk settings. The water quality was evaluated for weekly temperature, ammonia, nitrates/nitrites, and pH. The water was changed monthly. The TiO2 filter is used instead of the chemical filter for Tanks A1-3 and replaces both the chemical and biofilter in Tanks B1-3. The fish were not exposed to any other chemical sources and remained in the tanks throughout the testing period.
A Renishaw micro-Raman spectrometer was used for Raman spectroscopic characterization and was equipped with a reflected light microscope, enabling a mini-analyzed area of 5 micrometers. The microscope is equipped with 5, 20, 50 times objectives and an electrically adjustable sample stage. Excitation is accomplished at 633 nm (red, He-Ne). The resolution of Raman shift is 0.5 wave numbers. Scanning electron microscopy (SEM) images were taken with a JEOL 6610LV (Tokyo, Japan) tungsten filament equipped SEM with selectable low vacuum mode, where the samples were powders mounted on copper tape.

Experimental Design

Fish tank experiments occurred at the Waterloo Aquatic Threats in Environmental Research (WATER) facility in the Department of Biology at the University of Waterloo under AUPP 40315. The setup of the tanks was arranged as per Figure 1. The filters in tanks A1, A2, and A3 had a UV TiO2 filter, a biofilter and a mechanical filter. The filters in tanks B1, B2, and B3 had a UV TiO2 filter and a mechanical one. Tanks C1, C2, and C3 were controls containing biological, mechanical, and chemical filters. The filters in tanks D1, D2, and D3 had a dark TiO2 filter, a biofilter and a mechanical filter shown and were used as extra tanks. Figure 2 shows a comparison between a conventional system and our modified TiO2-UV setup. The biofilter and bio rings are placed at the top, superimposed on the chemical filter with activated carbon. The mechanical filter resides on the bottom. Each of the tanks contained 20 fathead minnows (Pimephales promelas). Fish were fed freeze dried bloodworms daily. Additional information on the setup is shown in the supplemental information Figures S1–S3.
The fathead minnows were placed 20 into a tank and tracked equally for the duration of the filtration experimentation. Three tanks (A) contained a UV TiO2 cenospheres filter, with biofilter and mechanical filter. Three tanks (B) contained a UV TiO2 cenospheres filter with biofilter. There was one control tank (C) and three additional tanks (D) that contained a dark TiO2 cenospheres filter with bio and mechanical filter. Concentration analysis was performed based on ammonium colorimetric assay [14]. To check and compare the concentration of ammonium in all tanks, an ammonium colorimetric assay procedure was developed with the help of the phenolhypochlorite method. Standard solutions were prepared by serial dilution to stock ammonium chloride. Phenol, nitroprusside, and oxidizing reagents were added to water samples and standards. Additionally, the ammonium reacts with phenol and hypochlorite under alkaline conditions to form a blue color; the color intensity is proportional to an increase in ammonia concentration, and the nitroprusside is used as a catalyst to facilitate color development. These solutions were plated and read by absorbance endpoint at 640 nm. A nitrite colorimetric assay was also conducted where sulfanilamide and N-(1-napthyl)-ethylenediamine (NED) were added. These were determined under the absorbance at 540 nm. To check and compare the concentration of nitrate and nitrite in the water, a nitrite colorimetric assay procedure was developed with the help of existing techniques. Standard solutions were prepared by serial dilution. As per Scheme 1, the nitrite is first converted into an azo dye compound by adding sulfanilamide. NED was then added to react through a diazonium coupling reaction for the dye product. The plate was then read by absorbance at 540 nm.

3. Results

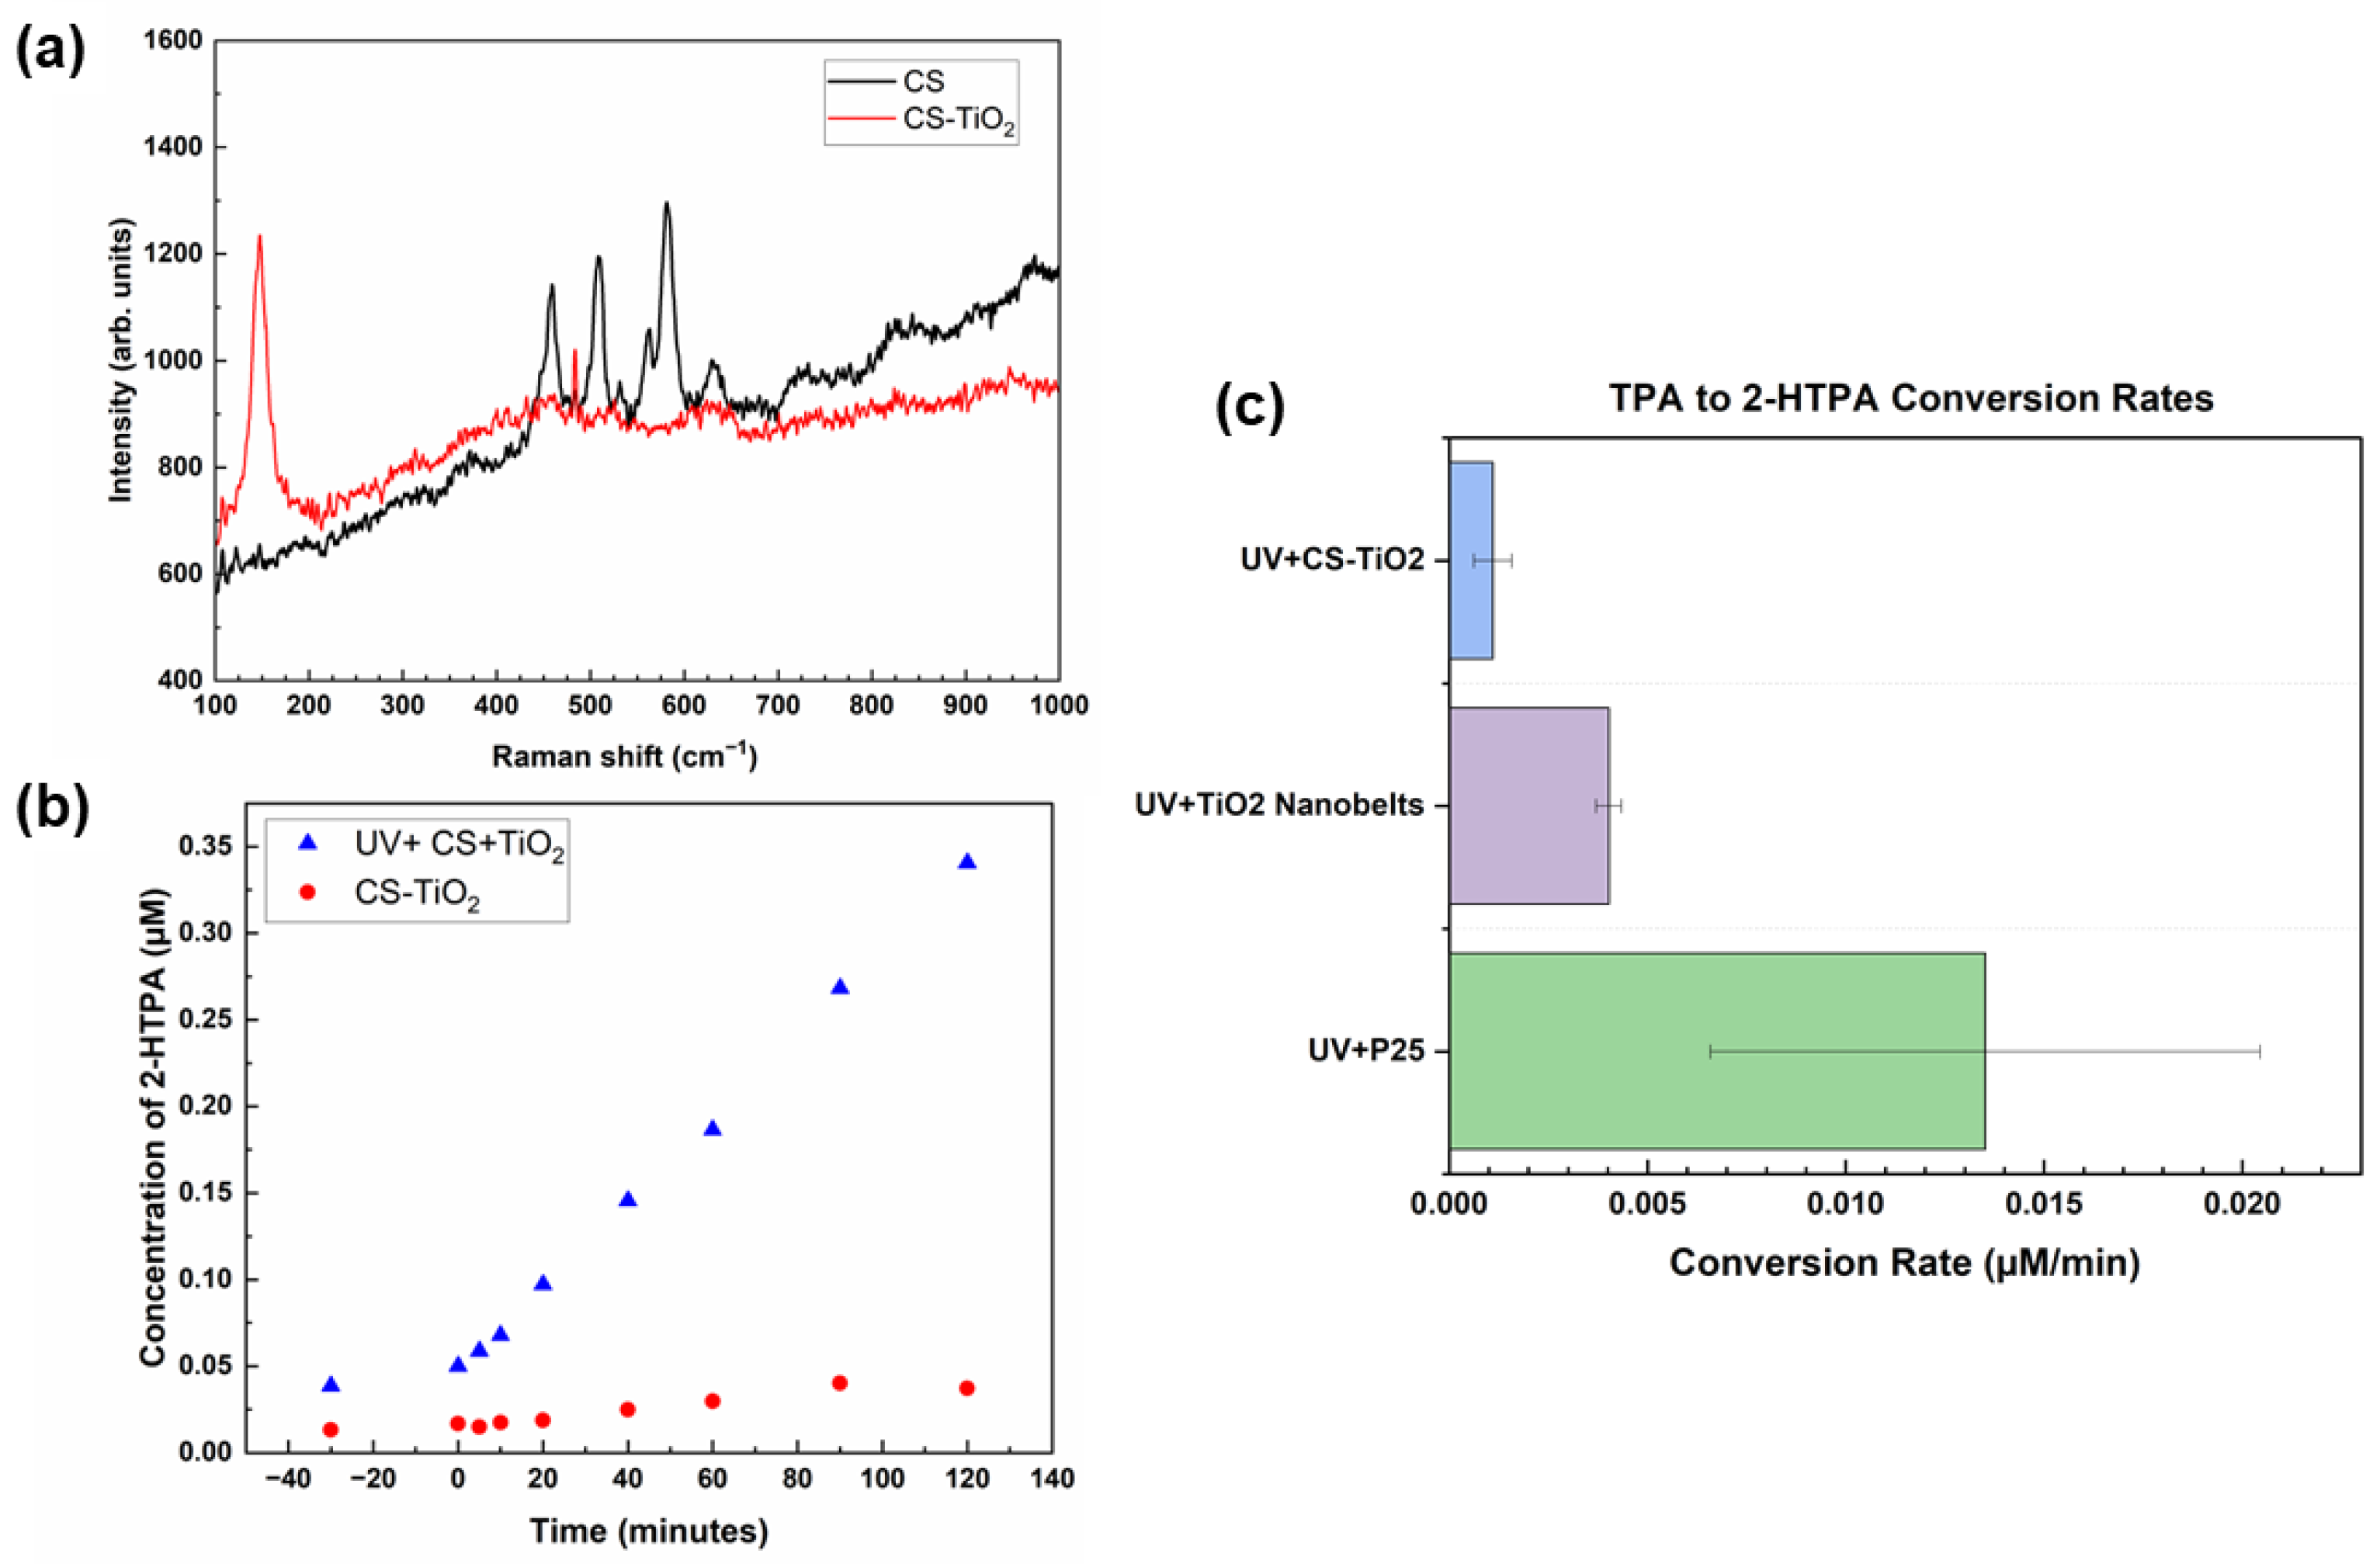
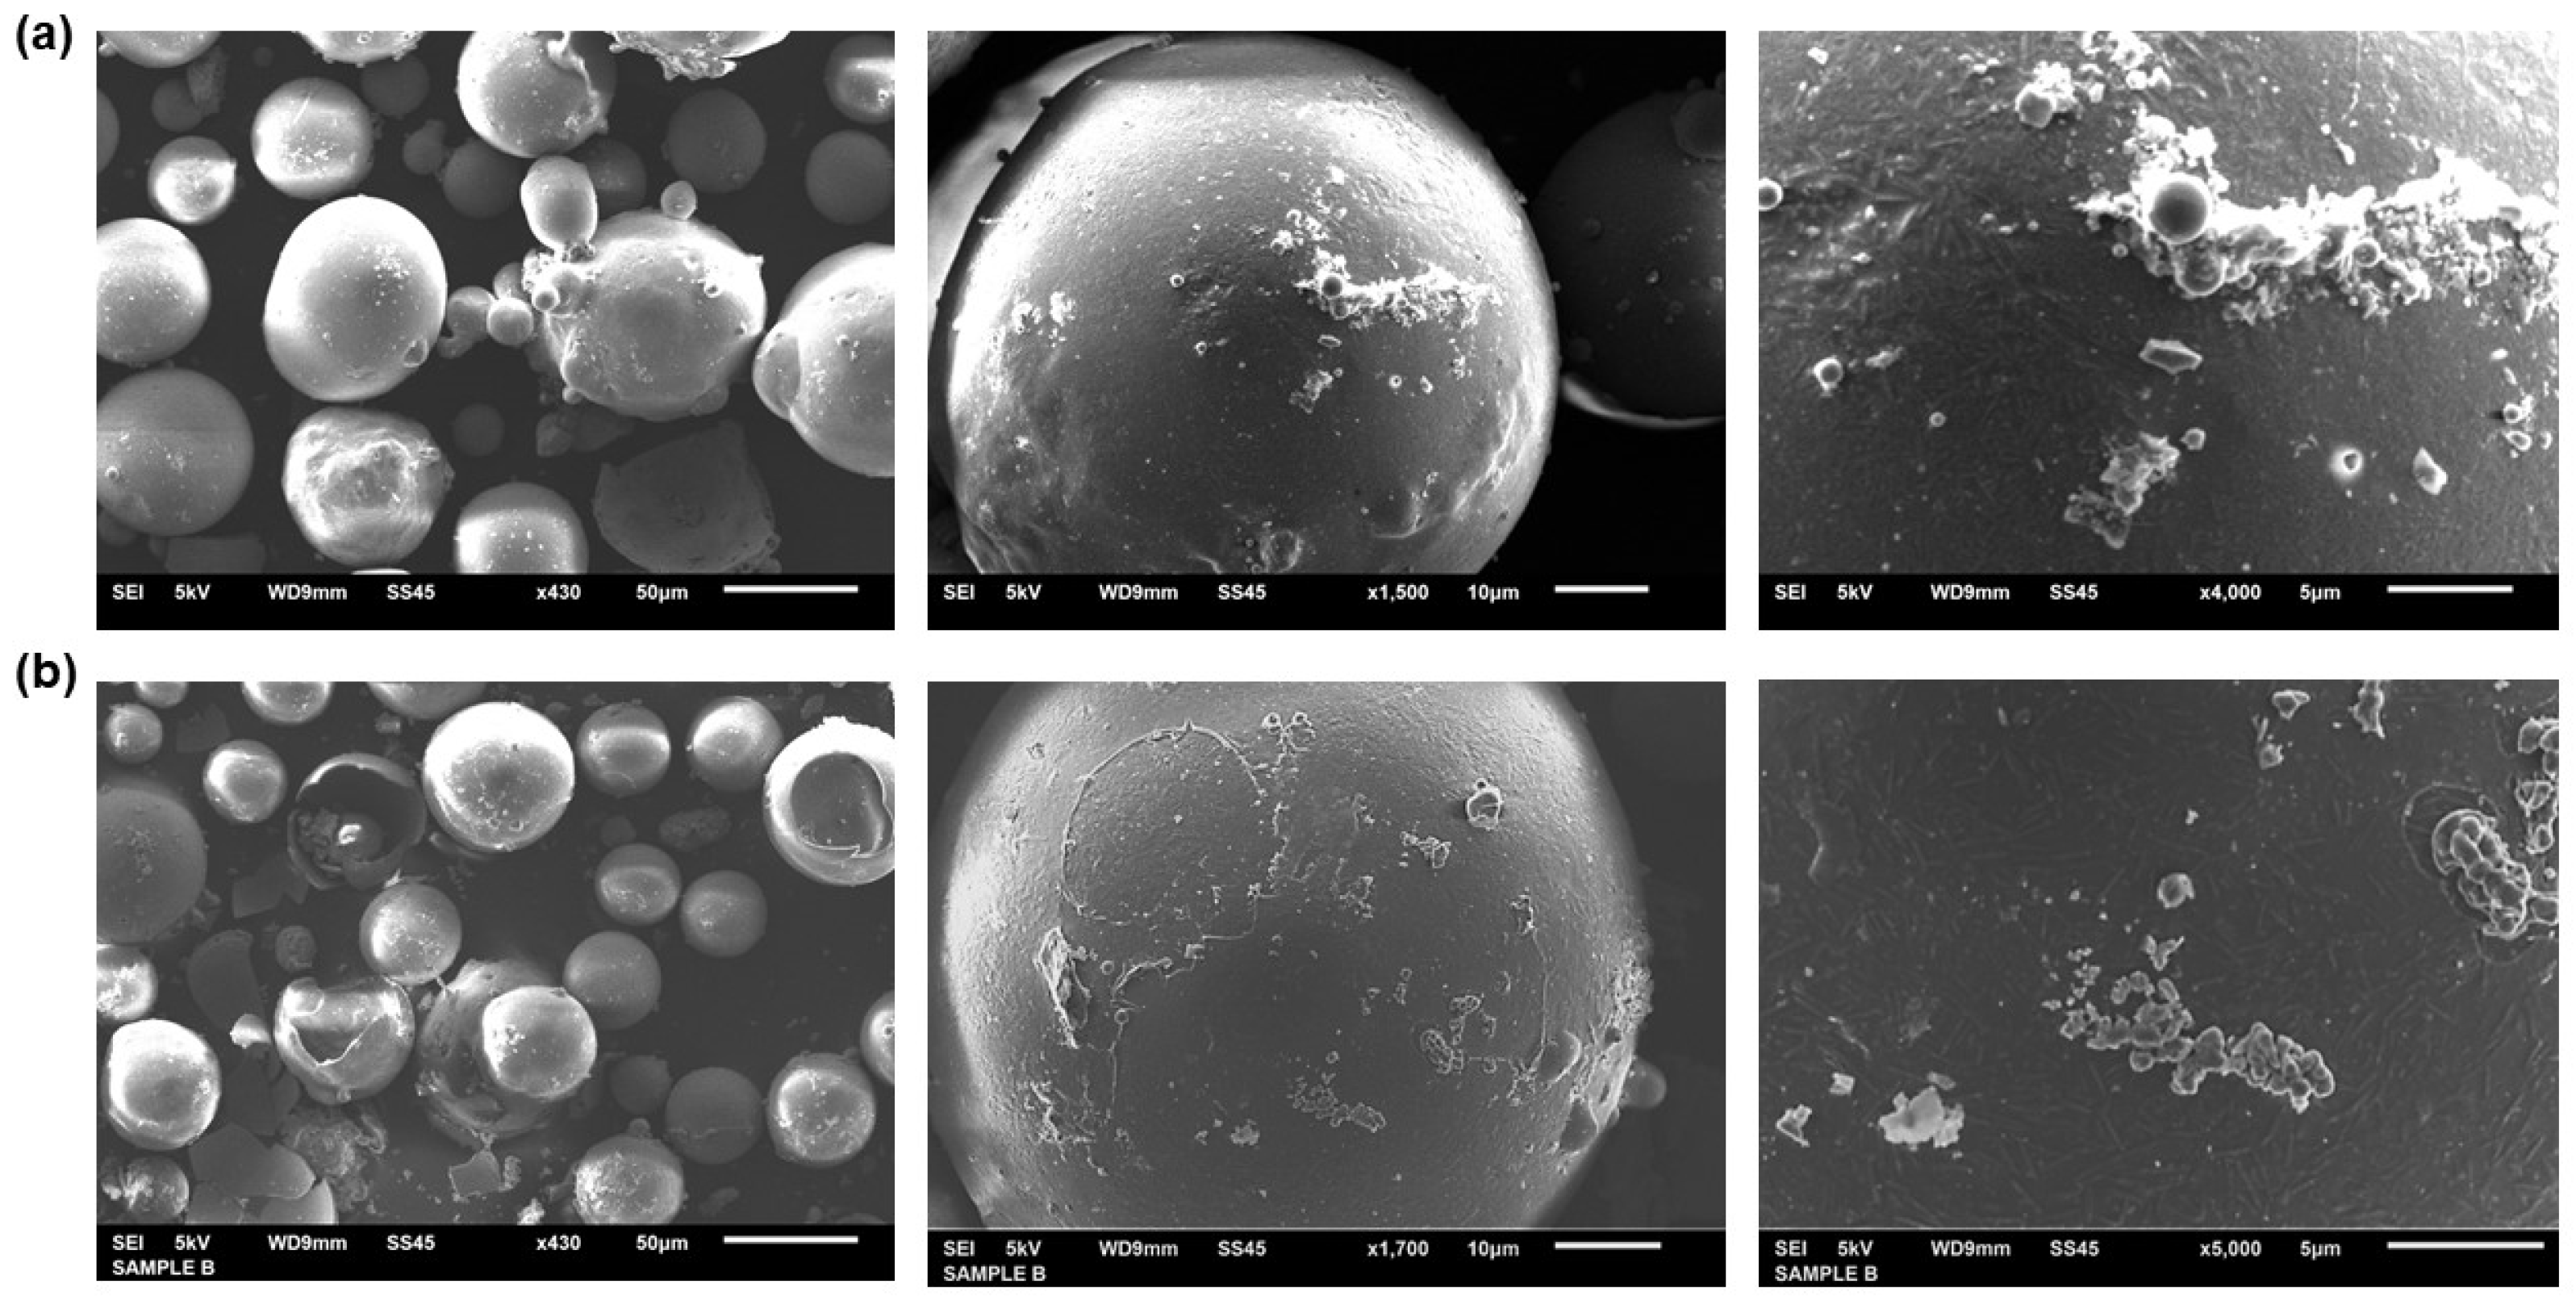
3.1. Materials Characterization

The characterization of the newly formed TiO2 cenospheres (CS-TiO2) was performed using Raman spectroscopy and the aforementioned HTPA conversion. The results of the analysis of the material are shown in Figure 3. From Figure 3a, the Raman reveals the removal of the distinct peak of TiO2 anatase at 144 cm−1 [11] that is not found in rutile TiO2 when compared to the as-purchased cenospheres (CS). The additional peaks observed in the CS-TiO2 are also indicative of the TiO2 treatment being effective on the surface of the spheres. In order to provide evidence of the quality of the synthesized TiO2 cenospheres, we performed TPA to 2-HTPA conversion. The results are shown in Figure 3b, where we compare the 2-HTPA conversion over time of the CS-TiO2 sample (red circles) and the complete setup with the UV lamp treated TiO2 cenospheres (UV + CS-TiO2) shown as the blue triangles. The concentration of 2-HTPA grows exponentially faster for the UV + CS-TiO2 than with the CS-TiO2 alone, showcasing the positive impact of the UV lamp. We then compared the conversion rates of our cenospheres with previous nanobelts [11] and those of conventional P25 TiO2. What we observe is shown in Figure 3c, wherein the cenospheres have a reduced conversion rate than their other two standards, likely due to their micron size and their buoyancy in aqueous solutions, causing them to float. These characteristics of the cenospheres make them easier to separate and recover from aquatic systems and are key sustainability features. The use of cenospheres here is also beneficial due to the large size, as nano-scale separation and toxicity concerns to the environment are not an issue.
SEM images, along with energy dispersive X-ray spectroscopy (EDS), were conducted on the powdered samples, both coated and uncoated. Coated samples showed 5.5 wt% Ti, whereas the uncoated 0.6 wt%. Cenospheres retain their structure during the coating process, as shown in Figure 4, with a similar size dispersion. The SEM and EDS measurements confirm the surface morphology after treatment and corroborate the findings that the TiO2 is coating the surface of the spheres. EDS spectra are shown in the supplemental information for both coated (Figure S4) and uncoated (Figure S5).

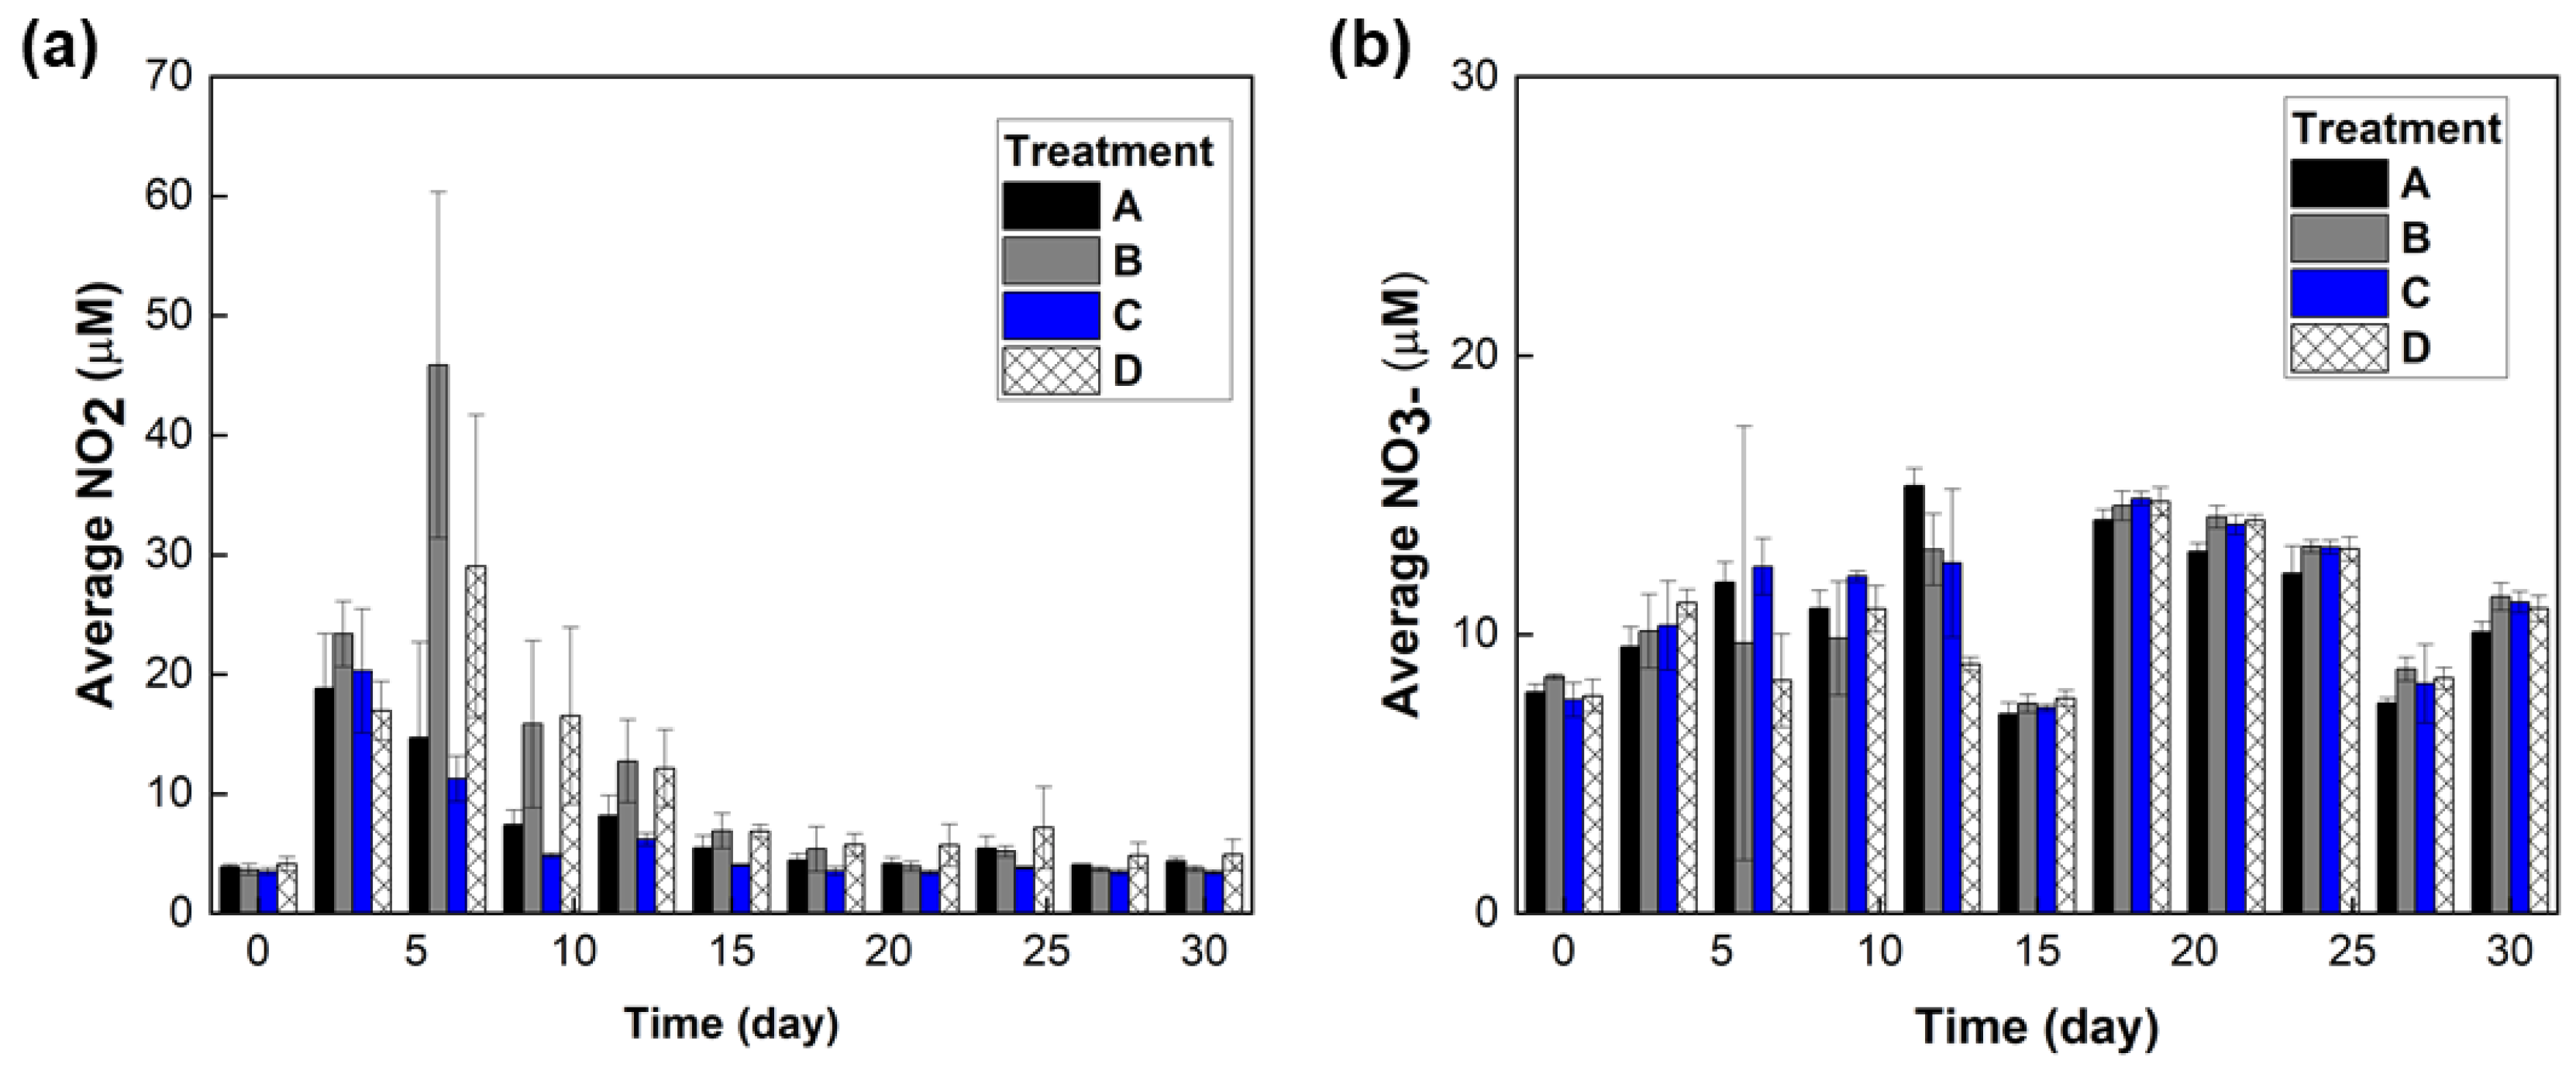
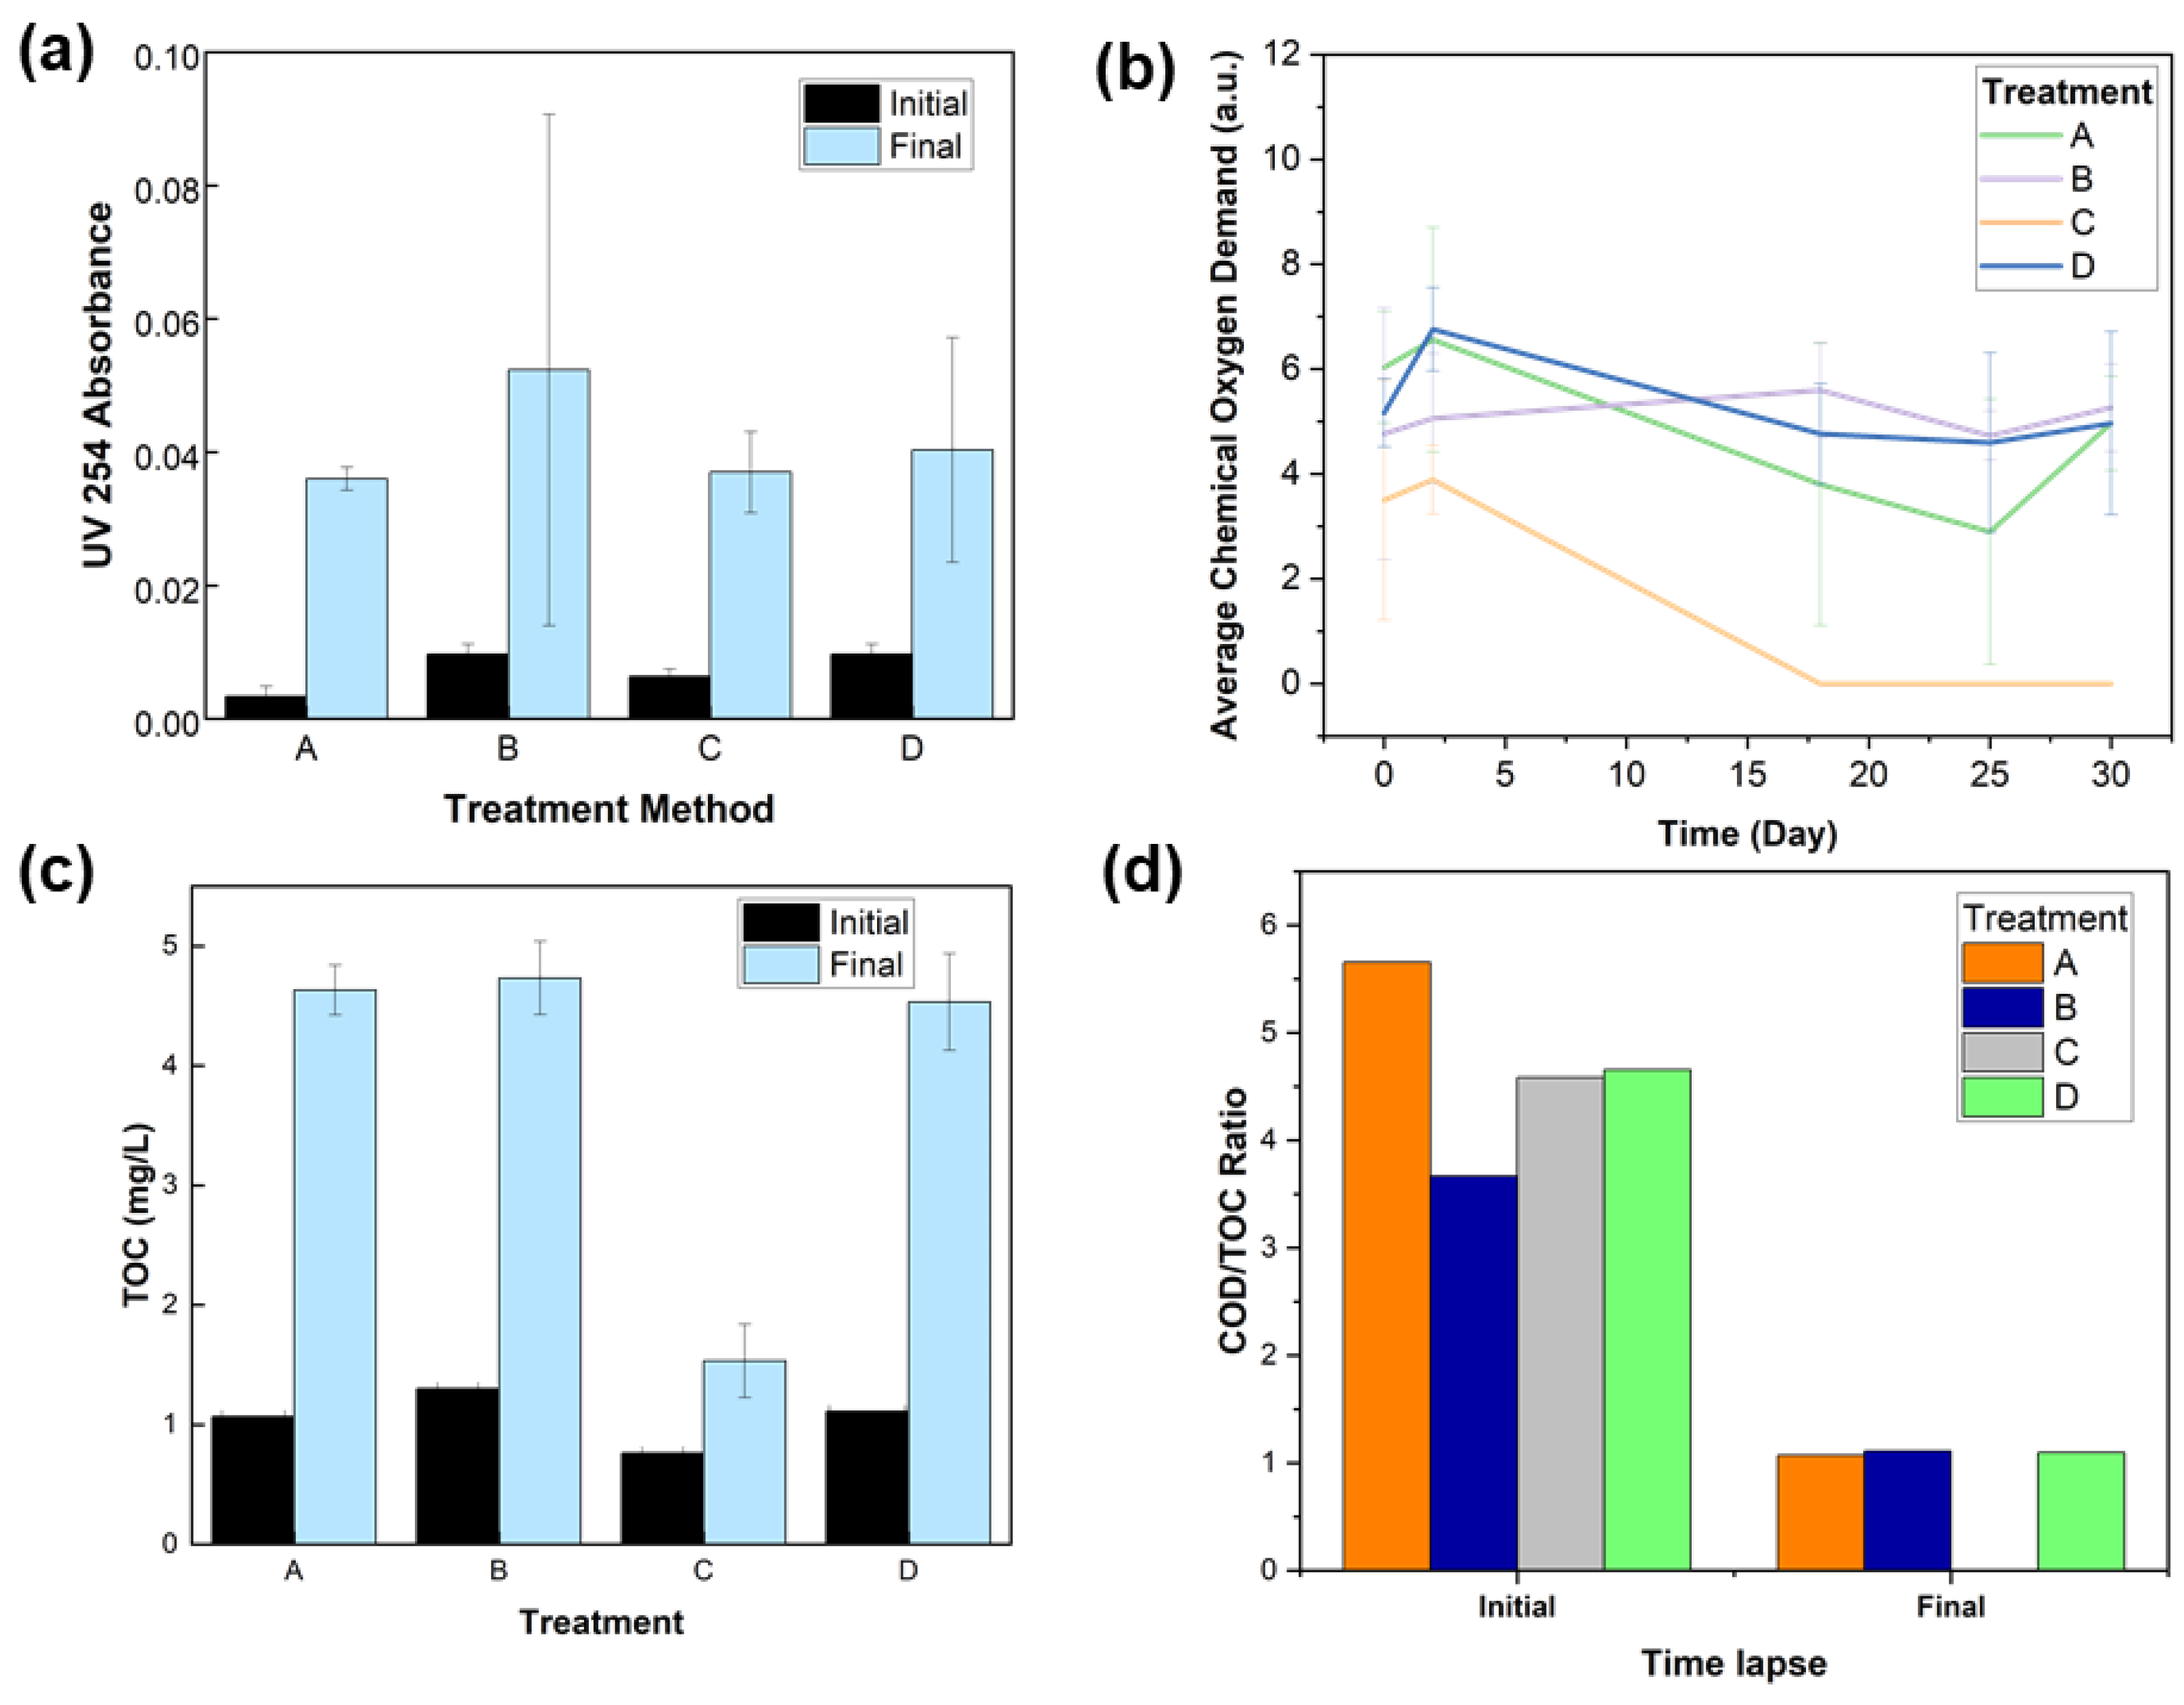
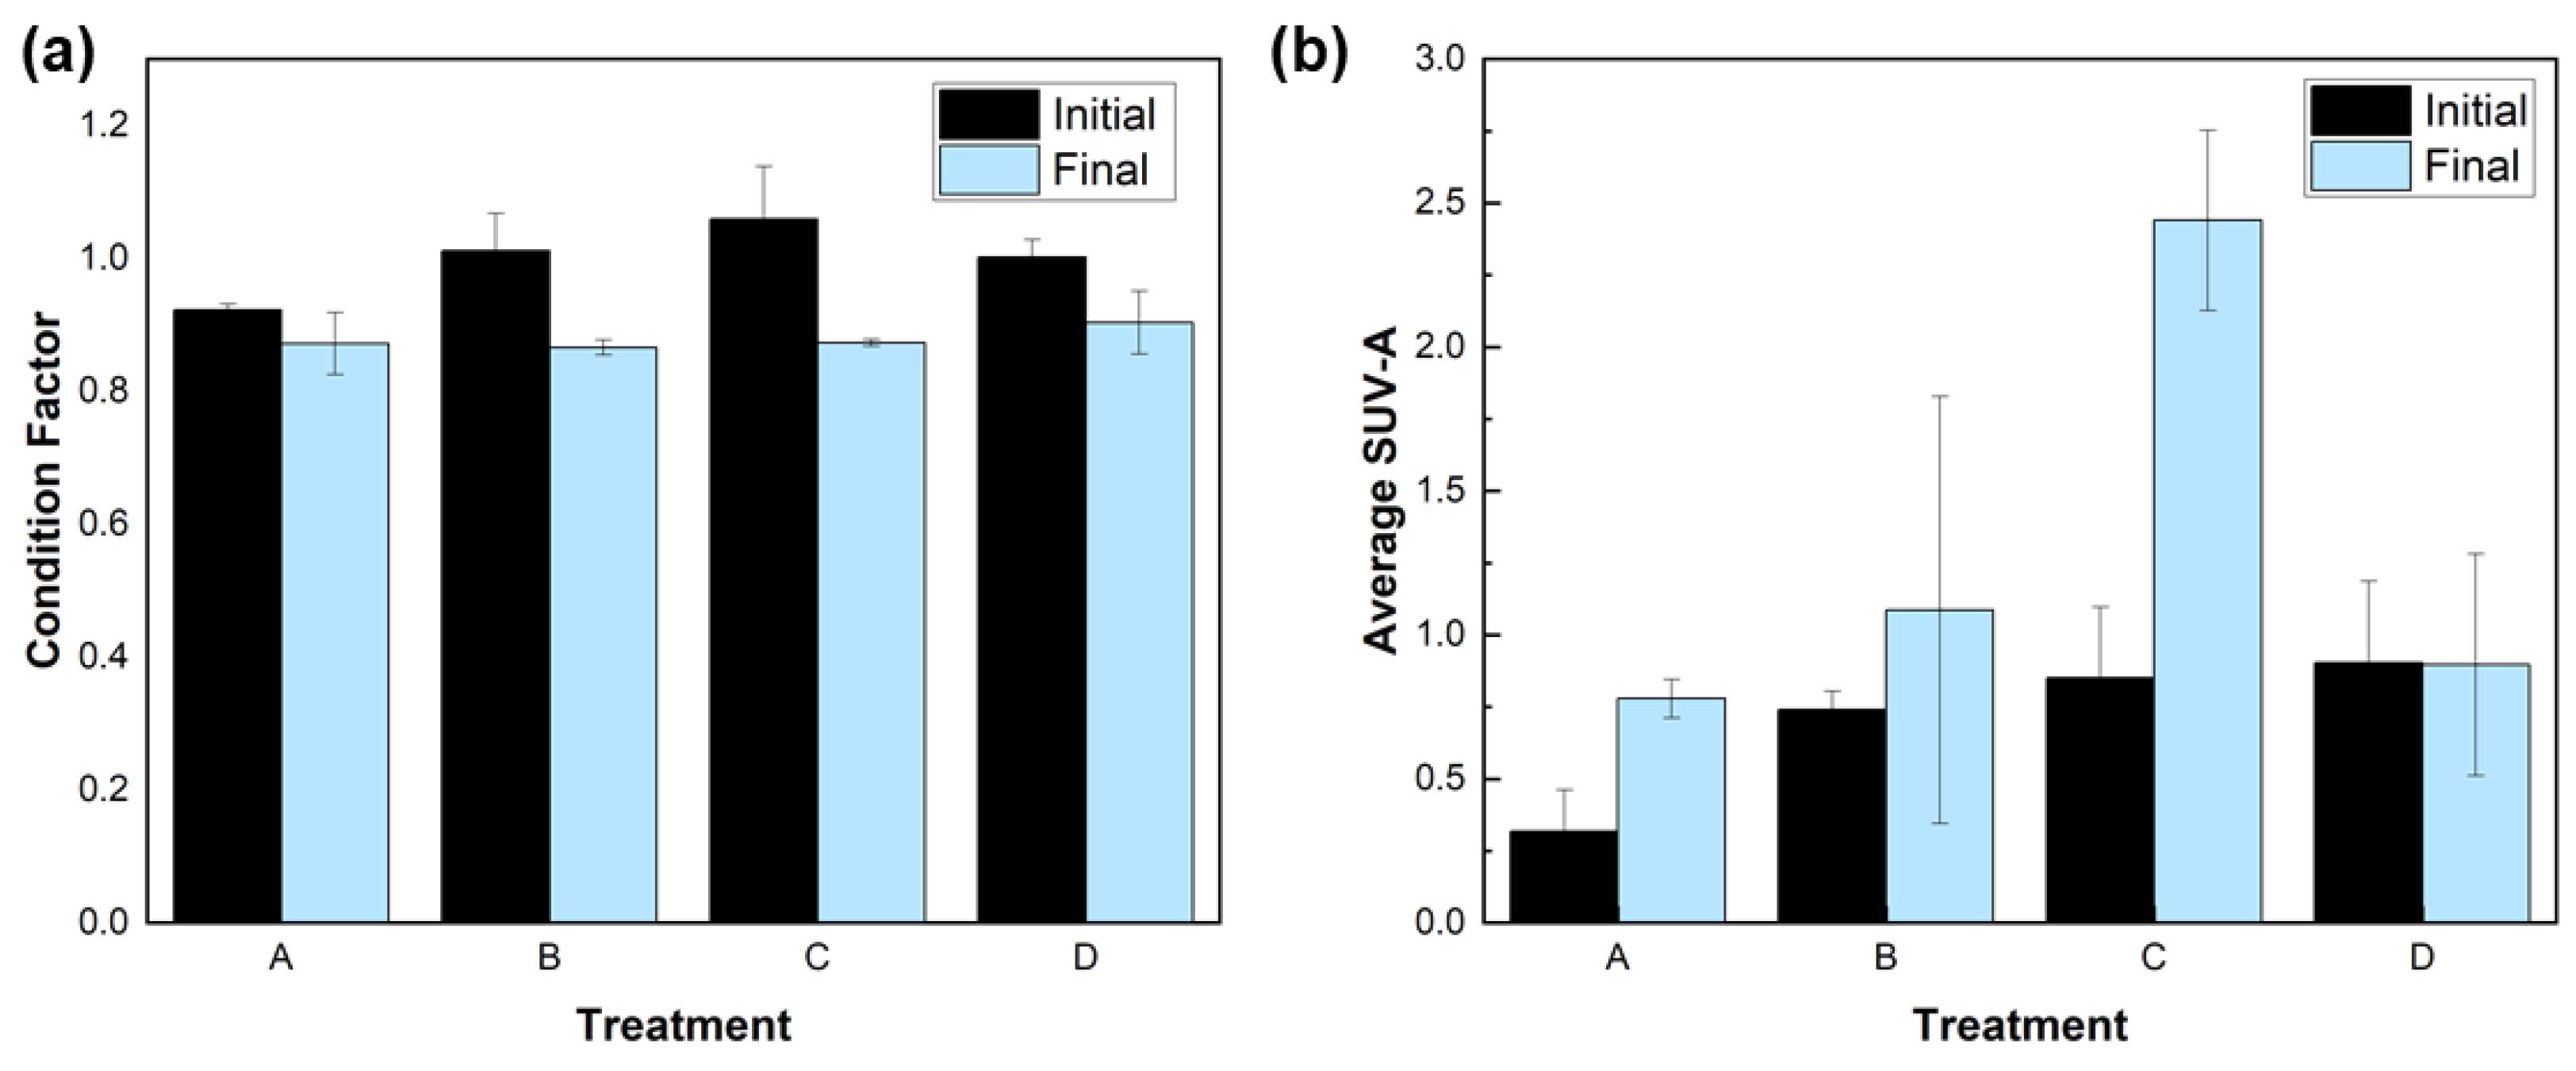
3.2. Minnow Treatment

The water samples were collected every three days over the course of 30 days. All the tanks had concentrations close to each other, except for when there was an ammonium spike on the third day. The average concentration of the nitrite in the tanks is shown in Figure 5a. This is the concentration of nitrite in all the tanks, and all the changes in concentration are comparatively low, although there is a spike in the concentration for treatment method B at the 6-day mark that is observed, with almost a 2-fold increase in nitrite compared to day 3. All the treatment methods show an initial increase in nitrite over the first few collection periods but seem to decrease and plateau by the 15-day mark. Treatment method C shows a high spike for day 3 but then subsequently decreases to the starting levels by day 15. Treatment A follows a similar trend as C, whereas treatment D follows a similar pattern as B in a less significant amount. The increase in water-born nitrites can lead to a toxic environment for the fish, resulting in death if not treated efficiently by increasing chloride ion concentration [15]. Additionally, Figure 5b depicts the average concentration of the nitrate for all the tanks for the 30-day experimental period. These concentration changes for the nitrate, however, are much lower than what was observed for nitrite and stayed well below 20 µM, and all the A–D treatments had similar values. For the nitrite, treatments B and D fluctuated the most, whereas A and C stayed consistent within error after the initial day-five spike.
To determine the absorption of aromatic compounds, present in these systems, ultra-violet analysis was conducted. The absorbance at 254 nm was also determined for each sample at the start of the experiment (initial) and at the end of the research trial (final). The findings are depicted in the bar graph in Figure 6 for the evaluation of chlorinated organic substances and the start and end of the experiment [16,17]. The chemical oxygen demand (COD) was also analyzed at both the start and end points of the experiment for each treatment method, and the results are shown in Figure 6b. We used peCOD as per the method described by Stoddart and Gagnon [18]. The total organic carbon (TOC) is also shown in Figure 6c. Additionally, we calculated the COD:TOC ratio for each treatment on the initial and final days of the assessment, as shown in Figure 6d. The COD/TOC ratio for all compounds ranges between 0 and 5.33 (methane—one of the highest values) [19] and is a direct measure of the average oxidation state of the carbon in a specific compound or waste sample [20]. The higher the COD/TOC ratio, the more impact the compound or waste sample will have on the surface water oxygen concentration [21].
From the data, the initial UV absorbance of all the samples at the start of the trial was low, well below 0.02 a.u., but increased 2- to 3-fold by the final stages of the experiment. Treatment methods A and D increased in absorbance by nearly double their initial values and were in approximately the same range as the control (C). However, treatment method B, which had the biofilter and the UV TiO2 cenospheres filter, showed an even greater increase in UV absorptivity in the 254 nm range. This observation also indicates that the presence of the mechanical filter is impactful to UV absorbance.
The COD of treatments A, B, and D fluctuated during the experiments but ended up with a similar average value as the beginning, whereas, in treatment C, the value dropped completely to zero—indicating an abrupt removal of contaminants. This observation could be due to an increase in bacteria that degrade the organic compounds more readily [22,23]. On the other hand, the TOC values for all the tests showed an increase from the initial days. In treatment C, the TOC value doubled, whereas treatments A, B, and D increased by four-fold. The COD values were always higher than the TOC values.
We also tabulated the condition factor (CF) for the initial and final days of each treatment to determine the state of the fish and is shown in Figure 7a. The values were calculated as per previous work using Equation (3) [24]:
CF = W/Lb × 100
where W = weight (g), L = fork length (in mm). The exponent b is derived from the length–mass relationship at each site, which is described by W = a Lb.
The values stayed about the same during the entire experimental process, and the data did not reach above one within error. This is indicative that the health of the fish was stable [25,26]. The average quality of the dissolved organic matter was also calculated using specific ultraviolet absorbance (SUV A), represented in Figure 7b. The highest change was observed for the treatment of the control tank (C), which doubled in value. Treatment A, which had the UV TiO2 cenospheres filter, also doubled from the initial measurement, but its absorbance was less than 0.5 initially (had the lowest of values).
It is interesting to denote that even though tank B only had the cenospheres and biofilter, whereas A and D had the additional mechanical filter, the performance of B had equivalent values in terms of TOC, COD, TOC: COD, and UV absorbance as well as conditional factors. Therefore, the results here depict that a biofilter in combination with TiO2 cenospheres can perform just as well as conditions with an added mechanical filter.
The further lifetime of the cenospheres beyond the study (past 30 days) was not studied; however, the work parallels that of Gu et al. recently published [27] regarding oil sands, whereas our focus was nitrogen compounds. Here, our cenospheres act akin to an alternative biological filter. We choose to use small floating species that mix well in aqueous solutions and are more likely to receive light. The cenospheres are comparable to that of a ceramic filter, wherein our solution is cheaper than conventional ceramic filters. The bacterial growth is what leads to compound breakdown and causes oxidation reactions to occur. Cenospheres are a sustainable alternative to ceramics and carbon filters as they are a by-product of the oil refining process. Though the initial cost of this method may seem high to implement in larger scale cases, cenospheres are a circular economy alternative to other filters, as shown in this work.

4. Conclusions

In summary, according to the water chemistry, TiO2-coated cenospheres were more effective at filtering impurities. After comparing and analyzing other factors, such as the chemical oxygen demand, turbidity, and optical density of all the tanks, we observed that titanium-dioxide-coated cenospheres worked well for water filtration. However, further studies are needed to observe the effectiveness of TiO2 at larger scales. Hence, future research would expose more fish in the aquariums. The design could be changed to move the catalyst further, as well as use a higher amount of catalyst. The TiO2 cenosphere filter worked by removing 55% of the nitrite without having a mechanical filter modification. An adaptation to the filter could be to increase the movement of the TiO2 catalyst in the filter to increase contact with water. This would allow the catalyst to react better with the contaminants in water. Increasing the amount of catalyst could also prove useful as an improvement to our method presented herein.

Supplementary Materials

The following supporting information can be downloaded at https://www.mdpi.com/article/10.3390/environments10110188/s1, Step-by-Step Procedure for Ammonia Assay. Figure S1: Photographs of the fathead minnows in their tanks. Figure S2: Schematic of cenospheres and bubbler in tank. Figure S3: setup of filters broken down in components. Figure S4: SEM and EDS of coated cenospheres. Figure S5: SEM and EDS of uncoated cenospheres.

Author Contributions

Conceptualization, M.R.S. (Monika R. Snowdon) and R.F.L.L.; methodology, M.R.S. (Monika R. Snowdon) and R.F.L.L.; software, L.M.B., M.R.S. (Monika R. Snowdon) and R.F.L.L.; validation, A.K., E.A.B., S.R., W.F., H.A.D., M.R.S. (Monika R. Snowdon) and R.F.L.L.; formal analysis, M.R.S. (Monika R. Snowdon) and R.F.L.L.; investigation, A.K., E.A.B., S.R., W.F., H.A.D. and L.M.B. resources, A.K., E.A.B., S.R., W.F. and H.A.D.; data curation, A.K., E.A.B., S.R., W.F. and H.A.D.; writing—original draft preparation, A.K., M.R.S. (Monika R. Snowdon) and R.F.L.L.; writing—review and editing, M.R.S. (Monika R. Snowdon) and R.F.L.L.; visualization, M.R.S. (Monika R. Snowdon) and R.F.L.L.; supervision, N.Y.Z., M.R.S. (Mark R. Servos) and M.F.-G.; project administration, M.R.S. (Monika R. Snowdon) and R.F.L.L.; funding acquisition, M.R.S. (Monika R. Snowdon) and R.F.L.L. All authors have read and agreed to the published version of the manuscript.

Funding

This work was funded through the Natural Sciences and Engineering Research Council (NSERC) of Canada—Strategic Project Grant (STPGP 430654-12). We would also like to acknowledge the help and assistance provided by the Schwartz–Resiman Foundation under the Waterloo Technion Research Co-operation Program.

Data Availability Statement

The datasets generated during and/or analyzed during the current study are available from the corresponding author on reasonable request.

Acknowledgments

The authors would like to thank the full-time staff and members of the Servos lab, in particular Leslie M. Bragg, and the Centre of Advanced Materials joining for their insight and assistance on the project. The scanning electron microscopy was performed at the Canadian Centre for Electron Microscopy (also supported by NSERC and other government agencies) by Evita Yobana.

Conflicts of Interest

The authors declare no conflict of interest.

References

  1. Dunn, P.J. The importance of Green Chemistry in Process Research and Development. Chem. Soc. Rev. 2012, 41, 1452–1461. [Google Scholar] [CrossRef]
  2. Ranjbar, N.; Kuenzel, C. Cenospheres: A review. Fuel 2017, 207, 1–12. [Google Scholar] [CrossRef]
  3. Żyrkowski, M.; Neto, R.C.; Santos, L.F.; Witkowski, K. Characterization of fly-ash cenospheres from coal-fired power plant unit. Fuel 2016, 174, 49–53. [Google Scholar] [CrossRef]
  4. Bora, P.J.; Porwal, M.; Vinoy, K.J.; Kishore; Ramamurthy, P.C.; Madras, G. Industrial waste fly ash cenosphere composites based broad band microwave absorber. Compos. Part B Eng. 2018, 134, 151–163. [Google Scholar] [CrossRef]
  5. McBride, S.; Shukla, A.; Bose, A. Processing and characterization of a lightweight concrete using cenospheres. J. Mater. Sci. 2002, 37, 4217–4225. [Google Scholar] [CrossRef]
  6. Buragohain, P.; Garg, A.; Lin, P.; Hong, M.; Yi, Z.; Sreedeep, S. Exploring Potential of Fly Ash–Bentonite Mix as a Liner Material in Waste Containment Systems Under Concept of Sponge City. Adv. Civ. Eng. Mater. 2018, 7, 46–70. [Google Scholar] [CrossRef]
  7. Blissett, R.S.; Rowson, N.A. A review of the multi-component utilisation of coal fly ash. Fuel 2012, 97, 1–23. [Google Scholar] [CrossRef]
  8. Losordo, T.; Masser, M.; Rakocy, J. Recirculating aquaculture tank production systems an overview of critical considerations. SRAC 1998, 451, 1–5. [Google Scholar]
  9. Annan, E.; Mustapha, K.; Odusanya, O.; Malatesta, K.; Soboyejo, W. Statistics of Flow and the Scaling of Ceramic Water Filters. J. Environ. Eng. 2014, 140, 04014039. [Google Scholar] [CrossRef]
  10. Surolia, P.K.; Tayade, R.J.; Jasra, R.V. TiO2-Coated Cenospheres as Catalysts for Photocatalytic Degradation of Methylene Blue, p-Nitroaniline, n-Decane, and n-Tridecane under Solar Irradiation. Ind. Eng. Chem. Res. 2010, 49, 8908–8919. [Google Scholar] [CrossRef]
  11. Liang, R.; Li Chun Fong, L.C.M.; Arlos, M.J.; Van Leeuwen, J.; Shahnam, E.; Peng, P.; Servos, M.R.; Zhou, Y.N. Photocatalytic degradation using one-dimensional TiO2 and Ag-TiO2 nanobelts under UV-LED controlled periodic illumination. J. Environ. Chem. Eng. 2017, 5, 4365–4373. [Google Scholar] [CrossRef]
  12. Arlos, M.J.; Liang, R.; Hatat-Fraile, M.M.; Bragg, L.M.; Zhou, N.Y.; Servos, M.R.; Andrews, S.A. Photocatalytic decomposition of selected estrogens and their estrogenic activity by UV-LED irradiated TiO2 immobilized on porous titanium sheets via thermal-chemical oxidation. J. Hazard. Mater. 2016, 318, 541–550. [Google Scholar] [CrossRef]
  13. Snowdon, M.; Liang, R.; Van Leeuwen, J.C.; Schneider, O.; Khan, A.; Li Chun Fong, L.C.M.; Zhou, N.Y.; Servos, M.R. Pharmaceutical Micropollutant Treatment with UV–LED/TiO2 Photocatalysis under Various Lighting and Matrix Conditions. Photochem 2022, 2, 503–514. [Google Scholar] [CrossRef]
  14. Solorzano, L. Determination of Ammonia in Natural Waters by the Phenolhypochlorite Method. Limnol. Oceanogr. 1969, 14, 799–801. [Google Scholar]
  15. SvobodovÁ, Z.; Máchová, J.; Poleszczuk, G.; Hůda, J. Nitrite Poisoning of Fish in Aquaculture Facilities with Water-recirculating Systems. Acta Vet. Brno 2005, 74, 129–137. [Google Scholar] [CrossRef]
  16. Sérodes, J.-B.; Rodriguez, M.J.; Li, H.; Bouchard, C. Occurrence of THMs and HAAs in experimental chlorinated waters of the Quebec City area (Canada). Chemosphere 2003, 51, 253–263. [Google Scholar] [CrossRef] [PubMed]
  17. Korshin, G.V.; Wu, W.W.; Benjamin, M.M.; Hemingway, O. Correlations between differential absorbance and the formation of individual DBPs. Water Res. 2002, 36, 3273–3282. [Google Scholar] [CrossRef]
  18. Stoddart, A.K.; Gagnon, G.A. Application of photoelectrochemical chemical oxygen demand to drinking water. J. Am. Water Work. Assoc. 2014, 106, E383–E390. [Google Scholar] [CrossRef]
  19. Ford, D.L.; Eller, J.M.; Gloyna, E.F. Analytical Parameters of Petrochemical and Refinery Wastewaters. J. Water Pollut. Control Fed. 1971, 43, 1712–1723. [Google Scholar]
  20. Yousefian, S. Identification of Types of Compounds Responsible for COD, TOC, and Colour in Bleached Kraft Pulp Mill Effluents; University of Toronto: Toronto, ON, Canada, 2000. [Google Scholar]
  21. Lundberg, J. Impact of Increased Production on TOC to the Waste Water Treatment Plant: Piteå 750. Master’s Thesis, Luleå University of Technology, Luleå, Sweden, 2017. [Google Scholar]
  22. Kawasaki, N.; Komatsu, K.; Kohzu, A.; Tomioka, N.; Shinohara, R.; Satou, T.; Watanabe, F.N.; Tada, Y.; Hamasaki, K.; Kushairi, M.R.M.; et al. Bacterial contribution to dissolved organic matter in eutrophic Lake Kasumigaura, Japan. Appl. Environ. Microbiol. 2013, 79, 7160–7168. [Google Scholar] [CrossRef]
  23. Katagi, T. Aerobic microbial transformation of pesticides in surface water. J. Pestic. Sci. 2013, 38, 10–26. [Google Scholar] [CrossRef]
  24. Bervoets, L.; Blust, R. Metal concentrations in water, sediment and gudgeon (Gobio gobio) from a pollution gradient: Relationship with fish condition factor. Environ. Pollut. 2003, 126, 9–19. [Google Scholar] [CrossRef] [PubMed]
  25. Bagenal, T. Methods for assessment of fish production in fresh waters. J. Anim. Ecol. 1979, 48, 329–331. [Google Scholar]
  26. Bolger, T.; Connolly, P.L. The selection of suitable indices for the measurement and analysis of fish condition. J. Fish Biol. 1989, 34, 171–182. [Google Scholar] [CrossRef]
  27. Chidiac, C.; Leshuk, T.M.C.; Gu, F. Mild Photocatalysis Removes Microbial Inhibition and Enables Effective Biological Treatment of Naphthenic Acids. Chem. Eng. Ind. Chem. 2023. [Google Scholar] [CrossRef]
Figure 1. The labeled filters are schematically represented in the large tanks. The filters in tanks A1, A2 and A3 had a UV TiO2 filter, a biofilter and a mechanical filter. The filters in tanks B1, B2 and B3 had a UV TiO2 filter and a mechanical one. Tanks C1, C2 and C3 were controls containing biological, mechanical, and chemical filters. The filters in tanks D1, D2 and D3 had a dark TiO2 filter, a biofilter and a mechanical filter.
Environments 10 00188 g001
Figure 2. (a) comparison of the setup between a conventional 3-part system consisting of biological filter, activated carbon and mechanical filter versus the 2-part TiO2-UV system we have created, (b) view of the UV-lamp aquarium lid used during experimentation and how it irradiates into the water tank.
Environments 10 00188 g002
Scheme 1. Formation of the azo-dye through sulfanilamide exposure to nitrite forming the diazonium ion intermediate, subsequently reacting with NED through a coupling reaction for the final dye product.
Environments 10 00188 sch001
Figure 3. (a) Raman spectroscopy of the cenospheres versus the TiO2 cenospheres used in this work. (b) Concentration of 2-HTPA of the TiO2 cenospheres versus UV-treated TiO2 cenospheres. (c) TPA to 2-HTPA conversion rates of the TiO2 cenospheres versus those of TiO2 nanobelts from previous work and those of P25 TiO2. All samples were UV-treated.
Environments 10 00188 g003
Figure 4. SEM from 50 µm to 10 µm to 5 µm on the surface of the (a) uncoated cenosphere and (b) TiO2-coated cenosphere.
Environments 10 00188 g004
Figure 5. (a) The average concentration of nitrite in all tanks over the experimental period for each treatment method, (b) Average concentration of nitrates over the experimental period for each treatment method.
Environments 10 00188 g005
Figure 6. (a) The UV 254 nm absorbance for each treatment method in the fish tanks in the starting (initial) phase of the experiment and at the end (final) phase of the experiment, (b) the average COD for each measurement day for each treatment method over the monthly time frame of the experiment shown at both the initial and final phases, (c) the TOC and the initial and final phases of each treatment, (d) the ratio of COD/TOC for all treatments on the initial and final days.
Environments 10 00188 g006
Figure 7. Histograms for (a) the condition factor (CF), (b) the average SUV-A (units) for all treatment methods at the initial and final days of treatment with mean ± standard deviation.
Environments 10 00188 g007
Disclaimer/Publisher’s Note: The statements, opinions and data contained in all publications are solely those of the individual author(s) and contributor(s) and not of MDPI and/or the editor(s). MDPI and/or the editor(s) disclaim responsibility for any injury to people or property resulting from any ideas, methods, instructions or products referred to in the content.

