
Users’ Perception of the Circular Economy Monitoring Indicators as Proposed by the UNI/TS 11820:2022: Evidence from an Exploratory Survey


Department of Economics, Management and Business Law, University of Bari Aldo Moro, Largo Abbazia Santa Scolastica 53, 70124 Bari, Italy
*
Author to whom correspondence should be addressed.
Environments 2023, 10(4), 65; https://doi.org/10.3390/environments10040065
Submission received: 18 March 2023
/
Revised: 11 April 2023
/
Accepted: 12 April 2023
/
Published: 14 April 2023
Abstract
:The measurement of material, energy, water, and waste flows in organizations represents a key challenge in the enhancement of a circular economy and sustainable development. In November 2022, the experimental technical standard “Measurement of Circularity—Methods and Indicators for Measuring Circular Processes in Organizations” (UNI/TS 11820:2022) was introduced, which provides, for the first time, a set of 71 quantitative, qualitative and semi-quantitative indicators for the assessment of the levels of circularity in organizations at the micro- and meso-level. First, the present exploratory research aimed to illustrate the main characteristics of the novel technical standard. Second, through an online-based questionnaire among 105 managers and employees working in various industrial sectors in Italy, the research aimed to investigate their level of awareness and perception of selected circular economy monitoring indicators. Such an analysis will help to identify the weaknesses and strengths of the current version of the technical standard. The research applied descriptive statistics and regression models to estimate the association between the perception of selected circular economy indictors and awareness of the concepts of “circular economy”, “lifecycle thinking”, “sustainable development” and “corporate social responsibility”. Although a limited number of respondents took part in the research, the research explored, for the first time, the main features related to the experimental UNI/TS 11820:2022, proposed an original analysis of users’ perception and awareness in its application, and suggested possible opportunities towards its enhancement from theoretical and managerial perspectives.
1. Introduction
The measurement of material, energy, water, and waste flows in organizations represents a challenge, due to several key variables, such as the lack of homogeneous quantification methods or the absence of clear and transparent definitions related to natural resources characteristics and waste-valorization pathways [1,2,3]. In recent years, the transition from the linear to the circular business model has boosted the need to acquire comparable data [4] and adopt common and replicable indicators [5,6] to measure the level of circularity of single products or entire systems. However, although several studies have addressed this complex subject [7,8,9], the first technical specification on the measurement of the level of circularity, namely the UNI/TS 11820:2022 on the “Measurement of Circularity—Methods and Indicators for Measuring Circular Processes in Organizations” [10], was published in November 2022 in Italy. Among over 114 definitions of the circular economy [11], the definition proposed by the UNI/TS 11820:2022 states that the circular economy is an “economic system which, through a systemic and holistic approach, aims to keep the flow of resources circulating, conserving, regenerating or increasing their value, and which at the same time contributes to sustainable development”. This means that the measurement of the flows of resources circulating in natural and anthropic systems is essential [12], as well as the measurement of their associated economics and social implications [13,14].
On the issue of measuring the levels of resource consumption and waste generation, several legislative documents and official reports have been developed worldwide. In 2018, the European Commission introduced a monitoring framework for the circular economy [15], with the aim of making the economy more sustainable, contributing to climate goals, preserving the global resources, creating local jobs, and generating competitive advantages. Such a monitoring framework builds on the resource-efficiency scoreboard, which illustrates the progress towards increased the resource efficiency of individual Member States in Europe [16], and on the raw materials scoreboard, which provides updated information on the raw materials policy context [17]. The monitoring framework for the circular economy identified 10 individual indicators divided between four main groups, namely “production and consumption”, “waste management”, “secondary raw materials” and “competitiveness and innovation” [15]. Its aim is to cover the entire products and systems’ lifecycle and capture the main circular economy elements, such as the self-sufficiency of raw materials, the green public procurement and waste generation level, and the recycling rates for municipal or specific wastes. In addition, in 2019 the European Commission suggested some specific and transversal methods for the common and uniform measurement of the levels of waste, highlighting the need to collect data, ensure a uniform monitoring of material flows, and overcome the complex process of measuring circularity [18]. Considering the entire lifecycle of commodities, from primary production to final consumption, the Commission Delegated Decision 1597/2019 proposed five measurement methods, namely direct measurement, the mass balance approach, waste composition analysis, questionnaires and interviews, and food diaries [19].
Data acquisition in processes and organization represents the first step towards the calculation of specific indicators to measure circularity, and the literature has been interested in the in-depth identification of selected indicators [20,21]. Conventional indicators, such as the carbon or the water footprint, which adopt the lifecycle thinking approach, cannot express the complete level of circularity in products or processes, since they have not been developed in light of the circular economy principles [22]. Hence, cross-sectional and combined indicators, either quantitative or qualitative, have been proposed to measure circularity [23]. Moraga et al. [5] classified three monitoring scopes on the basis of the lifecycle thinking approach [24], namely: (i) scope 0, which measures physical properties from the technological cycles without considering the lifecycle thinking approach [25]; (ii) scope 1, which measures physical properties from the technological cycles with either a full or partial lifecycle thinking approach [26]; and (iii) scope 2, which measures the effects from technological cycles regarding environmental, economic, and/or social concerns in cause-and-effect chain modelling [27]. Further, Poponi et al. [6] and Ruggieri et al. [28] developed a comprehensive dashboard to guide the transition towards circularity, classifying 102 indicators into three areas of sustainability (i.e., environment, society, economy) and three different spatial dimensions (i.e., micro, meso, macro). In addition, such studies have identified ten research scopes: air, water, soil, energy, waste, cost, value, productivity, equality, and knowledge and innovation scope, highlighting the interconnection and complementarity of the data required to measure circularity.
In the light of these premises, an in-depth analysis of the experimental technical standard UNI/TS 11820:2022 on the “Measurement of Circularity—Methods and Indicators for Measuring Circular Processes in Organizations” is essential, which can introduce, for the first time, a set of 71 indicators at micro- and meso-level. First, this research illustrated the main characteristics of the novel technical standard, highlighting its historical development and its theoretical roots. Second, in considering the hidden difficulties in collecting data useful for measuring circularity, the study explored the users’ level of perception and awareness of selected indicators through an online-based questionnaire among managers and employees working in various industrial sectors in Italy. The research explored for the first time the main features related to the experimental UNI/TS 11820:2022, proposing an original analysis of users’ perception and awareness towards its application, and suggests possible opportunities towards its enhancement under the theoretical and the managerial perspective. Such an analysis of users’ perception and awareness of selected indicators is essential, since the UNI/TS 11820:2022 represents an “experimental document”, whose purpose is to “acquire suitable experience deriving from its application between organizations belonging to the same sector, in the same reference year, after the testing phase” [29].
2. Theoretical Background
2.1. Aims and Scope of the UNI/TS 11820:2022
The UNI (Ente Italiano di Normazione), recognized by the CEN (European Committee for Standardization) and the ISO (International Standards Organization) at the European and the global level, respectively, is a private, independent, and non-profit organization, which develops new standards in collaboration with a wide audience of stakeholders, and publishes and disseminates technical standards and editorial products [25]. Such technical standards are voluntary and represent the best solution for making a product, conducting a process, and carrying out a profession authoritatively, since the UNI brings together the interested parties—from those who design to the end users—and the leading experts in the sector [29].
In November 2022, the UNI developed and published the UNI/TS 11820:2022 entitled “Measuring circularity—Methods and indicators for measuring circular processes in organizations”, which is defined as follows: “The technical specification defines a set of indicators applied at a meso- and micro-level, suitable for assessing, through a rating system, the level of circularity of an organization or group of organizations. The rating system does not provide for minimum levels of circularity but provides an assessment of the level achieved”. The technical specification, which is considered an experimental document, represents a synthesis of standards previously published and still useful in measuring the environmental sustainability and the circularity of products and systems, such as the UNI EN ISO 14040:2021 on the “Environmental management—Lifecycle assessment—Principles and framework” [30] and the UNI EN ISO 14067:2018 on the “Greenhouse gases—Carbon footprint of products—Requirements and guidelines for quantification” [31]. In addition, the technical standard was developed on the basis of the documents proposed by the ISO/TC 323 on Circular economy, and is in line with the series ISO 59000, with reference to the framework and principles for implementation (ISO/CD 59004), the guidelines on business models and value chains (ISO/CD 59010), as well as the circularity measurement (ISO/CD 59020).
The technical specification UNI/TS 11820:2022 introduces a set of 71 indicators essential to assess, by using an independent 100-based measurement system, the level of circularity of a single organization or groups of organization, also including public administrations, regardless of the sector or the size. Specifically, the standard is addressed to measure circularity at the micro- (e.g., single company, single local authority) and the meso- (e.g., group of companies, regional areas, provinces) level, without considering the macro-level. It encompasses nine different sections, as follows: (i) purpose and scope; (ii) normative requirements; (iii) terms and definitions; (iv) methodological approach; (v) circularity measurement and evaluation criteria; (vi) data acquisition; (vii) circular economy indicators; (viii) data quality; and (ix) calculation of the level of circularity.
2.2. Circular Economy Indicators and Calculation Method
The indicators proposed by the UNI/TS 11820/2022 are addressed to measure the circularity level achieved by organizations at the micro- (e.g., individual companies, local authorities) or the meso- (e.g., group of organizations, industrial areas and districts, regions) level. The measurement encompasses several phases of the value chain, as follows: (i) design; (ii) supplying; (iii) production; (iv) distribution and sale; (v) use and consumption; and (vi) end of life. Further, the indicators can be distinguished between quantitative, qualitative and semi-quantitative indicators.
From a practical perspective, the measurement system does not provide for a minimum circularity threshold value but makes it possible to evaluate the level reached by the organization at the moment of measuring, compared to the maximum level possible [29]. The 71 indicators are distinguished between six different categories, namely: (a) material resources; (b) energy and water resources; (c) waste and emissions; (d) logistics; (e) final product or service; and (f) human resources, assets, policies and sustainability. Further, the indicators are divided between core indicators (Pc), which must be calculated by each organization; specific indicators (Ps), which must be calculated at least for the 50% of their amount; and rewarding indicators (Pr), which are optional, and their assessment provides a higher final score. Lastly, the indicators distinguish between product and service indicators. Table 1 summarizes the different indicators according to their typology.
The level of circularity varies from 0 to 100, and different weights are associated with core, specific and rewarding indicators, as follows: (i) 1 to Pc indicators; (ii) 1 to Ps indicators; and (iii) 0.5 to Pr indicators. In light of qualitative indicators, which allow binary answers, the answer “yes” provides 1 point, whereas the answer “no” provides 0 points. As regards semi-quantitative indicators, a certain weight corresponds to each threshold value (e.g., the energy class of the building where the organization is located: 1 point for energy class A, 0 points for energy class G). Equation (1) illustrates the mathematical model for calculating the level of circularity:
Specifically, as suggested by the UNI/TS 11820:2022, the level of circularity should be assessed within each group of indicators (i.e., indicators of material resources and components, indicators of energy and water resources, indicators or waste and emissions, indicators of logistics, indicators of final product or service, indicators or human resources, assets, policies, and sustainability), since it helps to more precisely evaluate the areas of intervention. As regards the illustration of results, the technical standards specify that the level of circularity is to be graphically represented using radar [32].
3. Materials and Methods
3.1. Research Framework
The research adopted a questionnaire survey to explore users’ perception and awareness of the circular economy monitoring indicators as proposed by the UNI/TS 11820:2022. The present research appears to be the first study of the novel technical specifications on the “Measurement of Circularity—Methods and Indicators for Measuring Circular Processes in Organizations”, exploring the issue from a theoretical and an empirical perspective. First, to gain a better understanding of the circular economy perception among stakeholders (e.g., employees, managers, suppliers), the authors conducted a brief literature review on circular economy questionnaire-based studies on Scopus and Web of Science. In recent years, several authors have successfully applied questionnaire, in all forms (i.e., e-mail, telephone, apps, personal interviews), to investigate users’ attitudes, perceptions, and behavior towards the enhancement of circular economy paradigms in organizations. Liu and Bai [33] conducted a multiple-choice questionnaire to collect data on the awareness and behaviors of firms towards developing a circular economy, highlighting the importance of constructing domains, generating items, and collecting and purifying data, in addition to assessing reliability and validity. Further, Sani et al. [34] underlined the need to integrate documental analyses with questionnaire-based studies, so as to increase knowledge of the circular economy transition and understand interrelations among different interventions areas, namely, technology, legal-regulatory, and financial areas. As a common thread among researchers, it appears essential to investigate perceptions and awareness among different stakeholder groups [35] to promote circular economy. Some researchers have distinguished between researchers, economists, and administrations’ perception, relying on different background and transversal perspectives, and by considering that scientific information from researchers is required to bridge the informative gap between theory and practice [36]. Others have evaluated the potential of the learning-by-doing (i.e., interactivity, non-dogmatism, reciprocity) approach, and problem-based learning to enhance circular economy perception among users [37].
Figure 1 illustrates the research framework, and defines the stepwise approach related to the questionnaire development and the selection of research items.
3.2. Questionnaire Drafting, Sampling Strategy and Data Collection
The questionnaire consisted of three different sections, as follows: (a) sociodemographic characteristics (six questions); (b) level of awareness on the sustainability issues (three questions); and (c) perception of the applicability of circularity monitoring with reference to selected indicators (16 questions related to different items). In the section related to the level of awareness on sustainability issues, the authors explored the level of knowledge on four main concepts related to sustainability (i.e., circular economy, lifecycle thinking, sustainable development, corporate social responsibility) and on 12 definitions (i.e., virgin raw materials, renewable raw materials, critical raw materials, secondary self-produced raw materials, nonrenewable resources, renewable resources, waste, by-products, recycling, upcycling, reverse logistics, and industrial symbiosis). Specifically, the research explored selected indicators among users, with specific reference to the variables required in the core indicators and in some specific indicators. “Users” defined all employees (i.e., directors, managers, workers in back-office, front-office or laboratories) involved in the quality management process. Table 2 illustrates the main items, with reference to which users were required to describe their level of perception according to a 5-point Likert scale. The 5-point Likert scale (from “not at all” to “very much”) provides a suitable variety of options, which could increase the probability of meeting the objective reality of people, offering more independence to respondents, and allowing them to pick the exact option rather the closest one [34]. Questions were developed to answer five hypotheses (Section 3.3.), and the choice of collecting quantitative answers rather than qualitative ones is essential in the evaluation of regression models and the statistical relationship between variables.
Table 2 illustrates the sociodemographic items and the questions related to the analysis of the level of awareness on sustainability issues.
Before the third section of the questionnaire, respondents were provided with the subsequent (short) description of the UNI/TS 11820: “The technical specification defines a set of indicators useful for determining, through an evaluation system (rating), the level of circularity present in a single organization or group of organizations. Its purpose is twofold: (a) to allow organizations to make evident all the aspects that contribute to the achievement of this level of circularity; (b) identify opportunities for improvement. The technical specification includes many definitions and provides fundamental indications for the acquisition of the data necessary for measuring the circularity performance of an organization”. Hence, in light of this description, respondents were asked to evaluate the level of “ease” in the measurement of some core and specific items. Table 3 summarizes the selected indicators for the users’ perception and awareness analysis. Out of the 11 selected indicators, nine were quantitative indicators (i.e., 04, 07, 10, 11, 15, 16, 17, 22, 26), whereas two were semiquantitative (i.e., 55, 59).
The questionnaire was written in Italian and implemented in Google Forms, an online platform useful to create questionnaires, receive fast answers, and explore data in multimodal formats [39,40]. It was disseminated online from 31 January to 28 February 2023 on social media (e.g., LinkedIn, Facebook). Respondents were asked to answer with care by paying attention to each item and definition, as well as to share the survey with other colleagues and friends as much as possible. Such a non-probabilistic sampling method, defined as the snowball method, has been successfully applied in the literature and is guaranteed to reach as many respondents as possible requiring the minimal planning and human resources [41,42]. Although such a method does not assure representation and is vulnerable to sampling biases (e.g., self-selection of the sample, internal and external validity limitations), it still helps to identify suitable insights and research pathways. As the research study was considered to be exploratory, the authors considered that a number of participants up to 150 was suitable [43].
3.3. Hypotheses Development and Data Analysis
Considering the research as an exploratory analysis, data were examined according to descriptive statistics by using the Analysis ToolPack in Excel [44,45]. All variables were analyzed in light of mean, standard deviation, and variance. As regards the explorative regression models, the R2 and the F coefficient were calculated using the Analysis ToolPack in Excel [46]. The regression estimation models were based upon the subsequent hypotheses, which are linked to the “Level of awareness on the sustainability issues” (i.e., How much are you familiar with the concept?) on the general concepts of “circular economy”, “lifecycle thinking”, “sustainable development” and “corporate social responsibility”.
The development of the subsequent four hypotheses was inspired by the research conducted by Burger et al. [47] that investigated the types of skills and education required by employees in the field of the circular economy, highlighting the idea that it is still unclear which kinds of employees are necessary to accommodate the future growth of the circular economy, and which kind of training they need. Specifically, the research develops the idea of “circular-intensive” occupations, also illustrating that training and work experience should run together to reach the best circular economy education. The first hypothesis links the users’ perception on the circular economy indicators to their awareness of the general concept of “circular economy”, as follows:
Hypothesis 1 (H1).
Is the level of perception on the ease of measuring the selected circular economy indicators linked the level of familiarity of the concept of “circular economy”?
Further, the authors have selected the concept of “lifecycle thinking” as an interesting variable related to the users’ perception on the circular economy indicators. The concept of “lifecycle thinking”, defined as “the way of thinking that includes the economic, environmental, and social consequences of a product or process throughout its life” [48], has been included in the UNI/TS 11820:2022 as a complementary approach to add information and data on the measurement of circularity in organizations. Therefore, considering that such a concept is the basis for supporting environmental legislation and for closing the loop [49] and should represents an opening step in boosting users’ education and training, the subsequent hypothesis was developed:
Hypothesis 2 (H2).
Is the level of perception on the ease of measuring the selected circular economy indicators linked the level of familiarity of the concept of “lifecycle thinking”?
“Sustainable development” is defined as the “development that meets the needs of the present without compromising the ability of future generations to meet their own needs” [50,51]. As regards the link between users’ perception on circular economy indicators and their awareness on the general concept of “sustainable development”, the authors have been inspired by McKeown [52] and her “Education for sustainable development toolkit”. Among other essential definitions and assumptions, it discusses the significant difference between education “about” sustainable development and education “for” sustainable development”, where “for” must be intended as a purpose and not a generic teaching devoid of concreteness. Considering the current knowledge of sustainable development as a possible driver for the enhancement of circular economy monitoring in organizations, the subsequent hypothesis was developed.
Hypothesis 3 (H3).
Is the level of perception on the ease of measuring the selected circular economy indicators linked the level of familiarity of the concept of “sustainable development”?
Last, the authors tried to evaluate possible connections between users’ perception and the concept of “corporate social responsibility”, which is defined as “a business system that enables the production and distribution of wealth for the betterment of its stakeholders through the implementation and integration of ethical systems and sustainable management practices” [53]. On the basis of previous studies in the literature [54], which suggest integrated strategies to reach sustainable development by matching circular economy and corporate social responsibility, the fourth hypothesis was developed:
Hypothesis 4 (H4).
Is the level of perception on the ease of measuring the selected circular economy indicators linked the level of familiarity of the concept of “corporate social responsibility”?
Specifically, the models evaluate how the level of perception on the ease of the selected circular economy indicators can be explained by the level of familiarity of the abovementioned concepts. The subsequent regression model was selected for each hypothesis:
where UPCEIi is the users’ perception on circular economy indicators per each selected indicator, whereas 𝛽0 and 𝛽1 are coefficients estimated per each hypothesis and εi represents a random error for each selected indicator.
Further, in the pilot test, additional regression models were calculated according to the H5 hypothesis, as follows:
Hypothesis 5 (H5).
Assuming the agri-food industry as the most mature in measuring and monitoring the level of circularity, is there a link between the perception of users working in other manufacturing activities and the perception of users working in the agri-food one?
The hypothesis was based on the idea that the sale of food and beverage commodities is strongly correlated with their weight (e.g., 500 g of pasta, 1.5 L of soft drink). Hence, food and beverage companies have already implemented internal measurement protocols for raw materials and residues (waste and food waste), such as the weighing machine at the entry of the raw materials into the company, as well as the purchase notes of the raw materials expressed in terms of weight and not in terms of pieces. Moreover, it is important to remember the key role played by the food and beverage sector, which is to guarantee food safety and security by adopting sustainable production and consumption patterns towards environmental protection, economic growth, and social equalities. Italy holds the European leadership on circular bioeconomy issues in the food and beverage sector, with excellent experiences related to eco-design, valorization of by-products and circularity of the food system [55,56].
4. Results
4.1. Sample Characteristics
The total amount of respondents was 105 out of the 123 received questionnaires. Table 4 illustrates the sociodemographic characteristics of the sample, by distinguishing per gender, age, residence area, education, manufacturing activity and professional role. The results showed that 58% of the respondents were men, whereas 42% were women, making the sample rather heterogeneous under the gender profile. Further, the vast majority of respondents were aged between 26 to 45 years old, distinguishing between 26–35 (29%) and 36–45 (30%). As regards the education perspective, approximately 42% of the respondents had a bachelor or master’s degree, followed by workers with a diploma (35%). In the field of manufacturing activities, the largest quota of the sample were distributed in the food and beverage industry (26%), in coke and products deriving from petroleum refining (20%) and in textiles (15%). Industries. Last, as concerns the professional role, 36% of the respondents were managers, 28% worked in the back-office (e.g., accountants, laboratory staffs, salesmen) and 21% were workers.
4.2. Users’ Perception and Awareness of the Circular Economy Monitoring Indicators
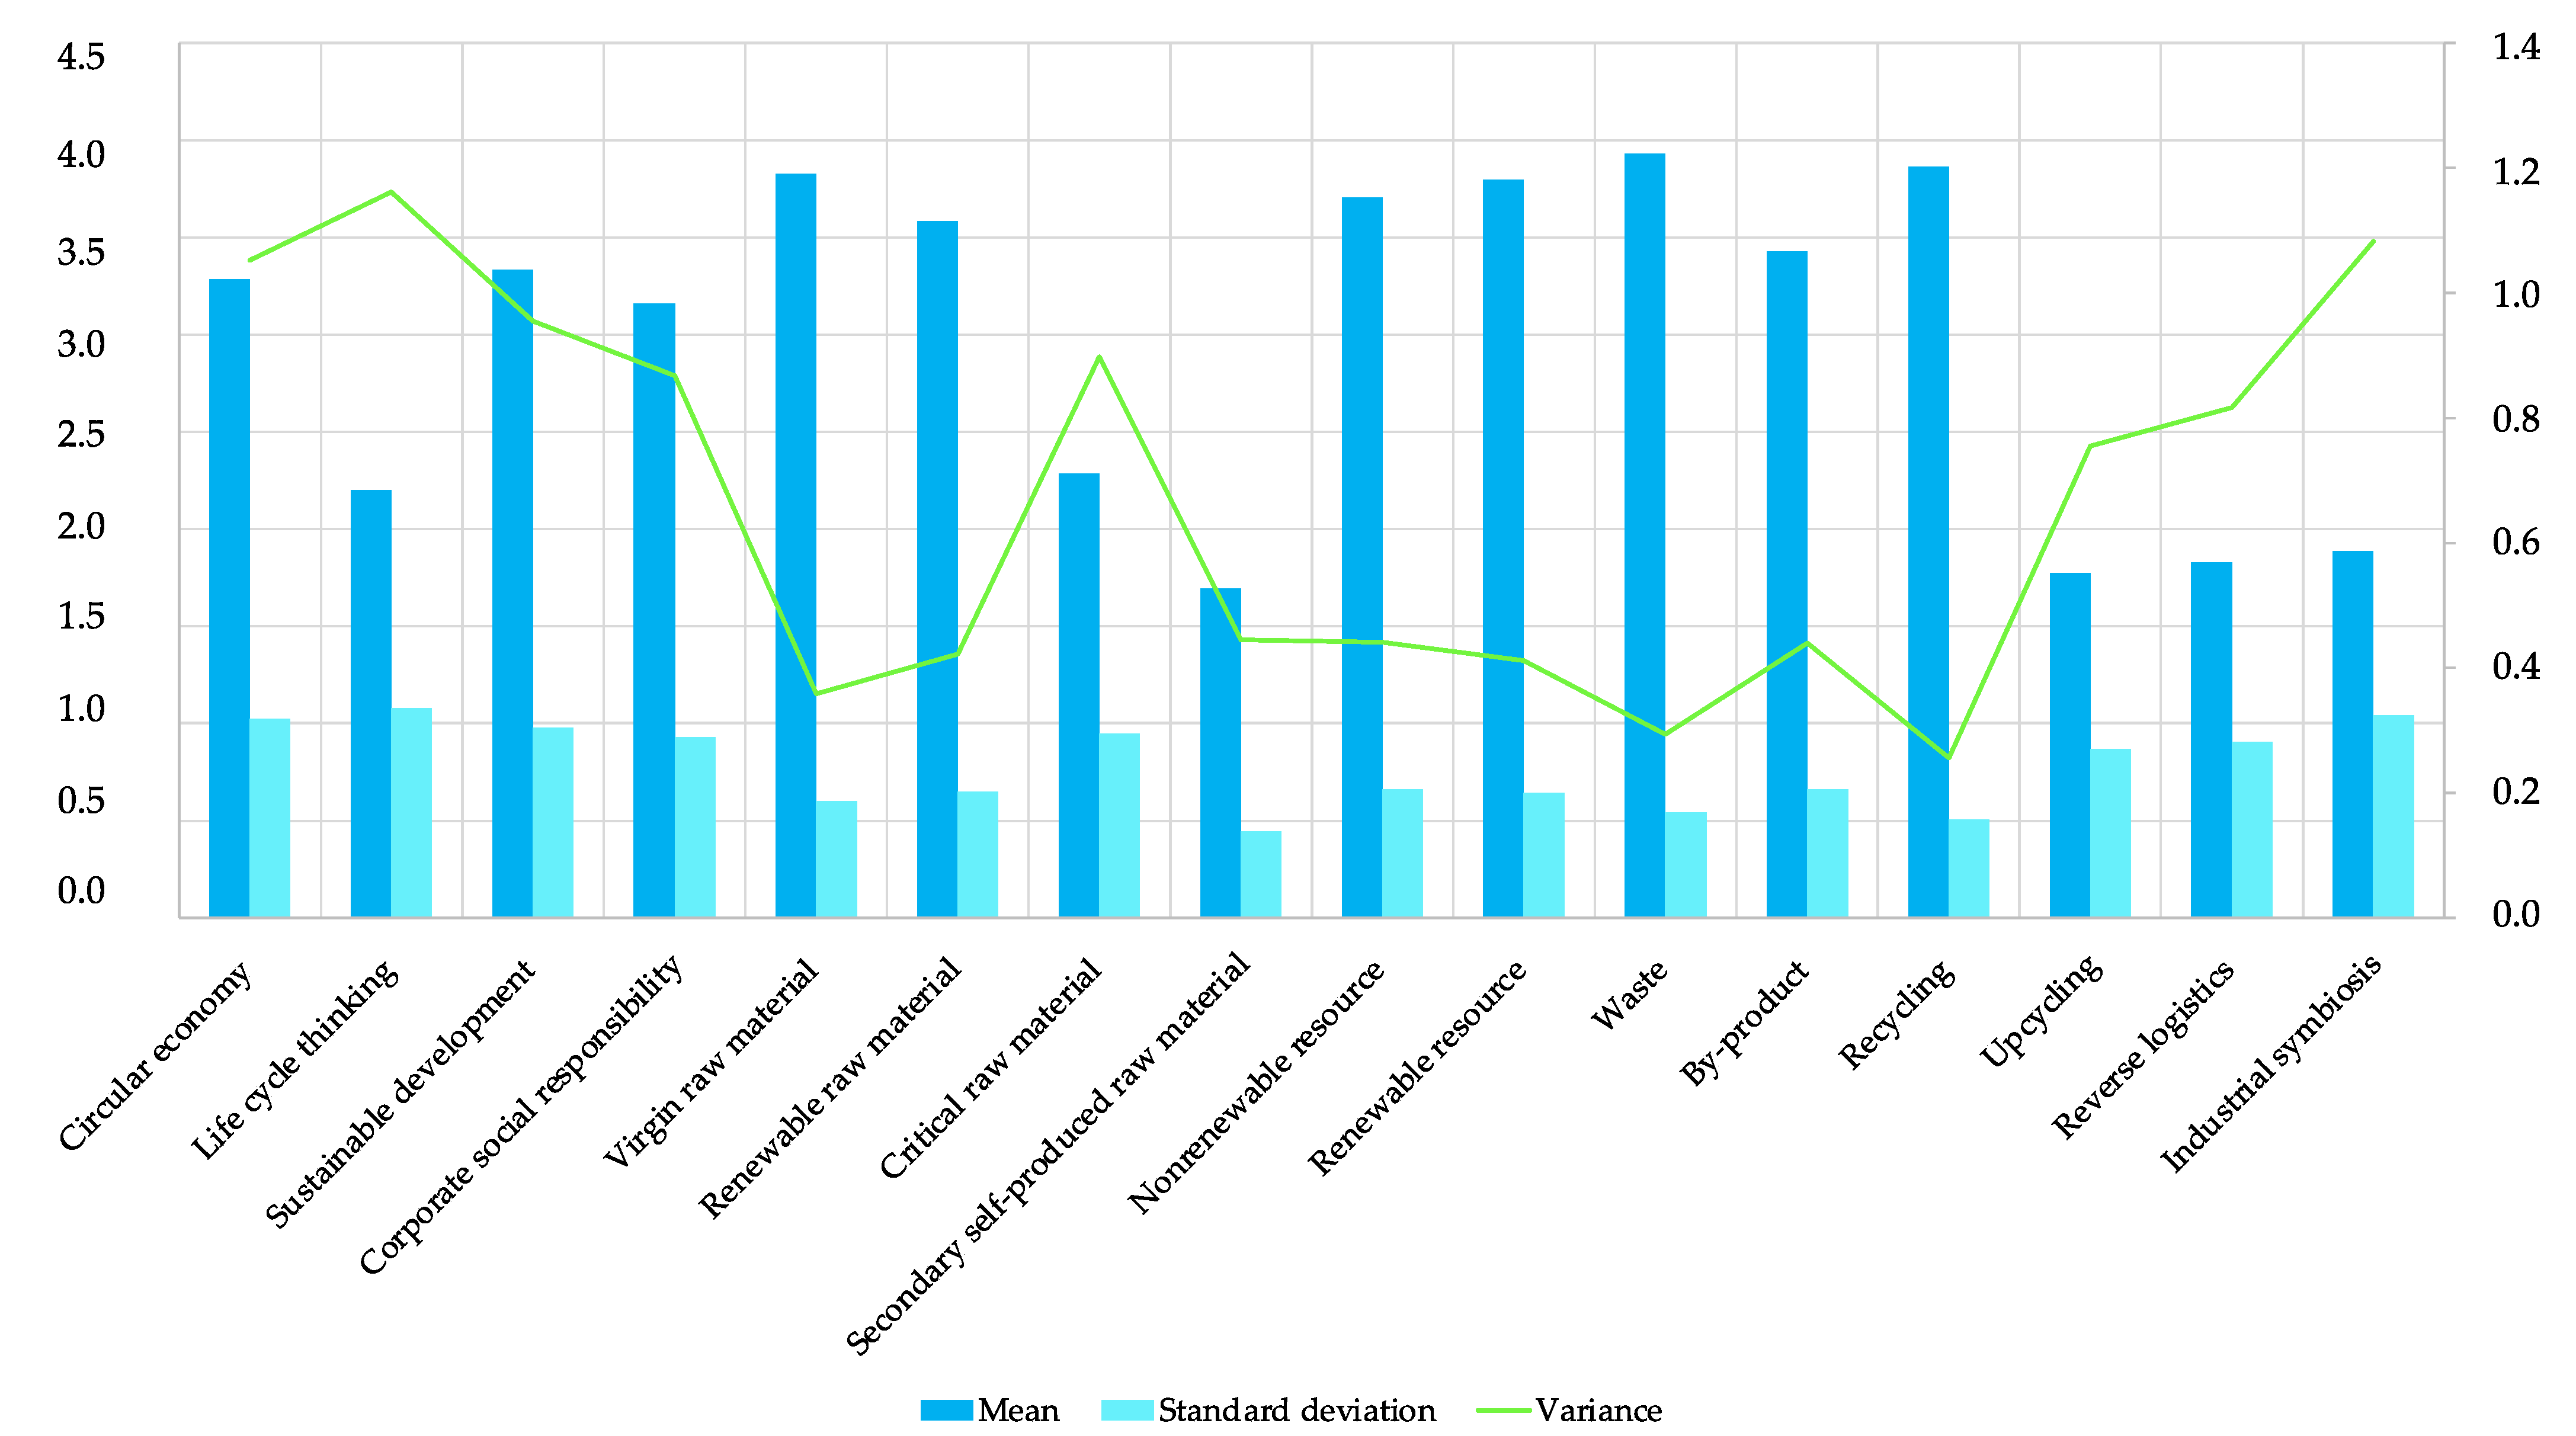
In the field of the awareness of selected items, the concept which presents the highest level of awareness among employees is “waste” ( = 3.93, σ2 = 0.29), followed by “recycling” ( = 3.86, σ2 = 0.25) and “virgin raw material” ( = 3.82, σ2 = 0.35). Such items presented a slight variance among the respondents, highlighting the small differences in the level of knowledge and different sociodemographic characteristics. On the other side, the items which presented the lowest level of knowledge were represented by “secondary self-produced raw materials” ( = 1.69, σ2 = 0.44), “upcycling” ( = 1.71, σ2 = 0.75) and “reverse logistics” ( = 1.82, σ2 = 0.81). As regards the core concepts at the basis of the UNI/TS 11820, the subsequent values were recorded: (a) circular economy ( = 3.28, σ2 = 1.05); (b) lifecycle thinking ( = 2.20, σ2 = 1.16); (c) sustainable development = 3.33, σ2 = 0.95); and (d) corporate social responsibility ( = 3.16, σ2 = 0.86). Such core concepts presented also a high variability within the sample, highlighting a high heterogeneity within the sample. Figure 2 illustrate the level of awareness on the sustainability issues by mean, standard deviation and variance.
The results showed that only 19 respondents out of 105 are aware of the UNI/TS 11820, which means that its diffusion is still far from the expectations. Among them, 12 were managers and three were directors of the companies.
Table 5 illustrates the mean of users’ perception on the selected circularity indicators. The results should be read considering that each respondent could select an answer according to the 5-point Likert scale. This means that values close to 1 (i.e., “not at all”) reveal a very low level of perception on the topic, whereas values close to 5 (i.e., “very much”) reveal a very high level of perception on the ease of calculating the monitoring indicators. Further, Table 5 records the rate of perception (i.e., Rp%) per selected indicator, expressed as the ratio between the value actually recorded and the highest possible one (i.e., 30 per indicator).
One positive perception was estimated with reference to Pc 10 (i.e., quantification of inbound virgin material resources, outbound residues), which recorded a Rp% = 77.53%, as well as to Pc 11 (i.e., self-produced electricity from renewable sources and/or recovery processes and electricity consumed), with a Rp% = 74.17%, Ps 15.1 (i.e., water from recovery and/or recycling and water needs), with a Rp% = 77.73%, Pc 16.1 (i.e., municipal and/or special waste produced), with a Rp% = 79.93%, Ps 26 (i.e., employees adhering to sustainable mobility initiatives), with a Rp% = 78.13 % and Pc 57 (i.e., energy performance index of the buildings), with a Rp% = 82.47%.
On the other hand, the most negative perception on the ease of measuring the circular indicators was estimated for Pc 04 (i.e., by-products and/or secondary material resources), with a Rp% = 52.3%, Pc 07 (i.e., renewable, or recycled resources used for packaging), with a Rp% = 50.43% and Ps 22 (i.e., waste treated at local and not-local valorization plants), with a Rp% = 43.43–50.27%.
Under the sector perspective, the highest scores (intended as the sum of all means registered for the selected indicators per sector) were estimated in the coke products deriving from petroleum refining sector, as well as in the chemicals, pharmaceuticals sectors, etc. sector (51.11), whereas the lowest score was estimated in the textile industry (47.17). The food and beverage sector represented the approximative mean between the highest and the lowest score (49.96).
Table 6 illustrates the R2 of the different regression models, which evaluate how the level of perception on the ease of measuring the selected circular economy indicators can be explained by the level of familiarity of “circular economy” (H1), “lifecycle thinking” (H2), “sustainable development” (H3) and “corporate social responsibility” (H4). Although the general high level of significance (F coefficient), it does not appear that the perception on the ease of calculating the circular economy indicators depends on the familiarity of the above-mentioned concepts, underlining the fact that a generic education on the topics of the circular and the green economy is not enough to improve the levels of perception of employees, for whom specific instruction and in-depth training is required on how to measure and calculate the indicators.
The results of the explorative regression analysis under the H5 illustrate that there is a positive relationship between the means estimated in the electrical equipment, machinery, motor vehicle industries etc., and the food and beverage industry (R2 = 0.8990, F = 0.0000), whereas the results showed no particular connection between the chemicals and plastics industries, etc., and the food and beverage industry.
5. Discussion
From a theoretical perspective, the results showed a general negative perception related to the ease of monitoring the level of circularity among users. It appears to be rather complex to calculate the selected indicators, and that the vast majority of definitions involved in the measurement process appear with blurred boundaries and are often unknown, as in the case of the concepts of “self-produced secondary material resources” or “upcycling” or “reverse logistics”, for example. Although the level of awareness and perception of the measurability of the circular economy increases as the level of education increases or as the age of the users decreases, some issues need particular clarity, and it is necessary to provide, at the organization level, training for the employees involved in the processes of measurement. The results indicated that it is rather simple to assess some items, such as electricity or water consumption, since their amount is identified in the bills and appears to be “economically significant” for users. However, other values not susceptible to economic evaluation, such as the weight of incoming raw materials or the amount of recovered water in wastewater-treatment plants, are often omitted. This demonstrates that the variables involved in measuring the circular economy must be interpreted in the light of their (potentially) obtainable economic value [57]. Often, users, and especially older users, are unfamiliar with the concept of the circular economy, to the point of not even being able to independently evaluate whether their organization has adopted circular economy strategies. For instance, employees are not familiar with the idea that rainwater harvesting to manage green areas (i.e., gardening) or to fill reservoirs for potential fire suppression should be considered as a circular strategy, because it avoids the dispersion of natural resources [58]. Such considerations suggest that the topic of the circular economy, before being measured, must be communicated unequivocally to employees, regardless of the level of professionalism achieved within the organization. Before measuring circularity, it is necessary to change the mindset of users by boosting education and training.
From the empirical perspective, the age of the employees and the reference sector determine some aspects worthy of reflection. It turns out that younger users have a more positive level of awareness and perception of circularity issues, potentially representing the category of employees most suited to recognizing and measuring the levels of circularity in organizations. Furthermore, it would seem that some sectors are more mature and oriented towards measuring levels of circularity, such as agri-food, chemical, pharmaceutical, electrical equipment, machinery companies, etc., which are already interested in the phenomenon of monitoring of raw materials from cradle to grave due to the stringent regulations relating to safety and security. On the one hand, food and beverage companies must guarantee food safety to consumers [59], whereas chemical or pharmaceutical companies, as well as electrical equipment or machinery companies are more likely to adopt RFID or passport-tracking systems of inputs and outputs [60]. In the absence of mandatory rules that require the verification of weight, quality, and characteristics of incoming or outgoing raw materials, as in the case of some companies such as those operating in the textile sector, the availability of data useful for measuring the levels of circularity represents a problem. Therefore, regardless of the reference sector and the average age of the companies, it is important to implement protocols for the qualitative measurement and qualitative identification of natural and energy resources, as well as the useful and non-useful outputs that circulate within each organization.
6. Conclusions and Policy Implications
This research explored, for the first time, the main features related to the UNI/TS 11820:2022, focusing on the aims and scope of the technical standards, as well as its indicators and the calculation methods from the theoretical perspective. Further, the study proposed an original analysis of users’ perception and awareness towards the UNI/TS 11820:2022 application, highlighting strengths and weaknesses from the managerial perspective. Although the research represents an exploratory test among users at the company level, it has pointed out a general negative perception related to the ease of monitoring the level of circularity, revealing a certain complexity in perceiving some procedures and/or behaviors already adopted in the organization as “circular strategies”, as well as in measuring some items such as “self-produced secondary material resource”. In addition, some definitions still appear with blurred boundaries, such as “upcycling” or “reverse logistics”. From the practical perspective, it appears that some industries are more mature in the field of circularity monitoring, such as agri-food or chemical and pharmaceutical companies. Hence, education and training must be enhanced among employees at all professional levels, and material accounting systems should be implemented in organizations without delay. Last, the results showed that items should be seen in the light of their (potentially) obtainable economic value, highlighting the nexus between economic and environmental benefits.
Policies should intervene by introducing education programs for either managers or employees. Previous studies, such as Burger et al. [47], have widely discussed opportunities to improve circularity in organization by boosting education and skill-enhancing individual programs starting from higher education institutions, as well as within single organization boundaries. The results indicate that the measurement steps require the clear and transparent teaching of measurement goals and methods as a prerequisite. Pending these instructions (or guidelines), companies (through their employees) will never be sufficiently able to measure and reach the circularity objectives required at the national and the international level. Such a conclusion has already been raised by outstanding studies, such as those conducted by Kirchher et al. [11], which argued that without a clear understanding of the meaning of the circular economy, and without detailed skill requirements on monitoring and measuring approaches, the achievement of circularity can collapse. In addition, incentives and funding programs must be introduced at the government level so that companies can concretely include, in their organizational chart, employees with specific skills dedicated to the material monitoring of resources and waste.
Limitations and Future Research Directions
The present research represents an exploratory test among users asked to measure the levels of circularity at the company level. Its main limitations include the reduced number of the participants to the study (i.e., sample size), which does not allow for a generalization or complete representativeness of the reference population, as well as the reduced amount of the indicators selected for the users’ evaluation. Only some items were subjected to perceptive evaluation by the users. Hence, the work provides a partial and incomplete view of the entire UNI/TS 11820 technical standard. However, it represents the first study on the subject, and allows academics and practitioners to identify possible room for reflection on the applicability of the standard in the context of its enlargement at the international level.
Future research directions aim to apply the technical standard to multiple case studies, to empirically verify the levels of circularity of some organizations operating in different sectors, and to evaluate similarities and differences in terms of the standard’s applicability in dissimilar industrial contexts.
Author Contributions
Conceptualization, V.A. and C.B.; methodology, V.A. and C.B.; software, C.B.; validation, C.B.; formal analysis, C.B.; investigation, V.A. and C.B; resources, V.A. and C.B.; data curation, C.B.; writing—original draft preparation, C.B.; writing—review and editing, V.A.; visualization, C.B.; supervision, V.A. All authors have read and agreed to the published version of the manuscript.
Funding
This research received no external funding.
Data Availability Statement
Not applicable.
Conflicts of Interest
The authors declare no conflict of interest.
References
- Jacobi, N.; Haas, W.; Wiedenhofer, D.; Mayer, A. Providing an economy-wide monitoring framework for the circular economy in Austria: Status quo and challenges. Resour. Conserv. Recycl. 2018, 137, 156–166. [Google Scholar] [CrossRef]
- Reich, R.H.; Vermeyen, V.; Alaerts, L.; Van Acker, K. How to measure a circular economy: A holistic method compiling policy monitors. Resour. Conserv. Recycl. 2023, 188, 106707. [Google Scholar] [CrossRef]
- Bringezu, S. The World Budget—Safe and Fair Resource Use for Global Survival and Well-Being; International Resource Panel: Remscheid, Germany, 2022; pp. 1–130. [Google Scholar]
- Lamba, H.K.; Kumar, N.S.; Dhir, S. Circular economy and sustainable development: A review and research agenda. Int. J. Product. Perform. Manag. 2023; ahead of print. [Google Scholar] [CrossRef]
- Moraga, G.; Huysveld, S.; Mathieux, F.; Blengini, G.A.; Alaerts, L.; Van Acker, K.; de Meester, S.; Dewulf, J. Circular economy indicators: What do they measure? Resour. Conserv. Recycl. 2019, 146, 452–461. [Google Scholar] [CrossRef] [PubMed]
- Poponi, S.; Arcese, G.; Pacchera, F.; Martucci, O. Evaluating the transition to the circular economy in the agri-food sector: Selection of indicators. Resour. Conserv. Recycl. 2022, 176, 105916. [Google Scholar] [CrossRef]
- Ghisellini, P.; Ncube, A.; Rotolo, G.; Vassillo, C.; Kaiser, S.; Passaro, R.; Ulgiati, S. Evaluating Environmental and Energy Performance Indicators of Food Systems, within Circular Economy and “Farm to Fork” Frameworks. Energies 2023, 16, 1671. [Google Scholar] [CrossRef]
- Sassanelli, C.; Rosa, P.; Rocca, R.; Terzi, S. Circular economy performance assessment methods: A systematic literature review. J. Clean. Prod. 2019, 229, 440–453. [Google Scholar] [CrossRef]
- Parchomenko, A.; Nelen, D.; Gillabel, J.; Rechberger, H. Measuring the circular economy—A Multiple Correspondence Analysis of 63 metrics. J. Clean. Prod. 2019, 210, 200–216. [Google Scholar] [CrossRef]
- UNI/TS 11820; Misurazione Della Circolarità—Metodi ed Indicatori per la Misurazione dei Processi Circolari Nelle Organizzazioni. Ministero dell’Ambiente e della Sicurezza Energetica: Rome, Italy, 2022.
- Kirchherr, J.; Reike, D.; Hekkert, M. Conceptualizing the circular economy: An analysis of 114 definitions. Resour. Conserv. Recycl. 2017, 127, 221–232. [Google Scholar] [CrossRef]
- De Oliveira, C.T.; Oliiveira, G.G.A. What Circular economy indicators really measure? An overview of circular economy principles and sustainable development goals. Resour. Conserv. Recycl. 2023, 190, 106850. [Google Scholar] [CrossRef]
- Giljum, S.; Dittrich, M.; Lieber, M.; Lutter, S. Global Patterns of Material Flows and their Socio-Economic and Environmental Implications: A MFA Study on All Countries World-Wide from 1980 to 2009. Resources 2014, 3, 319–339. [Google Scholar] [CrossRef]
- Kullmann, F.; Markewitz, P.; Stolten, D.; Robinius, M. Combining the worlds of energy systems and material flow analysis: A review. Energy Sustain. Soc. 2021, 11, 13. [Google Scholar] [CrossRef]
- Eurostat. Monitoring Framework. 2023. Available online: https://ec.europa.eu/eurostat/web/circular-economy/indicators/monitoring-framework (accessed on 23 February 2023).
- European Union. EU Resource Efficiency Scoreboard 2015. 2016. Available online: https://ec.europa.eu/environment/resource_efficiency/targets_indicators/scoreboard/pdf/EU%20Resource%20Efficiency%20Scoreboard%202015.pdf (accessed on 23 February 2023).
- European Commission. Raw Materials Scoreboard 2021. 2021. Available online: https://rmis.jrc.ec.europa.eu/?page=scoreboard2021#/intro (accessed on 23 February 2023).
- Amicarelli, V.; Bux, C. Food waste measurement toward a fair, healthy and environmental-friendly food system: A critical review. Br. Food J. 2021, 123, 2907–2935. [Google Scholar] [CrossRef]
- OJEU (Official Journal of the European Union). Commission Delegated Decision (EU) 2019/1597 of 3 May 2019. 2019. Available online: https://eur-lex.europa.eu/legal-content/EN/TXT/?uri5OJ:L:2019:248:TOC (accessed on 23 February 2023).
- De Pascale, A.; Arbolino, R.; Szopik-Depczyńska, K.; Limosani, M.; Ioppolo, G. A systematic review for measuring circular economy: The 61 indicators. J. Clean. Prod. 2021, 281, 12492. [Google Scholar] [CrossRef]
- Rossi, E.; Bertassini, A.C.; Ferreira, C.d.S.; Neves do Amaral, W.A.; Ometto, A.R. Circular economy indicators for organizations considering sustainability and business models: Plastic, textile and electro- electronic cases. J. Clean. Prod. 2020, 247, 119137. [Google Scholar] [CrossRef]
- Rana, R.L.; Bux, C.; Lombardi, M. Carbon footprint of the globe artichoke supply chain in Italy: From agricultural production to industrial processing. J. Clean. Prod. 2023, 391, 136240. [Google Scholar] [CrossRef]
- Suarez-Eiroa, B.; Fernandez, E.; Mendez-Martínez, G.; Soto-Onate, D. Operational principles of circular economy for sustainable development: Linking theory and practice. J. Clean. Prod. 2018, 214, 952–961. [Google Scholar] [CrossRef]
- UNEP. Life Cycle Approaches—The Road from Analysis to Practice; United Nations Environment Programme: Nairobi, Kenya, 2005. [Google Scholar]
- Graedel, T.E.; Reck, B.K. Chapter 3—Recycling in Context. In Handbook of Recycling; Ernst, W., Markus, A.R., Eds.; Elsevier: Amsterdam, The Netherlands, 2014; pp. 17–26. [Google Scholar] [CrossRef]
- Ardente, F.; Mathieux, F. Identification and assessment of product’s measures to improve resource efficiency: The case-study of an Energy using Product. J. Clean. Prod. 2014, 83, 126–141. [Google Scholar] [CrossRef]
- Huysman, S.; Debaveye, S.; Schaubroeck, T.; De Meester, S.; Ardente, F.; Mathieux, F.; Dewulf, J. The recyclability benefit rate of closed-loop and open-loop systems: A case study on plastic recycling in Flanders. Resour. Conserv. Recycl. 2015, 101, 53–60. [Google Scholar] [CrossRef]
- Ruggieri, A.; Poponi, S.; Pacchera, F.; Fortuna, F. Life cycle-based dashboard for circular agri-food sector. Int. J. Life Cycle Assess. 2022, 1–16. [Google Scholar] [CrossRef]
- UNI. Home Page. 2023. Available online: https://www.uni.com/index.php (accessed on 23 February 2023).
- UNI EN ISO 14040. Gestione Ambientale—Valutazione del Ciclo di Vita—Principi e Quadro di Riferimento. 2022. Available online: https://store.uni.com/uni-en-iso-14040-2021 (accessed on 23 February 2023).
- UNI EN ISO 14067. Gas ad Effetto Serra—Impronta Climatica dei Prodotti (Carbon Footprint dei Prodotti)—Requisiti e Linee Guida per la Quantificazione. 2018. Available online: https://store.uni.com/uni-en-iso-14067-2018 (accessed on 23 February 2023).
- Asgari, A.; Asgari, R. How circular economy transforms business models in a transition towards circular ecosystem: The barriers and incentives. Sustain. Prod. Consum. 2021, 28, 566–579. [Google Scholar] [CrossRef]
- Liu, Y.; Bai, Y. An exploration of firms’ awareness and behavior of developing circular economy: An empirical research in China. Resour. Conserv. Recycl. 2014, 87, 145–152. [Google Scholar] [CrossRef]
- Sani, D.; Picone, S.; Bianchini, A.; Fava, F.; Guarnieri, P.; Rossi, J. An Overview of the Transition to a Circular Economy in Emilia-Romagna Region, Italy Considering Technological, Legal–Regulatory and Financial Points of View: A Case Study. Sustainability 2021, 13, 596. [Google Scholar] [CrossRef]
- Van Langen, S.K.; Vassillo, C.; Ghisellini, P.; Restaino, D.; Passaro, R.; Ulgiati, S. Promoting circular economy transition: A study about perceptions and awareness by different stakeholders’ groups. J. Clean. Prod. 2021, 316, 128166. [Google Scholar] [CrossRef]
- Testa, F.; Iovino, R.; Iraldo, F. The circular economy and consumer behaviour: The mediating role of information seeking in buying circular packaging. Bus. Strategy Environ. 2020, 29, 3435–3448. [Google Scholar] [CrossRef]
- Kirchherr, J.; Piscicelli, L. Towards an Education for the Circular Economy (ECE): Five Teaching Principles and a Case Study. Resour. Conserv. Recycl. 2019, 150, 104406. [Google Scholar] [CrossRef]
- Istat. Competitività dei Settori Produttivi.2023. Available online: https://www.istat.it/it/competitivita (accessed on 6 March 2023).
- Hsu, H.Y.; Wang, S. Using Google forms to collect and analyze data. Sci. Scope 2017, 40, 64–67. [Google Scholar] [CrossRef]
- Mondal, H.; Mondal, S.; Ghosal, T.; Mondal, S. Using Google forms for medical survey: A technical note. Int. J. Clin. Exp. Pathol. 2018, 5, 216–218. [Google Scholar] [CrossRef] [Green Version]
- Cohen, A. Field research in conflict environments: Methodological challenges and snowball sampling. J. Peace Res. 2011, 48, 423–435. [Google Scholar] [CrossRef]
- Alaimo, L.S.; Fiore, M.; Galati, A. How the covid-19 pandemic is changing online food shopping human behaviour in Italy. Sustainability 2020, 12, 9594. [Google Scholar] [CrossRef]
- Daniel, J. Choosing the Size of the Sample; SAGE Publications, Inc.: Thousand Oaks, CA, USA, 2012. [Google Scholar] [CrossRef]
- Hogarth, M. 18—Data collection and analysis. In Chandos Information Professional Series; Data Clean-Up and, Management; Hogarth, M., Ed.; Elsevier: Amsterdam, The Netherlands, 2012; pp. 413–442. [Google Scholar] [CrossRef]
- Amicarelli, V.; Patruno, A.; Bux, C.; Lagioia, G. Passengers’ perception on aviation environmental issues and its effect on sustainable tourism. Int. J. Digit. Cult. Electron. Tour. 2021, 3, 382–400. [Google Scholar] [CrossRef]
- Liengme, B.; Hekman, K. Chapter 8—Regression Analysis. In Liengme’s Guide to Excel® 2016 for Scientists and Engineers; Liengme, B., Hekman, K., Eds.; Academic Press: Cambridge, MA, USA, 2020; pp. 187–216. [Google Scholar] [CrossRef]
- Burger, M.; Stavropoulos, S.; Ramkumar, S.; Dufourmont, J.; van Oort, F. The heterogeneous skill-base of circular economy employment. Res. Policy 2019, 48, 248–261. [Google Scholar] [CrossRef]
- Jacob-Lopes, E.; Queiroz Zepka, L.; Costa Deprá, M. Chapter 5—Assistant’s tools toward life cycle assessment. In Sustainability Metrics and Indicators of Environmental Impact; Jacob-Lopes, E., Zepka, L.Q., Deprá, M.C., Eds.; Elsevier: Amsterdam, The Netherlands, 2021; pp. 77–90. [Google Scholar] [CrossRef]
- Hughes, R. The EU Circular Economy package—Life cycle thinking to life cycle law? Procedia CIRP 2017, 61, 10–16. [Google Scholar] [CrossRef]
- World Commission on Environment and Development. Our Common Future; Oxford University Press: Oxford, UK, 1987. [Google Scholar]
- Waas, T.; Verbruggen, A.; Wright, T. University research for sustainable development: Definition and characteristics explored. J. Clean. Prod. 2010, 18, 629–636. [Google Scholar] [CrossRef]
- McKeown, R. Education for Sustainable Development Toolkit. In Section for Education for Sustainable Development (ED/UNP/ESD); UNESCO: Paris, France, 2002. [Google Scholar]
- Smith, R.E. Defining Corporate Social Responsibility: A System Approach for Socially Responsible Capitalism. Master’s Thesis, University of Pennsylvania, Philadelphia, PA, USA, 2011. Available online: https://repository.upenn.edu/od_theses_mp/9 (accessed on 10 April 2023).
- Morea, D.; Fortunati, S.; Martiniello, L. Circular economy and corporate social responsibility: Towards an integrated strategic approach in the multinational cosmetics industry. J. Clean. Prod. 2021, 315, 128232. [Google Scholar] [CrossRef]
- Lopes, R.; Santos, R.; Videira, N.; Antunes, P. Co-creating a Vision and Roadmap for Circular Economy in the Food and Beverages Packaging Sector. Circ. Econ. Sustain. 2021, 1, 873–893. [Google Scholar] [CrossRef]
- ICESP. Verso la Circolarità del Sistema Agroalimentare: Modelli di Business e Buone Pratiche. Raporto di Filiera, Edizione 2022; ICESP: Budapest, Hungary, 2022. [Google Scholar] [CrossRef]
- Amicarelli, V.; Lombardi, M.; Varese, E.; Bux, C. Material flow and economic cost analysis of the Italian artisan bread production before and during the Russia-Ukraine conflict. Environ. Impact Assess. Rev. 2023, 101, 107101. [Google Scholar] [CrossRef]
- Gleason Espíndola, J.A.; Cordova, F.; Casiano Flores, C. The importance of urban rainwater harvesting in circular economy: The case of Guadalajara city. Manag. Res. Rev. 2018, 41, 533–553. [Google Scholar] [CrossRef]
- James, K.; Millington, A.; Randall, N. Food and feed safety vulnerabilities in the circular economy. EFSA Support. Publ. 2022, 19, 7226E. [Google Scholar] [CrossRef]
- Dukyil, A.; Mohammed, A.; Darwish, M. Design and optimization of an RFID-enabled passport tracking system. J. Comput. Des. Eng. 2018, 5, 94–103. [Google Scholar] [CrossRef]
Figure 1.
Research framework. Source: personal elaboration by the authors.

Figure 2.
Awareness on the Sustainability Issues by Mean, Standard Deviation and Variance. Source: Personal elaboration by the authors.
Figure 2.
Awareness on the Sustainability Issues by Mean, Standard Deviation and Variance. Source: Personal elaboration by the authors.


Table 1.
Indicators Typologies.
| Indicators’ Typology | Core (Pc) | Specific (Ps) | Rewarding (Pr) | Total |
|---|---|---|---|---|
| Material resources | 3 | 6 | 1 | 10 |
| Energy and water resources | 0 | 5 | 0 | 5 |
| Waste and emissions | 3 | 2 | 1 | 6 |
| Logistics | 0 | 6 | 0 | 6 |
| Final product or service | 0 | 24 | 4 | 28 |
| Human resources, assets, policies and sustainability | 2 | 9 | 5 | 16 |
| Total | 8 | 52 | 11 | 71 |
Source: Personal elaboration by the authors on UNI [29].
Table 2.
Questionnaire Sections, Items and Answers.
| Section | Item | Answer |
|---|---|---|
| Sociodemographic characteristics | Gender | Female/Male |
| Age | 18–25/26–35/36–45/46–55 /56–65/Over 65 | |
| Residence area | Big city (over 100,000 inhabitants)/Small city (10,000–100,000 inhabitants)/Town (fewer than 10,000 inhabitants) | |
| Education | Elementary school/Middle school/Diploma/Bachelor’s or master’s degree/Master or Ph.D. | |
| Manufacturing activity | Food and beverage/Textile/Chemicals, pharmaceuticals, etc./Coke and products deriving from petroleum refining/Plastics manufacturing/Electrical equipment, machinery, motor vehicles, etc./Others | |
| Professional role | Direction/Management/Back office/Front office/Worker | |
| Level of awareness on the sustainability issues | Circular economy/Lifecycle thinking/Sustainable development/Corporate social responsibility/Virgin raw material/Renewable raw material/Critical raw material/Secondary self-produced raw material/Nonrenewable resource/Renewable resource/Waste/By-product/Recycling/Upcycling/Reverse logistics/Industrial symbiosis | 5-point Likert scale (HMFWC) from 1 = very little to 5 = very much |
| Knowledge of the UNI/TS 11820:2022 | Yes/No |
Note: HMFWC = How much are you familiar with the concept? Manufacturing activities have been retrieved from Istat [38] and take care of the ATECO categories, as required by the UNI/TS 11820. In the section “Level of awareness on the sustainability issues”, the first four have been selected in the light of the developed hypotheses (Section 3.3), whereas the others have been identified according to the core items required to calculate the selected indicators (Table 3). Source: Personal elaboration by the authors.
Table 3.
Selected Indicators for the Users’ Perception and Awareness Analysis.
| Code | Typology | Indicator Group | Selected Item |
|---|---|---|---|
| 04 | Pc | Material resources | By-products and/or secondary material resources |
| 07 | Pc | Material resources | Renewable or recycled resources used for packaging |
| 10 | Pc | Material resources | Inbound virgin material resources, outbound residues |
| 11 | Ps | Energy and water resources | Self-produced electricity from renewable sources and/or recovery processes (11.1), electricity consumed (11.2) |
| 15 | Ps | Energy and water resources | Water from recovery and/or recycling (15.1), water needs (15.2) |
| 16 | Pc | Waste and emissions | Municipal and/or special waste produced (16.1), municipal and/or special waste sent to landfills (16.2) |
| 17 | Pc | Waste and emissions | Municipal and/or special waste collected separately |
| 22 | Ps | Logistics | Waste treated at local valorization plants (22.1) and not local valorization plants (22.2) |
| 26 | Ps | Logistics | Employees adhering to sustainable mobility initiatives |
| 57 | Pc | HR, assets, policies, sust. | Energy performance index of the buildings |
| 59 | Pc | HR, assets, policies, sust. | Circular economy strategies in the organization |
Note: HR = Human resources. “Code” refers to the number of the indicators in the UNI/TS 11820:2022. Pc is related to “core indicators”, Ps to “specific indicators”. “Sust.” is “Sustainability”. All answers are related to the question: “How simple do you think it is to measure the following value?”. Respondents could apply the 5-point Likert scale from 1 = very little to 5 = very much. Source: Personal elaboration by the authors.
Table 4.
Sociodemographic Characteristics.
| Item | Variable | Frequency (n) | Percentage (%) |
|---|---|---|---|
| Gender | Male | 61 | 58% |
| Female | 44 | 42% | |
| Age | 18–25 | 10 | 10% |
| 26–35 | 30 | 29% | |
| 36–45 | 31 | 30% | |
| 46–55 | 17 | 16% | |
| 56–65 | 15 | 14% | |
| Over 65 | 2 | 2% | |
| Residence area | Big city (over 100,000 inhabitants) | 44 | 42% |
| Small city (10,000–100,000) | 20 | 19% | |
| Town (less than 10,000 inhabitants) | 41 | 39% | |
| Education | Elementary school | 0 | 0% |
| Middle school | 7 | 7% | |
| Diploma | 37 | 35% | |
| Bachelor’s or master’s degree | 44 | 42% | |
| Master or Ph.D. | 17 | 16% | |
| Manufacturing activity | Food and beverage | 27 | 26% |
| Textile | 17 | 16% | |
| Chemicals, pharmaceuticals, etc. | 16 | 15% | |
| Coke and products deriving from petroleum refining | 21 | 20% | |
| Plastics manufacturing | 14 | 13% | |
| Electrical equipment, machinery, motor vehicles, etc. | 10 | 10% | |
| Professional role | Direction | 9 | 9% |
| Management | 38 | 36% | |
| Back office | 29 | 28% | |
| Front office | 7 | 7% | |
| Worker | 22 | 21% |
Source: Personal elaboration by the authors.
Table 5.
Users’ Perception on Selected Circularity Indicators by Mean.
| Indicator | F&B | Chemicals etc. | Coke etc. | Plastics etc. | Electrical etc. | Textile | Rp% |
|---|---|---|---|---|---|---|---|
| Pc 04 | 2.55 | 2.61 | 3.06 | 2.61 | 2.52 | 2.50 | 52.83% |
| Pc 07 | 2.74 | 2.52 | 2.25 | 2.52 | 2.70 | 2.40 | 50.43% |
| Pc 10 | 3.88 | 3.90 | 3.87 | 3.90 | 3.94 | 3.77 | 77.53% |
| Ps 11.1 | 3.48 | 3.85 | 3.81 | 3.85 | 3.76 | 3.50 | 74.17% |
| Ps 11.2 | 4.69 | 3.91 | 4.00 | 3.71 | 4.70 | 2.90 | 79.70% |
| Ps 15.1 | 2.48 | 4.68 | 4.81 | 4.66 | 2.29 | 4.40 | 77.73% |
| Ps 15.2 | 4.29 | 2.42 | 2.24 | 2.42 | 4.17 | 2.00 | 58.47% |
| Pc 16.1 | 3.59 | 4.28 | 4.25 | 4.42 | 3.64 | 3.80 | 79.93% |
| Pc 16.2 | 3.14 | 3.28 | 3.31 | 3.28 | 2.29 | 3.30 | 62.00% |
| Pc 17 | 3.14 | 3.09 | 3.00 | 3.09 | 3.35 | 3.10 | 62.57% |
| Ps 22.1 | 2.18 | 2.09 | 2.20 | 2.09 | 2.17 | 2.30 | 43.43% |
| Ps 22.2 | 2.37 | 2.47 | 2.80 | 2.47 | 2.47 | 2.50 | 50.27% |
| Ps 26 | 4.22 | 4.00 | 4.20 | 4.00 | 4.52 | 3.80 | 82.47% |
| Pc 57 | 3.73 | 4.00 | 4.06 | 4.00 | 4.05 | 3.60 | 78.13% |
| Pc 59 | 3.48 | 3.19 | 3.25 | 3.19 | 3.58 | 3.30 | 66.63% |
| Total | 49.96 | 50.29 | 51.11 | 50.21 | 50.15 | 47.17 |
Note: It should be considered that the highest possible value is 30 points per selected indicators, and 75 points per each manufacturing activity. Source: Personal elaboration by the authors.
Table 6.
Regression models related to H1, H2, H3 and H4.
| Indicator | H1: CE | H2: LCT | H3: SD | H4: CSR |
|---|---|---|---|---|
| Pc 04 | 0.1646 *** | 0.0620 ** | 0.1775 *** | 0.0975 *** |
| Pc 07 | 0.1471 *** | 0.0554 ** | 0.2140 *** | 0.0961 *** |
| Pc 10 | 0.0125 | 0.0059 | 0.0382 ** | 0.0977 *** |
| Ps 11.1 | 0.0310 ** | 0.0674 *** | 0.1052 *** | 0.0396 ** |
| Ps 11.2 | 0.0895 *** | 0.0089 | 0.0403 ** | 0.1816 *** |
| Ps 15.1 | 0.0380 ** | 0.0667 *** | 0.1055 *** | 0.0492 ** |
| Ps 15.2 | 0.1551 *** | 0.0411 ** | 0.0941 *** | 0.0743 *** |
| Pc 16.1 | 0.1685 *** | 0.1145 *** | 0.1512 *** | 0.0726 *** |
| Pc 16.2 | 0.1207 *** | 0.1377 *** | 0.1104 *** | 0.0871 *** |
| Pc 17 | 0.0084 | 0.0114 | 0.0161 | 0.0085 |
| Ps 22.1 | 0.1297 *** | 0.0619 *** | 0.1025 *** | 0.0193 |
| Ps 22.2 | 0.1151 *** | 0.0759 *** | 0.1021 *** | 0.0658 *** |
| Ps 26 | 0.0873 *** | 0.0406 ** | 0.1156 *** | 0.0649 *** |
| Pc 57 | 0.0783 *** | 0.0059 | 0.0808 *** | 0.1158 *** |
| Pc 59 | 0.3383 *** | 0.2614 *** | 0.3349 *** | 0.1998 *** |
Note: *** refer to F significance at 0.01 and ** to F significance at 0.05.
Disclaimer/Publisher’s Note: The statements, opinions and data contained in all publications are solely those of the individual author(s) and contributor(s) and not of MDPI and/or the editor(s). MDPI and/or the editor(s) disclaim responsibility for any injury to people or property resulting from any ideas, methods, instructions or products referred to in the content. |
© 2023 by the authors. Licensee MDPI, Basel, Switzerland. This article is an open access article distributed under the terms and conditions of the Creative Commons Attribution (CC BY) license (https://creativecommons.org/licenses/by/4.0/).
Share and Cite
MDPI and ACS Style
Amicarelli, V.; Bux, C. Users’ Perception of the Circular Economy Monitoring Indicators as Proposed by the UNI/TS 11820:2022: Evidence from an Exploratory Survey. Environments 2023, 10, 65. https://doi.org/10.3390/environments10040065
AMA Style
Amicarelli V, Bux C. Users’ Perception of the Circular Economy Monitoring Indicators as Proposed by the UNI/TS 11820:2022: Evidence from an Exploratory Survey. Environments. 2023; 10(4):65. https://doi.org/10.3390/environments10040065
Chicago/Turabian StyleAmicarelli, Vera, and Christian Bux. 2023. "Users’ Perception of the Circular Economy Monitoring Indicators as Proposed by the UNI/TS 11820:2022: Evidence from an Exploratory Survey" Environments 10, no. 4: 65. https://doi.org/10.3390/environments10040065
Note that from the first issue of 2016, this journal uses article numbers instead of page numbers. See further details here.