Article

Environmental Impacts and Benefits of Tofu Production from Organic and Conventional Soybean Cropping: Improvement Potential from Renewable Energy Use and Circular Economy Patterns

1
Department of Food and Nutrition Science, University “Luigi Vanvitelli”, 81100 Caserta, Italy
2
National Centre for Waste and Circular Economy, Italian Institute for Environmental Protection and Research (ISPRA), 00144 Rome, Italy
3
Department of Engineering, Parthenope University of Naples, 80143 Naples, Italy
4
Faculty of Law, Pegaso Telematic University, 80143 Naples, Italy
5
School of Environment, Beijing Normal University, Beijing 100875, China
*
Authors to whom correspondence should be addressed.
Environments 2023, 10(5), 73; https://doi.org/10.3390/environments10050073
Submission received: 3 April 2023 / Revised: 20 April 2023 / Accepted: 21 April 2023 / Published: 27 April 2023

Abstract

:
This study aimed to quantify and evaluate the main environmental impacts generated in each phase of tofu production as well as its main co-products (soy milk, food integrators, etc.) and by-products (straw, hulls, etc.) from organic and conventional soybean cropping and to compare them with the impacts of conventional protein sources (e.g., livestock meat and snails). The starting case study was the tofu production company “Tigusto SA” located in Cugnasco-Locarno (Switzerland). The analysis was performed by means of the life cycle assessment (LCA) method, applying a systematic cradle-to-gate approach, from cultivation and extraction of raw materials to the final products. The aim of the analysis was to identify the phases that cause the main environmental burdens and to propose alternative solutions to minimize the impacts. Results show the importance of applying circularity-based scenarios, such as reuse/recycling of residues and the use of renewable energy, which could increase the sustainability of the investigated system, providing environmental and economic benefits.

1. Introduction

Food production worldwide is estimated to be responsible for 20% to 50% of environmental impacts [1,2]. Meat and dairy products are central to food-related impacts, due to their large environmental burdens, including overgrazing, land degradation, water contamination from waste runoff, biodiversity loss linked to landscape conversion for grazing and feed production, and finally greenhouse gas emissions related to livestock digestion (particularly ruminants) [3]. With population growth expected to reach 12 billion people by 2100 [4] and increased per capita demand of meat and dairy products, especially in developing countries where average income is rising [5], there is growing concern about producing more food with decreasing resources while at the same time minimizing environmental impacts. These environmental concerns, together with the shortages of high biological value proteins and aspects related to animal welfare and human health, have promoted the development of meat alternatives based on plant proteins. Soybean is one of humanity’s main food crops and has become the most widely known alternative to animal protein. Soybean use originated in China around 5000 years ago and gradually extended from China to other countries and continents. Since the 1950s, global soybean production has increased by 15 fold [6], mainly due to food and energy use. The USA, Brazil, and Argentina account for, respectively, 34%, 30%, and 17% of global production. Together, these three countries account for 81% of annual global soybean production and 71% of harvested area [7]. Among all oilseed crops, soybean alone has the maximum global production share (53%), while other crops such as rapeseed, cotton, and peanut contribute 15, 10, and 9%, respectively. Uses range from human foods to animal foods, to industrial products, to ingredients, and to precursor materials. In addition to the main soy products used directly as food items (soybeans, soymilk, tofu), also soy co-products (okara, whey, tempeh, among others, to be used as food integrators) and by-products (straw, hulls, fermentation residues, to be converted to plastic or bio-energy items) are important outputs of soy processing worldwide. Generally, co-products are almost ready for use, while by-products require additional processing to extract their hidden value.

1.1. Soy for Animal Nutrition

Only 20.1% of the total soybean crop is used as direct human food and 3.8% for energy purposes [8]. More than three-quarters (77.1%) of the total soy crop is used as animal feed: 7% fed directly to livestock, while the largest fraction (processed to soy cake before feeding) is fed to chickens and other poultry (37%); to pigs (20.2%); to cattle, sheep, pets and other animals (7.3%); and finally, 5.6% is used in aquaculture systems [9]. However, raw soybeans contain trypsin inhibitors, plant proteins that bind and inactivate digestive enzymes within the gastrointestinal tract of the animals, requiring that these proteins be destroyed by heat before feeding to swine or any other non-ruminants [10,11].
Animal meat products provide one-third of humanity’s protein intake and around one-fourth of the global calories consumed [12]. According to FAO reports on livestock [13,14], 18% of global greenhouse gas emissions (GHG) are caused by the livestock industry (usually employing highly intensive industrial production practices); ruminants are the major source responsible for their release due to low feed conversion rates, long reproduction intervals, and the features of their digestive system [14,15]. Livestock direct GHG emissions arise from raising animals, including enteric fermentation, manure, and associated energy consumption [16,17], while indirect emissions mainly come from feed production (due to the production of fertilizers and pesticides for feed crops, feed transportation and processing, fuel use in production) and related land use change [18]. Some studies indicate that indirect emissions exceed direct emissions, while others claim the opposite [18,19]. Nevertheless, impacts of meat production are not limited to GHG emissions: farms for rearing livestock already cover one-third of the world’s total land demand and more than two-thirds of agricultural land [19,20], and approximately 40% of the crops harvested worldwide are used to feed animals [21]. Therefore, large amounts of land, fertilizers, water and GHG emissions are needed to support feed production, grazing lands and animal maintenance.
Given livestock farming’s large environmental footprint and projected growth in meat demand, a major rethink of dietary habits and farming practices is required [22]. In addition to changes in production practices, eating less or no livestock products, such as meat, is often suggested as a possible solution to reduce the environmental impacts of the livestock sector [23,24,25,26,27].

1.2. Soy for Industrial Purposes

Soy can also be used for industrial purposes, mainly biofuels. Around 4% of total soy production is used for biofuels (out of which biodiesel accounts for 2.8%), lubricants and other industrial processes [28,29,30]. Longstanding uses include soap, paper coatings, wood veneer adhesives, alkyd resins, printing ink, and oleochemicals [31,32]. Soy products (oil, protein, meal) are now being used in a wide variety of products such as plastics and elastomers, paints and coatings, lubricants, adhesives, and solvents in addition to the well-established use of soy oil to make biodiesel. Soybean oil may be hydrolyzed into glycerol and fatty acids, while soybean oil soapstocks may be acidified to produce fatty acids, used for candles, crayons, cosmetics, polishes, buffing compounds, and mold lubricants [33,34]. Transesterification with methanol produces fatty acid methyl esters (FAME) and glycerol, the former being used as biofuels [30,33], an attractive option to replace fossil-based transportation fuels. The International Energy Agency (IEA) estimates that as much as one-third of all transportation fuel could come from biofuels by 2050 [34,35]. According to the latest predictions by the Rainforest Foundation Norway (an organization committed to the protection of the world’s rainforests), by 2030 the increase in demand to produce oil of soy as a biofuel will reach a quota of 41 million tons [36]. For this reason, even though soybean biodiesel shows lower GHG emissions than fossil fuels [37,38], environmental groups, media and some researchers have raised major concerns regarding the magnitude of direct and indirect land-use change (LUC) that the production of biofuel feedstocks may generate at the global scale, as well as the risks of degradation of land, forests, water resources and ecosystems [39,40,41]. Some of these issues could be instead addressed by using second- and third-generation feedstocks (lignocellulosic residues) [42].

1.3. Soy-Based Food Products for Direct Human Nutrition

Soybeans are rich in protein and oil content, the latter accounting for about 60% of dry soybeans by weight. The remainder consists of 35% carbohydrates and about 5% ash. Many valuable vitamins, minerals (5%), flavonoids, and polysaccharides are also contained in soybeans [43]. The high soy protein content makes soybeans an excellent source of complete proteins, with significant amounts of the essential amino acids that cannot be synthesized by the human body. As mentioned above, one-fifth of world’s soy is used for direct (i.e., not through meat and dairy) human consumption [8]. Most of this soy is first processed into soybean oil. Other typical soy products such as tofu, soy milk, tempeh and edamame beans account for about 7% of global food demand [8].
The soybean crush yields about 80% soybean meal and 20% soybean oil, which may be further processed into various food and non-food products. A succession of treatments (dehulling, flaking, etc.) permits one to properly weaken or break the cell walls and to shape the material in order to optimize the solvent access and maximize the oil extraction yield. Seeds containing high amounts of oil are generally first mechanically pressed to extract a portion of crude oil (pre-pressing); the press cake is then subjected to solvent extraction. While husks are processed to create fiber additives for bread, cereals, snacks and livestock feed, raw oil is refined to produce cooking oil, margarine and pastry fat. From a nutritional point of view, 100 g of soybean oil provides about 900 calories in the form of lipids and, more precisely, 16 g of monounsaturated fatty acids (MUFA) and 58 g of polyunsaturated fatty acids (PUFA), of which the predominant PUFA (51.36 g) is linoleic acid (LA), and to a lesser extent, (7.6 g) α-linolenic acid (ALA).
Traditional soy foods are usually divided into two groups: fermented products such as miso, soy sauce, tempeh, and natto [44], and non-fermented products such as tofu and soymilk. The fermentation of cooked soybean with bacteria (Bacillus spp.) and fungi (Aspergillus spp. and Rhizopus spp.) produces a variety of novel compounds, most of which possess health benefits, such as serum cholesterol-lowering, anti-diabetic, anti-hypertensive, anti-cardiovascular, and anti-neuroinflammatory effects [45]. During the fermentation process, the enzymes produced by the beneficial bacteria and other microbes break down, or predigest, the specific complex carbohydrates (sugars) found in soy and most other legumes. This process also makes the proteins more digestible and easier to assimilate than those in the untreated soybean [45,46].
Among the many soybean products, soymilk and tofu (soybean curd) are the most popularly consumed soy food items [47]. In 2018, it was estimated that the value of the global tofu market was about $2.31 billion, and the annual product growth rate (CAGR) was projected to increase by about 5.2% from 2019 to 2025 [48]. Tofu and dried bean curd are typical protein-based foods that can be used to produce many other types of soy products. Tofu is made by coagulating soymilk to create curds. The curds are then pressed and compacted into the gelatinous white blocks recognized as tofu. Tofu, together with its fibrous byproduct, okara, as well as the soybeans used in their manufacture, are naturally gluten-free, low in calories, high in protein and contain a good quantity of iron.
The major factor credited for the growing demand for tofu is its predominant use as a high protein source and vegetarian alternative to meat and dairy products. Tofu is incorporated in the preparation of a variety of foods such as burgers, hot dogs, sauces, ice creams, shakes, and desserts, among others. Recent consumer trends suggest a shift in dietary preferences in Europe and other developed countries toward plant-based protein products as a meat substitute, given the increasing concerns by individuals and governments over the environmental and health impacts of producing and consuming animal meat [49].
Besides the dietary and environmental benefits gained by avoiding meat-based products, additional advantages could be obtained by using by-products from the tofu production process; for example, soy hulls can be employed to produce bioplastics, which represent an alternative material to petroleum-based plastics [50,51]. Further, (i) soy is an excellent bio-based substrate for packaging material; (ii) soy straw can be used as fodder for livestock farms [52]. Okara, a co-product of soymilk production, rich in proteins, lipids, isoflavones, dietary fibers and minerals, as well as unspecified monosaccharides and oligosaccharides, lends itself as a base foodstuff for the production of many other soy-based protein products and has important properties as an antioxidant and, above all, a hypocholesterolemic agent, as its elements greatly help human cholesterol metabolism [53]. Okara could also be a good dietary supplement for weight loss, as it reduces plasma lipid levels [54,55]. The use of this co-product as food integrator can also ensure primary prevention of cardiovascular disease (CVD) risk factors, especially if it is supplemented in combination with fermentative bacteria such as Lactobacillus acidophilus, Bifidobacterium animalis subsp. Lactis and Streptococcus thermophilus. This, in fact, resulted in a significant reduction in LDL levels (approximately 10.3%) and the LDL-HDL ratio (approximately 11.6%) in all subjects involved in the experiment who consumed this product for the required time [56].

1.4. Objectives of the Present Research

The goal of this research was, firstly, to provide an overview of the environmental impacts of tofu production from soybean cropping and processing, as well as the impacts of its main co-products (soy milk, food integrators, etc.) and by-products (straw, hulls, etc.), in order to identify potential improvements over the whole production chain, also suggesting a circular economy framework based on renewable energy use and recovery of residues; and secondly, to compare the impacts of tofu production with those of other traditional sources of proteins (e.g., livestock meat). In particular, Section 2 (Materials and Methods) describes the investigated system and the method used for the impact assessment. Section 3 (Results) provides the main LCA results of each step and the final results of the entire process. Section 4 (Discussion) stresses the meaning of the achieved results and their potential improvement. Finally, Section 5 (Conclusions) highlights the novelty and the value of this study from the perspective of future research. Appendix A at the end of this paper provides a number of tables and diagrams related to each process step, in order to allow the interested reader to examine all of the calculations performed and data used.

2. Materials and Methods

The “Tigusto SA Company” (SA—Société Anonyme, Public Limited Company, Cugnasco, Switzerland), the agro-industrial enterprise where the study was carried out, is located in Gerre di Sotto, Cugnasco-Locarno (Ticino, Switzerland). Its activities are mainly focused in soybean production and manufactured products (soymilk, tofu, by-products and co-products). The study aimed at establishing the sustainability of the whole process from an environmental point of view and identifying and proposing improvements that may significantly decrease the environmental impacts. Tigusto-SA is a cooperative enterprise among small agricultural producers using crop products as raw materials and a corporate artisan manufacturing company (https://www.tigusto.ch/; accessed on 30 March 2023; https://yellowpages.swiss/location.cfm?key=1711877&company=tigusto-SA&art=HRB; accessed on 30 March 2023) [57,58].

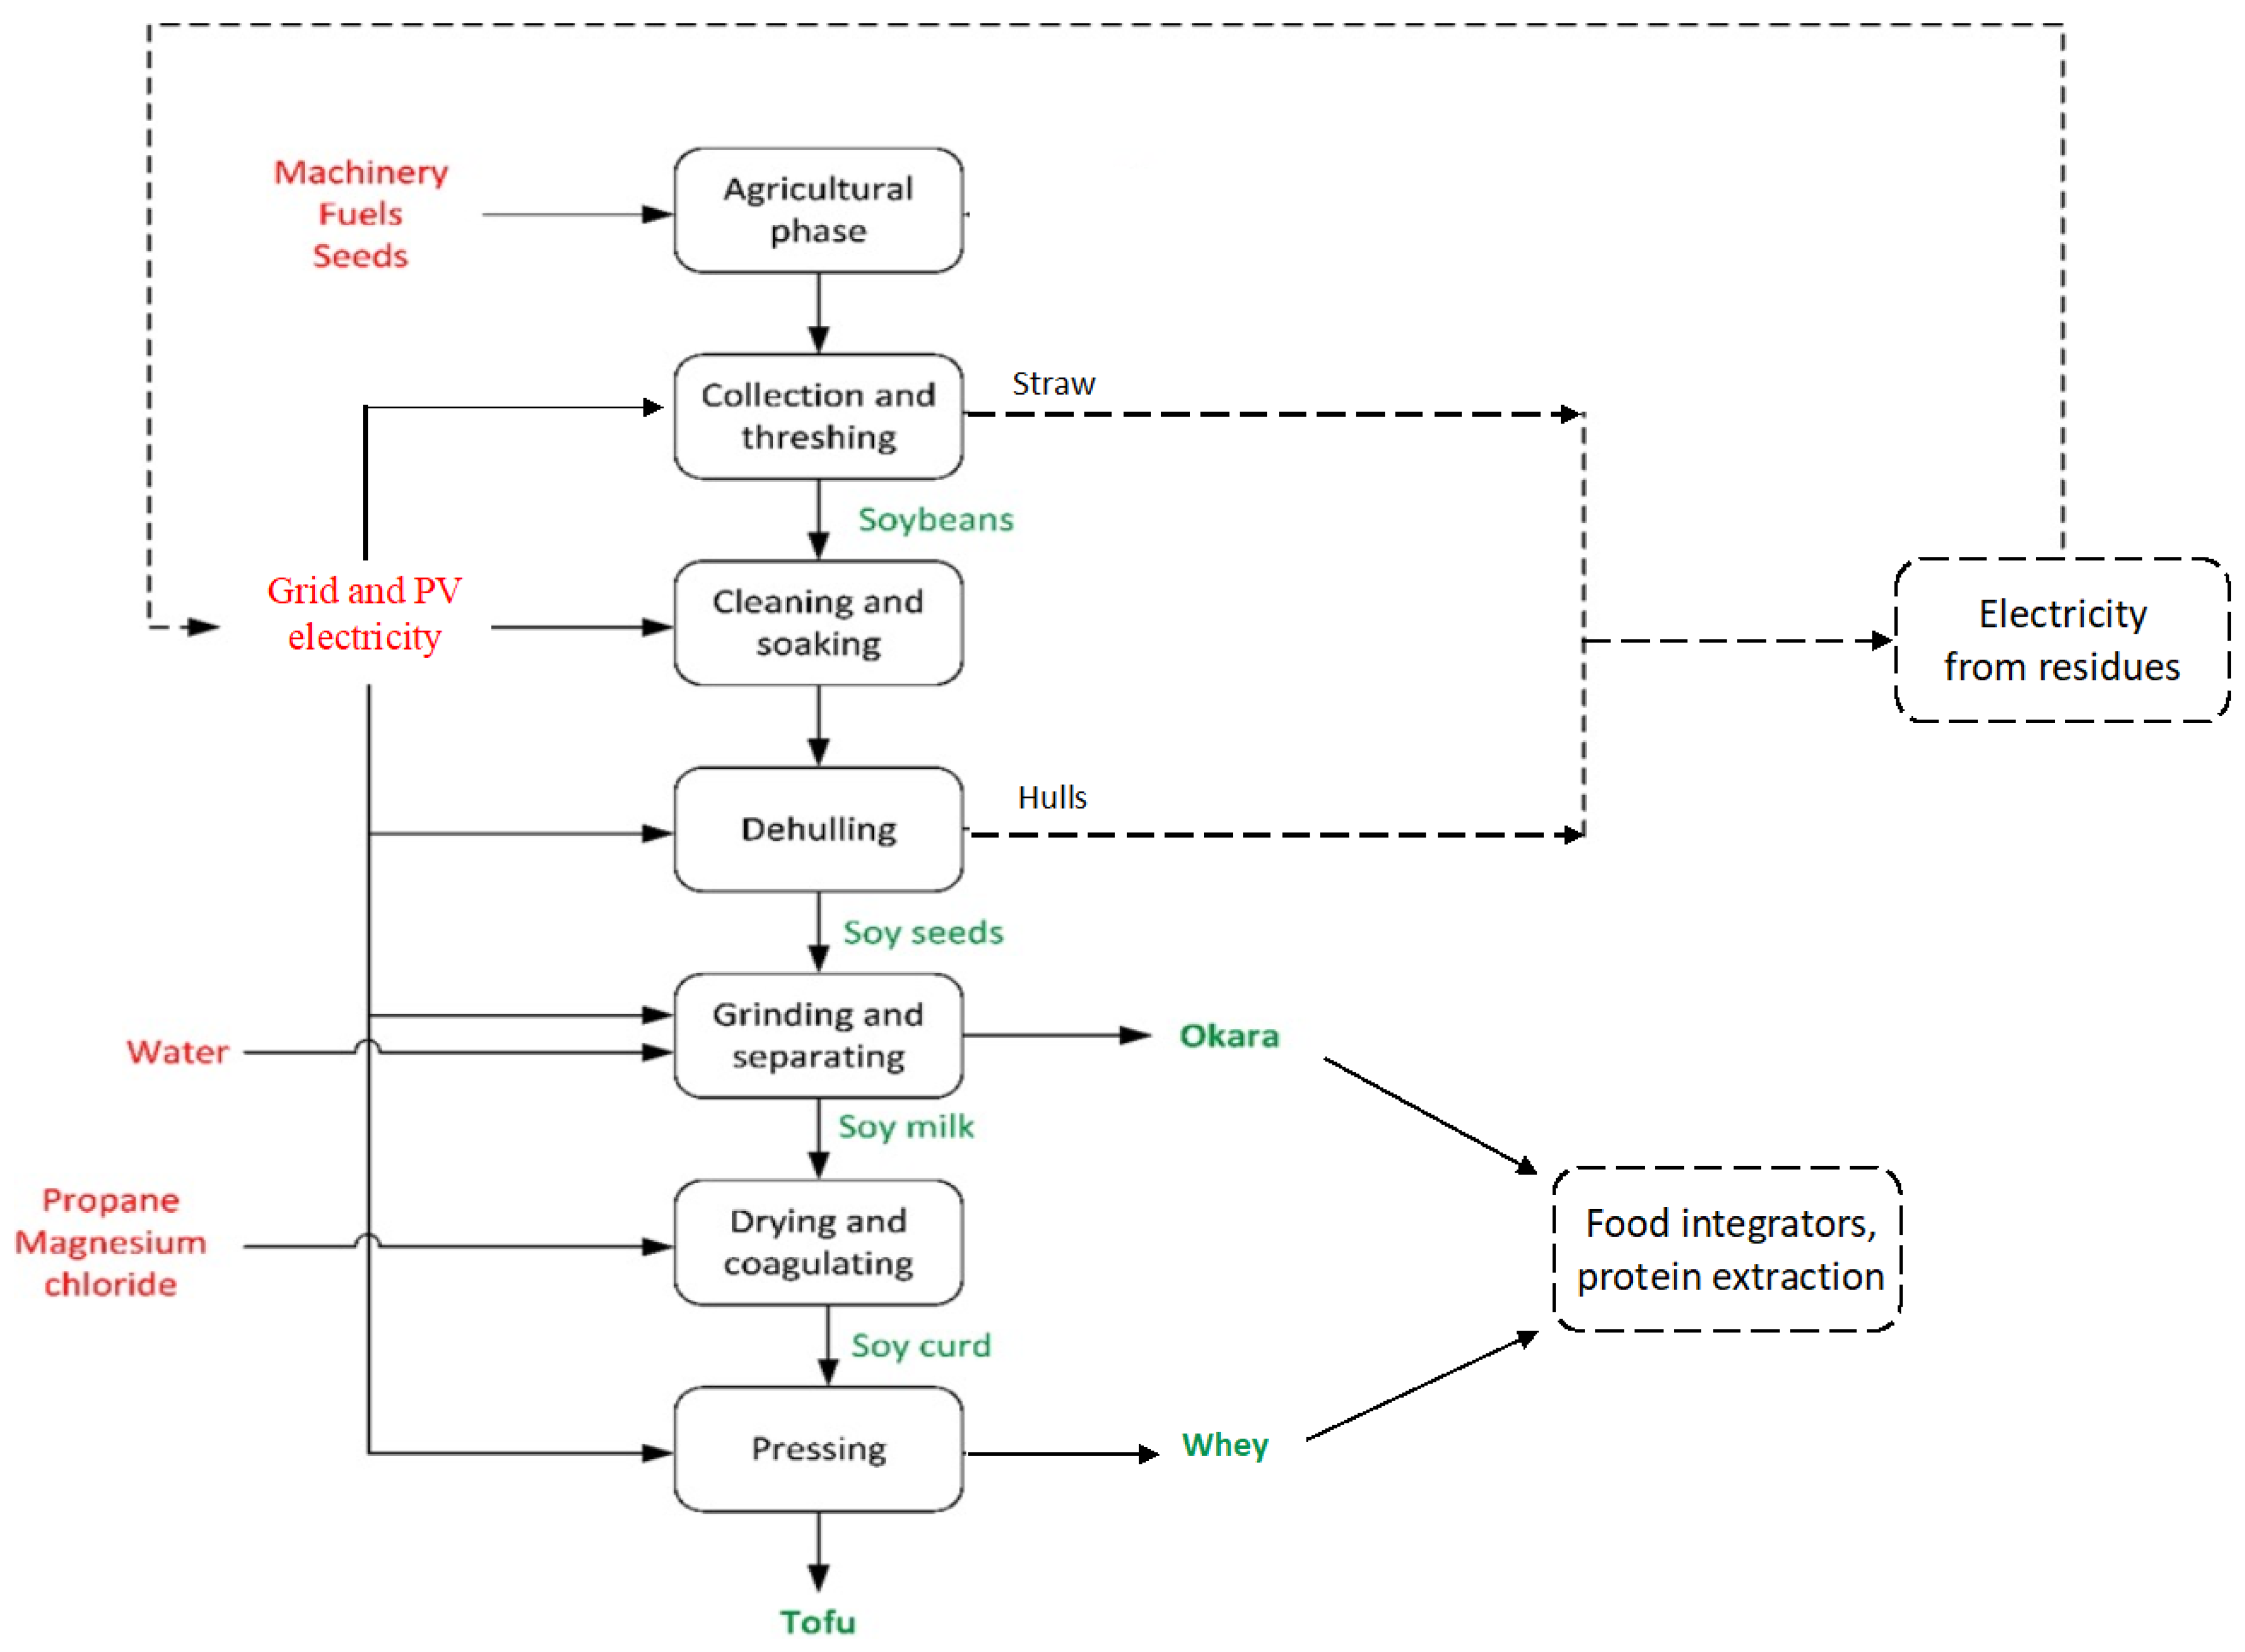
2.1. The Tigusto SA Farming and Manufacturing System

Production activities of Tigusto Company, are carried out under a strong commitment to ethical business and sustainable practices to minimize the environmental impact of its operations. In fact, this cooperative is characterized by having experimented, over time, with organic production processes for soy and other vegetable foods without any type of additive or chemical pesticides, even those authorized by law; therefore, the term “organic soy”, in this specific case, must be understood as “soy being completely free of pesticides and toxic elements”, which are instead most often widely used in conventional production systems [59]. Among other principles, the Tigusto Company refuses the use of GMOs and is inspired by circular economy principles: in particular, preventive designs for waste minimization and increased sustainability, the use of recyclable packaging, electric vehicles, and biodegradable cleaning products for offices and laboratories, self-production of photovoltaic electricity (covering about 80% of the company’s annual consumption), and finally, environmental certifications. These are some of the initiatives voluntarily adopted by the company [57]. Tigusto SA is, in fact, certified under several certification schemes, all aimed at supporting organic farming practices, among which the most recognized one is the certification given by Bio-Inspecta, a certification company involved in (i) the recognized control and certification of organic products and branded products, (ii) fulfillment of ISO standards and (iii) food safety regulations [60]. The marketed products are all based only on organic agricultural materials, entirely produced (sowing, cultivation and processing) in Ticino, a canton of Southern Switzerland, by Tigusto SA associated farmers. In recent years, the company expanded its market beyond tofu production by providing a wide range of soy and non-soy products such as seitan, tomato puree, several food sauces, amaretti with chestnuts, honey cream and hazelnuts, polenta flours, as well as morsels and soy granules.
The tofu production process is implemented according to the following steps (Figure 1):
  • Agricultural phase: 15,000 kg of raw soy are grown every year, on approximately 6 hectares of non-irrigated arable land. The threshed and collected soybeans are then dried and transported in large bags to the manufacturing company by small vans.
  • Cleaning, soaking and dehulling: soy seeds are cleaned and then soaked for about 24 h (using large tanks filled with about 15,000 L of cold water) and dehulled. After soaking, the weight of the original soybeans doubles. Dehullers use soft, rotating rubber rollers to remove the hulls.
  • Soymilk production phase: dehulled beans are ground in hot water to obtain milk. Then, 150,000 L of soy milk are boiled with the aid of a propane gas boiler (about 2500 L of liquid gas). Subsequently, soy milk is separated (double hot filtration) from the solid soy pulp or fibers, also known as okara, which is the solid residue of soy milk remaining after filtering the milk after cooling.
  • Tofu production: the soy milk is heated in an autoclave, then the treatment continues with the curdling, adding 750 kg of coagulant (magnesium chloride combined with calcium chloride, so-called “nigari salts”), previously diluted in hot water. Afterwards, the soy curd is pressed to release the excess liquid (whey permeate) using cheese cloth or muslin. The tofu is then placed inside molds covered with cloth sheets where it is pressed with the use of a manually adjusted press. Then, the tofu is removed from the molds to be cut into the desired shape, and finally immersed in a large tub filled with cold water to allow for an immediate first cooling. Afterwards, the tofu is packed in plastic containers and stored in a vacuum.
  • The option of replacing grid electricity with electricity from agricultural residues will also be explored in this study, although it has not yet been implemented in the Tigusto Company.
Figure 1. Diagram of soy and tofu production based on grid and photovoltaic electricity. Rectangular boxes represent the different stages of the process. Inputs (chemicals, fuels, energy) are colored in red, and outputs (tofu, okara, whey) in green. Potentially circular pathways (electricity from agricultural residues) are depicted as dotted lines.
Environments 10 00073 g001

2.2. Methods

In this study, the analysis of the environmental impacts of a tofu company located in Switzerland were carried out by means of the life cycle assessment (LCA) approach, a well-recognized methodology for analyzing and assessing the environmental loads and potential environmental impacts of a material, product or service throughout its entire life cycle, from raw materials extraction and processing, through manufacturing, transport, and use, to final disposal [61]. The methodologies for LCA are defined by the International Organization for Standardization (ISO) 14040 series. LCA encompasses four phases: (1) goal and scope definition, (2) life cycle inventory analysis (LCI), (3) life cycle impact assessment (LCIA), and (4) interpretation of the results [62,63].

2.2.1. Goal and Scope

The study aimed at understanding the impacts of the production of intermediate and final products of the soybean-to-tofu supply chain, including the main by-products and co-products. In addition to the analysis of the impacts of each individual process step, circularity scenarios were also envisaged, i.e., scenarios that assess the potential contribution of the circular economy concepts and practices to the valorization of process waste and residues and the reduction of impacts generated. In particular, the residues produced by the agricultural and soybean hulling phase, i.e., straw and hulls—may be used to produce electricity. This type of electricity is expected to be much cleaner than the grid electricity, as we will examine in the rest of this study, and potentially useful to cover the residual electricity needs (20%) of the company, integrating with the already implemented photovoltaic production. The main LCA methodological choices are described in the following, in particular the definition of the functional unit, the identification of the system boundaries, and the identification of the allocation procedures [63].
LCA results are usually expressed with reference to a functional unit (FU). The functional unit is not (but in some cases can be) the product of a process; instead, it is the service provided (e.g., a unit amount of raw or manufactured food on the shelf of a store, or a number of cooked dishes served per unit time in a restaurant, or a given amount of apples packed and carried from the farm to the grocery store or from the grocery store to the house of the customer). In general, the FU was not the product as such, but the product in a given condition, including transport, packaging, treatment, etc. In our case, the chosen FU was firstly the total yearly production of soybean and tofu within the company (25,000 kg of packaged tofu, obtained from the cultivation and processing of 15,000 kg of organic soybeans), and secondly,1 kg or L of each intermediate and final product, in order to make easier the comparison with other studies. The chosen LCA boundary was from the cradle (i.e., soybean farm) to the factory exit gate (i.e., post-packaging), as it included the procurement of raw materials, transport, production, and packaging of the finished product. Transport to the store and from the store to the household was not included, due to the variety of possible destinations. The system boundary of tofu production covered all of the stages described in the diagram in Figure 1.

2.2.2. Life Cycle Inventory (LCI)

The life cycle inventory (LCI) involves the data collection and the calculation procedure for the quantification of inputs and outputs of the studied system. This is a crucial step, since the quality of the whole study depends on the representativeness, consistency, accuracy, and geographical specifications of the data collected, in accordance with the ISO 14040 standards. In our case, original production data for a period of 1 year were obtained from the company. The inventory included resource inputs required to produce and package tofu: soybeans, water, electricity, natural gas, transportation, and packaging materials. Foreground data, i.e., specific information about material and energy flows related to the processes themselves, were provided by the company, while, for background data, the database Ecoinvent 3.1, which includes average market data for most existing materials and energy supply processes and/or services, was selected [64]. Moreover, some cut-off criteria referring to the omission of non-relevant life cycle stages, activity types, specific processes, and products, were applied. Fertilizers, insecticides and pesticides were not included in the Tigusto process assessment, as the company declares that it does not use them. Seeds are purchased by all farmers already inoculated with small doses of nitrogen-fixing bacteria, the environmental impact of which can be considered negligible; also, the main machinery used in the facility, such as stone mill, large tanks, autoclave, press, vacuum machine, blast chillers, cold rooms, etc., were excluded, as it was assumed that their use is continuous (and lasting many years) and their contribution to the single process is negligible. The analysis focused mostly on the tofu production process steps, where most impacts are detected. The machinery fuel used in transport from the agricultural field to the company and the photovoltaic energy to replace grid electricity as well as the product packaging materials were also included.
As previously highlighted, tofu production involves an array of products and co-products, so the environmental impacts of intermediate and final processes should be allocated to the different product systems involved. Allocation is a key methodological issue in LCA and, in general, it is defined as: partitioning the input and/or output flows of a process to the product system under study [65]. In practical terms, allocation is a division of the environmental impacts according to how much the products cost/weigh/provide. Avoidance of allocation by splitting the processes and system expansion, or the avoided product approach, was deemed to be not easily feasible in this study [64].
For the present analysis, an exergetic allocation was carried out, i.e., based on the exergy content of each co-product flow in each step. This form of allocation assigns the impacts to the co-products involved based on their actual exergy (usefulness to drive a physical or chemical transformation of the feedstock). Exergy (generally named B) is in fact also defined as “work potential” and measured in kJ (J) according to the following equation: Exergy = Enthalpy − Anergy (the part of degraded energy that can no longer be used):
ΔB = ΔH − TΔS
where Δ indicates the variations occurring in the process, H indicates the enthalpy of the energy source (fuel), T is the Kelvin temperature, and S the entropy [66].
Exergy can be defined as the share of an energy resource that can be converted to useful work in a thermodynamically reversible process. In practice, it is a concept that allows us to evaluate the amount of energy used and its ability to drive changes in the process. As can be seen in the inventory Table A1, Table A2 and Table A3 (Appendix A), a number of co-products were generated within the process, namely straw, hulls, whey and okara, to which inflows and outflows were allocated according to their exergy fractions (Table 1) [66,67]. This allocation was performed by calculating the exergy of the various co-products based on the exergy of their components (i.e., carbs, fat, protein). Then, the allocation fraction was calculated as the percentage of the exergy content of one of the co-products compared with the total exergy of all co-products of any analyzed process phase.
The allocation of impacts to co-products decreases to some extent the environmental load attributable to the main products in each step and, of course, to the final product (i.e., the produced tofu). Appendix A provides tables and footnotes describing in detail the energy and material flows of soybean agricultural cultivation, transport, extraction and conversion of soybeans into tofu, with calculation procedures and references for the inputs used in each processing phase. In some cases in the literature, used for comparison, inventories are not shown, being available in the quoted literature.

2.2.3. Life Cycle Impact Assessment (LCIA)

In the life cycle impact assessment (LCIA) phase, LCI data are associated with environmental impact categories and indicators. LCIA was performed by means of the LCA software OpenLCA 1.10.3. The impact assessment was performed by means of one of the most recent and up to date LCA methods, the ReCiPe 2016 Midpoint (H) [68]. The application of the ReCiPe Midpoint (H) method makes it possible to assess medium-term effects, i.e., those impact categories that are closer to the actual or expected environmental dynamics (e.g., global warming potential, acidification potential, etc.), as they are more problem-oriented rather than damage-oriented. The 2016 ReCiPe Midpoint (H) focuses on a hierarchical (H) approach, an intermediate viewpoint between the individualist and egalitarian approaches, in that it considers both the effects in the shortest time period (individualist approach) and the possible effects that may impact future generations (egalitarian approach) [68,69]. The ReCiPe method provides characterization factors to quantify the contribution of processes to each impact category (impacts are expressed by specific units for each category and cannot be added) and normalization factors to allow a comparison across categories (Europe ReCiPe Midpoint H, 2000, revised 2010). Normalization is a life cycle impact assessment tool used to convert characterized impact indicators in a way that allows comparison among impact categories. This procedure normalizes the characterized results by comparing them to selected reference values for a given year and location. The LCA impact categories explored in this study are listed in Table 2.

2.3. The Circular Economy Framework

All co-products and by-products of the investigated Tigusto SA process (as a whole and step-by-step) can be further processed and reentered into the market in a circular perspective (circular scenario). The circular economy concept has been recognized recently as an economic model to prevent waste production and excess use of virgin materials. The circular economy aims to keep products, materials, equipment and infrastructure in use for a longer time, thus improving the productivity of these resources. Waste materials and energy should become inputs for other processes through waste valorization: either as a component for another industrial process or as regenerative resources for nature (e.g., compost). The implementation of CE may, therefore, limit the extraction of raw materials and the production of waste [70]. Dotted lines in the diagram about tofu’s production above (Figure 1) depict circular pathways that were also assessed in our LCA:
-
Okara can be used either as a feed for livestock or as an integral element to produce soy-based foods;
-
Hulls and straw can be burned in small high-efficiency cogeneration boilers to generate thermal and electrical energy, for self-consumption within the company, according to [71,72,73,74];
-
Whey (soy permeate) can be used as a food integrator (protein source), as considered in this study. It could also be used as feedstock to produce biogas and digestate. The latter would be useful as fertilizer in the agricultural step, while biogas could be further processed for electricity generation.
Okara and whey are already products as such, ready for the food market, while straw and hulls represent waste that, if not (circularly) processed, can cause additional environmental impacts. Therefore, implementing circular pathways can represent an opportunity to avoid the environmental burdens of waste management and primary resources demand. In this study, straw and hulls were converted to electricity via a thermal process.
Circular production of electricity was assessed in this study as a potential opportunity to manage Tigusto SA waste and residues in a safer and more environmentally friendly way, in order to decrease the demand for primary resources. The possibility of obtaining clean electricity from soy straw and hulls combustion was emphasized, because it may enable several companies to stop using energy sources that are less convenient in terms of costs and emissions. Co-products okara and whey can also be considered “circular” products, because they allow the replacement of other food items at the larger scale of the human food chain, thus preventing additional processes and resource use. The interested reader can find further details about the circular economy in the following articles [75,76,77,78,79].

3. Results

The present Results section firstly presents the full environmental assessment of the Tigusto Company to identify its most impacting steps. Then, the comparison with conventional tofu production and other protein sources is shown. Finally, results from the implementation of circular options are also shown.

3.1. Assessing Environmental Impacts of Company’s Annual Production as Well as of Unit Step-by-Step Products (Soybeans-Soymilk-Tofu)

Based on the inventories of the production processes and process steps investigated in the Tigusto Company (Table A1, Table A2 and Table A3, see Appendix A), a full assessment was carried out, with the aim of highlighting the extent of the environmental impacts generated as a follow-up of the consumption of resources as well as the airborne and waterborne emissions, from raw soybean cropping to the final tofu production. Characterized results listed in Table 3 provide impact values for tofu production at the whole farm level through different units. As mentioned in the previous Materials and Methods section, the use of different units did not allow results associated with the different impact categories to be compared or added. However, each category result could be compared to results in the same category of other production processes or in the same process in previous years, to identify better performances or crucial steps needing improvement actions.
To overcome the problem of comparison among categories, the LCA can apply a “normalization” procedure, described in the Materials and Methods section, where all characterized values are converted into standardized and comparable values by means of normalization factors referring to specific areas and years. However, the normalization step is an optional step, due to the subjectivity and uncertainty of some normalization factors, according to the LCA-related regulatory standards (ISO 14040 and 14044). In this study, we performed a normalization step by means of the 2010 global normalization factors (H), converting Table 3 characterized values into the normalized values reported in Table A4, Appendix A. This Table also shows the normalized values of the step-by-step soybeans to soymilk to tofu production chain. These normalized impacts allowed a comparison among categories, with the highest values for the final tofu produced being marine ecotoxicity (METP, 1.17 × 10³), freshwater ecotoxicity (FETP, 7.52 × 10²), human carcinogenic toxicity (HCTP, 1.58 × 10²), human non-carcinogenic toxicity (HNTP, 9.19 × 101) and terrestrial ecotoxicity (TETP, 8.61 × 101). The presence of non-negligible toxicity impacts can be partially attributed to the use of multi-crystalline photovoltaic electricity (mining and processing of several minerals to produce the PV modules). The presence of ionizing radiation impacts derives from partial use of grid electricity, which in Switzerland is also based on nuclear plants. Other impacts derive, as usually in agricultural and industrial processes, from machinery and other resource uses.
Focusing on Figure 2, we can easily appreciate the percentages of the different characterized contributions to each impact category, provided by inflows during the three investigated phases. The dominant contribution in many impact categories mainly came from the use of photovoltaic electricity (average 29.92%) and agricultural management and transport (average 25.51%), due to the fuel used for machinery, followed by grid electricity and low-density polyethylene (LDPE) used for packaging, with average values of 7.31%% and 3.53% respectively. A much smaller contribution was provided by propane and water use, whose average values were 0.09% and 0.001%, respectively, so they are hardly visible in the diagram.
Results of the whole farm activity could be recalculated and presented with reference to different functional units for the three investigated phases of the process (i.e., 1 kg of soybeans, 1 L of soymilk and 1 kg of tofu instead of the annual production of the whole farm), in order to allow an easier comparison with other case studies in the literature, most often presented with 1 kg or 1 L functional units. The characterized ReCiPe midpoint impacts relative to each process step are shown in Table 4. Instead, normalized values are listed in Table A5, Appendix A.
All values were calculated according to the allocation procedure described in Section 2.2.2. The step-by-step allocation of impacts does not only provide the final characterized results associated with the main products of each phase, as listed in Table 4, but also allows calculation of the impacts allocated to co-products, i.e., hulls, straw, okara and tofu whey, as shown in Table 5. This means that, if co-products are used instead of being wasted and some impacts are associated with them according to their exergy (i.e., to their potential usefulness in the economy), it is possible to assign lower impacts to the main products, which become more “environmentally competitive”. Further, if by-products or co-products are used within the company according to a circular pattern (e.g., for replacement of fossil-based fertilizers or energy), their impacts can be compared with the impacts of the replaced items. In the following sections of this paper, straw and hulls were considered as potential substrates for thermal electricity production, instead of fossil fuels. The calculation procedure also included the impacts allocated to these items and converted them into impacts of the generated electricity. Instead, okara and whey could be converted into food integrators, with their allocated impacts to be added to the final food items generated.

3.2. Comparison between Conventional and Organic Tofu: A Sensitivity Analysis

Results from Tigusto Company, concerning the whole production chain, including products as well as by-/co-products from each process step, were compared with average conventional production and processing techniques from selected works in the literature [63,80], always adjusted to a functional unit of 25,000 kg/yr of produced tofu, as in Tigusto Company. Comparing the results of the two assessments (based on organic Tigusto SA and average Switzerland conventional production) offered the possibility of verifying the investigated case study with the larger performance of the country. A similar comparison can be performed with other results available in the database Ecoinvent 3.1, for average performance of Europe and average worldwide performance [63]. Of course, calculations were based on different inventories, applying the same analytical procedures, functional units, and system boundaries. Such comparison aims at providing a sensitivity analysis of the investigated process, to serve as a basis for suggestions for potential improvements. While the inventory for the Tigusto Company is listed in Table A1, Table A2 and Table A3, as previously mentioned, the inventory for average conventional production is taken from the quoted literature. In the conventional agricultural production phase for soybeans, both pesticides and fertilizers were included, and the electricity was produced from fossil fuels; in the second phase, i.e., production of soymilk, conventional soybeans and fossil electricity were used; finally, for tofu production, the soymilk produced in the previous phase was treated by using electricity from the Swiss national network. Since soybean is a nitrogen-fixer, fertilization was exclusively by application of potassium (as K2O), phosphorus (as P2O5) and other inflows (such as irrigation, green manure, pesticides, solid manure, etc.) whose values were obtained from the Ecoinvent database [63]. The comparison of characterized impacts for conventional and organic tofu production is shown in Table 6 (higher impacts in bold font), while, the comparison of normalized impacts is shown in Table A6, confirming that the use of fertilizers and chemicals as well as fossil electricity may generate non-negligible environmental disadvantages in several categories, such as in ionizing radiation (IRP), marine eutrophication (MEP) and stratospheric ozone depletion (ODP). However, a problem remained regarding how to manage a few impact categories of the investigated organic tofu production in the Tigusto process, for which an increase in impacts still occurred (e.g., three toxicity categories and mineral resource scarcity, likely due to minerals and metals used in current PV module production, as well as fossil resource scarcity and global warming potential impacts, due to the fraction of grid electricity still used). It might be more sustainable to replace the electricity from traditional silicon photovoltaic modules with new-generation photovoltaics (for example, perovskite PV, [80,81]), which may guarantee much higher electricity production (conversion efficiency of 15% instead of 10%) and therefore, proportionally lower impacts. Further, the company may try to use electricity from other sources (e.g.,: wind or hydro), or electrical self-production from agricultural and process residues, as suggested later in this study, within a circular framework, to replace grid electricity. It is worth noting that the toxicity impacts due to photovoltaic electricity (both PV module materials and the still low efficiency of modules) call for improved photovoltaics but have no direct consequences for the quality of the food produced.

3.3. Tofu vs. Meat: Comparison of Impacts, Based on Similar Protein Content

A growing number of studies suggest tofu to be competitive with meat products [82] in terms of environmental impacts. The large environmental load from beef meat production is mainly due to the large demand for agricultural resources, e.g., soil and groundwater (for example, 1 kg of beef may require up to 15,000 L of water [83], although in the cases in the literature investigated in this study, water demand was “only” about 3800 L (Table A7, Appendix A). The main problems are likely represented by the limited efficiency of livestock to convert biomass into proteins compared to soy and other animal species (e.g., snails, fishes and—in some cases—insects) and by the large amounts of emissions associated with livestock feed production and metabolism [84,85,86,87,88,89,90,91]. We recently investigated fish food production in sustainable aquaculture with the implementation of circular patterns; the interested reader may refer to this study [92] for additional comparison. A more recent, although interesting, option, the so-called “cultivated meat” [93,94,95], is still in a research stage and could not be included in the present study due to lack of suitable production data. Comparing forage-based feeds with other inflows providing a higher protein content, the former emit more methane (CH4), while the latter can generate up to 33% nitrogen (N2O) emissions [89]. In this study, we compared three different kinds of protein-rich food (beef meat, snails, tofu), with the aim of understanding the environmental sustainability of different dietary behaviors. A functional unit equal to 1 kg of meat was selected, corresponding to about 22% of proteins by weight, and adopted as reference for the comparison. For tofu and snails, the functional units were adjusted to their nutritional value and protein content (13% for snails and 17.7% for tofu, according to [96,97]), yielding a final comparison of 1 kg of beef, 1.24 kg of organic tofu and 1.62 kg of snails. For the evaluation of the impacts of beef, an inventory table was extracted from Asem-Hiablie et al., 2019 [84]; for snail production, the inventory was taken from Zucaro et al., 2016 [96]. The LCA impacts were calculated in terms of the selected functional units, and the resulting characterized values are listed in more detail in Table A7, Appendix A. The latter Table shows that the three food alternatives perform very differently in each category and do not show the same behavior. Instead, for the sake of full comparison, Table 7 shows the normalized values, which can be added into a total. In the last line of Table 7, the totals of normalized values show that snail production is the less impacting process, followed by tofu, while meat production ranks third, 20.5 times more impacting than tofu and 63.4 times more impacting than snails. Tofu shows a global impact 3.09 times higher than that of snails.

3.4. Decreased Impacts from Feedback Processing of By-Products: A Potential Circular Economy Approach

The development of a circular scenario, based on the use and valorization of process residues, is aimed at proposing alternative solutions to ensure further improvement in the sustainability of organic tofu production, which was among the main objectives of this work. The improvement is based on the use of selected co-products and by-products in order to obtain more sustainable alternative energy sources, fertilizers, and biochemicals. The goal is the integration (or maybe partial replacement) of the already available photovoltaic energy sources with additional electricity generated by the combustion of hulls and straw, in order to replace fossil-based electricity in the grid. As mentioned above, okara (co-product of soymilk) and whey (co-product of tofu production) were not included in the production of energy because they already are finished products that can be placed as such directly in the market and sold as food integrators [88,89]. They were not further investigated in this study. Instead, the conversion of by-product straw and hulls into electricity was analyzed by applying the same LCA approach carried out for the tofu life cycle analysis. Therefore, an inventory table was constructed (Table A8, Appendix A) and characterized impacts compared with fossil and photovoltaic electricity are shown in Table 8 (lower impacts highlighted in italics; larger impacts in bold; regular font for intermediate results). Further, in order to fully understand the potential environmental benefits of such a choice, normalized impacts are shown also, in Table A9.
A new inventory table for circular organic tofu production, including self-generated electricity, can be seen in Appendix A, Table A10. All final characterized impacts assessed in the circularly improved organic tofu production cycle, which also included impacts obtained from the in-house production of electricity from agricultural waste, are reported in Table 9 and diagrammed in Figure A1, Appendix A. The comparison of the resulting impacts assessed for the three types of tofu production showed that the circular waste-electricity organic production pattern has potential to provide very satisfactory results (circular scenario), with lower impacts (shown in italics) in 17 out of 18 impact categories (only TETP showed an intermediate result). Normalized results shown in Table 10 still confirmed the same performance. Results from conventional tofu production showed 14 categories with higher impacts (bold font). Results from PV-electricity organic production showed the worst performance in four impact categories (bold), as expected. The last line of normalized Table 10 shows the best total impact from circular production and the worst performance from PV-based production, although very similar to the conventional one, as already mentioned, due to the FETP, METP and TETP categories. The PV-based case clearly shows that the focus on decreasing fossil fuel use and GWP did reach the planned goal, but still needs a technological PV improvements to lower a few toxicity impacts.

4. Discussion

The results of this research were very diverse and require a careful evaluation and discussion. The study was divided in three main parts:
(a)
Assessment of soybeans-to-tofu organic production at the Tigusto Company, Switzerland, with a focus on the different phases, identification of the most impacting inflows to the process, and allocation of impacts to main products and by/co-products over the production chain;
(b)
Comparison of impacts of tofu and other sources of proteins (livestock meat and snails), on the basis of similar protein amounts;
(c)
Assessment of circular opportunities to decrease resource demand and impacts over the production process: (i) assessment of LCA impacts of electricity production from tofu wastes and comparison with impacts from photovoltaic and grid electricity; (ii) comparison of conventional (grid-electricity), Tigusto organic (PV-electricity) and circular organic (waste-electricity) tofu production.
The assessments first related calculations of impacts to the size of the whole Tigusto Company: 15,000 kg soybeans produced, converted to 150,000 L of soymilk due to a proportional addition of water in the process, and finally to 25,000 kg of tofu, together with a set of by- and co-products. Secondly, smaller and more practical functional units were also used: 1 kg of soybeans originating 10 L of soymilk, and that 10 L of soymilk converted to 1.66 kg of tofu. As a consequence, the selected functional units (whole amounts at farm scale and unit amounts at usual market scale) required careful comparison over the step-by-step characterized and normalized values, for a full understanding of the actual growth of impacts.

4.1. Soybeans-to-Tofu Organic Production at the Tigusto Company

Figure 2 clearly depicts the heavy contribution of electricity (photovoltaic and grid) as well as agricultural management to the whole process. Agricultural management still uses fossil fuels for soil tillage and transport of commodities, mainly contributing to fossil resource depletion, global warming, and particulate matter emissions; photovoltaic electricity generates high toxicity levels from mineral extraction and industrial processing, while grid electricity still contributes to global warming and fossil resource depletion. Undoubtedly, although Tigusto organic production prevents direct damages associated with food intake thanks to the avoidance of chemical fertilizers and pesticides, large scale impacts still exist, as decreased fossil fuel use unfortunately was replaced by not yet efficient PV-electricity plants with larger toxicological impacts, thus shifting instead of decreasing the burden. Both fossil and photovoltaic electricity require efficiency increases and less impactful processes (e.g., less and better fossil resources, replacement with biogas and hydrogen when possible, new typologies of photovoltaics instead of multi-crystalline modules). However, these results indicate a clear direction toward more efficient photovoltaics and production development independent of fossil fuels.
Assessing impacts of by-products and co-products (Table 5) allows their full and better use: okara and whey may replace other food components (integrators) [90], while hulls and straw may be converted to heat and electricity, thus favoring resource use and reduced impacts at local and larger scales.

4.2. Tofu vs. Meat

The large number of studies in the literature as well as claims about the huge resource cost of livestock meat consumption compared to other dietary habits seem to be confirmed by the normalized impacts in Table 7, where functional units have been selected in order to ensure the same amount of proteins and approximately similar amounts of other components. As is well known, normalization allows us to add the different impacts into a total that may provide an approximate assessment of the performance of each food typology. Comparison results in Table 7 confirm the findings of previous studies in the literature, suggesting that dietary habits be slowly transitioned to other kinds of protein foods (not necessarily those in Table 7 only). Nevertheless, meat shows very large impacts compared to tofu and snails. It may be time to start shifting dietary habits toward less impacting categories of animal proteins and the very diverse existing categories of vegetable proteins.
From a nutritional point of view, it has been observed that, based on the protein content alone, it takes about 1.24 kg of tofu to supply the 210 g of protein in 1 kg of meat, as 100 g of steak provides about 20.9 g of protein versus 17.3 g of protein in 100 g of tofu [97,98]. In a like manner, 1.62 kg of snails are needed to supply the protein content in 1 kg of meat. Of course, very likely more tofu and snails may be needed to meet other dietary needs that meat provides, such as, for example, the iron content or vitamin B, especially B12, of which meat is a rich source. In fact, 1 kg of beef steak provides about 19.50 mcg of vitamin B12 and 3.23 mg of Fe; tofu is deficient in vitamin B, but has 2.68 mg of Fe, a considerable amount that is not far from that present in meat [99,100]. Snail is also a good source of iron, excellent for fighting anemia, with an iron content between 5.75 to 26.6 mg (the latter as in the giant African snail Achatina fulica) [100]. Changes in dietary habits should integrate tofu with the same amount of vitamin B12 provided by meat. Traces of B12 may be present in soy milk (0.85 μg) or some fermented soy foods such as tempeh (0.08 μg), but the reported amounts are so low as to be considered virtually negligible [101,102]. Therefore, the present study should be followed by an appropriate assessment of the food alternatives that include all of the needed components in addition to proteins. This is a goal for future research.

4.3. Circular Opportunities in Tofu Production

The circular economy is becoming a very popular issue in economic and environmental studies and policies. This option does not only refer to recycling of resources (minerals, metals, paper, textiles) but also focuses on better process design and use of by-products within a process (e.g., combustion of straw and hulls for electricity in this study) or appropriate use of co-products in expanded boundary conditions (e.g., whey and okara used as food integrators). We accounted for the circularity of whey and okara simply by allocating to them a fraction of soybean and tofu production impacts and assuming they be used in other steps of the food chain, carrying lower impacts than other, traditional food items. Instead, the use of hulls and straw as substrates for thermal production of electricity offers a circular option to replace at least a fraction of photovoltaic or grid power. Table 8 shows very clearly that the three options (bio-electricity, fossil fuel-based electricity and PV electricity) carry pros and cons in terms of lower impacts (italic font) and higher impacts (bold font) or intermediate ones. Of course, font types do not fully express the actual magnitude of values (in some a way ignoring the existing ranges), so when characterized values in Table 9 are compared or normalized values in Table 10 are added into a total, it may be hard to properly account for the actual intensity of each value and compare correctly. An appropriate mix of sources (grid, biomass residues, PV power, and more) or a more efficient power production process may help decrease the excess toxicity of PV power or the greenhouse impacts of fossil fuels in the grid and transport, or finally, the impacts from bio-waste landfilling, in designing a new tofu production process characterized by a better power mix and a more appropriate use of this power for management, transport and tofu production. In this study, we did not manage to identify the appropriate mix, because it clearly depends on the local yields, the type of process and the uncertainty and variability of the different situations (e.g., land fertility, climate, water availability). However, Table 9 (characterized values) and Table 10 (normalized values) show that tofu production supported by the circular use of waste for electricity lowers most of its impacts by replacing fractions of PV and grid power with bio-residue-based electricity, while photovoltaic-based organic tofu production is not far from competing with conventional fossil fuel-based production, provided sun-to-electricity efficiency grows by a few percent, or bio-based PV technology fulfills current promises. If this happens, fossil fuels will no longer be a limiting factor and, at the same time, much less impacting production processes will develop.

4.4. Takeaway Lesson

Assessing the different steps of organic tofu production powered by PV electricity at the Tigusto Company (Switzerland) provided a large number of unexpected results. First of all, replacing grid electricity with photovoltaic electricity may be enough to definitely lower the impacts of PV-based production processes, provided more efficient and bio-based PV is realized and an appropriate PV/fossil power mix is identified. A similar problem occurs in the biomass-based and PV-based electricity mix, which still lowers the impacts of circular tofu production to a very competitive extent: in fact, in the specific soy-to-tofu supply chain, power from biomass is limited by the availability of lignocellulosic residues from the agricultural phase (unless other lignocellulosic matter is imported from outside, which was excluded in the present assessment to test the self-sufficiency of the system), which means that further improvements can only be achieved through innovative PV technologies (e.g., bio-photovoltaics [103,104], perovskite modules [75,80]).
Results show huge impacts from meat production and use, much more than from the tofu food chain. This means that, although efforts for better technology and energy sources are certainly appropriate, dietary diversity may also be part of the solution. Not only are impacts for production of meat extremely harmful, compared to those of tofu and snails (as appears evident from Table 7 and Table A7), but these results add to nutritional studies that confirm meat-related common diseases (e.g.,: type 2 diabetes, various forms of cancer, obesity, cardiovascular diseases [105,106]), thus suggesting that high consumption of livestock meat at the same time affects environmental integrity and human health. In contrast, the impacts of snail farming do not differ much from those of tofu, suggesting the possibility for the consumer to decrease their consumption of meat or to move toward more sustainable animal products, such as snails or even insects, both of which are considered healthier and higher in protein than beef by about one billion of world population [91,92]. Tofu, being a food that is high in nutritional value and, above all, low in fat and calories [98], may provide protection against the onset of cancer and obesity, high cholesterol levels, cardiovascular disease and hyperlipidemia [106]. This does not mean necessarily approaching a vegetarian or vegan world, but at least starting to consider dietary products that are less harmful to human health and the environment, to decrease as much as possible the consumption of intensively farmed beef. An ideal diet model, now widespread all over the world, is represented by the Mediterranean diet, which allows one to consume plant and animal foods in a much more balanced way, managing to limit the consumption of meat and to preserve human well-being [107].
Finally, the mentioned example of waste biomass use for power production within a circular economy perspective is only one of the potential alternatives for better use of by-products and co-products of agro-industrial processes. More research is still needed to identify new pathways and develop more efficient conversion processes capable of properly valuing co-products, waste and residues as well as decrease waste-to-landfill patterns and virgin resource demand. Once again, the issue is not to identify the magic bullet to solve any kind of problem, but instead to design an appropriate mix of dietary habits, resource and technology mixes and circular economy processes to decrease to the largest possible extent our load on nature and personal health.

5. Conclusions

The environmental performances of food alternatives dealt with in this study provided an interesting and complex picture of dietary impacts and potential changes, based on the life cycle assessment approach. This work showed that from the point of view of production, the benefits of processing by-products to generate energy were significant in terms of moving toward more sustainable methods of tofu production. From the a perspective of overall circularity, transitioning the entire tofu supply chain has led to further improvements in the entire system, from the use of resources to the use of water and energy, including the disposal of waste from the tofu production process. From an environmental point of view, in the context of protein sources use (meat, snails, tofu), this work showed very high resource demand by, and impact generation from, beef production, indicating that alternatives are needed. Snail breeding was also assessed and proved to be advantageous, with much lower environmental damage than cattle farming and, in some categories, even compared to tofu. Improving all of the investigated systems would require decreasing fossil-based agricultural management [108,109] and transport, improving power sources, and finally, a circular perspective capable of valuing residues and wastes, in addition to increasing efficiency. In conclusion, the solution cannot be found in the radical implementation of the “perfect” protein source, electricity source, or technological tool, but rather in a wise and complex production pattern capable of valorizing nutritional content, energy content, the availability and renewability of products, co-products and by-products, as well as dietary habits within a sustainability approach and circular economy perspective.

Author Contributions

Conceptualization, S.U. and M.C.; methodology, M.R., R.S. and S.U.; validation, R.S., M.R., S.U. and M.C.; investigation, M.C. and S.U.; writing—original draft preparation, M.C., M.R. and S.U.; writing—review and editing, M.R., M.C., R.S. and S.U.; supervision, S.U.; funding acquisition, R.S. and S.U. All authors have read and agreed to the published version of the manuscript.

Funding

S. Ulgiati and R. Santagata gratefully acknowledge the funding received from the EU H2020-MSCA-RISE-2018 programme for the project “Promoting Circular Economy in the Food Supply Chain (ProCEedS)” (Grant Number: 823967).

Conflicts of Interest

The Authors declare no conflict of interest.

Appendix A

Table A1. Inventory of Annual Soybean Production at Tigusto Company (F.U.: 15,000 kg soybeans).
Item UnitQuantity
Input
Soil occupation, arable, non-irrigated ha6
Sowing ha6
Soybean seeds, for sowing kg641.4
Ploughing ha6
Combine harvesting ha6
Polyethylene (two bags) kg250
Lorry diesel, 3.5–7.5 metric tons for transportkg × km6000
Lorry electric, 3.5–7.5 metric tons for transportkg × km3000
Photovoltaic electricity kWh10,800
Grid electricity kWh2700
Tap water L15,000
Output
Soybeans kg15,000
Straw kg15,000
Hulls kg1200
Table A2. Inventory of Annual Soymilk Production at Tigusto Company (F.U.: 150,000 L of soymilk).
Item UnitQuantity
Input
Tap water L187,500
Grid electricity kWh1900
Photovoltaic electricity kWh7600
Soybeans kg15,000
Gas propane L25,000
Output
Soymilk L150,000
Okara (protein food) kg24,000
Table A3. Inventory of Annual Tofu Production at Tigusto Company (F.U.: 25,000 kg tofu).
Item UnitQuantity
Input
Magnesium chloride kg750
Polyethylene for packaging kg1750
Gas propane L3500
Soymilk L150,000
Grid electricity kWh1000
Photovoltaic electricity kWh4000
Output
Tofu kg25,000
Heat MJ10,125
Whey of tofu kg3703.7
Table A4. Normalized ReCiPe Midpoint (H) impacts of global annual tofu production at Tigusto Company (inventories and total products from Table A1, Table A2 and Table A3; exergy allocation according to Table 1; F.U.: 15,000 kg of soybeans; 150,000 L of soymilk; 25,000 kg of organic tofu).
Impact CategorySoybeansSoymilkTofu
PMFP3.54 × 10−13.13 × 10−16.43 × 10−1
FSP1.30 × 1001.14 × 1005.00 × 100
FETP2.55 × 1023.01 × 1027.52 × 102
FEP2.22 × 1002.38 × 1005.48 × 100
GWP5.52 × 10−14.88 × 10−11.33 × 100
HCTP6.12 × 1016.28 × 1011.58 × 102
HNTP3.75 × 1014.04 × 1019.19 × 101
IRP3.87 × 1004.89 × 1001.27 × 101
LUP2.16 × 10−21.66 × 10−21.88 × 10−2
METP3.90 × 1024.64 × 1021.17 × 103
MEP1.19 × 1001.18 × 1002.34 × 100
MSP3.30 × 10−43.25 × 10−46.46 × 10−4
OFHP1.18 × 1009.47 × 10−11.62 × 100
OFTP1.40 × 1001.13 × 1001.97 × 100
ODP1.62 × 10−11.28 × 10−11.61 × 10−1
TAP5.03 × 10−14.54 × 10−11.02 × 100
TETP3.02 × 1013.52 × 1018.61 × 101
WCP3.10 × 10−18.46 × 10−11.34 × 100
TOTAL7.87 × 1029.17 × 1022.29 × 103
Table A5. Normalized ReCiPe Midpoint (H) impacts of the main products of each phase at the Tigusto Company (inventories and total products from Table A1, Table A2 and Table A3; exergy allocation according to Table 1; F.U.: 1 kg of soybeans, 1 L of soy milk, 1 kg of tofu).
Impact CategorySoybeansSoymilkTofu
PMFP2.36 × 10−52.09 × 10−62.57 × 10−5
FSP8.69 × 10−57.61 × 10−62.00 × 10−4
FETP1.70 × 10−22.00 × 10−33.01 × 10−2
FEP1.48 × 10−41.59 × 10−52.19 × 10−4
GWP3.68 × 10−53.26 × 10−65.33 × 10−5
HCTP4.08 × 10−34.19 × 10−46.32 × 10−3
HNTP2.50 × 10−32.69 × 10−43.68 × 10−3
IRP2.58 × 10−43.26 × 10−55.09 × 10−4
LUP1.44 × 10−61.10 × 10−77.54 × 10−7
METP2.60 × 10−23.09 × 10−34.68 × 10−2
MEP7.92 × 10−57.84 × 10−69.35 × 10−5
MSP2.20 × 10−82.17 × 10−92.58 × 10−8
OFHP7.87 × 10−56.31 × 10−66.49 × 10−5
OFTP9.34 × 10−57.50 × 10−67.88 × 10−5
ODP1.08 × 10−58.53 × 10−76.45 × 10−6
TAP3.35 × 10−53.03 × 10−64.09 × 10−5
TETP2.01 × 10−32.34 × 1043.44 × 10−3
WCP2.07 × 10−55.64 × 10−65.35 × 10−5
TOTAL5.24 × 10−26.11 × 10−39.16 × 10−2
Table A6. Normalized ReCiPe Midpoint (H) impacts of conventional and organic tofu production (F.U.: 25,000 kg of food produced). Higher impacts highlighted as bold.
Impact CategoryTigusto Organic TofuConventional Tofu
PMFP6.43 × 10−19.78 × 10⁻¹
FSP5.00 × 1005.18 × 100
FETP7.52 × 1023.66 × 102
FEP5.48 × 1007.10 × 100
GWP1.33 × 1001.87 × 100
HCTP1.58 × 1021.69 × 102
HNTP9.19 × 1019.59 × 101
IRP1.27 × 1012.88 × 101
LUP1.88 × 10−22.48 × 10⁻²
METP1.17 × 1034.37 × 102
MEP2.34 × 1004.74 × 100
MSP6.46 × 10−45.91 × 10⁻⁴
OFHP1.62 × 1001.87 × 100
OFTP1.97 × 1002.25 × 100
ODP1.61 × 10−11.93 × 100
TAP1.02 × 1002.25 × 100
TETP8.61 × 1011.97 × 101
WCP1.34 × 1001.75 × 101
TOTAL2.29 × 1031.16 × 103
Table A7. Comparison of ReCiPe Midpoint (H) characterized results of meat, snails and organic tofu production (F.U. 1 kg of meat, 1.62 kg of snails vs. 1.24 kg of organic tofu). Lower impacts are highlighted as Italics; larger impacts as bold; regular font is used for intermediate results.
Impact CategoryReference UnitTofu 1.24 kgSnails 1.62 kgMeat 1 kg
PMFPkg PM2.5 eq8.16 × 10−41.44 × 10−32.30 × 10−2
FSPkg oil eq2.43 × 10−11.19 × 10−19.15 × 100
FETPkg 1.4−DCB4.58 × 10−27.89 × 10−38.57 × 10−1
FEPkg P eq1.77 × 10−41.24 × 10−43.23 × 10−3
GWPkg CO2 eq5.28 × 10−14.85 × 10−13.13 × 101
HCTPkg 1.4-DCB2.17 × 10−21.26 × 10−27.54 × 10−1
HNTPkg 1.4-DCB6.79 × 10−11.92 × 1001.36 × 101
IRPkBq Co-60 eq3.03 × 10−13.22 × 10−27.83 × 10−1
LUPm2a crop eq5.77 × 10−33.84 × 10−31.42 × 10−1
METPkg 1.4-DCB5.99 × 10−21.08 × 10−21.08 × 100
MEPkg N eq5.34 × 10−41.85 × 10−36.49 × 10−1
MSPkg Cu eq3.85 × 10−32.20 × 10−31.49 × 10−1
OFHPkg NOx eq1.66 × 10−31.46 × 10−33.82 × 10−2
OFTPkg NOx eq1.74 × 10−31.49 × 10−33.97 × 10−2
ODPkg CFC11 eq4.79 × 10−75.64 × 10−63.84 × 10−4
TAPkg SO2 eq2.08 × 10−37.88 × 10−36.01 × 10−2
TETPkg 1.4-DCB4.43 × 1007.54 × 10−13.75 × 101
WCPm31.77 × 10−21.46 × 10−13.82 × 100
Table A8. Inventory of electricity from agricultural waste.
Item UnitQuantity
Input
Hulls kg1200
Straw kg15,000
Output
ElectricitykWh20,790
Note: An efficiency of 30% was assumed for the thermal power plant; a lower heating value equal to 15 MJ/kg was assumed for the lignocellulosic waste. Calculations obtained by extracting calorific values from the following source: Engineering ToolBox, (2001). [online] Available at: https://www.engineeringtoolbox.com [Accessed 30 March 2023] [110].
Table A9. Comparison of normalized impacts of in-house generated electricity compared with grid electricity mix and in-house photovoltaic production (F.U.: 1 kWh of electricity generated). (*).
Impact CategoryElectricity from WasteGrid ElectricityPhotovoltaic Electricity
PMFP1.29 × 10−54.17 × 10−67.62 × 10−6
FSP4.86 × 10−53.43 × 10−52.09 × 10−5
FETP2.32 × 10−32.66 × 10−31.82 × 10−2
FEP4.29 × 10−51.16 × 10−49.83 × 10−5
GWP2.00 × 10−51.49 × 10−59.86 × 10−6
HCTP1.43 × 10−31.87 × 10−32.38 × 10−3
HNTP6.97 × 10−45.48 × 10−42.03 × 10−3
IRP1.02 × 10−51.32 × 10−32.48 × 10−5
LUP1.02 × 10−67.01 × 10−87.85 × 10−8
METP3.19 × 10−34.37 × 10−32.85 × 10−2
MEP3.21 × 10−51.65 × 10−41.09 × 10−5
MSP9.02 × 10−95.85 × 10−91.22 × 10−8
OFHP5.18 × 10−58.00 × 10−61.03 × 10−5
OFTP6.13 × 10−59.47 × 10−61.26 × 10−5
ODP7.25 × 10−62.38 × 10−67.84 × 10−7
TAP1.75 × 10−56.48 × 10−61.21 × 10−5
TETP3.15 × 10−42.29 × 10−42.17 × 10−3
WCP6.65 × 10−62.42 × 10−51.06 × 10−5
TOTAL8.27 × 10−31.14 × 10−25.36 × 10−2
(*) Lower impacts are highlighted as Italics; larger impacts as bold; regular font is used for intermediate results.
Table A10. Soybean-to-tofu circular production inventory (F.U.: see Table A1, Table A2 and Table A3).
Soybean Circular Production
Item UnitQuantity
Input
Occupation, arable, non-irrigatedha6
Sowing ha6
Soybean seeds, for sowingkg15,000
Ploughing ha6
Combine harvesting ha6
Polyethylene for two bagskg250
Lorry diesel, 3.5–7.5 metric tons for transportka × km6000
Lorry electric, 3.5–7.5 metric tons for transportka × km3000
Electricity from waste kWh10,023.75
Tap water L15,000
Output
Soybeans kg15,000
Straw kg15,000
Hulls kg1200
Soymilk circular production
Item UnitQuantity
Input
Tap water L187,500
Electricity from waste kWh7053.75
Photovoltaic electricity kWh3605
Soybeans kg15,000
Gas propane L25,000
Output
Soymilk L150,000
Okara (protein food) kg24,000
Tofu circular production
Item UnitQuantity
Input
Magnesium chloride kg750
Electricity from waste kWh3712.5
Photovoltaic electricity kWh3605
Polyethylene for packagingkg1750
Gas propane L3500
Soymilk L150,000
Output
Tofu kg25,000
Whey from tofu kg3703.7
Figure A1. Comparison among characterized impacts of conventional (Series 1), organic (Series 2) and circular (Series 3) tofu production. Data are from Table 9, adjusted to fit the vertical axis scale of the diagram. It should not be disregarded that comparison of characterized impacts can only be made within each category, not among categories.
Environments 10 00073 g0a1

References

  1. McLaren, S.J. Life Cycle Assessment (LCA) of food production and processing: An introduction. In Environmental Assessment and Management in the Food Industry. Life Cycle Assessment and Related Approaches, 1st ed.; Sonesson, U., Berlin, J., Ziegler, F., Eds.; Woodhead Publishing: Cambridge, UK, 2010; pp. 37–58. [Google Scholar]
  2. Notarnicola, B.; Tassielli, G.; Renzulli, P.A. Modeling the Agri-Food Industry with Life Cycle Assessment. In Life Cycle Assessment Handbook: A Guide for Environmentally Sustainable Products; Curran, M.A., Ed.; Wiley Online Books: Cincinnati, OH, USA, 2012; pp. 159–184. [Google Scholar]
  3. Zehetmeier, M.; Baudracco, J.; Hoffmann, H.; Heißenhuber, A. Does increasing milk yield per cow reduce greenhouse gas emissions? A system approach. Animal 2012, 6, 154–166. [Google Scholar] [CrossRef] [Green Version]
  4. Hickey, H. World Population to Keep Growing This Century, Hit 11 Billion by 2100. University of Washington. 2014. Available online: https://www.washington.edu/news/2014/09/18/world-population-to-keep-growing-this-century-hit-11-billion-by-2100/ (accessed on 24 April 2023).
  5. OECD and Food and Agriculture Organization of the United Nations. Meat. In OECD-FAO Agricultural Outlook 2020–2029; OECD: Rome, Italy, 2020; p. 330. [Google Scholar]
  6. World Wildlife Fund. Available online: https://www.worldwildlife.org/industries/soy (accessed on 24 April 2022).
  7. Gaonkar, V.; Rosentrater, K.A. Soybean. In Integrated Processing Technologies for Food and Agricultural By-Products, 1st ed.; Pan, Z., Zhang, R., Zicari, S., Eds.; Academic Press: Cambridge, MA, USA, 2019; pp. 73–104. [Google Scholar]
  8. Ritchie, H.; Roser, M. Soy. Forests-and-Deforestation. 2021. Available online: https://ourworldindata.org/soy/ (accessed on 3 May 2021).
  9. Tang, J.; Wichers, H.J.; Hettinga, K.A. Heat-induced unfolding facilitates plant protein digestibility during in vitro static infant digestion. Food Chem. 2022, 375, 131878. [Google Scholar] [CrossRef] [PubMed]
  10. Vagadia, B.H.; Vanga, S.K.; Raghavan, V. Inactivation methods of soybean trypsin inhibitor—A review. Trends Food Sci. Technol. 2017, 64, 115–125. [Google Scholar] [CrossRef]
  11. Shi, L.; Mu, K.; Arntfield, S.D.; Nickerson, M.T. Changes in levels of enzyme inhibitors during soaking and cooking for pulses available in Canada. J. Food Technol. Res. 2017, 54, 1014–1022. [Google Scholar] [CrossRef] [PubMed] [Green Version]
  12. Ritchie, H.; Roser, M. Soy. 2021. Available online: https://ourworldindata.org/forests-and-deforestation (accessed on 3 May 2021).
  13. Ritchie, H.; Roser, M. Meat and Dairy Production. 2017. Available online: https://ourworldindata.org/meat-production (accessed on 3 May 2021).
  14. FAO. Livestock’s Long Shadow-Enviromental Issues and Option; FAO: Rome, Italy, 2006; Available online: https://www.fao.org/3/a0701e/a0701e.pdf (accessed on 28 April 2022).
  15. De Vries, M.; De Boer, I.J.M. Comparing environmental impacts for livestock products: A review of life cycle assessments. Livest. Sci. 2010, 128, 1–11. [Google Scholar] [CrossRef]
  16. Xu, X.; Sharma, P.; Shu, S.; Lin, T.S.; Ciais, P.; Tubiello, F.N.; Smith, P.; Campbell, N.; Jain, A.K. Global greenhouse gas emissions from animal-based foods are twice those of plant-based foods. Nat. Food 2021, 2, 724–732. [Google Scholar] [CrossRef]
  17. Davis, K.F.; Yu, K.; Herrero, M.; Havlik, P.; Carr, J.A.; D’Odorico, P. Historical trade-offs of livestock’s environmental impacts. IJERD 2015, 10, 12. [Google Scholar] [CrossRef]
  18. Opio, C.; Gerber, P.; Mottet, A.; Falcucci, A.; Tempio, G.; MacLeod, M.; Vellinga, T.; Henderson, B.; Steinfeld, H. Greenhouse Gas Emissions from Ruminant Supply Chains—A Global Life Cycle Assessment; FAO: Rome, Italy, 2013. [Google Scholar]
  19. FAO. Global Livestock Environmental Assessment Model (GLEAM). Available online: https://www.fao.org/gleam/results/en/ (accessed on 29 April 2022).
  20. Grossi, G.; Goglio, P.; Vitali, A.; .Williams, A.G. Livestock and climate change: Impact of livestock on climate and mitigation strategies. J. Anim. 2019, 9, 69–76. [Google Scholar] [CrossRef] [PubMed] [Green Version]
  21. Ritchie, H. Half of the World’s Habitable Land Is Used for Agriculture. 2019. Available online: https://ourworldindata.org/global-land-for-agriculture (accessed on 8 April 2022).
  22. Cheng, M.; McCarl, B.; Fei, C. Climate Change and Livestock Production: A Literature Review. Atmosphere 2022, 13, 140. [Google Scholar] [CrossRef]
  23. Borges, M. The 22-Day Revolution: The Plant-Based Programme that Will Transform Your Body, Reset Your Habits, and Change Your Life, 1st ed.; Celebra: New York, NY, USA, 2015; p. 333. [Google Scholar]
  24. UNDP. Rethinking the Food We Eat. 2020. Available online: https://www.undp.org/blog/rethinking-food-we-eat (accessed on 30 April 2022).
  25. Carlsson-Kanyama, A. Climate change and dietary choices—How can emissions of greenhouse gases from food consumption be reduced? Food Policy 1998, 23, 277–293. [Google Scholar] [CrossRef]
  26. Pimentel, D.; Pimentel, M. Sustainability of meat-based and plant-based diets and the environment. Am. J. Clin. Nutr. 2003, 78, 660S–663S. [Google Scholar] [CrossRef] [Green Version]
  27. Reijnders, L.; Soret, S. Quantification of the environmental impact of different dietary protein choices. Am. J. Clin. Nutr. 2003, 78, 664S–668S. [Google Scholar] [CrossRef] [Green Version]
  28. Eisen, M.B.; Brown, P.O. Rapid global phaseout of animal agriculture has the potential to stabilize greenhouse gas levels for 30 years and offset 68 percent of CO2 emissions this century. PLoS Clim. 2022, 1, e0000010. [Google Scholar] [CrossRef]
  29. Baroni, L.; Cenci, L.; Tettamanti, M.; Berati, M. Evaluating the environmental impact of various dietary patterns combined with different food production systems. Eur. J. Clin. Nutr. 2007, 61, 279–286. [Google Scholar] [CrossRef] [PubMed] [Green Version]
  30. Johnson, L.A.; Myers, D.J. Chapter 21—Industrial Uses for Soybeans. In Practical Handbook of Soybean Processing and Utilization, 1st ed.; Erickson, D.R., Ed.; Elsevier: Amsterdam, The Netherlands, 1995; pp. 380–427. [Google Scholar]
  31. Ting, C.C.; Chen, C.C. Viscosity and working efficiency analysis of soybean oil-based bio-lubricants. Measurement 2011, 44, 1337–1341. [Google Scholar] [CrossRef]
  32. Koc, A.B.; Abdullah, M.; Fereidouni, M. Soybeans processing for biodiesel production. In Soybean-Application and Technology; Ng, T.-B., Ed.; InTechOpen Publisher: Rijeka, Croatia, 2011; pp. 19–32. [Google Scholar]
  33. Schmitz, J.F.; Sevim Erhan, Z.; Sharma, B.K.; Johnson, L.A.; Myers, D.J. 17—Biobased Products from Soybeans. In Soybeans: Chemistry, Production, Processing, and Utilization, 1st ed.; Johnson, L.A., White, P.J., Galloway, R., Eds.; Academic Press and AOCS Press: Urbana, IL, USA, 2008; pp. 539–612. [Google Scholar]
  34. Brentin, R.P. Soy-Based Chemicals and Materials: Growing the Value Chain. ACS 2014, 1178, 414. [Google Scholar]
  35. Bergmann, J.C.; Tupinambá, D.D.; Costa, O.Y.A.; Almeida, J.R.M.; Barreto, C.C.; Quirino, B.F. Biodiesel production in Brazil and alternative biomass feedstocks. Renew. Sustain. Energy Rev. 2013, 21, 411–420. [Google Scholar] [CrossRef]
  36. Rainforest Foundation Norway, Oslo, Norway. 2020. Available online: https://www.regnskog.no/en/news/biofuels-add-fuel-to-forest-fires (accessed on 20 August 2022).
  37. Jagger, A. Biofuels for transport in 2050. Biofuels Bioprod. Biorefining 2011, 5, 481–485. [Google Scholar] [CrossRef]
  38. Pradhan, A.; Shrestha, D.S.; Van Gerpen, J.; McAloon, A.; Yee, W.; Haas, M.; Duffield, J.A. Reassessment of Life Cycle Greenhouse Gas Emissions for Soybean Biodiesel. Trans. ASABE 2012, 55, 2257–2264. [Google Scholar] [CrossRef]
  39. Huo, H.; Wang, M.; Bloyd, C.; Putsche, V. Life-Cycle Assessment of Energy Use and Greenhouse Gas Emissions of Soybean-Derived Biodiesel and Renewable Fuels. Environ. Sci. Technol. 2009, 43, 750–756. [Google Scholar] [CrossRef]
  40. Campbell, A.; Doswald, N. The Impacts of Biofuel Production on Biodiversity: A Review of the Current Literature; UNEP-WCMC: Cambridge, UK, 2009. [Google Scholar]
  41. Gao, Y.; Skutsch, M.; Masera, O.; Pacheco, P. A Global Analysis of Deforestation Due to Biofuel Development; CIFOR: Bogor, Indonesia, 2011. [Google Scholar]
  42. Dalena, F.; Senatore, A.; Tursi, A.; Basile, A. Bioenergy production from second- and third-generation feedstocks. In Bioenergy Systems for the Future: Prospects for Biofuels and Biohydrogen, 1st ed.; Woodhead Publishing: Duxford, UK, 2017; pp. 559–599. [Google Scholar]
  43. Hassan, S.-M. Soybean, Nutrition and Health. In Soybean-Bio-Active Compounds; El-Shemy, H.A., Ed.; InTech: Rijeka, Croatia, 2013; p. 558. [Google Scholar]
  44. Murooka, Y.; Yamshita, M. Traditional healthful fermented products of Japan. J. Ind. Microbiol. Biotechnol. 2008, 35, 791. [Google Scholar] [CrossRef]
  45. Chen, K.-I.; Erh, M.-H.; Su, N.-W.; Liu, W.-H.; Chou, C.-C.; Cheng, K.-C. Soyfoods and soybean products: From traditional use to modern applications. Appl. Microbiol. Biotechnol. 2012, 96, 9–22. [Google Scholar] [CrossRef]
  46. Khosravi, A.; Razavi, S.H. Therapeutic effects of polyphenols in fermented soybean and black soybean products. J. Funct. Foods 2021, 81, 104467. [Google Scholar] [CrossRef]
  47. Zhang, Q.; Wang, C.; Li, B.; Li, L.; Lin, D.; Chen, H.; Liu, Y.; Li, S.; Qin, W.; Liu, J.; et al. Research progress in tofu processing: From raw materials to processing conditions. Food Sci. Nutr. 2018, 58, 1448–1467. [Google Scholar] [CrossRef] [PubMed]
  48. Grand View Research. 2015–2017. Available online: https://www.grandviewresearch.com/industry-analysis/tofu-market (accessed on 30 March 2023).
  49. Godfray, C.; Aveyard, P.; Garnett, T.; Hall, J.; Key, T.; Lorimer, J.; Pierrehumbert, R.; Scarborough, P.; Springmann, M.; Jebb, S. Meat consumption, health, and the environment. Science 2018, 361, 5324. [Google Scholar] [CrossRef] [Green Version]
  50. Jiménez-Rosado, M.; Bouroudian, E.; Perez-Puyana, V.; Guerrero, A.; Romero, A. Evaluation of different strengthening methods in the mechanical and functional properties of soy protein-based bioplastics. J. Clean. Prod. 2020, 262, 121517. [Google Scholar] [CrossRef]
  51. Chan, R.; Lim, L.-T.; Barbut, S.; Marcone, M.F. Extrusion and Characterization of Soy Protein Film Incorporated with Soy Cellulose Microfibers. Int. Polym. Process. 2014, 29, 467–476. [Google Scholar] [CrossRef]
  52. Muhammad, A.; Rashidi, A.R.; Roslan, A.; Idris, S.A. Development of bio based plastic materials for packaging from soybeans waste. AIP Conf. Proc. 2017, 1885, 020230. [Google Scholar]
  53. Clarkson, T.B. Soy, Soy Phytoestrogens and Cardiovascular Disease. J. Nutr. 2002, 132, 566S–569S. [Google Scholar] [CrossRef] [Green Version]
  54. Villanueva, M.J.; Yokoyama, W.H.; Hong, Y.J.; Barttley, G.E.; Rupérez, P. Effect of high-fat diets supplemented with okara soybean by-product on lipid profiles of plasma, liver and faeces in Syrian hamsters. Food Chem. 2011, 124, 72–79. [Google Scholar] [CrossRef] [Green Version]
  55. Préstamo, G.; Rupérez, P.; Espinosa-Martos, I.; Villaneva, M.J.; Lasunción, M.A. The effects of okara on rat growth, cecal fermentation, and serum lipids. Eur. Food Res. Technol. 2007, 225, 925–928. [Google Scholar] [CrossRef] [Green Version]
  56. Bedani, R.; Rossi, E.A.; Cavallini, D.C.U.; Pinto, R.A.; Vendramini, R.C.; Augusto, E.M.; Abdalla, D.S.P.; Saad, S.M.I. Influence of daily consumption of synbiotic soy-based product supplemented with okara soybean by-product on risk factors for cardiovascular diseases. Food Res. Int. 2015, 73, 142–148. [Google Scholar] [CrossRef]
  57. Tigusto. 2019. Available online: https://www.tigusto.ch/ (accessed on 14 July 2022).
  58. Yellow Pages. Available online: https://yellowpages.swiss/location.cfm?key=1711877&company=tigusto-SA&art=HRB (accessed on 17 April 2023).
  59. Rodale Institute. 2022. Available online: https://rodaleinstitute.org (accessed on 19 July 2022).
  60. Bio-Inspecta. 2020. Available online: https://www.bio-inspecta.ch/it/home (accessed on 14 July 2022).
  61. Iyyanki, V.; Manickam, M.; Manickam, V. Chapter Five—Life Cycle Assessment. In Environmental Management-Science and Engineering for Industry; Elsevier: Cambridge, MA, USA, 2017; pp. 57–75. [Google Scholar]
  62. ISO 14040/14044; Environmental Management—Life Cycle Assessment—Requirements and Guidelines, 1st ed. International Organization for Standardization, ISO Central Secretariat: Geneva, Switzerland, 2006; pp. 1–46.
  63. European Commission. European Platform on Life Cycle Assessment. Available online: https://eplca.jrc.ec.europa.eu/lifecycleassessment.html (accessed on 22 August 2022).
  64. Wernet, G.; Bauer, C.; Steubing, B.; Reinhard, J.; Moreno-Ruiz, E.; Weidema, B. The ecoinvent database version 3 (part I): Overview and methodology. Int. J. Life Cycle Assess. 2016, 21, 1218–1230. [Google Scholar] [CrossRef]
  65. LCA. Available online: https://consequential-lca.org/glossary/ (accessed on 18 April 2023).
  66. Szargut, J.; Morris, D.R.; Steward, F.R. Exergy Analysis of Thermal, Chemical, and Metallurgical Processes, 1st ed.; Hemisphere Publishing Corporation: New York, NY, USA, 1988; p. 332. [Google Scholar]
  67. Szargut, J. Chemical exergies of the elements. Appl. Energy 1989, 32, 269–286. [Google Scholar] [CrossRef]
  68. Huijbregts, M.A.J.; Steinmann, Z.J.N.; Elshout, P.M.F.; Stam, G.; Verones, F.; Vieira, M.; Ziip, M.; Hollander, A.; Van Zelm, R. ReCiPe2016: A harmonised life cycle impact assessment method at midpoint and endpoint level. Int. J. Life Cycle Assess. 2017, 22, 138–147. [Google Scholar] [CrossRef]
  69. Goedkoop, M.J.; Heijungs, R.; Huijbregts, M.A.J.; De Schryver, A.; Struijs, J.; Van Zelm, R. ReCiPE 2008: A Life Cycle Impact Assessment Method which Comprises Harmonised Category Indicators at the Midpoint and the Endpoint Level, 1st ed.; Report I; Ministerie van Volkshuisvesting, Ruimtelijke Ordening en Milieu: The Hague, The Netherlands, 2008; Available online: https://web.universiteitleiden.nl/cml/ssp/publications/recipe_characterisation.pdf (accessed on 18 April 2023).
  70. Ghisellini, P.; Cialani, C.; Ulgiati, S. A review on circular economy: The expected transition to a balanced interplay of environmental and economic systems. J. Clean. Prod. 2016, 114, 11–32. [Google Scholar] [CrossRef]
  71. Parajuli, R.; Løkke, S.; Østergaard, P.A.; Knudsen, M.T.; Schmidt, J.H.; Dalgaard, T. Life Cycle Assessment of district heat production in a straw fired CHP plant. Biomass Bioenergy 2014, 68, 115–134. [Google Scholar] [CrossRef]
  72. Buonocore, E.; Franzese, P.; Ulgiati, S. Assessing the environmental performance and sustainability of bioenergy production in Sweden: A life cycle assessment perspective. Energy 2012, 37, 69–78. [Google Scholar] [CrossRef]
  73. Mellino, S.; Protano, G.; Buonocore, E.; De Angelis, G.; Liu, G.; Xu, L.; Ulgiati, S. Alternative Options for Sewage Sludge Treatment and Process Improvement Through Circular Patterns: LCA-based Case Study and Scenarios. J. Environ. Account. Manag. 2015, 3, 77–85. [Google Scholar] [CrossRef] [Green Version]
  74. Buonocore, E.; Mellino, S.; De Angelis, G.; Liu, G.; Ulgiati, S. Life cycle assessment indicators of urban wastewater and sewage sludge treatment. Ecol. Ind. 2018, 94, 13–23. [Google Scholar] [CrossRef] [Green Version]
  75. Velenturf, A.P.M.; Purnell, P. Principles for a sustainable circular economy. Sustain. Prod. Consum. 2021, 27, 1437–1457. [Google Scholar] [CrossRef]
  76. Winans, K.; Kendall, A.; Deng, H. The history and current applications of the circular economy concept. Renew. Sustain. Energy Rev. 2017, 68, 825–833. [Google Scholar] [CrossRef]
  77. Ghisellini, P.; Santagata, R.; Zucaro, A.; Ulgiat, S. Circular patterns of waste prevention and recovery. E3S Web Conf. 2019, 119, 18. [Google Scholar] [CrossRef] [Green Version]
  78. Ghisellini, P.; Ulgiati, S. Circular economy transition in Italy. Achievements, perspectives and constraints. J. Clean. Prod. 2019, 243, 118360. [Google Scholar] [CrossRef]
  79. Santagata, R.; Ripa, M.; Genovese, A.; Ulgiati, S. Food waste recovery pathways: Challenges and opportunities for an emerging bio-based circular economy. A systematic review and an assessment. J. Clean. Prod. 2020, 286, 125490. [Google Scholar] [CrossRef]
  80. Li-wei, Z.; Til, F.; Jirko, H.; Christa, H.; Reiner, D. Comparison of energy consumption and economic performance of organic and conventional soybean production—A case study from Jilin Province, China. J. Integr. Agric. 2015, 14, 1561–1572. [Google Scholar]
  81. Stranks, S.D.; Eperon, G.E.; Grancini, G.; Menelaou, C.; Alcocer, M.J.P.; Leijtens, T.; Herz, L.M.; Petrozza, A.; Snaith, H.J. Electron-Hole Diffusion Lengths Exceeding 1 Micrometer in an Organometal Trihalide Perovskite Absorber. Science 2013, 342, 341–344. [Google Scholar] [CrossRef] [Green Version]
  82. Gerbens-Leenes, P.W.; Mekonnen, M.M.; Hoekstra, A.Y. The water footprint of poultry, pork and beef: A comparative study in different countries and production systems. Water Resour. Ind. 2013, 1–2, 25–36. [Google Scholar] [CrossRef] [Green Version]
  83. De Vries, M.D.; Van Middelaar, C.E.; De Boer, I.J.M. Comparing environmental impacts of beef production systems: A review of life cycle assessments. Livest. Sci. 2015, 178, 279–288. [Google Scholar] [CrossRef]
  84. Asem-Hiablie, S.; Battagliese, T.; Stackhouse-Lawson, K.R.; Rotz, C.A. A life cycle assessment of the environmental impacts of a beef system in the USA. Int. J. Life Cycle Assess. 2018, 24, 441–455. [Google Scholar] [CrossRef] [Green Version]
  85. Wang, X.; Chen, Y.; Sui, P.; Gao, W.; Qin, F.; Zhang, J.; Wu, X. Emergy analysis of grain production systems on large-scale farms in the North China Plain based on LCA. Agric. Syst. 2014, 128, 66–78. [Google Scholar] [CrossRef]
  86. Soheilifard, F.; Kouchaki-Penchah, H. Assessing environmental burdens of sugar beet production in East Azerbaijan province of I. R. Iran based on farms size levels. Int. J. Farm. allied Sci. 2015, 4, 489–495. [Google Scholar]
  87. Presumido, P.H.; Sousa, F.; Gonçalves, A.; Bosco, T.C.D.; Feliciano, M. Environmental Impacts of the Beef Production Chain in the Northeast of Portugal Using Life Cycle Assessment. Agriculture 2018, 8, 165. [Google Scholar] [CrossRef] [Green Version]
  88. Gerber, P.J.; Mottet, A.; Opio, C.I.; Falcucci, A.; Teillard, F. Environmental impacts of beef production: Review of challenges and perspectives for durability. Meat Sci. 2015, 109, 2–12. [Google Scholar] [CrossRef]
  89. Cerri, C.C.; Moreira, C.S.; Alves, P.A.; Raucci, G.S.; de Almeida Castigioni, B.; Mello, F.F.C.; Cerri, D.G.P.; Cerri, C.E.P. Assessing the carbon footprint of beef cattle in Brazil: A case study with 22 farms in the State of Mato Grosso. J. Clean. Prod. 2016, 112, 2593–2600. [Google Scholar] [CrossRef]
  90. Li, B.; Qiao, M.; Lu, F. Composition, Nutrition, and Utilization of Okara (Soybean Residue). Food Rev. Int. 2011, 28, 231–252. [Google Scholar] [CrossRef]
  91. Martins Borges, M.; Vicente, D.; Trombete, F.M.; Ana Karoline Ferreira Ignácio Câmara, A.K. Edible insects as a sustainable alternative to food products: An insight into quality aspects of reformulated bakery and meat products. Curr. Opin. Food Sci. 2022, 46, 100864. [Google Scholar] [CrossRef]
  92. Michel, P.; Begho, T. Paying for sustainable food choices: The role of environmental considerations in consumer valuation of insect-based foods. Food Qual. Pref. 2023, 106, 104816. [Google Scholar] [CrossRef]
  93. Napolitano, G.; Venditti, P.; Agnisola, C.; Quartucci, S.; Fasciolo, G.; Muscari Tomajoli, M.T.; Geremia, E.; Catone, C.M.; Ulgiati, S. Towards sustainable aquaculture systems: Biological and environmental impact of replacing fishmeal with Arthrospira platensis (Nordstedt) (spirulina). J. Clean. Prod. 2022, 374, 133978. [Google Scholar] [CrossRef]
  94. Dueñas-Ocampo, S.; Eichhorst, W.; Newton, P. Plant-based and cultivated meat in the United States: A review and research agenda through the lens of socio-technical transitions. J. Clean. Product. 2023, 405, 136999. [Google Scholar] [CrossRef]
  95. Good Food Institute. Available online: https://gfi.org/science/the-science-of-cultivated-meat/ (accessed on 18 April 2023).
  96. Science Focus. 2022. Available online: https://www.sciencefocus.com/science/what-is-lab-grown-meat-a-scientist-explains-the-taste-production-and-safety-of-artificial-foods/ (accessed on 18 April 2023).
  97. Zucaro, A.; Forte, A.; De Vico, G.; Fierro, A. Environmental loading of Italian semi-intensive snail farming system evaluated by means of life cycle assessment. J. Clean. Prod. 2016, 125, 56–67. [Google Scholar] [CrossRef]
  98. USDA 2015. Available online: https://fdc.nal.usda.gov/fdc-app.html#/food-details/172475/nutrients (accessed on 28 March 2023).
  99. USDA. 2018. Available online: https://www.nal.usda.gov/sites/default/files/page-files/iron.pdf (accessed on 25 March 2023).
  100. Nkansah, M.; Agyei, E.A.; Opoku, F. Mineral and proximate composition of the meat and shell of three snail species. Heliyon 2021, 7, e08149. [Google Scholar] [CrossRef]
  101. USDA 2020. Available online: https://fdc.nal.usda.gov/fdc-app.html#/food-details/1097542/nutrients (accessed on 20 January 2023).
  102. USDA 2019. Available online: https://fdc.nal.usda.gov/fdc-app.html#/food-details/174272/nutrients (accessed on 7 February 2023).
  103. Cinea. 2022. Available online: https://cinea.ec.europa.eu/news-events/news/using-algae-better-solar-energy-performance-2022-10-19_en (accessed on 15 February 2023).
  104. Billen, P.; Leccisi, E.; Dastidar, S.; Li, S.; Lobaton, L.; Spatari, S.; Fafarman, A.T.; Fthenakis, V.M.; Baxter, J.B. Comparative evaluation of lead emissions and toxicity potential in the life cycle of lead halide perovskite photovoltaics. Energy 2019, 166, 1089–1096. [Google Scholar] [CrossRef]
  105. Richi, E.B.; Baumer, B.; Conrad, B.; Darioli, R.; Schmid, A.; Keller, U. Health Risks Associated with Meat Consumption: A Review of Epidemiological Studies. Int. J. Vitam. Nutr. Res. 2015, 85, 70–78. [Google Scholar] [CrossRef] [PubMed]
  106. Eze, N.M.; Okwume, U.G.; Eseadi, C.; Udenta, E.A.; Onyeke, N.G.; Ugwu, E.N.; Akubue, B.N.; Njoku, H.A.; Ezeanwu, A.B. Acceptability and consumption of tofu as a meat alternative among secondary school boarders in Enugu State, Nigeria. Med. Baltim. 2018, 97, e13155. [Google Scholar] [CrossRef]
  107. D’Innocenzo, S.; Biagi, C.; Lanari, M. Obesity and the Mediterranean Diet: A Review of Evidence of the Role and Sustainability of the Mediterranean Diet. Nutrients 2019, 11, 1306. [Google Scholar] [CrossRef] [PubMed] [Green Version]
  108. Zheng, L.; Regenstein, J.M.; Teng, F.; Li, Y. Tofu products: A review of their raw materials, processing conditions, and packaging. Compr. Rev. Food Sci. Food Saf. 2020, 19, 3683–3714. [Google Scholar] [CrossRef]
  109. Chua, J.Y.; Liu, S.Q. Soy whey: More than just wastewater from tofu and soy protein isolate industry. Trends Food Sci. Technol. 2019, 91, 24–32. [Google Scholar] [CrossRef]
  110. Engineering ToolBox. Fuels—Higher and Lower Calorific Values. 2003. Available online: https://www.engineeringtoolbox.com/fuels-higher-calorific-values-d_169.html (accessed on 30 March 2023).
Figure 2. Percentage contributions of the different inflows to the final LCA characterized results of the production of 25,000 kg of organic tofu.
Environments 10 00073 g002
Table 1. Exergy allocation factors.
Agricultural Phase
Unit Exergy of Harvested SoybeansUnit Exergy of StrawExergy of Co-Products
ComponentJ/kgComponentJ/kgCo-Products of PhaseAmount (kg)Exergy (J)Percentage (%)
Carbs1.09 × 107Carbs1.12 × 107Soybeans16,2005.10 × 101170.00
Fat9.02 × 106Fat1.63 × 106Straw15,0002.21 × 101130.00
Proteins1.15 × 107Proteins1.90 × 106
Watern.a.Ashn.a.
Soybeans exergy3.15 × 107Straw
exergy
1.48 × 10⁷Total exergy 7.31 × 1011100.00
De-hulling phase
Unit exergy of hullsUnit exergy of de-hulled soybeansExergy of co-products
ComponentJ/kgComponentJ/kgCo-Products of PhaseAmount (kg)Exergy (J)Percentage (%)
Carbs5.92 × 106Carbs1.12 × 107De-hulled soybeans15,0003.33 × 101197.00
Fat6.29 × 105Fat8.39 × 106Hulls12001.11 × 10103.00
Proteins2.72 × 106Proteins8.82 × 106
Watern.a.Ashn.a.
Hulls
exergy
9.27 × 10⁶De-hulled soybeans exergy2.22 × 106Total exergy 3.44 × 1011100.00
Soy milk production phase
Unit exergy of soymilkUnit exergy of okaraExergy of co-products
ComponentJ/kgComponentJ/kgCo-Products of PhaseAmount (kg)Exergy (J)Percentage (%)
Carbs1.33 × 106Carbs2.04 × 106Soymilk150,0003.33 × 101174.00
Fat7.97 × 105Fat7.26 × 105Okara24,0008.71 × 101026.00
Proteins7.10 × 105Proteins8.62 × 105
Watern.a.Ashn.a.
Soymilk
exergy
1.64 × 10⁶Okara
exergy
3.63 × 10⁶Total exergy 7.31 × 1011100.00
Tofu production phase
Unit exergy of soy permeate (whey)Unit exergy of tofuExergy of co-products
ComponentJ/kgComponentJ/kgCo-Products of PhaseAmount (kg)Exergy (J)Percentage (%)
Carbs1.42 × 105Carbs2.50 × 107Soy permeate (whey)37049.98 × 1080.01
Fat4.20 × 104Fat2.77 × 108Tofu25,0001.67 × 101399.99
Proteins8.57 × 104Proteins3.67 × 108
Watern.a.Ashn.a.
Whey
exergy
2.70 × 10⁵Tofu
exergy
6.69 × 10⁸Total exergy 1.67 × 1013100.00
Table 2. ReCiPe 2016 Midpoint (H) Impact Categories.
Impact CategoryLabelUnit
Fine particulate matter formationPMFPkg PM2.5 eq
Fossil resource scarcityFSPkg oil eq
Freshwater ecotoxicityFETPkg 1.4-DCB
Freshwater eutrophicationFEPkg P eq
Global warmingGWPkg CO2 eq
Human carcinogenic toxicityHCTPkg 1.4-DCB
Human non-carcinogenic toxicityHNTPkg 1.4-DCB
Ionizing radiationIRPkBq Co-60 eq
Land useLUPm2a crop eq
Marine ecotoxicityMETPkg 1.4-DCB
Marine eutrophicationMEPkg N eq
Mineral resource scarcityMSPkg Cu eq
Ozone formation, Human healthOFHPkg NOx eq
Ozone formation, Terrestrial ecosystemsOFTPkg NOx eq
Stratospheric ozone depletionODPkg CFC11 eq
Terrestrial acidificationTAPkg SO2 eq
Terrestrial ecotoxicityTETPkg 1.4-DCB
Water consumptionWCPm3
Table 3. ReCiPe Midpoint H characterized results of the annual production of 25,000 kg of organic tofu at Tigusto Company.
Impact CategoryReference UnitTofu Organic Production
PMFPkg PM2.5 eq1.64 × 101
FSPkg oil eq4.90 × 103
FETPkg 1.4-DCB9.23 × 102
FEPkg P eq3.56 × 100
GWPkg CO2 eq1.06 × 104
HCTPkg 1.4-DCB4.37 × 102
HNTPkg 1.4-DCB1.37 × 104
IRPkBq Co-60 eq6.11 × 103
LUPm2a crop eq1.16 × 102
METPkg 1.4-DCB1.21 × 103
MEPkg N eq1.08 × 101
MSPkg Cu eq7.75 × 101
OFHPkg NOx eq3.34 × 101
OFTPkg NOx eq3.50 × 101
ODPkg CFC11 eq9.66 × 10−3
TAPkg SO2 eq4.19 × 101
TETPkg 1.4-DCB8.92 × 104
WCPm33.57 × 102
Table 4. Characterized ReCiPe Midpoint (H) annual impacts for main products of each phase at the Tigusto Company (inventories and total products from Table A1, Table A2 and Table A3; exergy allocation according to Table 1; F.U.: 1 kg of soybeans, 1 L of soy milk, 1 kg of tofu).
Impact CategoryReference UnitSoybean Production
(1 kg)
Soy Milk Production
(1 L)
Tofu Production (1 kg)
PMFPkg PM2.5 eq6.04 × 10−45.34 × 10−56.58 × 10−4
FSPkg oil eq8.52 × 10−27.47 × 10−31.96 × 10−1
FETPkg 1.4-DCB2.08 × 10−22.46 × 10−33.69 × 10−2
FEPkg P eq9.63 × 10−51.03 × 10−31.42 × 10−4
GWPkg CO2 eq2.94 × 10−12.60 × 10−24.26 × 10−1
HCTPkg 1.4-DCB1.13 × 10−21.16 × 10−31.75 × 10−2
HNTPkg 1.4-DCB3.73 × 10−14.02 × 10−25.48 × 10−1
IRPkBq Co-60 eq1.24 × 10−11.57 × 10−22.45 × 10−1
LUPm2a crop eq8.90 × 10−36.82 × 10−44.65 × 10−3
METPkg 1.4-DCB2.68 × 10−23.19 × 10−34.83 × 10−2
MEPkg N eq3.65 × 10−43.61 × 10−54.31 × 10−4
MSPkg Cu eq2.64 × 10−32.60 × 10−43.10 × 10−3
OFHPkg NOx eq1.62 × 10−31.30 × 10−41.34 × 10−3
OFTPkg NOx eq1.66 × 10−31.33 × 10−41.40 × 10−3
ODPkg CFC11 eq6.45 × 10−75.11 × 10−83.86 × 10−7
TAPkg SO2 eq1.37 × 10−31.24 × 10−41.68 × 10−3
TETPkg 1.4-DCB2.09 × 1002.43 × 10−13.57 × 10⁻⁷
WCPm35.51 × 10−31.50 × 10−31.43 × 10−2
Table 5. Characterized ReCiPe Midpoint (H) annual impacts for co-products of each phase at the Tigusto Company (inventories and total products from Table A1, Table A2 and Table A3; exergy allocation according to Table 1; F.U. 1 kg or 1 L of each co-product).
Impact CategoryReference UnitStraw
(1 kg)
Hulls
(1 kg)
Okara
(1 kg)
Whey
(1 L)
PMFPkg PM2.5 eq4.56 × 10−42.33 × 10−41.17 × 10−44.44 × 10⁻⁶
FSPkg oil eq6.61 × 10−23.29 × 10−21.64 × 10−21.33 × 10⁻³
FETPkg 1.4-DCB3.95 × 10−38.06 × 10−35.40 × 10−32.49 × 10⁻⁴
FEPkg P eq3.86 × 10−53.72 × 10−52.26 × 10−59.62 × 10⁻⁷
GWPkg CO2 eq2.22 × 10−11.14 × 10−15.71 × 10−22.88 × 10⁻³
HCTPkg 1.4-DCB5.51 × 10−34.37 × 10−32.55 × 10−31.18 × 10⁻⁴
HNTPkg 1.4-DCB1.44 × 10−11.44 × 10−18.82 × 10−23.70 × 10⁻³
IRPkBq Co-60 eq6.77 × 10−34.80 × 10−23.44 × 10−21.65 × 10⁻³
LUPm2a crop eq8.73 × 10−33.44 × 10−31.50 × 10−33.14 × 10⁻⁵
METPkg 1.4-DCB4.57 × 10−31.04 × 10−27.01 × 10−33.26 × 10⁻⁴
MEPkg N eq2.05 × 10−41.41 × 10−47.93 × 10−52.91 × 10⁻⁶
MSPkg Cu eq1.50 × 10−31.02 × 10−35.71 × 10−42.10 × 10⁻⁵
OFHPkg NOx eq1.48 × 10−36.26 × 10−42.85 × 10−49.03 × 10⁻⁶
OFTPkg NOx eq1.51 × 10−36.41 × 10−42.93 × 10−49.46 × 10⁻⁶
ODPkg CFC11 eq6.02 × 10−72.49 × 10−71.12 × 10−72.61 × 10⁻⁹
TAPkg SO2 eq9.93 × 10−45.31 × 10−42.72 × 10−41.13 × 10⁻⁵
TETPkg 1.4-DCB4.53 × 10−18.06 × 10−15.33 × 10−12.41 × 10⁻²
WCPm32.46 × 10−32.13 × 10−33.30 × 10−39.65 × 10⁻⁵
Table 6. Comparison of ReCiPe Midpoint (H) characterized results of conventional and organic tofu production (F.U. 25,000 kg of the product). Higher impacts highlighted in bold font.
Impact CategoryReference UnitTigusto Organic TofuConventional Tofu
PMFPkg PM2.5 eq1.64 × 1012.50 × 101
FSPkg oil eq4.90 × 1035.08 × 103
FETPkg 1.4-DCB9.23 × 1024.50 × 102
FEPkg P eq3.56 × 1004.61 × 100
GWPkg CO2 eq1.06 × 1041.49 × 104
HCTPkg 1.4-DCB4.37 × 1024.67 × 102
HNTPkg 1.4-DCB1.37 × 1041.43 × 104
IRPkBq Co-60 eq6.11 × 1031.39 × 104
LUPm2a crop eq1.16 × 1021.53 × 102
METPkg 1.4-DCB1.21 × 1034.51 × 102
MEPkg N eq1.08 × 1012.18 × 101
MSPkg Cu eq7.75 × 1017.09 × 101
OFHPkg NOx eq3.34 × 1013.85 × 101
OFTPkg NOx eq3.50 × 1013.99 × 101
ODPkg CFC11 eq9.66 × 10−31.15 × 10⁻¹
TAPkg SO2 eq4.19 × 1019.23 × 101
TETPkg 1.4-DCB8.92 × 1042.04 × 104
WCPm33.57 × 1024.66 × 103
Table 7. Comparison of ReCiPe Midpoint (H) normalized impacts from meat, snails and organic tofu production (F.U. 1 kg of meat, 1.62 kg of snails vs. 1.24 kg of organic tofu).
Impact CategoryTofu 1.24 kgSnails 1.62 kgMeat 1 kg
PMFP3.19 × 10−55.62 × 10−58.97 × 10−4
FSP2.48 × 10−41.21 × 10−49.33 × 10−3
FETP3.73 × 10−26.43 × 10−36.98 × 10−1
FEP2.72 × 10−41.91 × 10−44.97 × 10−3
GWP6.61 × 10−56.07 × 10−53.92 × 10−3
HCTP7.83 × 10−34.55 × 10−32.72 × 10−1
HNTP4.56 × 10−31.29 × 10−29.16 × 10−2
IRP6.31 × 10−46.71 × 10−51.63 × 10−3
LUP9.35 × 10−76.22 × 10−72.29 × 10−5
METP5.80 × 10−21.04 × 10−21.05 × 100
MEP1.16 × 10−44.01 × 10−41.41 × 10−1
MSP3.20 × 10−81.84 × 10−81.24 × 10−6
OFHP8.05 × 10−57.08 × 10−51.86 × 10−3
OFTP9.77 × 10−58.41 × 10−52.23 × 10−3
ODP8.00 × 10−69.41 × 10−56.41 × 10−3
TAP5.07 × 10−51.92 × 10−41.47 × 10−3
TETP4.27 × 10−37.28 × 10−43.62 × 10−2
WCP6.64 × 10−55.49 × 10−41.43 × 10−2
TOTAL1.14 × 10−13.69 × 10−22.34 × 100
Table 8. Comparison of characterized impacts of in-house generated electricity compared with grid electricity mix and in-house photovoltaic production (F.U. 1 kWh of electricity product) (*).
Impact CategoryReference UnitElectricity from WasteGrid ElectricityPhotovoltaic Electricity
PMFPkg PM2.5 eq3.29 × 10−41.07 × 10−41.95 × 10−4
FSPkg oil eq4.77 × 10−23.36 × 10−22.05 × 10−2
FETPkg 1.4-DCB2.85 × 10−33.26 × 10−32.24 × 10−2
FEPkg P eq2.79 × 10−57.51 × 10−56.38 × 10−5
GWPkg CO2 eq1.60 × 10−11.19 × 10−17.87 × 10−2
HCTPkg 1.4-DCB3.97 × 10−35.18 × 10−36.58 × 10−3
HNTPkg 1.4-DCB1.04 × 10−18.16 × 10−23.02 × 10−1
IRPkBq Co-60 eq4.89 × 10−36.34 × 10−11.10 × 10−2
LUPm2a crop eq6.30 × 10−34.33 × 10−44.84 × 10−4
METPkg 1.4-DCB3.30 × 10−34.51 × 10−32.94 × 10−2
MEPkg N eq1.48 × 10−47.62 × 10−45.03 × 10−5
MSPkg Cu eq1.08 × 10−37.02 × 10−41.47 × 10−3
OFHPkg NOx eq1.07 × 10−31.65 × 10−42.13 × 10−4
OFTPkg NOx eq1.09 × 10−31.68 × 10−42.23 × 10−4
ODPkg CFC11 eq4.34 × 10−71.42 × 10−74.70 × 10−8
TAPkg SO2 eq7.17 × 10−42.65 × 10−44.96 × 10−4
TETPkg 1.4-DCB3.27 × 10−12.37 × 10−12.25 × 100
WCPm31.77 × 10−36.46 × 10−32.83 × 10−3
(*) Lower impacts are highlighted as Italics; larger impacts as bold; regular font is used for intermediate results.
Table 9. Comparison of ReCiPe Midpoint (H) characterized impacts of tofu production under three proposed patterns (conventional, PV-electricity organic, circular waste-electricity organic). F.U.: Annual production of 25,000 kg of tofu, as in Tigusto Company. (*).
Impact CategoryReference UnitConventional Tofu ProductionPV-Electricity Organic Tofu ProductionCircular Scenario: Waste-Electricity Organic Tofu Production
PMFPkg PM2.5 eq2.50 × 1011.64 × 1011.01 × 101
FSPkg oil eq5.08 × 1034.90 × 1033.70 × 103
FETPkg 1.4-DCB4.50 × 1029.23 × 1022.60 × 102
FEPkg P eq4.61 × 1003.56 × 1001.08 × 100
GWPkg CO2 eq1.49 × 1041.06 × 1046.96 × 103
HCTPkg 1.4-DCB4.67 × 1024.37 × 1022.00 × 102
HNTPkg 1.4-DCB1.43 × 1041.37 × 1044.65 × 103
IRPkBq Co-60 eq1.39 × 1046.11 × 1032.11 × 102
LUPm2a crop eq1.53 × 1021.16 × 1021.06 × 102
METPkg 1.4-DCB4.51 × 1021.21 × 1033.36 × 102
MEPkg N eq2.18 × 1011.08 × 1012.83 × 100
MSPkg Cu eq7.09 × 1017.75 × 1013.17 × 101
OFHPkg NOx eq3.85 × 1013.34 × 1012.62 × 101
OFTPkg NOx eq3.99 × 1013.50 × 1012.75 × 101
ODPkg CFC11 eq1.15 × 10−19.66 × 10−37.44 × 10−3
TAPkg SO2 eq9.23 × 1014.19 × 1012.54 × 101
TETPkg 1.4-DCB2.04 × 1048.92 × 1042.62 × 104
WCPm34.66 × 1033.57 × 1022.18 × 102
(*) Lower impacts are highlighted as Italics; larger impacts as bold; regular font is used for intermediate results.
Table 10. Comparison of ReCiPe Midpoint (H) normalized impacts of tofu production under three proposed patterns (conventional, PV-based organic, circular biomass-based organic). F.U.: Annual production of 25,000 kg of tofu, as in Tigusto Company. (*).
Impact CategoryConventional Tofu ProductionPV-Electricity
Organic Tofu Production
Circular Scenario:
Waste-Electricity Organic Tofu Production
PMFP9.78 × 10−16.43 × 10−13.95 × 10−1
FSP5.18 × 1005.00 × 1003.77 × 100
FETP3.66 × 1027.52 × 1022.12 × 102
FEP7.10 × 1005.48 × 1001.67 × 100
GWP1.87 × 1001.33 × 1008.71 × 10−1
HCTP1.69 × 1021.58 × 1027.23 × 101
HNTP9.59 × 1019.19 × 1013.12 × 101
IRP2.88 × 1011.27 × 1014.39 × 10−1
LUP2.48 × 10−21.88 × 10−21.72 × 10−2
METP4.37 × 1021.17 × 1033.25 × 102
MEP4.74 × 1002.34 × 1006.14 × 10−1
MSP5.91 × 10−46.46 × 10−42.64 × 10−4
OFHP1.87 × 1001.62 × 1001.27 × 100
OFTP2.25 × 1001.97 × 1001.55 × 100
ODP1.93 × 1001.61 × 10−11.24 × 10⁻¹
TAP2.25 × 1001.02 × 1006.20 × 10−1
TETP1.97 × 1018.61 × 1012.53 × 101
WCP1.75 × 1011.34 × 1008.17 × 10−1
TOTAL1.16 × 1032.29 × 1036.79 × 102
(*) Lower impacts are highlighted as Italics; larger impacts as bold; regular font is used for intermediate results.
Disclaimer/Publisher’s Note: The statements, opinions and data contained in all publications are solely those of the individual author(s) and contributor(s) and not of MDPI and/or the editor(s). MDPI and/or the editor(s) disclaim responsibility for any injury to people or property resulting from any ideas, methods, instructions or products referred to in the content.

