Article

Recycling, Material Flow, and Recycled Content Demands of Polyethylene Terephthalate (PET) Bottles towards a Circular Economy in Korea

Department of Environmental Engineering, Chungnam National University, Daejeon 34134, Republic of Korea
*
Author to whom correspondence should be addressed.
Environments 2024, 11(2), 25; https://doi.org/10.3390/environments11020025
Submission received: 28 October 2023 / Revised: 16 January 2024 / Accepted: 22 January 2024 / Published: 25 January 2024

Abstract

:
The recycling and proper management of PET bottles is needed to avoid plastic pollution, as well as to achieve a plastic circular economy. In this study, we examined the recycling system of PET bottles and their material flows by life cycle, from production to recycling and disposal under different scenarios with reduced consumption for PET bottles. In Korea, PET bottle recycling has been managed by the extended producer responsibility system since 2003. As of 2021, annual usage of PET bottles per capita in Korea was estimated to be approximately 6.5 kg. The recycling rate of PET bottles after collection was determined to be 79% in 2021. However, recycled PET (or r-PET) from mechanical recycling is mostly used in low-grade PET applications such as short fibers, bands, and sheets. More than 112 thousand tons of r-PET chips would be needed to meet the 30% recycled content requirement in PET bottles in 2030 by regulation. Thus, there is an urgent need for high-quality secondary raw materials (i.e., food-grade) by adopting advanced sorting and recycling technologies for PET bottles with recycled content. PET bottle-to-bottle recycling practices can ensure the production of high-quality recycled materials and move Korea toward a plastic circular economy.

1. Introduction

Plastic products made from refining crude oil are prevalent in our daily lives, including transportation, construction and buildings, electronics, and consumer products. Global plastic production reached 400.3 million tons in 2022, which is more than 200-fold compared to 1.5 million tons in 1950 [1,2]. It is expected that the global production of plastics will continue to increase and will reach 1800 million tons by 2050 [3]. Plastics production in Europe was 57.2 million tons in 2021. Packaging showed the highest demand among plastic products, accounting for 39.1% [4]. In the case of Korea, total production of major thermoplastics was 9.58 million tons in 2018. Household items accounted for a majority of 45.3%, followed by construction materials (21.8%) and packaging materials (10.6%) [5].
Plastic has gained a lot of attention in packaging materials for food, automotive production, and shipping due to its competitive price, lightness, ease of use, and resistance to corrosive and structural properties [6,7]. Globally, plastic packaging accounts for approximately 70% of the consumer products market share [8]. Since the use of plastic packaging materials with relatively short lifespans has continually increased, larger amounts of such plastic waste tend to be generated from municipal waste streams after consumers’ consumption. As of 2019, packaging was the most important sector in both plastic consumption (33%) and post-consumer plastic waste (49%) in the EU [9]. Furthermore, recent statistics revealed that approximately 16 million tons of plastic packaging waste was generated in 2020 [10]. Korea generated 3.0 million tons of such waste from households in 2017, which was mainly treated by incineration [6].
Among plastic packaging materials, PET (polyethylene terephthalate) has been used as one of the major materials for the manufacture of drinking bottles. Globally, total production of PET resin exceeded 24 million tons and is expected to continue to increase [4]. In 2018, the EU generated approximately 4.3 million tons of rigid PET packaging. Of these, 79% (3.4 million tons) were bottles and the remainder were trays [11]. PET bottles, made from PET resins, are easier to transport and handle than other packaging materials and have good durability against chemicals, as well as significant gas barrier properties. PET bottles were first introduced as a carbonated beverages container in the United States in 1977; since then, they have been widely used for beverage bottles around the world [12]. However, PET bottles are commonly intended for single-use packaging and are disposed of immediately after use. [8]. Mismanagement of single-use plastic waste, including PET bottles, can cause environmental problems such as greenhouse gas emissions and marine pollution due to improper disposal on beaches and rivers. The United Nations Environment Assembly adopted the ‘Resolution on Marine Plastic Waste and Microplastics’ in 2014 and 2016. The United Nations Environment Program aims to prevent and dramatically reduce all types of marine waste by 2025. A working group was established to prepare calls for action and develop international binding measures on plastic pollution. Furthermore, studies on the generation and distribution of plastic waste have been actively performed in the marine environment and rivers across the world. As microplastics in the marine ecosystem are emerging as global contaminants, the need to extend plastic debris research and improve waste management has been discussed in recent research [13,14]. Mathalon et al. [15] conducted research on the quantification of microplastic fibers in sediments of the beaches and marine organisms in Nova Scotia’s eastern shore. Martins et al. [16] pointed out the need to focus on microplastics sized < 5 mm when it comes to marine debris pollution. Claessens et al. [17] investigated the occurrence and distribution of microplastics and showed the wide distribution of microplastics in Belgian coastal waters. Furthermore, research on the effect of fisheries to marine plastic litter, including fishing gears, carry bags, and others, was conducted to emphasize the importance of sustainable use of the ocean’s resources [18]. In the case of Korea, hard plastic and styrofoam were the dominant types among mesoplastic marine debris (5~25 mm) on 20 beaches, according to research conducted in 2017 [19]. Based on a recent survey on marine litter in 2022 (from 60 sites monitored in Korea), plastic waste constituted the largest share (91%) of total marine litter found. The plastics commonly found in the study included PET bottles and lids, plastic ropes and strings, shredded plastic particles, expanded polystyrene, plastic bags, food containers, and cigarette butts [20]. This indicates that waste PET bottles generated from municipalities must be reduced and properly collected to avoid marine pollution as one of the significant plastic wastes.
In order to identify the proper methods and treatment of PET plastics, many previous studies conducted the analyses of material flows for PET bottles. For example, Smith et al. [21] conducted a material flow analysis of PET resin in the USA. Furthermore, some solutions for barriers in PET collecting, sorting, and recycling steps were suggested. Schmidt et al. [22] analyzed the material flow of PET bottles in Austria, Germany, and Serbia to reveal the relation between material efficiency and environmental impacts. Eygen et al. [23] analyzed the material flow of plastic packaging and proposed raising the recycling target rate to promote the recycling of resources in plastic packaging. Millette et al. [24] suggested that a material flow analysis of plastic can be applied as valuable data for policy decision makers on circular economy development. However, research on the quantitative analysis of PET is insufficient in Korea due to the lack of relevant statistics and information. Furthermore, there are many challenges faced by the PET recycling industry, owing to a price drop of recycled PET resin, difficulties in sorting and recycling various designs of PET products (e.g., color, plastic composite), and politico-economic trends around the world such as China’s plastic waste import ban in 2018.
This study examined the current recycling and management practices for PET bottles through the extended producer responsibility (EPR) system in Korea. Material flow analysis of PET bottles from production to disposal was conducted to elucidate detailed treatment methods by life cycle stage. We also examined the future consumption of PET bottles by 2040, along with the demand for recycled materials by scenario analysis with assumptions. Finally, challenges and future efforts of PET recycling were discussed to move towards a plastic circular economy in Korea.

2. Methodology

2.1. Data Acquisition

Statistical data of PET bottle market were collected from the Korea Ministry of Environment (Korea MOE), Korea Environment Corporation (KECO), and Korea Resource Circulation Service Agency (KORA) (Table 1). Relevant data were acquired from official research reports and informal statistical data sources. In addition, site visits to recycling facilities of PET and other plastics were made to collect information regarding the recycling processes and recycled PET flakes markets status. Furthermore, interviews with experts and relevant stakeholders (e.g., PET production, recycling industry, Korea MOE, KECO, and KORA) were conducted to discuss current issues and challenges associated with PET recycling and circular economy in Korea.

2.2. Methodology for MFA

Material flow analysis (MFA) of PET bottles in Korea for the year 2021 was performed by life cycle stages (i.e., production, consumption, generation, recycling, and treatment). Data for material flow analysis of PET bottles were obtained from various sources. Table 2 shows the sources of collected PET bottle data through its life cycle. Research reports were also critically reviewed to verify collected data. Some unknown data (e.g., disposal rate, generation of PET) were assumed based on interviewing industry experts. The sales volume was collected using the data of the Korea Resource Circulation Service Agency (KORA) [25]. It was assumed that all domestic sales volumes of PET bottles in 2021 were immediately consumed, and all of those were generated into PET plastic waste within a year. The amount of PET bottles discharged from households, non-households, and disposable bags was calculated according to the fraction generated in sectors, presented in the 5th National Waste Statistical Survey by Korea MOE [26]. The wastes that were uncollected or flowed into the marine ecosystem were estimated by subtracting the collection amount from total production. However, detailed amounts by categories were unknown due to the absence of data. The ratios collected and sorted by private and public-owned recycling facilities were obtained from a previous study [27]. The total amount of PET bottles treated by landfill or incineration was calculated, referring to the amount of PET bottles recycled and the fraction of foreign materials during the waste sorting process. Furthermore, the ratios of incineration (46%) or landfill (54%) of PET were collected from the 5th National Waste Statistical Survey [26].

2.3. Scenario Analysis for Demands for Recycling Material in PET Bottles

According to the Plastic Elimination Measures for the Whole Cycle in 2022, the aim is to cut generation of waste plastic to 20% by 2025 compared to 2021 and to foster the recycled material industry [28]. Subsequently, a revision of recycling guidelines for designated recycling businesses was followed. To facilitate the recycling of plastic and use of recycled material, manufacturers who produce more than 10,000 tons of plastic PET per year are required to utilize 3 percent recycled plastic by 2023 [29]. It is a relatively weak regulation compared to the EU, because the EU set a mandatory recycled content target for plastic beverage bottles of 30% by 2030 and 65% by 2040 [30]. The viable option would be a reduction in PET bottle consumption, eventually diminishing the total amount of waste plastic generation. Furthermore, beefing up the mandatory recycled content for PET bottles can lead to boosting closed-loop recycling. The consumption amount of PET bottles between 2003 and 2021 was collected using the data of the Korea Resource Circulation Service Agency (KORA) [25]. And to predict consumption amounts until 2040, five mathematical models (linear model, arithmetic series, least square method, logistic model, and Gompertz model) were considered. ‘Linear’ is a model that predicts based on a linear relationship between a dependent variable and one or more independent variables. ‘Arithmetic series’ is a model that is ideal for showing stable growth rate. ‘Least square method’ is a model that is ideal for showing large fluctuations in growth rate. ‘Logistic’ is a model that initially shows low growth rate, then increases rapidly after a period of time, and then slows down to maintain a constant number (converging on a threshold). ‘Gompertz’ is a model that represents a growth cycle as an S-curve [31]. The detailed equations of each model are displayed in Supplementary Table S1 (see Supplementary Materials). So as to take account of all five models, arithmetic mean values of the models were used for the consumption amounts of each year. Considering future plans and policy changes in Korea, we set four scenarios based on two assumptions: 1. Reducing PET bottle consumption by 2040 compared to BAU. 2. Setting mandatory recycled content in PET bottles. Of these, assumption 1 was applied differently to each scenario. Depending on the reduction rate compared to BAU, a pessimistic (S1), moderate (S2), optimistic (S3), and best (S4) scenario was made. However, assumption 2 was applied the same to all scenarios. Considering Korea’s capacity of using r-PET material in PET bottles and other countries’ targets, we assumed the use of recycled material in the production of PET bottles to be 30% in 2030 and 40% in 2040 (Table 3).

3. Results and Discussion

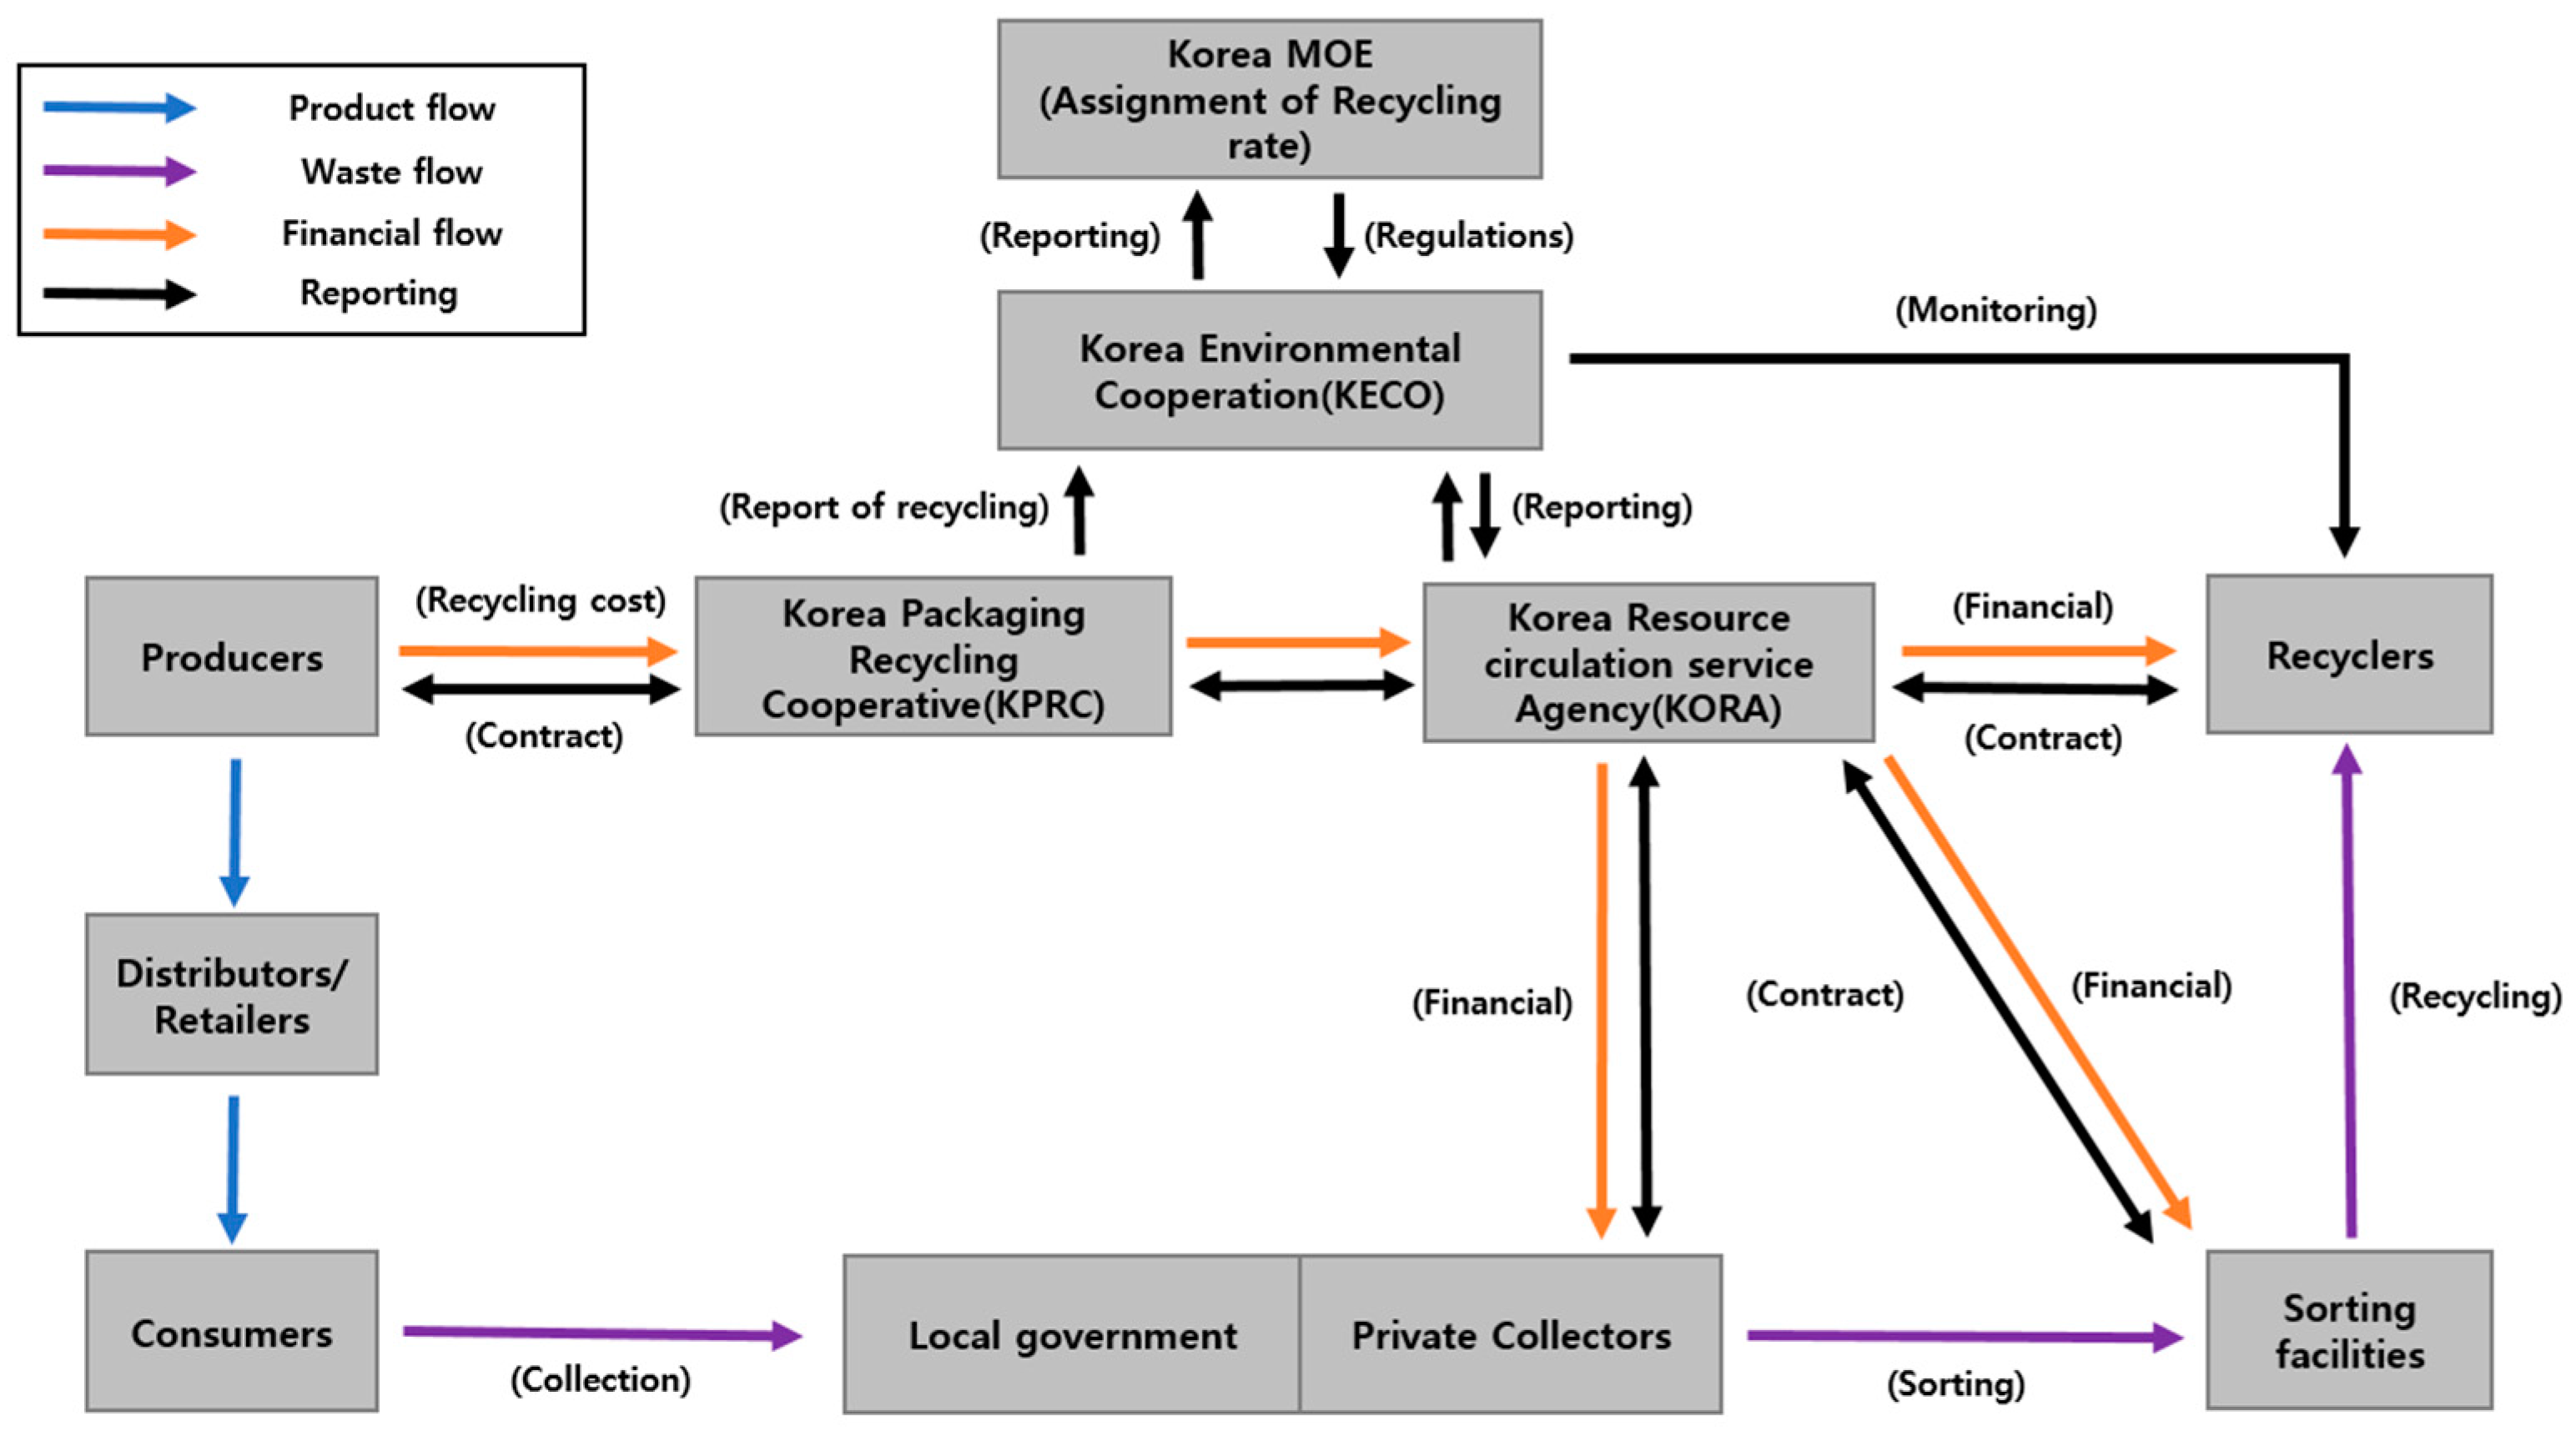
3.1. Results and Management System of PET Bottle Recycling by EPR

By the regulations of the extended producer responsibility (EPR) system in Korea, producers and importers of packaging materials and products must pay a recycle support fee based on the classification of certain percentages of their annual production. Every year, the Korea MOE sets a mandatory recycling rate for each category of product controlled under the EPR system. Any producer or importer that fails to achieve their targets is obliged to pay an additional recycling fee to make up the shortfall. Mandatory recycling items by EPR include several types of packaging materials, including metal cans, glass bottles, paper cartons, and PET bottles, plastic composite films, and expanded polystyrene (EPS). These packaging materials are used to pack food and beverages, for agriculture, fishery, and livestock products, cleansers, medicines, and cosmetics. Plastic types for packaging materials include polyethylene (PE), polypropylene (PP), polystyrene (PS), polyethylene terephthalate (PET), polyvinyl chloride (PVC), and foamed synthetic resin [32,33]. As of 2023, the recycling rate targets of PET bottles are set at 80.0% for colorless PET bottles, 83.4% for colored PET bottles, and 85.6% for composite (or composed of more than one constituent material) PET bottles [33].
Figure 1 shows the material and financial flows of the EPR system in Korea. In the case of packaging materials, product producers using packaging materials pay a collecting and recycling cost to the KPRC (Korea Packaging Recycling Cooperative, collective PRO) according to the amount of packaging materials manufactured. The KPRC provides the cost as subsidies to recycling and collection companies through KORA (Korea Resource Circulation Service Agency). The collection and recycling costs are determined by the government and vary each year [32,33]. As of 2023, EPR fees for PVC packaging material are the highest at a rate of USD 723/ton, followed by USD 287/ton for composite PET bottles. EPR fees for colorless PET bottles and colored PET bottles are USD 112/ton and USD 187/ton, respectively. The lowest-rate item is glass bottles at USD 30/ton [34].
In 2020, Korea MOE developed new guidelines for eco-friendly PET bottle manufacturing to improve its recycling performance during treatment processes. Since 2020, only colorless PET bottles have been permitted on the market, and labels for PET bottles have been recommended to be used only if consumers can easily remove them. It is recommended to use alkali-soluble adhesive for labels that are glued onto PET bottles, such as roll-on, sheet and glue-type labels, and the parts applied with adhesive (less than 10% for sleeve-type labels and less than 60% for sticker-type labels) are also recommended to be minimized. And a label with less than 1.0 of specific weight is preferred so that it can be easily separated from the bottle during pneumatic and washing processes [35]. Furthermore, an EPR fee modulation for packaging is applied, according to its recyclability. Packaging is classified into “best for recycling”, “excellent for recycling”, “normal for recycling”, and “difficult for recycling” based on its material and structure. For instance, composite PET bottles or bottles with labels of a specific weight value over 1.0 and hard to remove by consumers are regarded as “difficult to recycle”. Packaging materials that are assessed as “difficult for recycling” must indicate the recyclability information on the outside of the packaging. Producers or importers of packaging material with lower recyclability are required to pay a 10~20% higher EPR fee and especially 20% for PET bottles [36,37].
Figure 2 shows the sales (domestic demand)·imports volume, recycling rate target, and actual recycling amounts of PET bottle between 2003 and 2021. The target recycling rates of PET bottles were mostly achieved over these years under the EPR system. However, in the case of colorless PET bottles, actual recycling amounts were less than that set as the target rate in 2016 and 2017 [25].
Waste plastics and other packaging materials, including PET bottles, are generally source-separated and discharged by households through the municipal solid waste streams. However, wastes are thrown into pay-as-you-go (or disposable) bags occasionally and transported to incineration facilities and landfills [6]. In 2022, Korea MOE implemented a separate collection system for colorless PET bottles at the household level, which was for better recycling [38]. The collected PET bottles have been sent to private or public–owned sorting facilities and sorted into colorless, colored, and composite PET bottles, and other recyclable resources (caps and labels). Non-recyclable materials have been transferred to waste treatment facilities such as incinerators for disposal or fuel conversion in the form of solid refuse fuels for waste-to-energy. Then, sorted PET bottles by color have been transported to mechanical recycling facilities to be converted as secondary raw materials [39].

3.2. Material Flows of PET Bottles

3.2.1. Results of Material Flow of PET Bottles in Korea

The results of the material flow analysis for PET bottles conducted in this study are shown in Figure 3. The material flow charts were divided into four stages (production, domestic use, discharge and collection, and recycling). The total amount of PET bottles distributed in Korea was approximately 340,000 tons in 2021. We assumed that all PET bottles were thrown away after single use. Among the amount of the collected PET bottles (281,000 tons), 268,000 tons were recycled, and the remaining waste PET bottles were treated by incineration or landfill [25]. Of the 268,000 tons recycled, most of the recycled PET bottles were used as low-grade raw materials such as short fibers and laces; only 10~15% were used as high-grade raw materials such as long fibers for clothing [40]. The rate of collection and sorting compared to PET bottles used in Korea was 84.8%, and the recycling rate was 65% in 2021.

3.2.2. Comparison of PET Bottle Recycling in Korea, Japan, and EU

Table 4 shows a comparison of PET consumption and recycling in Korea, Japan, and the EU. In 2021, 581 thousand tons of PET bottles were sold in Japan. A total of 163 thousand tons of waste PET bottles was imported and 478 thousand tons for domestic use was collected, which was 110% of the sales volume. It was found that 500 thousand tons of PET bottles were recycled. This was equivalent to 86% of the total sales volume. In addition, the amount of bottle-to-bottle recycling reached 117.6 thousand tons (33.1%), the amount used as a sheet was 120.2 thousand tons (33.8%), the amount used as fibers was 64.5 thousand tons (18.1%), and the amount used in molded products was 8.2 thousand tons (2.3%) [41]. In the case of the EU, 3600 thousand tons of PET bottles were used in 2020. Of these, approximately 2200 thousand tons was collected and sorted for recycling, and the majority (>72%) of those bottles were clear and light blue colored ones. The total amount of PET bottles recycled accounts for 62% of the total sales volume [42].
As a result, Korea showed the highest value in the recycle amount of PET bottles per capita, while the EU showed the highest value in usage amount of PET bottles per capita. Assuming the population of the EU as 448 million and the weight of a PET bottle as approximately 18 g, it was estimated that one person on average consumed 440 PET bottles in 2020. Compared to Korea (per capita consumption in 2020: 109 PET bottles) [43], it has the value greater by three times. Japan showed the highest recycling rate of 86%, followed by Korea (79%) and the EU (62%). Among the three countries, Korea ranked the second largest in terms of collection (84.8%) and recycling rate (79.0%). Furthermore, Japan and the EU showed a high ratio in food-grade recycled PET of total r-PET resin, compared to Korea. Over 50% of PET resin was used as high-grade PET resin such as long fibers, while Korea showed a value below 20%.

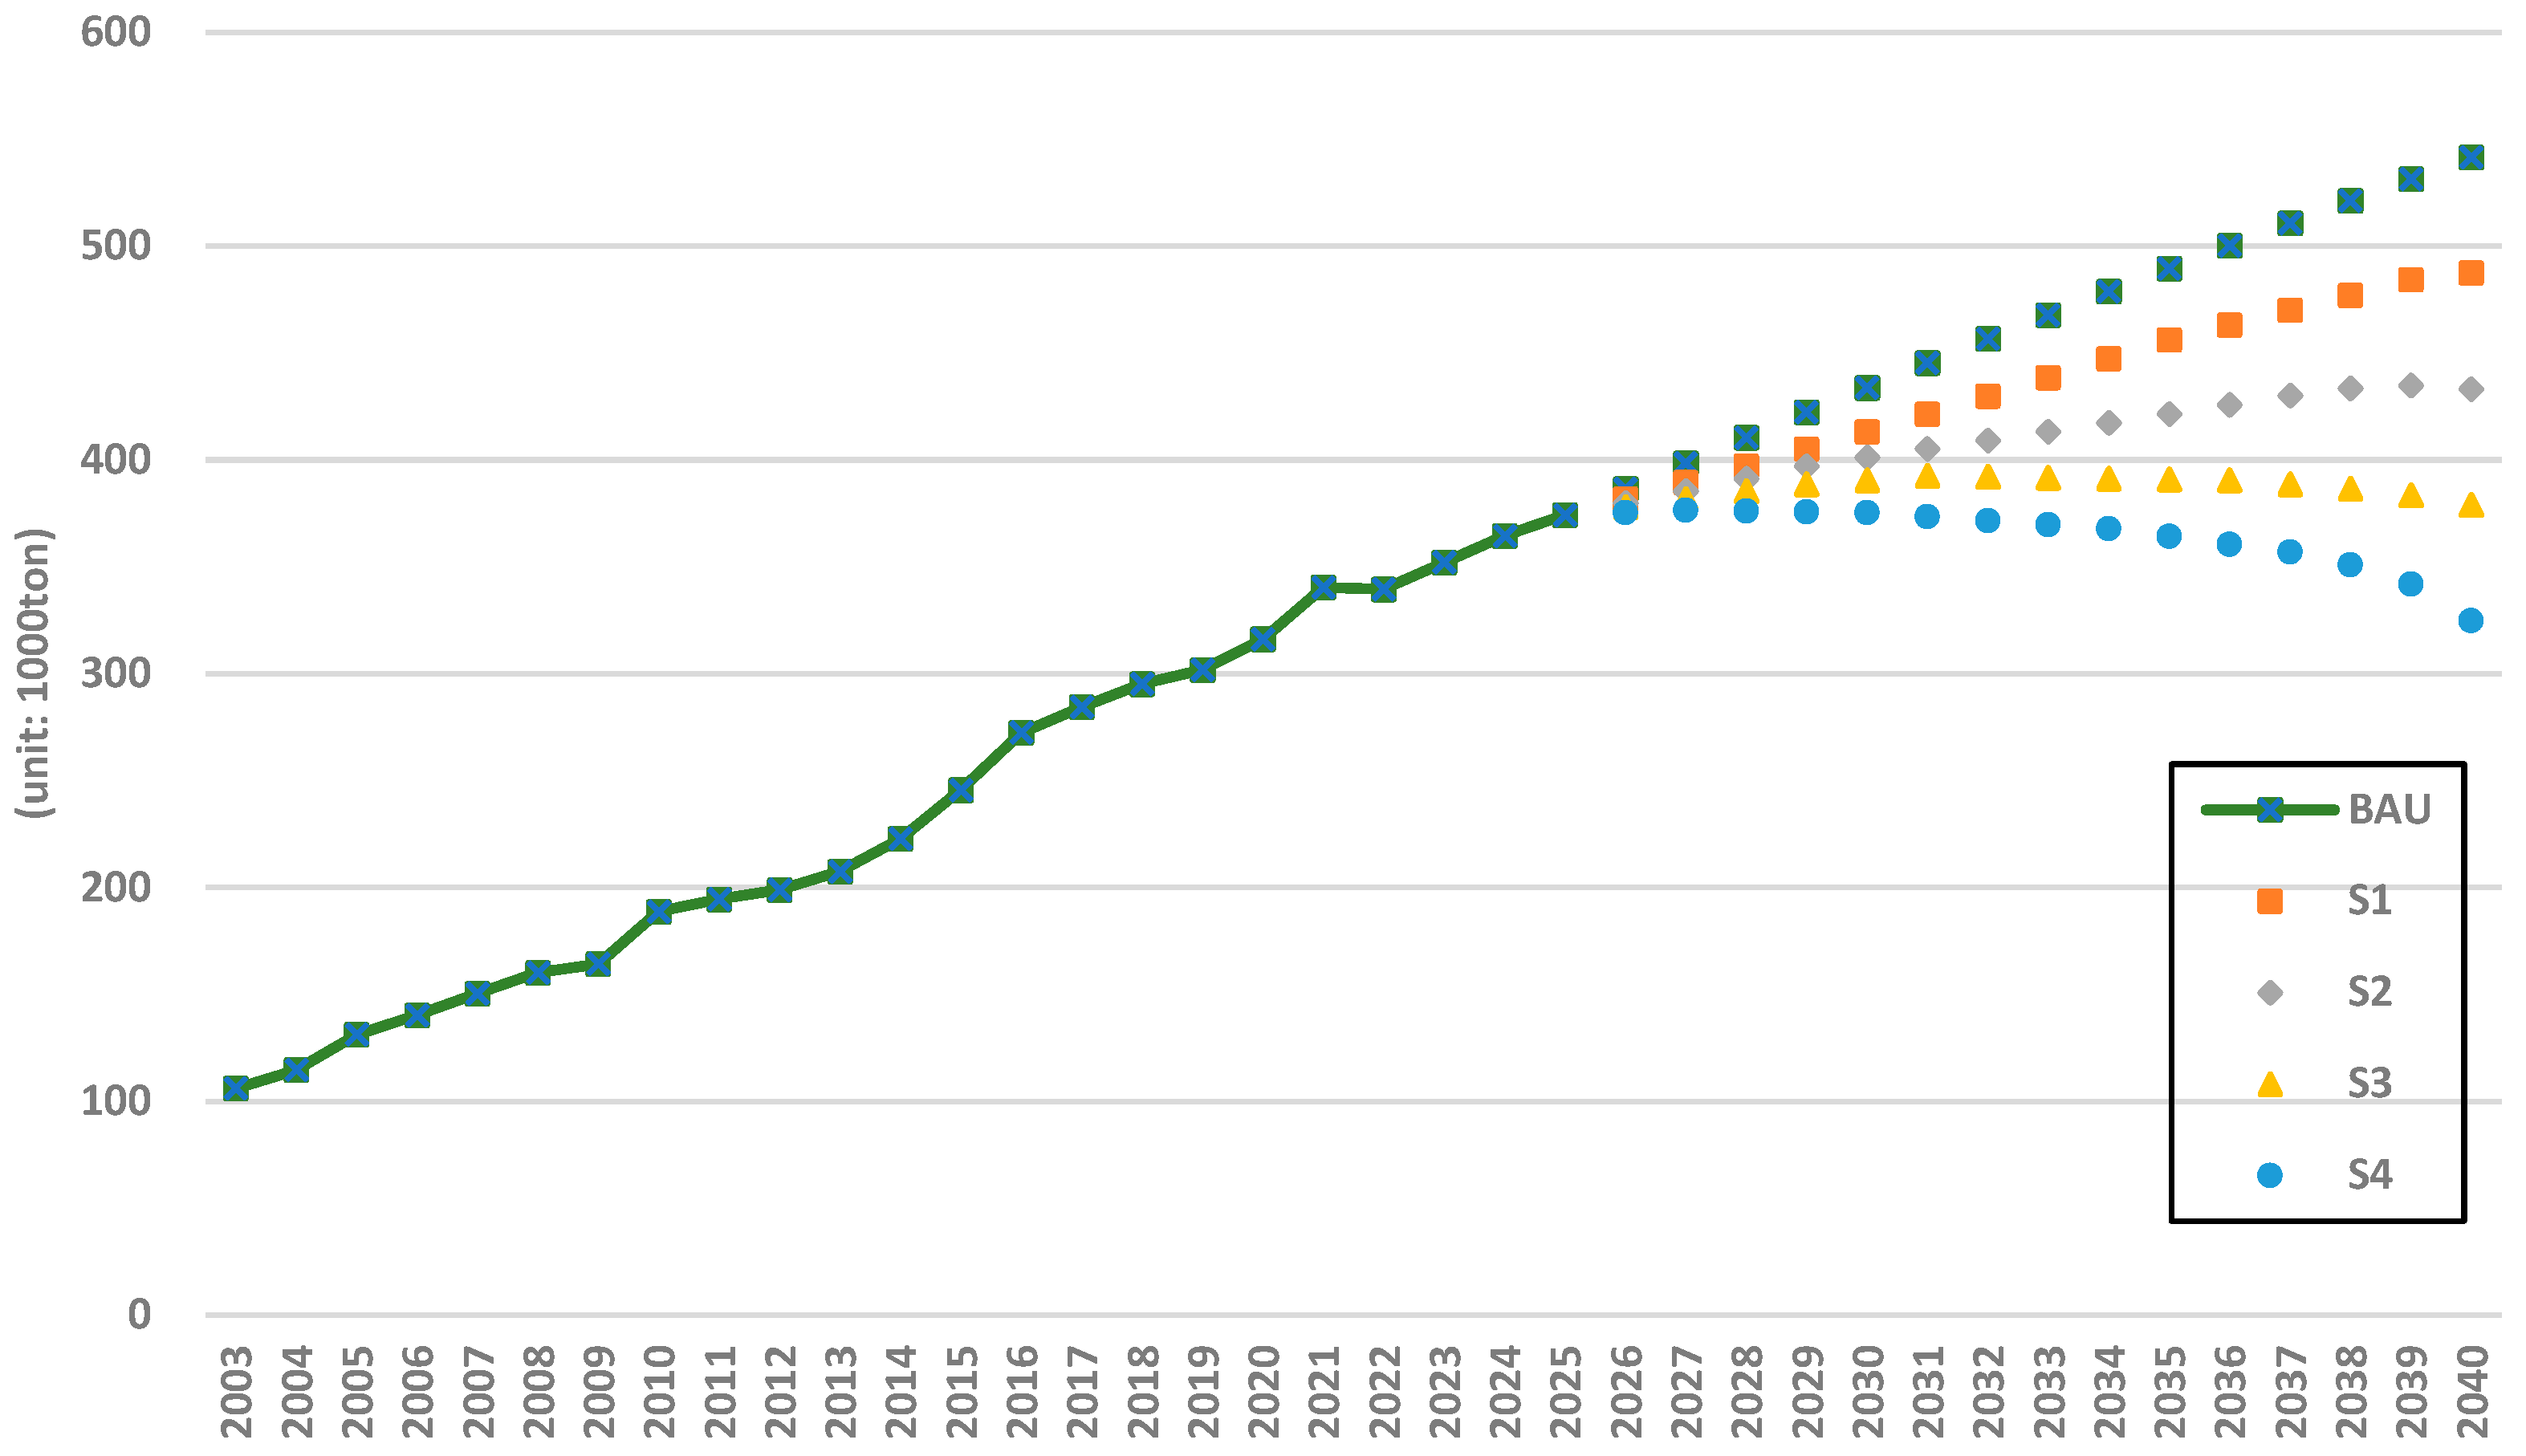
3.3. Predicted Demands for PET Recycling Materials in 2030 and 2040

3.3.1. Consumption Demands for PET Bottles

Figure 4 presents the predicted consumption demand for PET bottles between 2022 and 2040 by scenario. In 2022, a total of 328 thousand tons of PET bottles was sold [25]. Under the BAU scenario, the market demand for PET bottles will increase steadily, and it is estimated to reach 434 thousand tons in 2030 and 542 thousand tons in 2040. Under Scenarios 1 and 2, the growth rate of PET bottle consumption showed slight decrease compared to BAU. It was predicted to be 413 thousand tons and 401 thousand tons in 2030, and 487 thousand tons and 433 thousand tons in 2040, respectively. Scenario 3 showed relatively constant trends in the consumption of PET bottles. It was predicted to be approximately 391 thousand tons in 2030 and 379 thousand tons in 2040. Scenario 4 was the only one that showed a decreasing trend in PET bottle consumption. It was estimated to be 375 thousand tons in 2030 and 325 thousand tons in 2040, which is similar to the value of PET bottles consumed in 2022.

3.3.2. Predicted Demands for Recycling Materials in PET Bottles

Figure 5 shows the predicted demands on post-consumer recycled PET (PCR or r-PET) in bottles in 2030 and 2040. We assumed that the use of recycled material in the production of PET bottles is to be 30% in 2030 and 40% in 2040, respectively, and all produced-for-food-grade recycled PET resins (i.e., food grade r-PET chips) are distributed domestically for use. There are a total of 24 r-PET flake recycling facilities and only 4 r-PET chip manufacturers available in Korea as of October 2023. Production of r-PET material is expected to continuously increase due to the regulation of mandatory use of recycled material in PET bottles. However, most of the useable-for-food-containers-grade recycled PET materials produced in Korea are currently exported to the USA and Europe. Considering the capacity of r-PET chip manufacturers in Korea, total production for PET bottles is anticipated to be approximately 112 thousand tons in 2030 and 227 thousand tons in 2040, respectively [44,45,46,47].
According to the scenario analysis, the demands of recycled material in the BAU scenario were estimated to be 130 thousand tons and 217 thousand tons in 2030 and 2040, respectively. Under Scenario 4, the r-PET resin demands were predicted to be about 113 thousand tons in 2030 and 130 thousand tons in 2040, which is 13% and 40% lower than the values predicted in BAU. This implies that the supply of recycled material is projected to be insufficient under all scenarios set in 2030. However, the total amount of recycled material production from the four r-PET manufacturers is predicted to meet the target amount required by 2040. Reducing the consumption of PET bottles and increasing the mandatory target of recycled materials can be effective in achieving closed-loop recycling of PET bottles. Furthermore, it is important to ensure a stable supply of the recycled material by product manufacturers and to facilitate the production of r-PET chips for recycling.

3.4. Challenges and Future Direction of PET Bottle Recycling

The consumption of PET bottles has kept increasing over the last 20 years from 106 thousand tons in 2003 to 328 thousand tons in 2022. As we have analyzed, it is expected that the consumption of PET bottles would continually increase up to approximately 500 thousand tons in 2036, if no reduction efforts are made. Reduction in consumption by consumers should be a top priority of plastic management policy. To achieve this goal, prohibition of its production and use and the development of alternatives (i.e., bioplastics) can be applied. Further, providing financial incentives to consumers or producers can lead them to actively participate in the reduction of PET bottle consumption [48,49,50]. In Korea, there is also an ongoing discussion regarding the adoption of a plastic packaging tax, which may more profoundly impact on PET bottle consumption than raising environmental awareness and campaigns for consumers. Single-use plastic bottles can be replaced with reusable bottles. For example, the use of water fountains, refill stations, and reusable cups can be encouraged and supported by local governments and civil societies in many places or events such as public parks, music festivals, sports, and other outdoor activities, by adopting the restricted use or banning of single-use plastics. It is anticipated that the reduction and restricted use of single-use plastics, including PET bottles, would be strengthened by many countries and the international plastic treaty that is in progress and will be ready by the end of 2024, as the United Nations agreed to develop a legally binding agreement on plastic pollution in 2022. Various zero-waste campaigns and education programs in major cities, private sectors, and schools in Korea have been implemented to raise consumers’ awareness of this reduction [51,52].
A life cycle approach to plastic from source separation, sorting, recycling for bottle grade, and use of recycled content in production should be taken to support closed-loop PET recycling. Unlike Germany and Japan, many of the PET bottles collected after use are currently recycled into low-quality-grade products (e.g., short fibers, sheets, or strings) in Korea. Very limited bottle-to-bottle recycling has been established so far. It is reported that less than 11 thousand tons of high-quality secondary raw materials (i.e., food-grade PET bottles) out of recycled PET of 260 thousand tons are available and largely exported to EU countries in 2022 [53]. The Korean government started regulations in regard to the requirement for recycled content in PET bottles at the beginning of 2023 (3% in 2023 and 30% in 2030) [29]. Since all municipalities, by following the government recyclable guidelines, have started source separation of colorless (or clear) PET bottles in collection bins among recyclables (e.g., papers, metal cans, glasses, plastic containers) by households since 1 December 2022 [54], large amounts of used colorless PET bottles are expected to be separately collected and processed for PET recycling. As we analyzed, more than 112 thousand tons of colorless PET bottles are needed for high-quality secondary raw materials to meet 30% recycled content for PET bottles by 2030. There is an urgent need for a stable supply of high-quality secondary raw materials (i.e., food-grade) to be used for recycled content in new PET bottles. A number of PET polymer and packaging manufacturers have already invested and been constructing PET and other plastic recycling facilities for material recovery [55,56]. One of the petrochemical companies adopted chemical recycling technology for PET bottles by depolymerization into monomer subunits using solvolysis or thermolysis. The resulting monomers can be used for chemical feedstock for PET bottle manufacturing. This would ultimately contribute to establish closed-loop PET circularity and conserve the production of virgin PET.

4. Conclusions

In this study, recycling practices and efforts for PET bottles by the EPR in Korea have been discussed and examined over the past almost 20 years. Based on the result of material flow analysis of PET bottles, large amounts of the bottles were effectively collected by local governments with the active participation of consumers and households. More than 79% of collected PET bottles were recycled for material recovery, while 11% and 10% of the bottles were incinerated and landfilled, respectively, in 2021. However, very limited bottle-to-bottle recycling has been established by the current management system in Korea. Since the plastic circular economy is an important agenda of concern around the world, many countries need to set up closed-loop plastic circulation. Furthermore, Korea, EU countries, and other regions started to require recycled content in PET bottles to enhance the plastic circular economy.
By this study, the future consumption rates and recycled content to be required for 30% in 2030 and 40% in 2040 were determined by 2040. It is expected that PET bottle consumption would keep increasing over the next 20 years. The projected consumption in 2040 (550 thousand tons) is more than 61.7% higher than that in 2021, based on the BAU scenario (i.e., no reduction activities are implemented). More than 500 thousand tons of PET bottles waste could be generated and treated after 2035, based on the projection analysis. Thus, the policy priority of the plastic circular economy should be placed on source reduction and reuse options, followed by recycling and safe treatment, as the waste management hierarchy is based on source reduction, reuse, recycling, treatment, and disposal in order. This study also reveals that large amounts of high-quality secondary raw materials are required for recycled content in PET bottles (30% in 2030), ranging from 112 thousand tons to 130 thousand tons. Such results can be used by PET bottle producers to evaluate the supply potential of recycled content of PET. By considering the current level of high-quality secondary raw material, much effort for closed-loop PET circularity should be made in the coming years, including a life cycle approach from production to end-of-life management, increased production of recycled raw materials by material recycling, and chemical recycling of PET bottles.
The limitations of this study include the uncertainty of five mathematical models for predicting PET bottle consumption. Each model predicted the future trends of consumption, and the average values from the five models were used for 2030 and 2040. Second, the predicted results of the consumption and recycled content required by the scenario analysis may be different from those under actual practices in the coming years. A further study is warranted to verify the results of each scenario with the actual amount of recycled content used in PET bottles.

Supplementary Materials

The following supporting information can be downloaded at: https://www.mdpi.com/article/10.3390/environments11020025/s1. Table S1: Five mathematical models and related equations.

Author Contributions

Conceptualization, methodology, and study plan, Y.-C.J. and K.C.; methodology and results, Y.K. and H.S.; data organization and writing—original draft preparation, C.L. and B.K.; writing—review and editing, Y.-C.J. and K.C. All authors have read and agreed to the published version of the manuscript.

Funding

This research received no external funding.

Data Availability Statement

Data are contained within the article and Supplementary Materials.

Acknowledgments

This work was supported by the Korea Ministry of the Environment (Korea MOE) as a waste to energy recycling human resource development project.

Conflicts of Interest

The authors declare no conflicts of interest.

References

  1. Plastics Europe. Plastics—The Fast Facts 2023. Available online: https://plasticseurope.org/knowledge-hub/plastics-the-fast-facts-2023/ (accessed on 1 December 2023).
  2. Statista. Annual Production of Plastics Worldwide from 1950 to 2021. Available online: https://www.statista.com/statistics/282732/global-production-of-plastics-since-1950/?kw=&crmtag=adwords&gclid=CjwKCAiAyp-sBhBSEiwAWWzTnoSzGCATsNn8G6FXT9j13WNWFcQ4jy9lldgaYYb_CzafjudyeUQ78xoCXZYQAvD_BwE (accessed on 1 December 2023).
  3. Nizzetto, L.; Sinha, S. Top Priority to Curb Plastic Pollution: Empowering Those at the Bottom. One Earth. 2020, 2, 11–15. [Google Scholar] [CrossRef]
  4. Plastics Europe. Plastics—The Facts 2022. Available online: https://plasticseurope.org/knowledge-hub/plastics-the-facts-2022/ (accessed on 20 October 2023).
  5. Lee, M.Y.; Cho, N.H.; Lee, S.J.; Um, N.; Jeon, T.W.; Kang, Y.Y. Application of material flow analysis for plastic waste management in the Republic of Korea. J. Environ. Manag. 2021, 299, 113625. [Google Scholar] [CrossRef] [PubMed]
  6. Jang, Y.C.; Lee, G.; Kwon, Y.; Lim, J.H.; Jeong, J.H. Recycling and management practices of plastic packaging waste towards a circular economy in Korea. Resour. Conserv. Recycl. 2020, 158, 104798. [Google Scholar] [CrossRef]
  7. Rahman, M.Z.; Rahman, M.; Mahbub, T.; Ashiquzzaman, M.; Sagadevan, S.; Hoque, M.E. Advanced biopolymers for automobile and aviation engineering applications. J. Polym. Res. 2023, 30, 1–16. [Google Scholar] [CrossRef]
  8. Benyathiar, P.; Kumar, P.; Carpenter, G.; Brace, J.; Mishra, D.K. Polyethylene Terephthalate (PET) Bottle-to-Bottle Recycling for the Beverage Industry: A Review. Polymers 2022, 14, 2366. [Google Scholar] [CrossRef]
  9. Amadei, A.M.; Rigamonti, L.; Sala, S. Exploring the EU plastic value chain: A material flow analysis. Resour. Conserv. Recycl. 2023, 197, 107105. [Google Scholar] [CrossRef]
  10. Statista. Generation of Plastic Packaging Waste in the European Union (EU-27) in 2020, by Country. Available online: https://www.statista.com/statistics/882010/plastic-packaging-waste-generated-eu-countries/ (accessed on 20 October 2023).
  11. Pinter, E.; Welle, F.; Mayrhofer, E.; Pechhacker, A.; Motloch, L.; Lahme, V.; Grant, A.; Tacker, M. Circularity Study on PET Bottle-To-Bottle Recycling. Sustainability 2021, 13, 7370. [Google Scholar] [CrossRef]
  12. Korea Environment Corporation. A Study on the Establishment of Quality Standards for Waste Plastic Recycling Intermediate Processed Products; Korea Environment Corporation: Incheon, Republic of Korea, 2011. (In Korean)
  13. Hidalgo-Ruz, V.; Thiel, M. Distribution and abundance of small plastic debris on beaches in the SE Pacific (Chile): A study supported by a citizen science project. Mar. Pollut. Bull. 2013, 87–88, 12–18. [Google Scholar] [CrossRef]
  14. Priya, A.K.; Muruganandam, M.; Imran, M.; Gill, R.; Reddy, M.R.V.; Shkir, M.; Sayed, M.A.; AlAbdulaal, T.H.; Algarni, H.; Arif, M.; et al. A study on managing plastic waste to tackle the worldwide plastic contamination and environmental remediation. Chemosphere 2023, 341, 139979. [Google Scholar] [CrossRef]
  15. Mathalon, A.; Hill, P. Microplastic fibers in the intertidal ecosystem surrounding Halifax Harbor, Nova Scotia. Mar. Pollut. Bull. 2014, 81, 69–79. [Google Scholar] [CrossRef] [PubMed]
  16. Martins, J.; Sobral, P. Plastic marine debris on the Portuguese coastline: A matter of size? Mar. Pollut. Bull. 2011, 62, 2649–2653. [Google Scholar] [CrossRef]
  17. Claessens, M.; Meester, S.D.; Landuyt, L.V.; Clerck, K.D.; Janssen, C.R. Occurrence and distribution of microplastics in marine sediments along the Belgian coast. Mar. Pollut. Bull. 2011, 62, 2199–2204. [Google Scholar] [CrossRef]
  18. Kaladharan, P.; Singh, V.V.; Asha, P.S.; Edward, L.; Sukhadane, K.S. Marine plastic litter in certain trawl grounds along the peninsular coasts of India. Mar. Pollut. Bull. 2020, 157, 111299. [Google Scholar] [CrossRef] [PubMed]
  19. Lee, J.; Lee, J.; Hong, S.; Hong, S.H.; Shim, W.J.; Eo, S. Characteristics of meso-sized plastic marine debris on 20 beaches in Korea. Mar. Pollut. Bull. 2017, 123, 92–96. [Google Scholar] [CrossRef] [PubMed]
  20. Marine Environment Information Portal. Coastal Debris Monitoring Statistics. Available online: https://www.meis.go.kr/mli/monitoringInfo/stat.do (accessed on 17 October 2023).
  21. Smith, R.L.; Takkellapati, S.; Riegerix, R.C. Recycling of Plastics in the United States: Plastic Material Flows and Polyethylene Terephthalate (PET) Recycling Processes. ACS Sustain. Chem. 2022, 10, 2084–2096. [Google Scholar] [CrossRef]
  22. Schmidt, S.; Laner, D.; Eygen, E.V.; Stanisavljevic, N. Material efficiency to measure the environmental performance of waste management systems: A case study on PET bottle recycling in Austria, Germany and Serbia. Waste Manag. 2020, 110, 74–86. [Google Scholar] [CrossRef] [PubMed]
  23. Eygen, E.V.; Laner, D.; Fellner, J. Circular economy of plastic packaging: Current practice and perspectives in Austria. Waste Manag. 2018, 72, 55–64. [Google Scholar] [CrossRef] [PubMed]
  24. Millette, S.; Williams, E.; Hull, C.E. Materials flow analysis in support of circular economy development: Plastics in Trinidad and Tobago. Resour. Conserv. Recycl. 2019, 150, 104436. [Google Scholar] [CrossRef]
  25. Korea Resource Circulation Service Agency. Performance of Recycling Obligations. Available online: http://www.kora.or.kr/epr/record.do (accessed on 20 October 2023).
  26. Korea Resource Recirculation Information System. National Waste Statistics Survey. Available online: https://www.recycling-info.or.kr/rrs/stat/envStatDetail.do?menuNo=M13020302&pageIndex=1&bbsId=BBSMSTR_000000000002&s_nttSj=KEC011&nttId=1331&searchBgnDe=&searchEndDe (accessed on 20 October 2023).
  27. Jeong, H.Y. Review on Improvement Measures through Material Flow Analysis in Recycling Process of Plastic Packaging Materials. Master’s Dissertation, Seoul National University of Science and Technology, Seoul, Republic of Korea, 2018. [Google Scholar]
  28. Ministry of Environment. Plastic Elimination Measures by Life Cycle; Ministry of Environment: Sejong, Republic of Korea, 2022.
  29. Ministry of Environment. Recycling Guidelines for Designated Recycling Businesses. Available online: https://www.me.go.kr/home/web/law/read.do?pagerOffset=0&maxPageItems=10&maxIndexPages=10&searchKey=lawTitle&searchValue=%EC%9E%AC%ED%99%9C%EC%9A%A9&menuId=71&orgCd=&condition.typeCode=admrul&typeCode=admrul&lawSeq=1277 (accessed on 5 October 2023).
  30. European Commission. Packaging and Packaging Waste Regulation. Available online: https://environment.ec.europa.eu/topics/waste-and-recycling/packaging-waste_en (accessed on 20 October 2023).
  31. Jang, Y.C.; Kwan, Y.S. Forecast and Analysis of Waste Generation in Seoul (2022~2040); Seoul Institute: Seoul, Republic of Korea, 2021. (In Korean) [Google Scholar]
  32. Prevent Waste Alliance. EPR Toolbox. Available online: https://prevent-waste.net/epr-toolbox/ (accessed on 20 October 2023).
  33. Korea Environment Corporation. 2023 EPR Compulsory Producer Training Materials. Available online: https://www.keco.or.kr/en/lay1/S295T386C400/contents.do (accessed on 20 October 2023).
  34. Korea Packaging Recycling Cooperative. Available online: https://www.karc.or.kr/front/viewAritcle.do?bbsId=BBS_0003&nttId=271&_csrf=14409143-b262-4994-8ec3-0692930db96d (accessed on 20 October 2023).
  35. Ministry of Environment. Act on the Promotion of Saving and Recycling of Resources. Available online: https://www.me.go.kr/home/web/law/read.do?pagerOffset=0&maxPageItems=10&maxIndexPages=10&searchKey=lawTitle&searchValue=%EC%9E%AC%ED%99%9C%EC%9A%A9&menuId=70&orgCd=&condition.typeCode=law&typeCode=law&lawSeq=165 (accessed on 5 October 2023).
  36. OECD. Modulated Fees for Extended Producer Responsibility Schemes (EPR). Available online: https://www.oecd-ilibrary.org/docserver/2a42f54b-en.pdf?expires=1703789007&id=id&accname=oid032623&checksum=756F9F6E4FEACE504DF44E246B682C73 (accessed on 3 December 2023).
  37. Ministry of Environment. Packing Material Recyclability Rating Standard. Available online: https://www.me.go.kr/home/web/law/read.do?pagerOffset=0&maxPageItems=10&maxIndexPages=10&searchKey=lawTitle&searchValue=%EC%9E%AC%ED%99%9C%EC%9A%A9&menuId=71&orgCd=&condition.typeCode=admrul&typeCode=admrul&lawSeq=1338 (accessed on 5 October 2023).
  38. Ministry of Environment. Separate Discharge of Transparent PET Bottles; Ministry of Environment: Sejong, Republic of Korea, 2020. (In Korean)
  39. Joo, M.; Suh, S.U.; Lee, K.E.; Oh, J.Y. Study on the Market Conditions and Quality Evaluation Methods of post-consumer Recycled Polyethylene Terephthalate (PCR PET) Flake. Korean J. Packag. Sci. Tech. 2020, 26, 41–46. [Google Scholar] [CrossRef]
  40. Korea Environment Corporation. Personal communication and internal data obtained by interviews from semi-government agency.
  41. The Council for PET Bottle Recycling. PET Bottles Recycling Report. Available online: https://www.petbottle-rec.gr.jp/nenji/backnumber.html (accessed on 10 October 2023). (In Japanese).
  42. PETCORE Europe. PET MARKET in Europe State of Play-2022. Available online: https://www.petcore-europe.org/news-events/409-pet-market-in-europe-state-of-play-2022.html (accessed on 10 October 2023).
  43. GREENPEACE. 2023 Plastics South Korea 2.0. Available online: https://www.greenpeace.org/korea/update/25774/report-disposable-korea-ver2/ (accessed on 1 December 2023).
  44. Samyang Packaging. Available online: https://samyangpackaging.co.kr/kr/business/pet-recycling (accessed on 10 October 2023).
  45. LOTTE Chemical. Available online: https://www.lottechem.com/ko/business/recycle.do;jsessionid=E6AB7A0A52E4ECBA31C6DEEA3BC3EA0F (accessed on 10 October 2023).
  46. DY Polymer. Personal communication and internal data obtained by interviews from recycling industry.
  47. H2. Personal communication and internal data obtained by interviews from recycling industry.
  48. Walzberg, J.; Sethuraman, S.; Ghosh, T.; Uekert, T.; Carpenter, A. Think before you throw! An analysis of behavioral interventions targeting PET bottle recycling in the United States. Energy Res. Soc. Sci. 2023, 100, 103116. [Google Scholar] [CrossRef]
  49. Chu, J.; Zhou, Y.; Cai, Y.; Wang, X.; Li, C.; Liu, Q. Flows and waste reduction strategies of PE, PP, and PET plastics under plastic limit order in China. Resour. Conserv. Recycl. 2023, 188, 106668. [Google Scholar] [CrossRef]
  50. Bradley, C.G.; Corsini, L. A literature review and analytical framework of the sustainability of reusable packaging. Sustain. Prod. Consum. 2023, 37, 126–141. [Google Scholar] [CrossRef]
  51. Kim, K.U.; Kang, W.S.; Lee, H.J. Reuse Policy Study of Resource Circulation City of Seoul; The Seoul Institute: Seoul, Republic of Korea, 2021. (In Korean) [Google Scholar]
  52. Daejeon Green Environment Center. A Study of the Consumption of Single-Use Product in Daejeon Metropolitan City; Daejeon Green Environment Center: Daejeon, Republic of Korea, 2023. [Google Scholar]
  53. Kim, B. A study on Life Cycle Assessment of PET (Polyethylene Terephthalate) Bottles with Recycled Content. Master’s Dissertation, Chungnam National University, Daejeon, Republic of Korea, 2023. [Google Scholar]
  54. Ministry of Environment. Guideline for Source Separation of Recyclables; Ministry of Environment: Sejong, Republic of Korea, 2022.
  55. LOTTE Chemical. 2022 ESG Report. Available online: https://www.lottechem.com/ko/esg/management_report.do (accessed on 25 October 2023).
  56. Samgyang Packaging. Samgyang Packaging 2022 Sustainability Report. Available online: https://samyangpackaging.co.kr/kr/esg/report (accessed on 25 October 2023).
Figure 1. Korea’s EPR scheme for PET bottle recycling.
Environments 11 00025 g001
Figure 2. Sales (domestic demand)·import volume, mandatory and actual recycling rates of PET bottles in Korea (2003–2021).
Environments 11 00025 g002
Figure 3. Material flow of PET bottles in 2021 in Korea.
Environments 11 00025 g003
Figure 4. Predicted consumption demands for PET bottles by scenario.
Environments 11 00025 g004
Figure 5. Predicted demand for recycled materials in PET bottles in (a) 2030 and (b) 2040.
Environments 11 00025 g005
Table 1. Data collection of PET bottles.
CategoryYear of DataReferences
Market demands for PET bottles2003~2021KORA
National statistics of
PET bottle recycling in MSW
2020, 2021Korea MOE
PET bottle recycling annual report
Eunomia
Recycled content in PET bottles2021KECO, KORA
Table 2. Data collection method and source by life cycle of PET.
Life Cycle StageDataStatisticsSurveyLiteratureAssumptions
ProductionPET production, import and exportO O
ConsumptionPlastic bottles by industry, plastic packaging associationO O
Waste
Generation
MSW generation rateO OO
RecyclingPlastic recycling statisticsOO O
Treatment and DisposalMSW treatment dataO O
Table 3. Major assumptions in each scenario.
CategoryAssumptions in Each Scenario
Business-as-usual
scenario (BAU)
Constant growth rate of PET bottle consumption demand
Assumptions
for S1~S4
  • Reduce PET bottle consumption by 2040 compared to BAU;
  • Mandatory recycled content in PET bottles.
AssumptionsScenario 1
(S1)
Scenario 2
(S2)
Scenario 3
(S3)
Scenario 4
(S4)
Reduction rate of PET bottle consumption compared to 2040 BAU10%20%30%40%
Mandatory recycled content target30% (2030)
40% (2040)
Table 4. The comparison of PET bottle consumption and recycling in Korea, Japan, and EU.
Korea (2021)Japan (2021) [41]EU (2020) [42]
PET bottle demand (1000 ton/yr)3405813600
PET bottle demand per capita (kg/yr/person)6.54.68.0
PET bottles recycled (1000 ton/yr)2685002229
PET bottles recycled per capita (kg/yr/person)5.24.05.0
Collection rate
Recycling rate
84.8%
79.0%
82.3%
86.0%
61.0%
62.0%
High quality r-PET
(Food-grade r-PET)
19%
(<1.0%)
67%
(58%)
67%
(30%)
Disclaimer/Publisher’s Note: The statements, opinions and data contained in all publications are solely those of the individual author(s) and contributor(s) and not of MDPI and/or the editor(s). MDPI and/or the editor(s) disclaim responsibility for any injury to people or property resulting from any ideas, methods, instructions or products referred to in the content.

