
Exposure of Zebrafish Embryos to Urea Affects NOS1 Gene Expression in Neuronal Cells
by
 , and
, and
Pietro Cacialli
1,*,† ,
,
Serena Ricci
1,†,
Flavia Frabetti
2,
Sara Ferrando
3 and
Valeria Franceschini
1 1
Department of Biological, Geological and Environmental Sciences (BIGEA), University of Bologna, Via F. Selmi 3, 40126 Bologna, Italy
2
Department of Medical and Surgical Sciences, University of Bologna, Via Belmeloro 8, 40126 Bologna, Italy
3
Department of Earth, Environmental and Life Science, University of Genoa, Corso Europa 26, 16132 Genoa, Italy
*
Author to whom correspondence should be addressed.
†
These authors contributed equally to this work.
Environments 2024, 11(3), 41; https://doi.org/10.3390/environments11030041
Submission received: 16 January 2024
/
Revised: 16 February 2024
/
Accepted: 21 February 2024
/
Published: 21 February 2024
Abstract
:Nitrogen-based fertilizers represent the most common fertilization tools, particularly used in crop food agriculture, despite the low cost-efficiency and the high negative environmental impact. At present, there is still inadequate information available about the effects of urea on human health; nevertheless, previous studies in animals observed that high urea concentration exposure can damage different tissues, including the brain. In several vertebrates, a crucial factor involved in neuronal cell formation is represented by the gas molecule, nitric oxide (NO), derived from the conversion of arginine to citrulline through the enzymatic activity of nitric oxide synthases (NOS). In zebrafish, three different isoforms of the NOS gene are known: nos1, nos2a, and nos2b. In the present study we show that nos1 represents the unique isoform with a stable high expression in the brain and spinal cord during all the embryonic stages of zebrafish development. Then, by using a specific transgenic zebrafish line, Tg(HuC:GFP), to mark neuronal cells, we observed nos1 to be specifically expressed in neurons. Interestingly, we observed that urea exposure at sub-lethal doses affected cell proliferation and the number of nos1-expressing cells, inducing apoptosis. Consistently, brain NO levels were observed to be reduced in urea-treated animals compared to untreated ones. This finding represents the first evidence that urea exposure affects the expression of a key gene involved in neuronal cell formation during embryonic development.
Keywords:
urea; fertilizer; environmental exposure; fish; aquatic model; nos1; nos2a; nos2b; neuron; NO production1. Introduction
Urea represents the most abundant nitrogen (N)-based fertilizer used in agriculture [1]. Since 1970, the use of urea has increased exponentially such that it accounts for more than 50% of current global N-based fertilizer applications [2]. However, nitrogen fertilization, and in particular urea-based fertilization, requires high costs and has a strong impact on groundwater pollution, due to ammonia emissions [3]. In Europe, ammonia emissions strongly contribute to fine particulate matter (PM2.5) pollution and are associated with damage to the ozone layer and low-biomass ecosystems [4]. The National Emission Ceilings Directive 2016/2284/EU has set an obligation for all European Union countries to reduce their NH3 emissions by 6%, relative to 2005, by 2020 [5,6]. Nowadays, several artificial urease inhibitors have been developed, such as N-(n-butyl) thiophosphoric triamide (NBPT) [7]. These compounds block the enzymatic activity of ureases, responsible for urea hydrolyzation into volatile ammonium [8,9,10]. However, the residuals of these chemicals found in food (e.g., milk) have become an “alarm bell” regarding the potential risks for human health [11,12]. At the present day, there is still inadequate, and sometimes controversial, evidence about whether exposure to high exogenous urea concentrations represents a hazard for human health [13]. The main impact has been underlined at respiratory levels. In several Asian countries, indeed, urea plant workers, strongly exposed to ammonia emissions, are reported to develop acute respiratory symptoms (cough) and chest tightness [14,15,16]. In animals, different studies have reported urea toxicity to be related to exposure time and mode, and that the organs more greatly affected are the kidneys and liver [17,18,19]. Nevertheless, according to the EPA, exogenous urea exposure can exert huge effects also at the central level. Chronic administration of urea toxin in rodents, indeed, was observed to cause neuronal loss, seizures, lethargy, jerking movements, and stimulus-sensitive myoclonus [20]. Our previous studies, performed in developing and adult zebrafish (Danio rerio), demonstrated that exposure to waterborne urea affects fish’s olfactory system, as it causes olfactory epithelium thickening and neuron number decrease [21]. However, the specific mechanisms through which urea toxicity induces neuronal loss has not yet been clarified.
Nitric oxide (NO) is a gaseous signal molecule, synthesized by different isoforms of NO synthase (NOS) [22]. In mammals, three different genes encode for three different NOSs (1 or neural, 2 or inducible, and 3 or endothelial). By contrast, in the teleost fish genome, one NOS1 gene and two NOS2 genes (NOS2a and NOS2b) have been characterized; the former encodes for the orthologue form of mammalian neural NOS (nNOS) [23,24,25]. Multiple studies underline a crucial role of NO both in the early stages (neurogenesis) and in advanced stages (synaptogenesis and neural map formation) of neuronal differentiation [26]. In humans, the alteration of cerebral NO metabolism has been associated with neuropathological conditions, such as schizophrenia [27]. Considering the key role of NO in regulating neural precursor proliferation, an altered NO pathway seems to be the basis for neural tumor expansion and neurodegenerative disorders [28,29,30]. In rodents, it was demonstrated that NO increases the proliferation of neural stem cells (NSCs) and the number of neuroblasts following seizures, but detrimental to the survival of newborn neurons, probably because it participates in neuro-inflammation establishment [31]. Subsequent studies allowed, then, the deciphering of the role of NO-producing enzymes (NOS) in neurogenesis. Neural NOS knock-out (nNOS KO) rats, indeed, were observed to display reduced infarct size and increased neurogenesis after transient focal cerebral ischemia compared to wild-type littermates [32]. Afterwards, an interesting report clarified that nNOS from neural stem cells (NCSs) and from neurons play opposite roles in regulating neurogenesis, as the former stimulates it, whereas the latter represses it by supplying exogenous NO and by reducing nNOS expression in NSCs [33]. For this reason, also in humans, several reports have demonstrated the importance of nNOS in a variety of synaptic signaling events at the basis of learning, memory, and neurogenesis [34].
Based on our previous evidence [21] and given the key role of NO and NOS in neuronal cell formation and function, in the present studies we want to investigate, in zebrafish embryos, whether exogenous urea might exert its damaging effects on the brain by impacting on nos gene expression and NO production.
2. Materials and Methods
2.1. Zebrafish Husbandry
AB* zebrafish strains, along with transgenic strain Tg(HuC:GFP) [35], were kept in a 14/10 h light/dark cycle at 28 °C. Only fertilized eggs with normal development were used for the experiments. All the experiments were performed in triplicate. All fish were housed according to FELASA and European guidelines. No ethical authorization was required as all experiments were performed in larvae before 5 days post-fertilization (dpf). All possible efforts were made to comply with 3R guidelines.
2.2. Urea Treatment
Embryos were obtained as described previously [36,37], were dechorionized, and then, treated from 4 to 96 h post-fertilization (hpf) with different urea concentrations (0, 10, 50, 100 mM) dissolved in E3 zebrafish medium (34.8 g of NaCl, 1.6 g of KCl, 5.8 g of CaCl2, 2H2O, 9.78 g of MgCl2, 6H2O) in standard housing conditions to define the survival rate and morphology defects. Urea concentrations were chosen based on our previous studies [21].
2.3. RNA Purification and Reverse Transcription
In order to obtain the total RNA, 30 zebrafish embryo heads at 24, 48, 72, 96, and 120 hpf, respectively, were dissected and pooled. Dissociation was performed by using RLT buffer employing the RNAeasy kit (Qiagen, Frankfurt, Germany), according to the manufacturer’s protocol. This procedure was repeated in three independent experiments (90 embryos in total for each time point). For reverse transcription, 0.5 μg of the total RNA was incubated with buffer and an enzyme mix for 10 min at 25 °C, 30 min at 50 °C, and 5 min at 85 °C., according to the Superscript III First-Strand Synthesis System kit instructions (Invitrogen, Boston, MA, USA). Next, the samples were treated with RNase-H for 30 min at 37 °C and stored at −20 °C.
2.4. Quantitative Real-Time PCR
A quantitative polymerase chain reaction (qPCR) was performed by using a thermocycler with a MyiQ detector (Bio-Rad, Hercules, Dallas, TX, USA). cDNA obtained from a previous procedure was incubated with specific forward and reverse primers, SYBR-Green (Bio-Rad Hercules, Dallas, TX, USA), and RNase free water according to the manufacturer’s protocol. A PCR mix was incubated for 15 min at 95 °C, for 15 s at 95 °C for 40 cycles; for 30 s at 60 °C for 40 cycles; and for 30 s at 72 °C for 40 cycles. We used forward and reverse primers which were validated and published in previous studies, and the primers are listed below (Table 1).
Data are represented as the fold change in target mRNA levels for the ef1a normalizer gene. The absolute quantification was calculated using 2−ΔΔCt. To confirm the correct amplification, melting curve analysis was performed, and PCR efficiency was verified. In the qPCR analyses, each n represents the average of biological triplicates from a single experiment. The experiments were repeated at least three times.
2.5. Synthesis of Riboprobes for NOS1, NOS2a, and NOS2b
All digoxigenin (DIG)-labeled antisense and sense riboprobes were generated using the protocol described in our previous studies [38,39]. Briefly, nos1, nos2a, and nos2b riboprobes for zebrafish were synthetized by using the following primers (Table 2).
After PCR amplification from fish brains, each insert was cloned in TOPO-TA vector (Invitrogen, Boston, MA, USA) and amplified via transformation into thermocompetent bacteria. After applying heat shock, the bacteria were plated onto Luria–Bertani (LB) agar plates containing the appropriate antibiotic, in order to select only the transformed cells. The bacterial colonies were picked from the agar plates and inoculated in LB medium containing the specific antibiotic. The bacteria were grown for 16 h in an orbital rotator at 37 °C. Subsequently, plasmid DNA was purified by using the Quick Plasmid Miniprep Kit (Invitrogen, Boston, MA, USA) according to the manufacturer’s instructions. Antisense and sense orientation of DNA was confirmed by using sequencing, and the plasmids were linearized by the appropriate restriction enzymes. Afterwards, DNA transcription was performed by using T7 polymerase and SP6 polymerase (Roche-Diagnostic, Barrington, IL, USA), and the DIG-RNA Labelling Mix (Roche Diagnostic, Indianapolis, IN, USA). Finally, all riboprobes were purified using NucleoSpin RNA Clean-up columns (Qiagen, Frankfurt, Germany). Reaction specificity was checked by hybridizing the sense and antisense riboprobes on adjacent sections.
2.6. In Situ Hybridization
After specific riboprobe synthesis, 20 embryos for each stage and condition were fixed in 4% paraformaldehyde (PFA) overnight at 4 °C. After 24 h, fixed embryos were washed using PBT and methanol (serial concentrations). The embryos were, then, immersed in PBT and incubated with proteinase K (2 mg/mL) at RT for 10 min. Afterwards, embryos were washed in PBS and standard saline sodium citrate (SSC 2×) 2 times for 10 min each. Next, embryos were incubated with the probes (2 µg/mL) diluted in a specific medium (Denhart 5×; SSC 2×; 50% formamide; ethylenediamine-tetra acetic acid 4 mM; 5% dextran sulphate; yeast tRNA 50 µg/mL) at 63 °C for 24 h. After 24 h, the embryos were washed with SSC 2×; 50% formamide/SSC 2×; SSC 0.2× and SSC 0.1×. The embryos were immersed in a buffer of 100 mM Tris-HCl plus 150 mM NaCl, and washed in the same buffer containing 0.5% milk powder plus 0.1% Triton. For chromogenic revelation, during the following 48 h, all embryos were incubated with anti-digoxigenin alkaline phosphatase Fab fragments (1:5000) (Roche Diagnostic, Chicago, IL, USA) overnight at room temperature [40]. After 24 h, all embryos were washed in Tris-HCl/NaCl buffer and with 110 mM HCl-Tris (pH 8) containing 10 mM MgCl2 and 100 mM NaCl. Staining was performed using NBT/BCIP buffer (pH 9.5) (ThermoFischer, Waltham, MA, USA). For fluorescence revelation, all embryos were immersed in anti-DIG POD antibody (Roche Diagnostic, Chicago, IL, USA) (1:200) in the above-described blocking solution for 24 h at room temperature. Next, embryos were washed 4 times in PBS (5 min each). Afterwards, embryos were visualized using the Red Fluorescent Detection set (Roche Diagnostic, Chicago, IL, USA) according to the kit’s instructions. Mounted with DAPI, embryos were observed using an Olympus (Zeiss, Jena, Germany) fluorescence microscope, equipped with a DP71 digital camera, or with a Leica (Leica Microsystems, Wetzlar, Germany) SP2 confocal microscope. The images were processed using either the Olympus Cell Zeiss AxioVision 4 or Leica LAS Xsoftware.
2.7. Immunofluorescence Staining for Anti-GFP
Immunofluorescence staining combined with whole-mount in situ hybridization was performed as described previously. Hu:GFP transgenic embryos were fixed and stained with chicken anti-GFP (1:400; Life Technologies, Carlsbad, CA, USA) for 24 hpf, and alexaFluor488-conjugated anti-chicken secondary antibody (1:1000; Life Technologies).
2.8. In Situ Hybridization Combined with TUNEL Assay on Paraffin Section
Paraffin sections of the heads of embryos at 4 dpf (non-treated and treated with urea 50 mM) were processed to perform in situ hybridization for nos1, and for fluorescence revelation (in green), the sections were incubated for 1 h in a buffer for amplification (PerkinElmer company, Life Sciences, Boston, MA, USA). For the reaction, Cy3 tyramide (TSA plus Cyanine 3, PerkinElmer company, Life Sciences, Boston, MA, USA) reagent was prepared 1:100 in amplification buffer and Alexa-Fluor 488 reagent (TSA Reagent, Alexa Fluor 488 Tyramide Reagent, Invitrogen™, Boston, MA, USA). Next, the signal was checked using a fluorescence microscope, and the sections were fixed for 10 min in 2% paraformaldehyde. Next, the sections were incubated with 90 µL of labeling solution plus 10 µL of enzyme solution (In Situ Cell Death Detection Kit, Roche) at RT for 1 h. They were washed three times with PBS for 5 min and mounted by using DAPI. Finally, the images were examined via confocal microscopy.
2.9. Diaminofluorescein-FM Diacetate (DAF-FM DA)
Embryos (15 in each group) at 4 hpf were treated with urea (50 mM) in E3 medium until 96 hpf. Embryos (15 in each group) at 95 hpf were treated with LPS (10 μg/mL) (Sigma-Aldrich, St. Louis, MO, USA) in E3 medium for 1 h. At 96 hpf, LPS and urea-treated embryos (and untreated groups) were incubated with 4-amino-5-methylamino-2′7′-difluorofluorescein diacetate (DAF-FM DA) 5 μM in E3 medium for 2 h at 28 °C in dark conditions. After incubation, embryos were rinsed in E3 medium and observed using a fluorescence microscope in vivo. The relative fluorescence intensity was measured by counting the number of pixels using Image J Open JDK 13.0.6 software.
2.10. Statistical Analysis
The results were analyzed using the GraphPad Prism 9.4.1 software (GraphPad Inc., San Diego, CA, USA); statistical comparison was performed via two-tailed Student’s t test (unpaired data) or via one-way ANOVA (multiple comparison—Tukey–Kramer post hoc test). p values equal or less than 0.05 were considered statistically significant.
3. Results
3.1. Quantitative Analysis of NOS Genes during Brain Development in Zebrafish Embryos
Previous phylogenetic and transcriptomic studies have identified three NOS genes expressed in zebrafish: nos1, nos2a, and nos2b [41]. In order to identify the expression levels of the NOS gene family during different stages of development in zebrafish embryos, firstly, we performed qPCR analysis (Figure 1a). We found that nos1 is the most expressed gene in the brain for each developmental stage (24; 48; 72; 96 hpf); by contrast, nos2a and nos2b displayed very low expression at 24 and 48 hpf with a slight increase at 72 and 96 hpf (Figure 1b).
3.2. Spatiotemporal Expression Pattern of nos1, nos2a, and nos2b Genes during Embryonic Development in Zebrafish
Subsequently, we performed whole-mount in situ hybridization (WISH) at different stages of development in zebrafish embryos, in order to identify the expression pattern of three NOS gene isoforms. As shown in Figure 2, the nos1 gene was highly expressed within the brain and eyes at all stages of development (24, 48, 72, and 96 hpf) and in a few cells along the spinal cord at 24 and 48 hpf. By contrast, nos2a and nos2b displayed no expression in the brain at 24 hpf, followed by a low expression between 48 and 72 hpf (Figure 2). At 96 hpf, nos2a expression seemed to translocate in the liver region, while nos2b presented a low expression pattern in the eyes and liver regions (Figure 2).
3.3. Nos1 Gene Is Specifically Expressed in Neuronal Cells during Zebrafish Embryonic Development
Based on previous results, nos1 was the most expressed gene of the NOS family in the brain. However, to verify whether this gene was specifically expressed in neuronal cells, we used a transgenic reporter zebrafish line, Tg(HuC:GFP), that marks newborn neuronal cells. Thus, we performed whole-mount fluorescence in situ hybridization for nos1 combined with immunohistochemistry for anti-GFP on HuC:GFP-positive embryos, fixed at 30 hpf. As shown in Figure 3, nos1 is expressed in the brain and along the spinal cord (Figure 3a). Nos1-expressing cells in the brain and spinal cord were specifically co-expressed with the GFP+ cells of HuC:GFP embryos (Figure 3b,c). These results confirm that nos1 is a specific neuronal marker during zebrafish embryonic development.
3.4. Urea Toxicity Monitoring in Zebrafish Embryos
Subsequently, to test whether urea exposure might affect nos1 expression in embryonic neurons, at 1 hpf, 160 embryos were collected, and at 4 hpf those treated with water-dissolved urea at different concentrations (0, 10, 50, 100 mM) up to 96 hpf, respectively (Figure 4a). Embryo survival was monitored every 24 h. The survival rate is reported as the percentage of dead fish at 96 hpf compared to the control (untreated) group. As shown in Figure 4, we observed a significant decrease in the survival of embryos treated with a high concentration of urea (100 mM), while urea concentrations of 10 and 50 mM did not affect embryo survival (Figure 4b).
In parallel, we performed a morphological evaluation and, consistently with our previous result, embryos exposed to high-dose urea (100 mM) displayed tail defects just at 24 hpf (Figure 5). Considering that no significant differences in survival rates and morphological features were observed among groups exposed to 10 and 50 mM, we arbitrarily decided to use only one concentration (50 mM) of urea for the next experiments.
3.5. Urea Exposure Affects Neuronal nos1 Expression during Development in Zebrafish Embryos
Finally, in order to evaluate the impact of urea on nos1 expression, embryos were treated with urea (50 mM) and then fixed at different time-points (24, 48, 72, and 96 hpf). As shown in Figure 6, fluorescence WISH at 24 hpf showed a significant decrease in nos1 gene expression in the brain (dorsal view of the head) from urea-treated embryos, compared to control ones.
This decrease in nos1-expressing cells was maintained also at 96 hpf, as shown in Figure 8.
3.6. Effects of Urea Treatment on Proliferation, Cell Death and NO Production in Zebrafish Embryos
To evaluate whether the effects of urea treatment on nos1 expression might impact cell proliferation, we performed WISH and qPCR analysis of pcna gene levels (proliferative marker). As shown in Supplementary Figure S1, we observed a decrease in pcna expression levels in the hindbrain region of urea-treated embryos at 4 dpf, compared to untreated fish (Supplementary Figure S1a,b). By contrast, TUNEL experiments on paraffin sections of embryonic brain at 4 dpf showed that urea treatment led to a significant decrease in nos1-expressing cells and an increase in TUNEL positive cells (Figure 9a–c), suggesting that this agent induces neuron apoptosis.
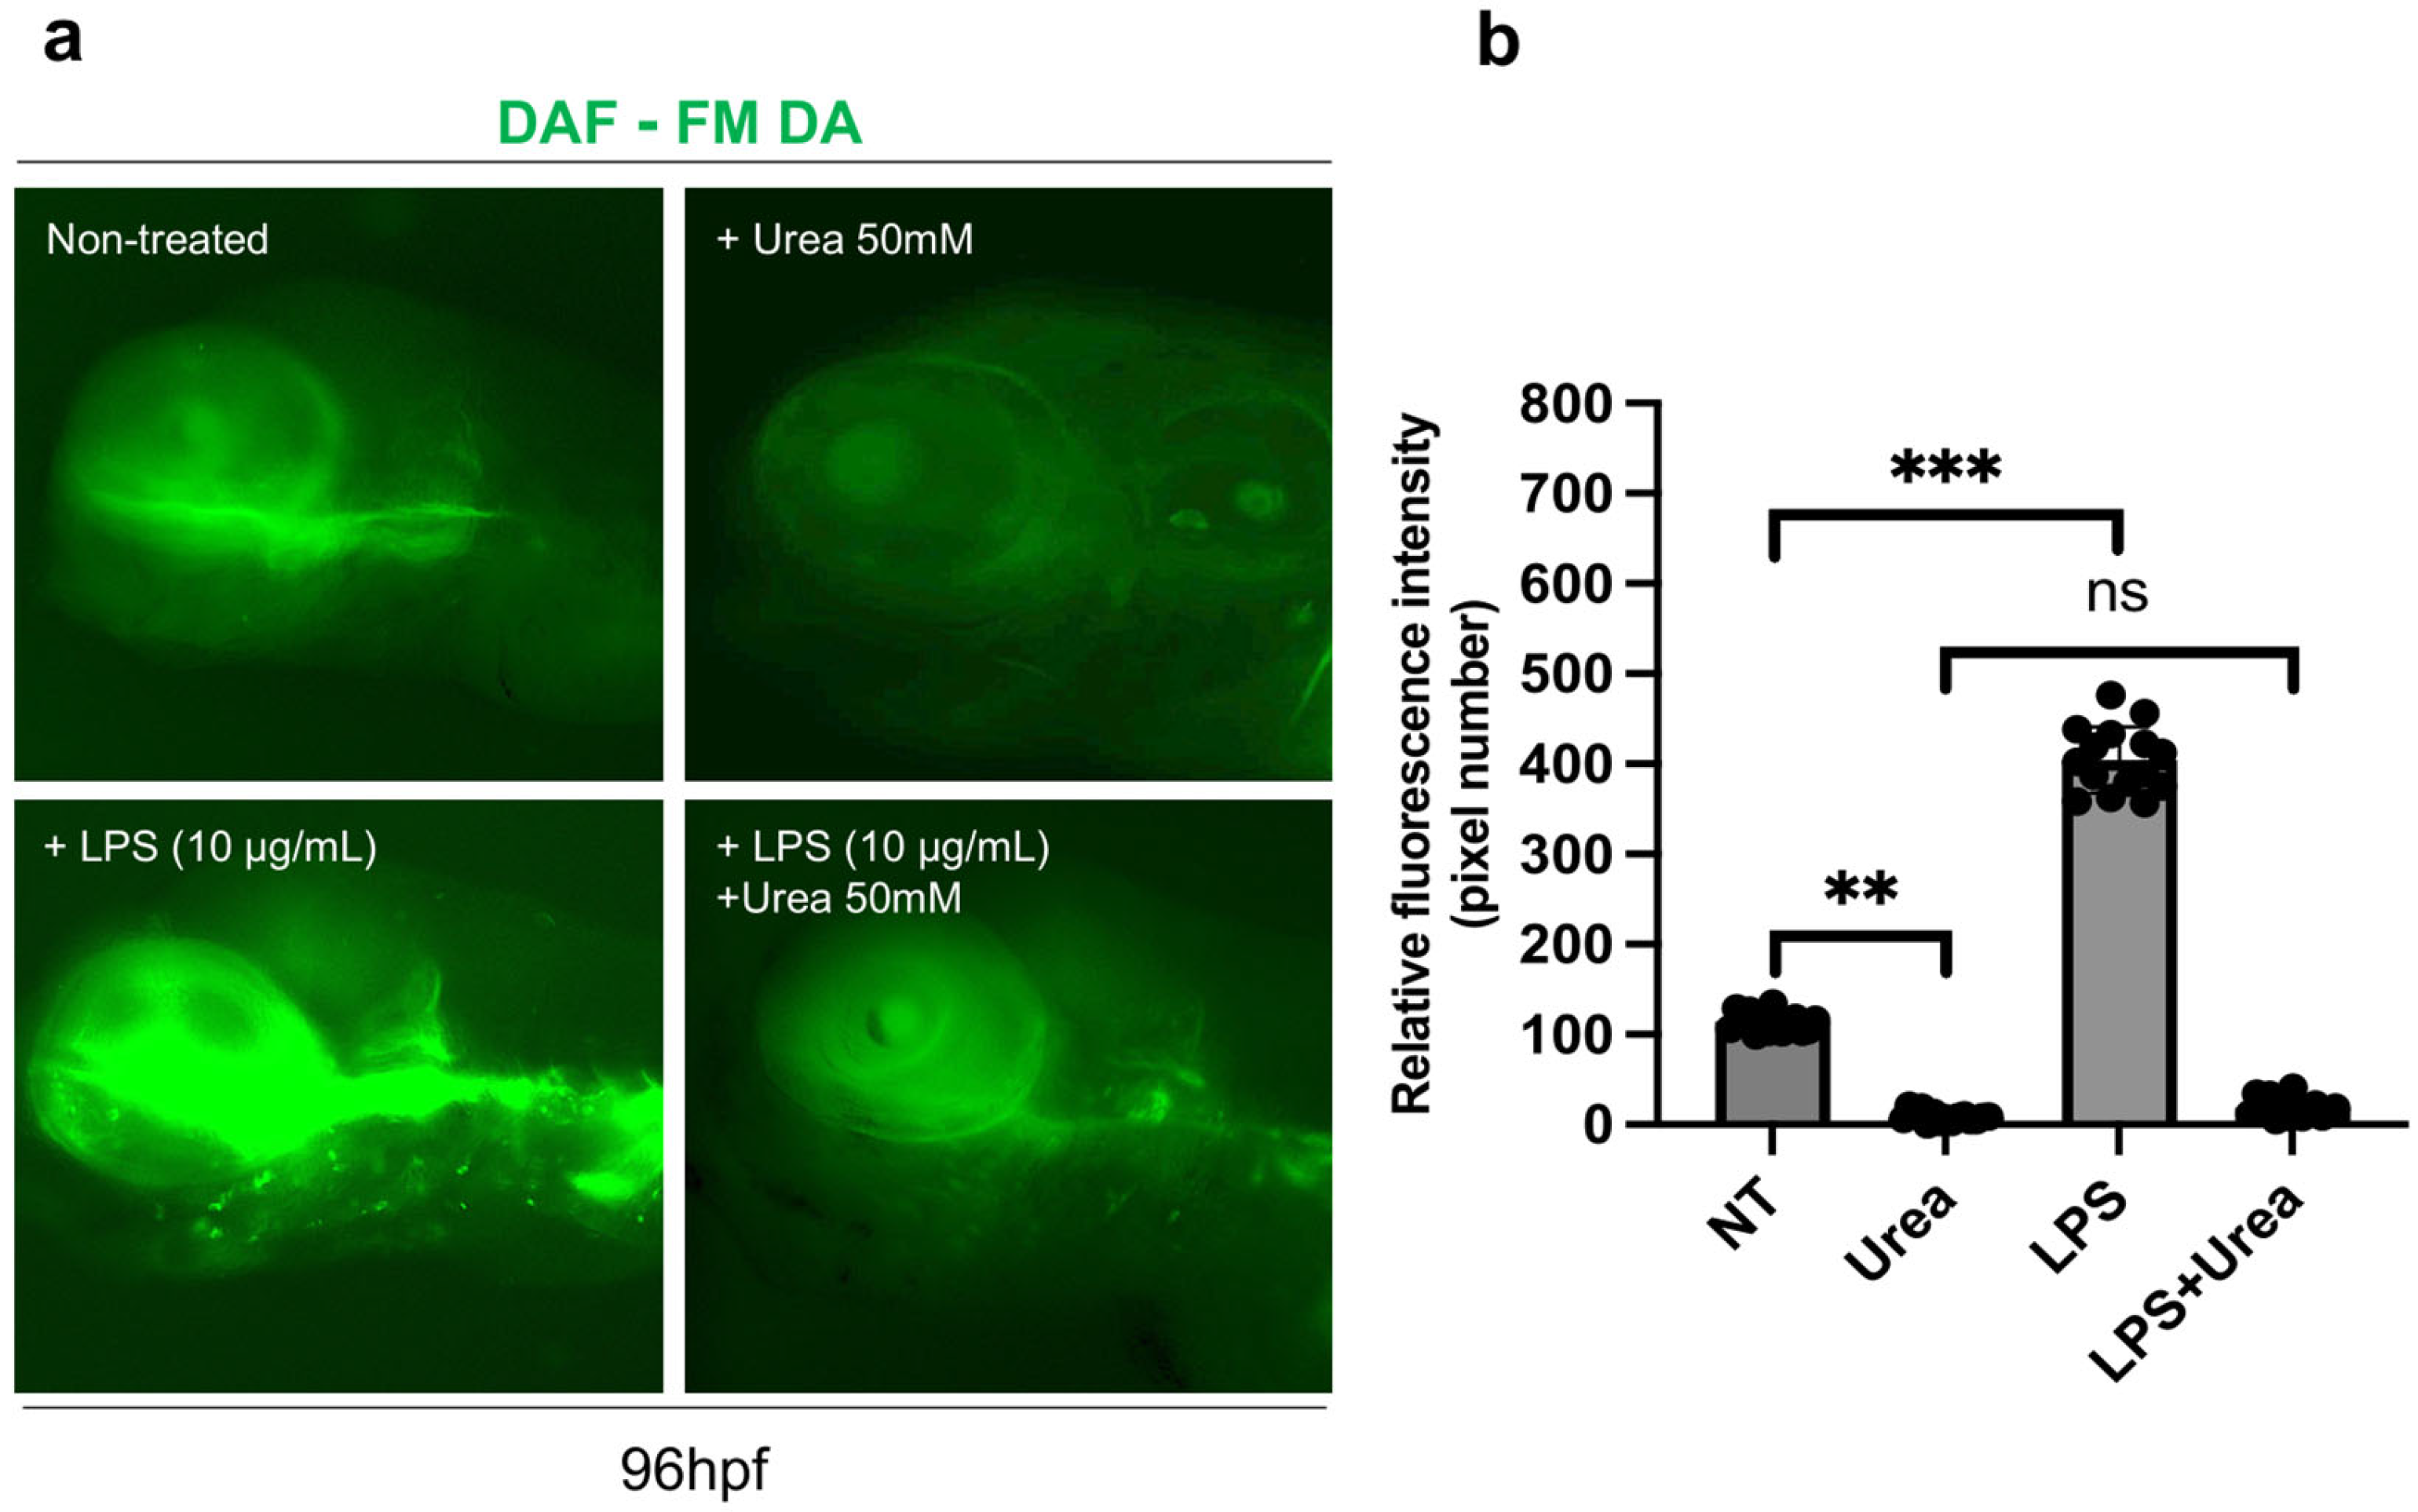
Then, we evaluated the effect of urea exposure on NO production via DAF-FM DA staining. To induce stress-related NO intracellular production, we provided an inflammatory stimulus, by treating embryos (15 per group) with low doses of LPS (as reported in previous studies [42]). As shown in the figure, we observed a strong increase in DAF-FM DA signaling after LPS treatment, compared to untreated controls and urea-treated animals; however, co-treatment of embryos with urea and LPS displayed a significant decrease in NO production (Figure 10a,b).
4. Discussion
In the last few years, the misuse of agricultural fertilizers has undoubtedly raised many questions within the scientific community about the potential unbalancing between the benefits for food production and the hazards for human health. With particular reference to urea-based fertilizers, these chemicals are synthesized and used on a large scale, despite their efficiency being well below 50% and them leading to huge ecological problems, mainly due to ammonium emissions [43]. At present, the studies regarding the dangerous effects of high levels of urea exposure are still ambiguous and not sufficiently extensive. Most information has been provided by epidemiological association studies performed in South Asian countries, which are the largest consumers of urea fertilizers for crop food agriculture [4]. On the other hand, the availability of animal models of human diseases has allowed in-depth investigation of the organs and tissues mainly affected by high urea concentrations. In particular, zebrafish (Danio rerio) has just been previously observed to be an excellent in vivo tool to study the dangerous neuronal impact of hyperammonaemia related to high levels of urea exposure [44]. Our recent studies performed in adult and developing zebrafish also observed that exposure to sub-lethal doses of urea hugely impact the olfactory neuron number [21]. However, the specific mechanisms by which urea induces neuronal loss have not yet been clarified. In many vertebrates, one of the main protagonists of neuronal formation and correct functionality is the NO gas molecule [45,46], produced from the conversion of arginine to citrulline [47], through the enzymatic activity of a specific isoform of nitric oxide synthase defined as “neuronal” (nNOS), as it is mainly expressed by neuronal tissue [48,49,50]. In zebrafish, the NOS family encompasses three isoforms: NOS1, NOS2a, and NOS2b [51,52]. In this study, we showed that within zebrafish brain, nos1 gene expression is stably higher than that of nos2a and nos2b during the early stages of development, from to 24 hpf to 96 hpf. This observation seems to agree with previous evidence in ray-finned fish, where the expression pattern of NOS1 has been described to be dynamic during development. Studies of whole-mount in situ hybridization in fish embryos showed that at 24 h post-fertilization (hpf) nos1-positive cells are highly present in dorsal telencephalon and in pallium, which represent the main neurogenesis regions of developing fish; then, at 72 hpf, nos1 expression appears also in the olfactory bulbs, mesencephalon, cerebellum, and rhombencephalon, while at 5 days post-fertilization (dpf), nos1 signal spreads in different areas within the forebrain [53].
The availability of a transgenic zebrafish model, expressing a marker reporter (GFP) exclusively within the naïve neurons, allowed us to specifically localize nos1 expression in these brain cell types. Thus, it is conceivable to hypothesize a key role of this NOS isoform in the early phases of neuron formation which are related to correct brain functions. Consistently, previous neurophysiology studies observed severe alterations of animal behaviour in NOS1 knock-out zebrafish models [54]. In consideration of our previous studies, which underlined the deleterious effect of chronic urea exposure on neuronal cell number [21], we wonder whether this agent might have an impact on NOS1 and NO production. Interestingly, we observed that urea treatment of zebrafish embryos results in a severe decrease in nos1 expression, that is stable during all stages of embryo development. Consistently, brain NO production induced by stressful stimulus, was inhibited by urea treatment. The effects of urea on NO production have been widely observed both in vitro and in vivo; urea and NO metabolic cycles, indeed, are strongly intertwined, as they share substrates, enzymes, and transporters, including argininosuccinic acid synthase and argininosuccinic acid lyase [55,56]. Indeed, clinical studies in subjects affected by congenital urea cycle enzyme defects, which pathologically accumulate urea in the body, showed reducing circulating NO levels [57]. However, very scant literature exists concerning the effect of high urea concentration on nitric oxide synthase expression. Some in vitro studies, in the mouse macrophage cell line, observed that urea treatment is able to inhibit NO production, by reducing inducible NOS expression [58]. Nevertheless, according to present knowledge, no previous evidence underlines an effect of urea exposure on neuronal NOS (nos1) expression in the developing brain. Interestingly and consistently with these results, chronic urea treatment leads to increased apoptosis of nos1-expressing cells in the brains of embryos, accompanied by decreased cell proliferation. All these observations represent the very first evidence, in a teleost in vivo model, of urea chronic exposure effects on nos1 expression, which might suggest a key mechanism through which urea exposure results in neuronal death. Despite further investigation being needed to better elucidate this link, this study uncovered a potential molecular feature at the basis of neuronal impairments resulting from urea toxicity.
Supplementary Materials
The following supporting information can be downloaded at: https://www.mdpi.com/article/10.3390/environments11030041/s1, Figure S1: (a) Dorsal view of heads, fluorescence WISH for pcna in embryos non-treated and treated with urea at 96hpf. (b) qPCR for pcna in the heads of embryos non-treated and treated with urea.
Author Contributions
Conceptualization, P.C.; Methodology, P.C. and S.R.; Software, P.C.; Validation, P.C. and S.R.; Formal analysis, P.C.; Investigation, P.C.; Resources, P.C. and F.F.; Data curation, P.C. and S.R.; Writing—original draft, P.C., S.R. and V.F.; Visualization, S.F.; Funding acquisition, P.C. and V.F. All authors have read and agreed to the published version of the manuscript.
Funding
This work was supported by national public funds grant number RFO2023-Cacialli and RFO2022-Franceschini from the Italian Ministry of University and Research (MIUR).
Institutional Review Board Statement
Fish were raised according to FELASA and European guidelines. No authorization was required since all experiments were performed before 5 days post-fertilization. All efforts were made to comply with the 3R guidelines.
Data Availability Statement
The raw data supporting the conclusions of this article will be made available by the authors on request.
Conflicts of Interest
The authors declare no conflicts of interest.
References
- Cheng, D.; Liu, Y.; Yang, G.; Zhang, A. Water- and Fertilizer-Integrated Hydrogel Derived from the Polymerization of Acrylic Acid and Urea as a Slow-Release N Fertilizer and Water Retention in Agriculture. J. Agric. Food Chem. 2018, 66, 5762–5769. [Google Scholar] [CrossRef]
- Ruthrof, K.X.; Steel, E.; Misra, S.; McComb, J.; O’Hara, G.; Hardy, G.; Howieson, J. Transitioning from phosphate mining to agriculture: Responses to urea and slow release fertilizers for Sorghum bicolor. Sci. Total Environ. 2018, 625, 1–7. [Google Scholar] [CrossRef] [PubMed]
- Saggar, S.; Singh, J.; Giltrap, D.L.; Zaman, M.; Luo, J.; Rollo, M.; Kim, D.G.; Rys, G.; van der Weerden, T.J. Quantification of reductions in ammonia emissions from fertiliser urea and animal urine in grazed pastures with urease inhibitors for agriculture inventory: New Zealand as a case study. Sci. Total Environ. 2013, 465, 136–146. [Google Scholar] [CrossRef] [PubMed]
- Witte, C.P. Urea metabolism in plants. Plant Sci. 2011, 180, 431–438. [Google Scholar] [CrossRef] [PubMed]
- Tasistro, A.S.; Cabrera, M.L.; Ritz, C.W.; Kissel, D.E. Manipulating bedding materials and PLT to reduce NH3 emissions from broiler manure. Bioresour. Technol. 2008, 99, 1952–1960. [Google Scholar] [CrossRef] [PubMed]
- Jiang, T.; Ma, X.; Tang, Q.; Yang, J.; Li, G.; Schuchardt, F. Combined use of nitrification inhibitor and struvite crystallization to reduce the NH3 and N2O emissions during composting. Bioresour. Technol. 2016, 217, 210–218. [Google Scholar] [CrossRef] [PubMed]
- Matczuk, D.; Siczek, A. Effectiveness of the use of urease inhibitors in agriculture: A review. Int. Agrophys. 2021, 35, 197–208. [Google Scholar] [CrossRef]
- Allende-Montalbán, R.; Martín-Lammerding, D.; Delgado, M.D.; Porcel, M.A.; Gabriel, J.L. Urease Inhibitors Effects on the Nitrogen Use Efficiency in a Maize-Wheat Rotation with or without Water Deficit. Agriculture 2021, 11, 684. [Google Scholar] [CrossRef]
- Amorim, M.D.; Toyosumi, I.D.; Lopes, W.D.; Camillo, L.R.; Ferreira, L.N.; Junior, D.S.R.; Soares, W.D.; Gesteira, A.D.; Costa, M.G.C.; Coelho, M.A.N. Partial rootzone drying and regulated deficit irrigation can be used as water-saving strategies without compromising fruit yield and quality in tropically grown sweet orange. J. Hortic. Sci. Biotechnol. 2021, 96, 663–672. [Google Scholar] [CrossRef]
- Silva, F.L.B.; Vieira, L.G.E.; Ribas, A.F.; Moro, A.L.; Neris, D.M.; Pacheco, A.C. Proline accumulation induces the production of total phenolics in transgenic tobacco plants under water deficit without increasing the G6PDH activity. Theor. Exp. Plant Phys. 2018, 30, 251–260. [Google Scholar] [CrossRef]
- Ray, A.; Forrestal, P.; Nkwonta, C.; Rahman, N.; Byrne, P.; Danaher, M.; Richards, K.; Hogan, S.; Cummins, E. Modelling potential human exposure to the urease inhibitor NBPT through the environment-food pathway. Environ. Int. 2023, 179, 108149. [Google Scholar] [CrossRef]
- Ray, A.; Nkwonta, C.; Forrestal, P.; Danaher, M.; Richards, K.; O’Callaghan, T.; Hogan, S.; Cummins, E. Current knowledge on urease and nitrification inhibitors technology and their safety. Rev. Environ. Health 2021, 36, 477–491. [Google Scholar] [CrossRef]
- Dickerson, A.S.; Lee, J.S.; Keshava, C.; Hotchkiss, A.; Persad, A.S. Assessment of Health Effects of Exogenous Urea: Summary and Key Findings. Curr. Environ. Health Rep. 2018, 5, 205–212. [Google Scholar] [CrossRef]
- Zala, N.; Kavishvar, A. Respiratory morbidity due to ammonia exposure among the employees of a urea manufacturing industry located in western part of India. Indian. J. Occup. Environ. Med. 2012, 16, 142–144. [Google Scholar] [CrossRef] [PubMed]
- Rahman, M.H.; Bråtveit, M.; Moen, B.E. Exposure to ammonia and acute respiratory effects in a urea fertilizer factory. Int. J. Occup. Environ. Health 2007, 13, 153–159. [Google Scholar] [CrossRef]
- Quintana, A.; López-Doval, L.; Rodríguez, R.; Souto, J.A.; Casares, J.J. Risk analysis in the chemical industry: An urea-formaldehyde resins case. WIT Trans. Ecol. Environ. 2006, 91, 33. [Google Scholar] [CrossRef]
- Sands, J.M. Regulation of urea transporter proteins in kidney and liver. Mt. Sinai J. Med. 2000, 67, 112–119. [Google Scholar] [PubMed]
- Lu, H.Y.; Ning, X.Y.; Chen, Y.Q.; Han, S.J.; Chi, P.; Zhu, S.N.; Yue, Y. Predictive Value of Serum Creatinine, Blood Urea Nitrogen, Uric Acid, and β2-Microglobulin in the Evaluation of Acute Kidney Injury after Orthotopic Liver Transplantation. Chin. Med. J. 2018, 131, 1059–1066. [Google Scholar] [CrossRef] [PubMed]
- Morris, S.M., Jr.; Moncman, C.L.; Kepka, D.M.; Nebes, V.L.; Diven, W.F.; Dizikes, G.J.; Cederbaum, S.D.; DeFranco, D. Effects of deletions in mouse chromosome 7 on expression of genes encoding the urea-cycle enzymes and phosphoenolpyruvate carboxykinase (GTP) in liver, kidney, and intestine. Biochem. Genet. 1988, 26, 769–781. [Google Scholar] [CrossRef]
- Takatsu, K.; Ishizaka, K. Reaginic antibody formation in the mouse. VI. Suppression of IgE and IgG antibody responses to ovalbumin following the administration of high dose urea-denatured antigen. Cell Immunol. 1975, 20, 276–289. [Google Scholar] [CrossRef]
- Ferrando, S.; Gallus, L.; Gambardella, C.; Marchesotti, E.; Ravera, S.; Franceschini, V.; Masini, M.A. Effects of urea on the molecules involved in the olfactory signal transduction: A preliminary study on Danio rerio. Fish. Physiol. Biochem. 2014, 40, 1793–1800. [Google Scholar] [CrossRef]
- Alderton, W.K.; Cooper, C.E.; Knowles, R.G. Nitric oxide synthases: Structure, function and inhibition. Biochem. J. 2001, 357, 593–615. [Google Scholar] [CrossRef] [PubMed]
- Imbrogno, S.; Tota, B.; Gattuso, A. The evolutionary functions of cardiac NOS/NO in vertebrates tracked by fish and amphibian paradigms. Nitric Oxide 2011, 25, 1–10. [Google Scholar] [CrossRef] [PubMed]
- Gomez, Y.; Vargas, J.P.; Lopez, J.C.; Portavella, M. Inhibition of brain NOS activity impair spatial learning acquisition in fish. Brain Res. Bull. 2020, 164, 29–36. [Google Scholar] [CrossRef] [PubMed]
- Peter, M.C.S.; Gayathry, R. Nitric oxide synthase (NOS) inhibitor L-NAME activates inducible NOS/NO system and drives multidimensional regulation of Na(+)/K(+) -ATPase in ionocyte epithelia of immersion-stressed air-breathing fish (Anabas testudineus Bloch). J. Exp. Zool. A Ecol. Integr. Physiol. 2021, 335, 396–416. [Google Scholar] [CrossRef]
- Gray, W.P.; Cheung, A. Nitric Oxide Regulation of Adult Neurogenesis. Nitric Oxide 2014, 96, 59–77. [Google Scholar] [CrossRef]
- Bernstein, H.G.; Keilhoff, G.; Steiner, J.; Dobrowolny, H.; Bogerts, B. Nitric oxide and schizophrenia: Present knowledge and emerging concepts of therapy. CNS Neurol. Disord. Drug Targets 2011, 10, 792–807. [Google Scholar] [CrossRef]
- Hannibal, L. Nitric Oxide Homeostasis in Neurodegenerative Diseases. Curr. Alzheimer Res. 2016, 13, 135–149. [Google Scholar] [CrossRef]
- Kotamraju, S.; Kalivendi, S.; Shang, T.; Kalyanaraman, B. Nitric oxide, proteasomal function, and iron homeostasis—Implications in aging and neurodegenerative diseases. Method. Enzymol. 2005, 396, 526–534. [Google Scholar] [CrossRef]
- Peña-Altamira, E.; Petazzi, P.; Contestabile, A. Nitric Oxide Control of Proliferation in Nerve Cells and in Tumor Cells of Nervous Origin. Curr. Pharm. Des. 2010, 16, 440–450. [Google Scholar] [CrossRef]
- Luo, C.X.; Zhu, D.Y. Research progress on neurobiology of neuronal nitric oxide synthase. Neurosci. Bull. 2011, 27, 23–35. [Google Scholar] [CrossRef]
- Carreira, B.P.; Santos, D.F.; Santos, A.I.; Carvalho, C.M.; Araújo, I.M. Nitric Oxide Regulates Neurogenesis in the Hippocampus following Seizures. Oxidative Med. Cell. Longev. 2015, 2015, 451512. [Google Scholar] [CrossRef] [PubMed]
- Luo, C.X.; Jin, X.; Cao, C.C.; Zhu, M.M.; Wang, B.; Chang, L.; Zhou, Q.G.; Wu, H.Y.; Zhu, D.Y. Bidirectional Regulation of Neurogenesis by Neuronal Nitric Oxide Synthase Derived from Neurons and Neural Stem Cells. Stem Cells 2010, 28, 2041–2052. [Google Scholar] [CrossRef] [PubMed]
- Zhou, L.; Zhu, D.Y. Neuronal nitric oxide synthase: Structure, subcellular localization, regulation, and clinical implications. Nitric Oxide 2009, 20, 223–230. [Google Scholar] [CrossRef]
- Park, H.C.; Kim, C.H.; Bae, Y.K.; Yee, S.Y.; Kim, S.H.; Hong, S.K.; Shin, J.; Yoo, K.W.; Hibi, M.; Hirano, T.; et al. Analysis of upstream elements in the promoter leads to the establishment of transgenic zebrafish with fluorescent neurons. Dev. Biol. 2000, 227, 279–293. [Google Scholar] [CrossRef] [PubMed]
- Cacialli, P.; Mailhe, M.P.; Wagner, I.; Merkler, D.; Golub, R.; Bertrand, J.Y. Synergistic prostaglandin E synthesis by myeloid and endothelial cells promotes fetal hematopoietic stem cell expansion in vertebrates. EMBO J. 2022, 41, e108536. [Google Scholar] [CrossRef] [PubMed]
- Mahony, C.B.; Cacialli, P.; Pasche, C.; Monteiro, R.; Savvides, S.N.; Bertrand, J.Y. Hapln1b, a central organizer of the ECM, modulates kit signaling to control developmental hematopoiesis in zebrafish. Blood Adv. 2021, 5, 4935–4948. [Google Scholar] [CrossRef] [PubMed]
- Cacialli, P. Expression of Nerve Growth Factor and Its Receptor TrkA in the Reproductive System of Adult Zebrafish. Vet. Sci. 2022, 9, 225. [Google Scholar] [CrossRef] [PubMed]
- Cacialli, P.; Dogan, S.; Linnerz, T.; Pasche, C.; Bertrand, J.Y. Minichromosome maintenance protein 10 (mcm10) regulates hematopoietic stem cell emergence in the zebrafish embryo. Stem Cell Reports 2023, 18, 1534–1546. [Google Scholar] [CrossRef]
- Russo, B.; Borowczyk, J.; Cacialli, P.; Moguelet, P.; Truchetet, M.E.; Modarressi, A.; Brembilla, N.C.; Bertrand, J.; Boehncke, W.H.; Chizzolini, C. IL-25 participates in keratinocyte-driven dermal matrix turnover and is reduced in systemic sclerosis epidermis. Rheumatology 2022, 61, 4558–4569. [Google Scholar] [CrossRef]
- Yao, J.; Li, C.; Zhang, J.R.; Liu, S.K.; Feng, J.B.; Wang, R.J.; Li, Y.; Jiang, C.; Song, L.; Chen, A.L.; et al. Expression of nitric oxide synthase (NOS) genes in channel catfish is highly regulated and time dependent after bacterial challenges. Dev. Comp. Immunol. 2014, 45, 74–86. [Google Scholar] [CrossRef] [PubMed]
- Wang, S.; Ni, L.; Fu, X.; Duan, D.; Xu, J.; Gao, X. A Sulfated Polysaccharide from Saccharina japonica Suppresses LPS-Induced Inflammation Both in a Macrophage Cell Model via Blocking MAPK/NF-kappaB Signal Pathways In Vitro and a Zebrafish Model of Embryos and Larvae In Vivo. Mar. Drugs 2020, 18, 593. [Google Scholar] [CrossRef] [PubMed]
- Lin, M.Y.; Begho, T. Crop residue burning in South Asia: A review of the scale, effect, and solutions with a focus on reducing reactive nitrogen losses. J. Environ. Manag. 2022, 314, 115104. [Google Scholar] [CrossRef]
- Zielonka, M.; Probst, J.; Carl, M.; Hoffmann, G.F.; Kölker, S.; Okun, J.G. Bioenergetic dysfunction in a zebrafish model of acute hyperammonemic decompensation. Exp. Neurol. 2019, 314, 91–99. [Google Scholar] [CrossRef]
- Gil, C.; Hobbs, A.; Schmidlin, A.; Vogel, D.; Wiesinger, H. Generation of nitric oxide from urea cycle intermediates in brain cells. J. Neurochem. 1999, 73, S219. [Google Scholar]
- Gropman, A. Brain imaging in urea cycle disorders. Mol. Genet. Metab. 2010, 100, S20–S30. [Google Scholar] [CrossRef]
- Robinson, C.; Whitehead, M.; Ellenbogen, A.; Ludwig, W.; Gropman, A. Defining Brain Chemical Changes and Areas of the Brain Most Affected by High Ammonia Levels in Children with Urea Cycle Disorders. Ann. Neurol. 2016, 80, S345–S346. [Google Scholar]
- Fu, B.M.M.; Shin, D.W.; Fan, J.; Khadka, N.; Luu, E.; Khalid, W.; Xia, Y.F.; Bikson, M. Inhibition of Nitric Oxide Synthase (NOS) by NG-monomethyl-L-arginine (L-NMMA) Reduces Transient Increase in the Blood-Brain Barrier Solute Permeability in Rat Brain by Transcranial Direct Current Stimulation. FASEB J. 2018, 32, 922.2. [Google Scholar] [CrossRef]
- Chen, L.N.; Sun, J.; Yang, X.D.; Xiao, K.; Lv, Y.; Zhang, B.Y.; Zhou, W.; Chen, C.; Gao, C.; Shi, Q.; et al. The Brain NO Levels and NOS Activities Ascended in the Early and Middle Stages and Descended in the Terminal Stage in Scrapie-Infected Animal Models. Mol. Neurobiol. 2017, 54, 1786–1796. [Google Scholar] [CrossRef]
- Necchi, D.; Virgili, M.; Monti, B.; Contestabile, A.; Scherini, E. Regional alterations of the NO/NOS system in the aging brain: A biochemical, histochemical and immunochemical study in the rat. Brain Res. 2002, 933, 31–41. [Google Scholar] [CrossRef]
- da Silva Chaves, S.N.; Dutra Costa, B.P.; Vidal Gomes, G.C.; Lima-Maximino, M.; Pacheco Rico, E.; Maximino, C. NOS-2 participates in the behavioral effects of ethanol withdrawal in zebrafish. Neurosci. Lett. 2020, 728, 134952. [Google Scholar] [CrossRef] [PubMed]
- Xie, L.; Fang, P.; Lin, J.F.; Pan, H.C.; Zhang, F.; Shen, Y.Q. Expression of gdnf and nos in adult zebrafish brain during the regeneration after spinal cord injury. Yi Chuan 2013, 35, 495–501. [Google Scholar] [CrossRef] [PubMed]
- Annona, G.; Ferran, J.L.; De Luca, P.; Conte, I.; Postlethwait, J.H.; D’Aniello, S. Expression Pattern of in the Developing Nervous System of Ray-Finned Fish. Genes 2022, 13, 918. [Google Scholar] [CrossRef]
- Gutiérrez, H.C.; O’Leary, A.; Freudenberg, F.; Fedele, G.; Wilkinson, R.; Markham, E.; van Eeden, F.; Reif, A.; Norton, W.H.J. Nitric oxide interacts with monoamine oxidase to modulate aggression and anxiety-like behaviour. Eur. Neuropsychopharm. 2020, 30, 30–43. [Google Scholar] [CrossRef] [PubMed]
- Husson, A.; Brasse-Lagnel, C.; Fairand, A.; Renouf, S.; Lavoinne, A. Argininosuccinate synthetase from the urea cycle to the citrulline-NO cycle. Eur. J. Biochem. 2003, 270, 1887–1899. [Google Scholar] [CrossRef] [PubMed]
- Javrushyan, H.; Avtandilyan, N.; Trchounian, A. The effects of NO on the urea cycle pathway in short-term intermittent hypobaric hypoxia in rats. Respir. Physiol. Neurobiol. 2021, 285, 103598. [Google Scholar] [CrossRef]
- Shekar Roy, H.; Neethu, K.M.; Rajput, S.; Sadhukhan, S.; Gowri, V.; Hassan Dar, A.; Monga, M.; Salaria, N.; Guha, R.; Chattopadhyay, N.; et al. Efficient Nitric Oxide Scavenging by Urea-Functionalized Push-Pull Chromophore Modulates NO-Mediated Diseases. Chemistry 2023, 29, e202301748. [Google Scholar] [CrossRef]
- Moeslinger, T.; Spieckermann, P.G. Urea-induced inducible nitric oxide synthase inhibition and macrophage proliferation. Kidney Int. Suppl. 2001, 78, S2–S8. [Google Scholar] [CrossRef]
Figure 1.
Analysis of NOS gene expression by qPCR. (a) Experimental outline of qPCR experiments at different stages of embryonic brain development (24; 48; 72 and 96 hpf). A pool of 30 heads was used for each group. (b) qPCR analysis of NOS gene family: nos1, nos2a, and nos2b. The gene, nos1, was the most expressed during brain development in zebrafish embryos, compared to nos2a and nos2b (** p < 0.001; *** p < 0.0001; ns: not-significant). All results are represented as the means ± SD of three independent experiments.

Figure 2.
Whole-mount in situ hybridization and chromogenic revelation for nos1, nos2a, and nos2b genes at different stages of zebrafish embryonic development (24, 48, 72, and 96 hpf). Expression of nos1 is high in the brain and eyes at all stages of development.
Figure 2.
Whole-mount in situ hybridization and chromogenic revelation for nos1, nos2a, and nos2b genes at different stages of zebrafish embryonic development (24, 48, 72, and 96 hpf). Expression of nos1 is high in the brain and eyes at all stages of development.

Figure 3.
Fluorescence whole-mount in situ hybridization for nos1 combined with immunohistochemistry to detect anti-GFP in HuC:GFP embryos at 30 hpf. (a) Fluorescence WISH for nos1, rectangles indicate respectively head and spinal cord. (b) Fluorescence WISH for nos1 (red), combined with immunohistochemistry to detect anti-GFP (green) in the heads of HuC:GFP embryos. (c) Fluorescence WISH for nos1 (red), combined with immunohistochemistry to detect anti-GFP (green) in the spinal cord of HuC:GFP embryos, with zoom of spinal cord region (within the rectangle box, white arrows indicate co-expressed cells).

Figure 4.
(a) Experimental outline of urea treatment in zebrafish embryos. (b) Survival rate of zebrafish embryos (40 embryos per group) treated with different concentrations of urea (0, 10, 50, 100 mM).
Figure 4.
(a) Experimental outline of urea treatment in zebrafish embryos. (b) Survival rate of zebrafish embryos (40 embryos per group) treated with different concentrations of urea (0, 10, 50, 100 mM).

Figure 5.
Morphological evaluation at 24 hpf of zebrafish embryos having undergone urea exposure (0, 10, 50, 100 mM).
Figure 5.
Morphological evaluation at 24 hpf of zebrafish embryos having undergone urea exposure (0, 10, 50, 100 mM).

Figure 6.
Fluorescence WISH for nos1 and DAPI (to mark cell nuclei) in control and urea-treated embryos (dorsal view of head).
Figure 6.
Fluorescence WISH for nos1 and DAPI (to mark cell nuclei) in control and urea-treated embryos (dorsal view of head).

Figure 7.
(a) Fluorescence WISH for nos1 and DAPI in control and urea-treated embryos at 48 hpf (dorsal view of head). (b) Fluorescence WISH for nos1 and DAPI in control and urea-treated embryos at 72 hpf (dorsal view of head).
Figure 7.
(a) Fluorescence WISH for nos1 and DAPI in control and urea-treated embryos at 48 hpf (dorsal view of head). (b) Fluorescence WISH for nos1 and DAPI in control and urea-treated embryos at 72 hpf (dorsal view of head).

Figure 8.
Fluorescence WISH for nos1 and DAPI in control and urea-treated embryos at 96 hpf (dorsal view of head).
Figure 8.
Fluorescence WISH for nos1 and DAPI in control and urea-treated embryos at 96 hpf (dorsal view of head).

Figure 9.
(a) Fluorescence ISH for nos1, TUNEL staining and DAPI in control and urea-treated embryos at 96 hpf (paraffin section of brain from embryos). (b) Statistical analysis (unpaired t test) of nos1-expressing cell number was calculated based on average of three paraffin sections obtained from 10 urea-treated heads and 10 non-treated heads (** p < 0.001). (c) Statistical analysis (unpaired t test) of TUNEL positive cell number was calculated based on average of three paraffin sections obtained from 10 urea-treated heads and 10 non-treated heads (*** p < 0.0001).

Figure 10.
(a) NO production was detected at 96 hpf after urea treatment and/or supplementation with LPS (to stimulate NO production). The intracellular NO production levels were observed via a fluorescence microscope after staining with diamino fluorophore DAF-FM DA. (b) Relative fluorescence intensity. All results are represented as the means ± SD of three independent experiments. Statistical analysis was performed by one-way ANOVA (multiple comparison—Tukey–Kramer post hoc test) using calculations from a total of 15 embryos (** p < 0.001; *** p < 0.0001; ns: not significant).


Table 1.
qPCR primers.
| ef1a-QF | CTACCTACCCTCCTCTTGGT |
| ef1a-QR | CTTCTGTGCAGACTTTGTGA |
| nos1-QF | TTGGATAGTGCCACCCATGT |
| nos1-QR | GCGTCCCATTCACTCCTTTC |
| nos2a-QF | TGGAGAAATGCGCCAAGATG |
| noa2a-QR | CCGTTGGTGGCATACTTCAG |
| nos2b-QF | TGGCTCTCGGATGTATCCAC |
| nos2b-QR | CAGCTCATCTCCCTCTCCTG |
| pcna-QF | CAAGGAGGATGAAGCGGTAACA |
| pcna-QR | CTGCGGACATGCTAAGTGTG |
Table 2.
Primers for in situ probes.
| nos1-F | CGCTCACAAACCAGATGAAG |
| nos1-R | GCTGCATACAGATCTCTGTAAG |
| nos2a-F | CCAGGACTCACTTCATCACA |
| nos2a-R | CCATCTGATAGCCAGCATACT |
| nos2b-F | CGTGCCATCAAGATGTGTTAC |
| nos2b-R | TAGCCAGCGTATCGTATGAG |
| pcna-F | CCTTAAGAAGGTCCTGGAG |
| pcna-R | CCACACAACTGTATTCCTGCTC |
Disclaimer/Publisher’s Note: The statements, opinions and data contained in all publications are solely those of the individual author(s) and contributor(s) and not of MDPI and/or the editor(s). MDPI and/or the editor(s) disclaim responsibility for any injury to people or property resulting from any ideas, methods, instructions or products referred to in the content. |
© 2024 by the authors. Licensee MDPI, Basel, Switzerland. This article is an open access article distributed under the terms and conditions of the Creative Commons Attribution (CC BY) license (https://creativecommons.org/licenses/by/4.0/).
Share and Cite
MDPI and ACS Style
Cacialli, P.; Ricci, S.; Frabetti, F.; Ferrando, S.; Franceschini, V. Exposure of Zebrafish Embryos to Urea Affects NOS1 Gene Expression in Neuronal Cells. Environments 2024, 11, 41. https://doi.org/10.3390/environments11030041
AMA Style
Cacialli P, Ricci S, Frabetti F, Ferrando S, Franceschini V. Exposure of Zebrafish Embryos to Urea Affects NOS1 Gene Expression in Neuronal Cells. Environments. 2024; 11(3):41. https://doi.org/10.3390/environments11030041
Chicago/Turabian StyleCacialli, Pietro, Serena Ricci, Flavia Frabetti, Sara Ferrando, and Valeria Franceschini. 2024. "Exposure of Zebrafish Embryos to Urea Affects NOS1 Gene Expression in Neuronal Cells" Environments 11, no. 3: 41. https://doi.org/10.3390/environments11030041
Note that from the first issue of 2016, this journal uses article numbers instead of page numbers. See further details here.