Article

Multi-Endpoint Analysis of Cerium and Gadolinium Effects after Long-Term Exposure to Phaeodactylum tricornutum

by
Antonietta Siciliano
1,†,
Marisa Spampinato
1,2,†,
Giovanna Salbitani
1,*,
Marco Guida
1,2,
Simona Carfagna
1,
Antonios Apostolos Brouziotis
1,3,
Marco Trifuoggi
3,
Rosanna Bossa
1,
Lorenzo Saviano
1,
Edith Guadalupe Padilla Suarez
1,† and
Giovanni Libralato
1,†
1
Department of Biology, University of Naples Federico II, 80126 Naples, Italy
2
NBFC, National Biodiversity Future Center, 90133 Palermo, Italy
3
Department of Chemical Sciences, University of Naples Federico II, 80126 Naples, Italy
*
Author to whom correspondence should be addressed.
These authors contributed equally to this work.
Environments 2024, 11(3), 58; https://doi.org/10.3390/environments11030058
Submission received: 30 January 2024 / Revised: 14 March 2024 / Accepted: 15 March 2024 / Published: 18 March 2024

Abstract

:
The significantly increasing levels of Rare Earth Elements (REEs) in seawater are largely due to multiple anthropogenic activities. Their effects on marine primary producers such as Phaeodactylum tricornutum have not been fully assessed. This study focused on examining the long-term impacts of these two commonly occurring REEs, cerium (Ce) and gadolinium (Gd), on marine diatoms by 28 d of exposure. The 72 h effective concentrations that inhibited the growth of 20% (EC20) and 50% (EC50) of the exposed population were used for long-term exposures. The growth, oxidative stress level, photosynthetic pigments, and chlorophyll fluorescence were assessed in the diatoms, after 7, 14, 21, and 28 d of REEs exposure. Results display a difference in the toxicity induced by the two elements. Exposure to 2.39 mg/L (EC20) and 3.13 mg/L (EC50) of Ce, and to 4.52 mg/L (EC20) and 6.02 mg/L (EC50) of Gd displayed a lower effect on the growth of algae cells, as the response remained below 20% for inhibition or stimulation. Except for GD, the ROS and the activities of SOD, and LPO showed, during the exposure, comparable levels respect to control cells. A change in chlorophyll levels was also observed especially under Ce exposure. Both elements showed changes in photosynthetic performance. This study provides new insights into the different effects of Ce and Gd on P. tricornutum, demonstrating their diverse modes of action on this important primary producer. The findings provide further evidence of the adverse effects of anthropogenic REEs pollution on marine ecosystems.

1. Introduction

In recent decades, various industrial sectors, such as automotive, hi-tech, health, and agriculture, have started exploiting rare earth elements (REEs) due to their unique and peculiar properties [1,2]. As a result, their extraction and refinery for multiple applications have experienced rapid and exponential growth with a global production of 300,000 tons in 2022 [3].
Anthropogenic use of REEs have led to their increase in the environment. In seawater, REEs anomalies have been detected in samples from Plymouth Sound (UK) [4], Ibaraki (Japan) [5], and the Western Philippines [6]. Moreover, in seawater, the REEs distribution depends on various factors, such as terrestrial and hydrothermal sources, as well as depth, salinity, and oxygen levels [7,8]. Concentration ranges measured in these regions indicate substantial variability, with cerium concentrations ranging between 18.2 and 143 ppm, and gadolinium concentrations ranging from 3.02 to 6.82 ppm. Furthermore, anthropogenic REEs which are strongly chelated and anionic, tend to behave conservatively and have a long environmental half-life [9,10,11,12].
The increasing concentration of REEs in aquatic ecosystems could significantly impact the living organisms inhabiting them and in particular the primary producers at the base of the food chain [13]. Moreover, data is particularly limited regarding marine environments [14,15]. Marine and estuarine environments play critical roles in providing various resources and services, therefore, it is essential to investigate the potential impacts of these contaminants on inhabiting biota [14].
Little to no information is currently available regarding long-term exposure at low concentrations of REEs, representing a more environmentally realistic scenario. This study investigated the response of marine diatom Phaeodactylum tricornutum to Ce and Gd exposure for 28 d. To enhance the understanding of the potential adverse effects of REEs in marine environments, data regarding the growth, antioxidant enzymes activities, photosynthetic pigment contents, and chlorophyll fluorescence were evaluated.

2. Materials and Methods

2.1. Chemicals

The experiments were performed using commercially available chemicals: Ce (Ce(III) nitrate hydrate; purity 99.9%) and Gd (Gd oxide; purity 99.9%) in nitric acid (2%) from Agilent (Santa Clara, CA, USA). REEs were added to artificial seawater [16] at least 1 h before exposure. Each week (7, 14, 21, and 28 d) new solutions were prepared for renewal and before algae exposure, the pH of the treatment solutions was daily monitored (pH meter Mettler Toledo Five Easy, Milan, Italy).
To determine the total concentrations of Ce and Gd, samples were analysed by inductively coupled plasma mass spectrometry (ICP-MS, Aurora M90 Bruker, Mannheim, Germany). Samples were collected from the solutions before algae exposure (7, 14, 21, and 28 d) and further diluted into a HNO3 solution (2% v/v). Analyses were carried out in triplicate.

2.2. Algae Culture and Growth Inhibition Test

Cultures of P. tricornutum were maintained at the Hygiene Laboratory of the Department of Biology of the University of Naples Federico II. Cultures were maintained in artificial sea water medium supplemented with nutrients according to ISO 10253:2016 [16]. The medium contained: 3 mg/L K3PO4, 50 mg/L NaNO3, 14.9 mg/L Na2SiO3⋅5H2O, and micronutrients according to the protocol. The temperature was maintained at 22 ± 1 °C under a 16:8 day/night cycle, with light of 90 µmol m−2 s−1 and with continuous shaking at 50 rpm. A preliminary 3-day (d) test was conducted to determine EC20 and EC50 values, covering a concentration range from 0.1 to 100 mg/L. This short-term test provided essential data for determining the appropriate exposure concentrations for the subsequent 28-d test.
The 28 d test was performed according to the ISO [16], with a modification on the time of exposure. The concentrations of exposure were determined by effective concentrations obtained from a 3-growth inhibition test [16]. The measured effect concentrations producing 20% (EC20) and 50% (EC50) of inhibition of growth were used, corresponding to 2.39 mg/L and 3.13 mg/L for Ce and 4.75 mg/L and 6.02 mg/L for Gd.
During the 28 d, inocula of 105 cell/mL of algae were grown in 100 mL flasks containing media spiked with REEs and were incubated under the same climate controlled conditions as the culture. The semi-static conditions were achieved each week through inocula (105 cell/mL) taken from the previously exposed algal cultures and transferred to a fresh sterile spiked medium. Tests were performed in triplicate and cell density was measured as absorbance at 670 nm (Hach Lange DR5000 spectrophotometer, Hach Lange GmbH, Düsseldorf, Germany) on 7, 14, 21, and 28 d samples.

2.3. Oxidative Stress Biomarkers and Antioxidant Activity

Algae suspension (50 mL) were collected on 7, 14, 21, and 28 d to analyse reactive oxygen species (ROS) production and the activities of superoxide dismutase (SOD) and lipid peroxide (LPO) enzymes as antioxidant defence. High-pressure homogenization (French press cell, Thermo Electron Co., Waltham, MA, USA) was used to break down the cell wall of P. tricornutum. The cells were lysed in PBS (50 mM potassium phosphate buffer, pH 7.4) and then centrifuged for 20 min at 3000× g (4 °C). The supernatant was collected and stored at 4 °C. According to Bradford assay [17], the protein content was defined using a spectrophotometer (Hach-Lange DR 5000, Hach Lange GmbH, Düsseldorf, Germany)). The ability of free radicals to oxidize the nonfluorescent probe carboxy-H2DFFDA into a fluorescent product was used to quantify ROS; measured by a spectrofluorometer with an excitation wavelength of 485 nm and an emission wavelength of 530 nm (Synergy™ H4 Hybrid Multi-Mode Microplate Reader, BioTek®, Inc, Winooski, VT, USA). The SOD and LPO were determined using Elabscience (Houston, TX, USA) assay kit (E-BC-K019-S and E-BC-K176-M, respectively) according to the manufacturer’s protocol.

2.4. Photosynthetic Pigments and Chlorophyll Fluorescence

Algae suspension of all treatment groups were collected on 7, 14, 21, and 28 d to analyse the photosynthetic pigments, including the total chlorophylls (Chl tot) and chlorophyll a (Chl a). Further, the chlorophyll fluoresce was analysed from samples collected at 28 d of exposure, to assess the adaptation and photosynthetic capacity of the cells.
Samples (10 mL) for photosynthetic pigments analysis were collected and centrifuged at 12,000× g for 10 min. Supernatants were discarded and the cellular pellets were resuspended in N,N-dimethylformamide (v/v 1:1) according to [18]. Pigments were extracted in the dark at 4 °C for about 24 h. The absorbance of the samples was measured, using glass cuvettes, at 664 and647 nm. The chlorophylls were calculated according to Inskeep and Bloom [19].
For the fluorescence parameter Fv/Fm, an aliquot of 15 mL of P. tricornutum cultures was separated from the medium by filtration on 0.2 µm pore size Sartorius polyamide membrane [20]. Filtered microalgae were acclimated in the dark for 30 min before analysis. After dark adaptation, samples were analysed with a Maxi Imaging-PAM M-Series Chlorophyll Fluorometer (Heinz Walz GmbH, Effeltrich, Germany). The maximal quantum efficiency of PSII in the dark (Fv/Fm, where Fv is the variable and Fm is the maximal fluorescence in dark-adapted organisms) was determined. Furthermore, samples were illuminated with a saturating pulse following as reported in [21], and values derived from the formula:
Fv/Fm = (Fm − F0)/Fm

2.5. Bioaccumulation

Algae suspension (50 mL) were collected on 7, 14, 21, and 28 d before media renewal. Samples were filtered with a 0.45 µm filter and dried at 65 °C for 24 h. Furthermore, filters were digested in 2.5 mL HNO3 ultra-pure and 0.5 mL H2O2 ultra-pure overnight at room temperature and analysed via ICP-MS.
The bioaccumulation factor (BCF) was computed as the homeostatic ratio of rare earth element concentration on P. tricornutum to rare earth element concentration in the culture medium. The BCF was used for quantifying Ce and Gd removal potential of P. tricornutum. Based on the EU REACH regulation, an element with BCF < 2000 is deemed ‘not bioaccumulative’, with BCF > 2000 is deemed ‘bio-accumulative’, and with BCF > 5000 is classified as ‘very bio-accumulative’.

2.6. Data Analysis

For the endpoints of growth rate, oxidative stress biomarkers, results were normalized to the control of the sampling time and are presented as mean values. The analysis was executed using XLSTAT software (version 2016.02.27444, Addinsoft, Inc., Brooklyn, NY, USA), and GraphPad Prism 8.0 (GraphPad, San Diego, CA, USA).
Pigments content and chlorophyll fluorescence analysis were presented as the mean values measured from samples taken on 28 d of exposure. Results among treatments were analysed for statistical differences using one-way analysis of variance (ANOVA) after testing for normality and homoscedasticity. Tukey’s post hoc test was performed.
A principal component analysis (PCA) of the obtained results was performed to observe the similarity and correlation between the measured endpoints. These statistical analyses and graphs were conducted using Microsoft® Excel 2013/XLSTAT©-Pro (Version 7.2, 2003, Addinsoft, Inc., Brooklyn, NY, USA).

3. Results

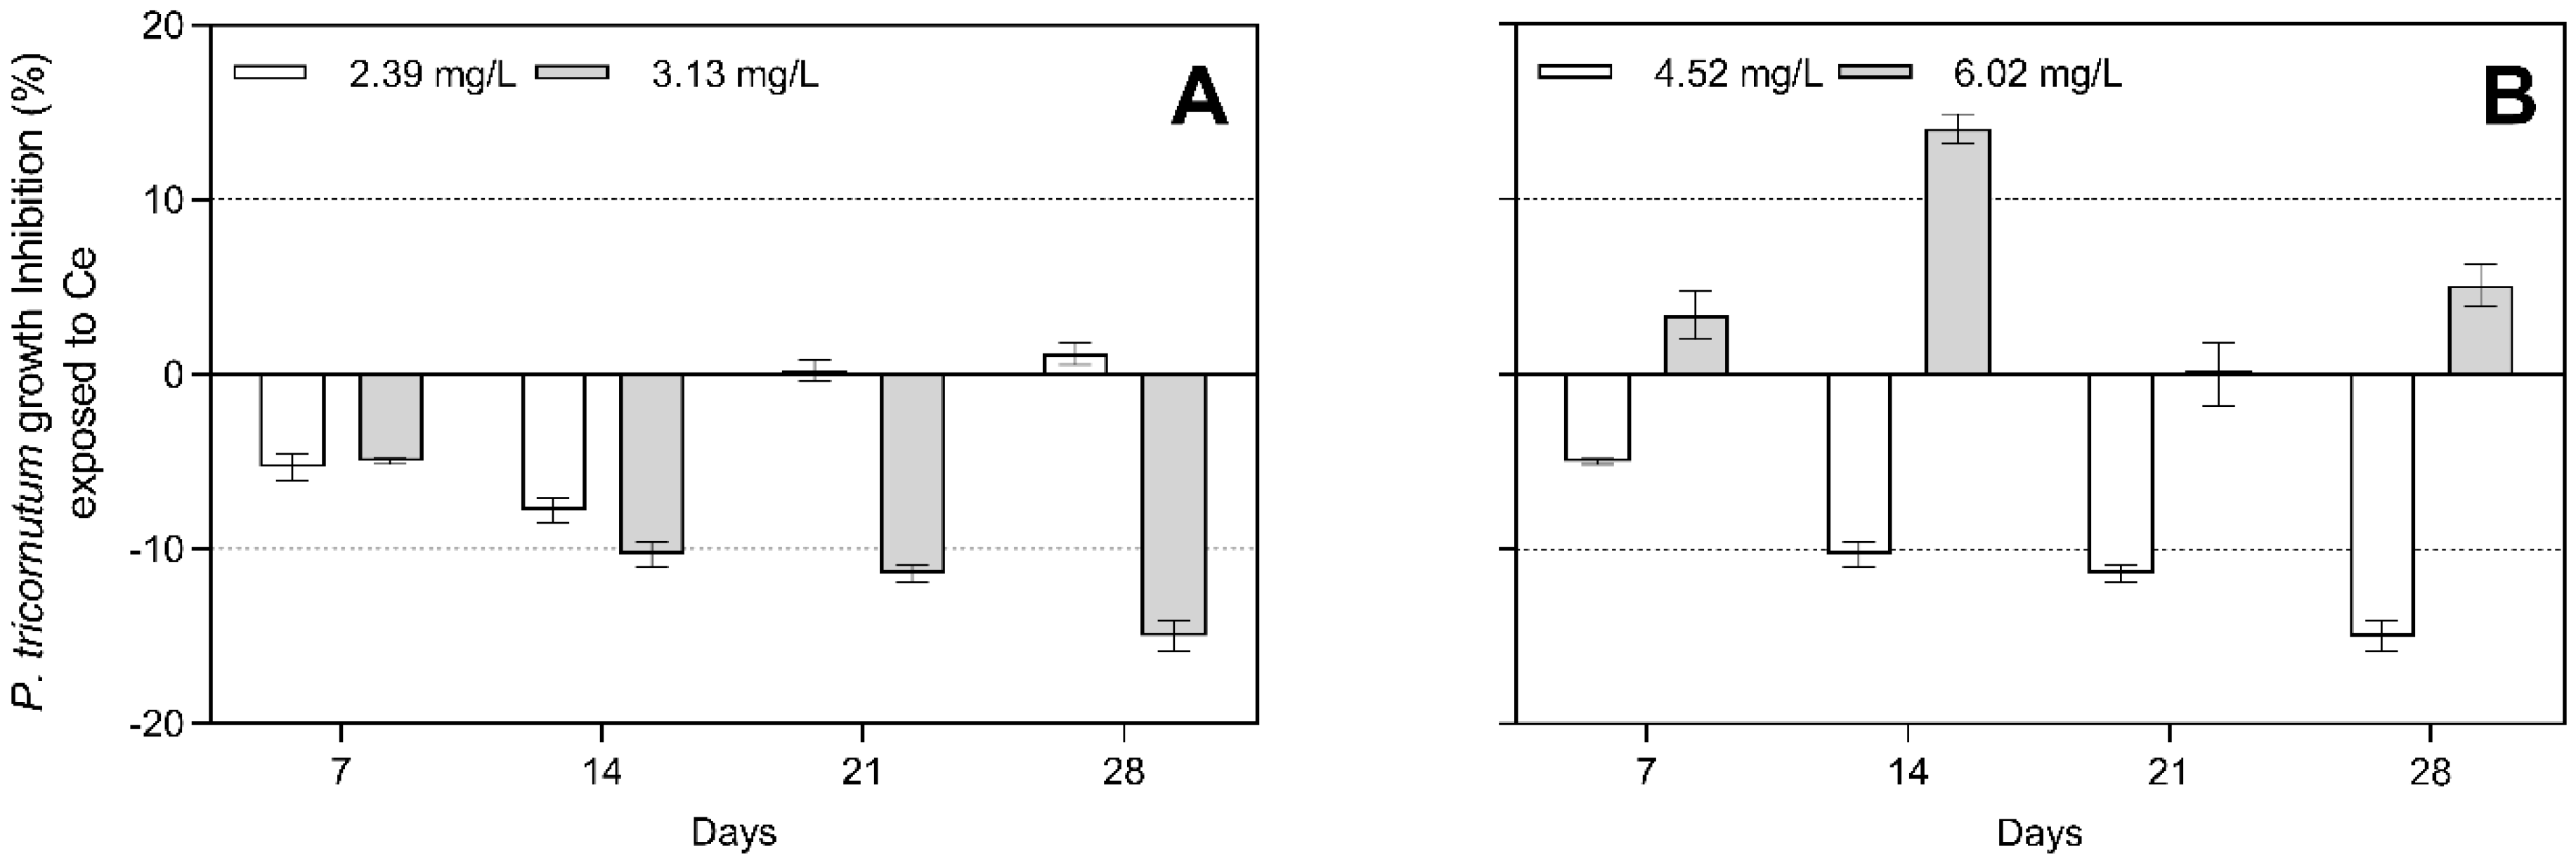
3.1. Algal Growth Inhibitory Effects

The total measured concentrations for the Ce and Gd are presented in the Supplementary Data (Table S1). Measured Ce concentrations ranged from 2.29 to 2.49 mg/L for EC20 (2.39 mg/L), and from 3.00 to 3.27 mg/L for EC50 (3.13 mg/L). For Gd, the measured concentrations ranged from 4.25 to 4.79 mg/L for the EC20 (4.52 mg/L) and from 5.66 to 6.38 mg/L for the EC50 (6.02 mg/L).
During 28 d of Ce exposure (Figure 1A), the 2.39 mg/L concentration caused stimulation of growth in the first 14 d, whereas at 21 and 28 d, there was little to no effect compared to the control culture. Moreover, the 3.13 mg/L exposure induced stimulation of growth during all of the days sampled, displaying an increasing growth with longer treatment. For Gd exposure (Figure 1B), the 4.52 mg/L concentration showed a time-dependent stimulation in the growth. As for the 6.02 mg/L exposure, over the 28 d of the test, an inhibition, at all times tested, was observed. The higher inhibition was observed after 14 d of exposure; however, the remaining days the inhibition did not reach more than 10%.

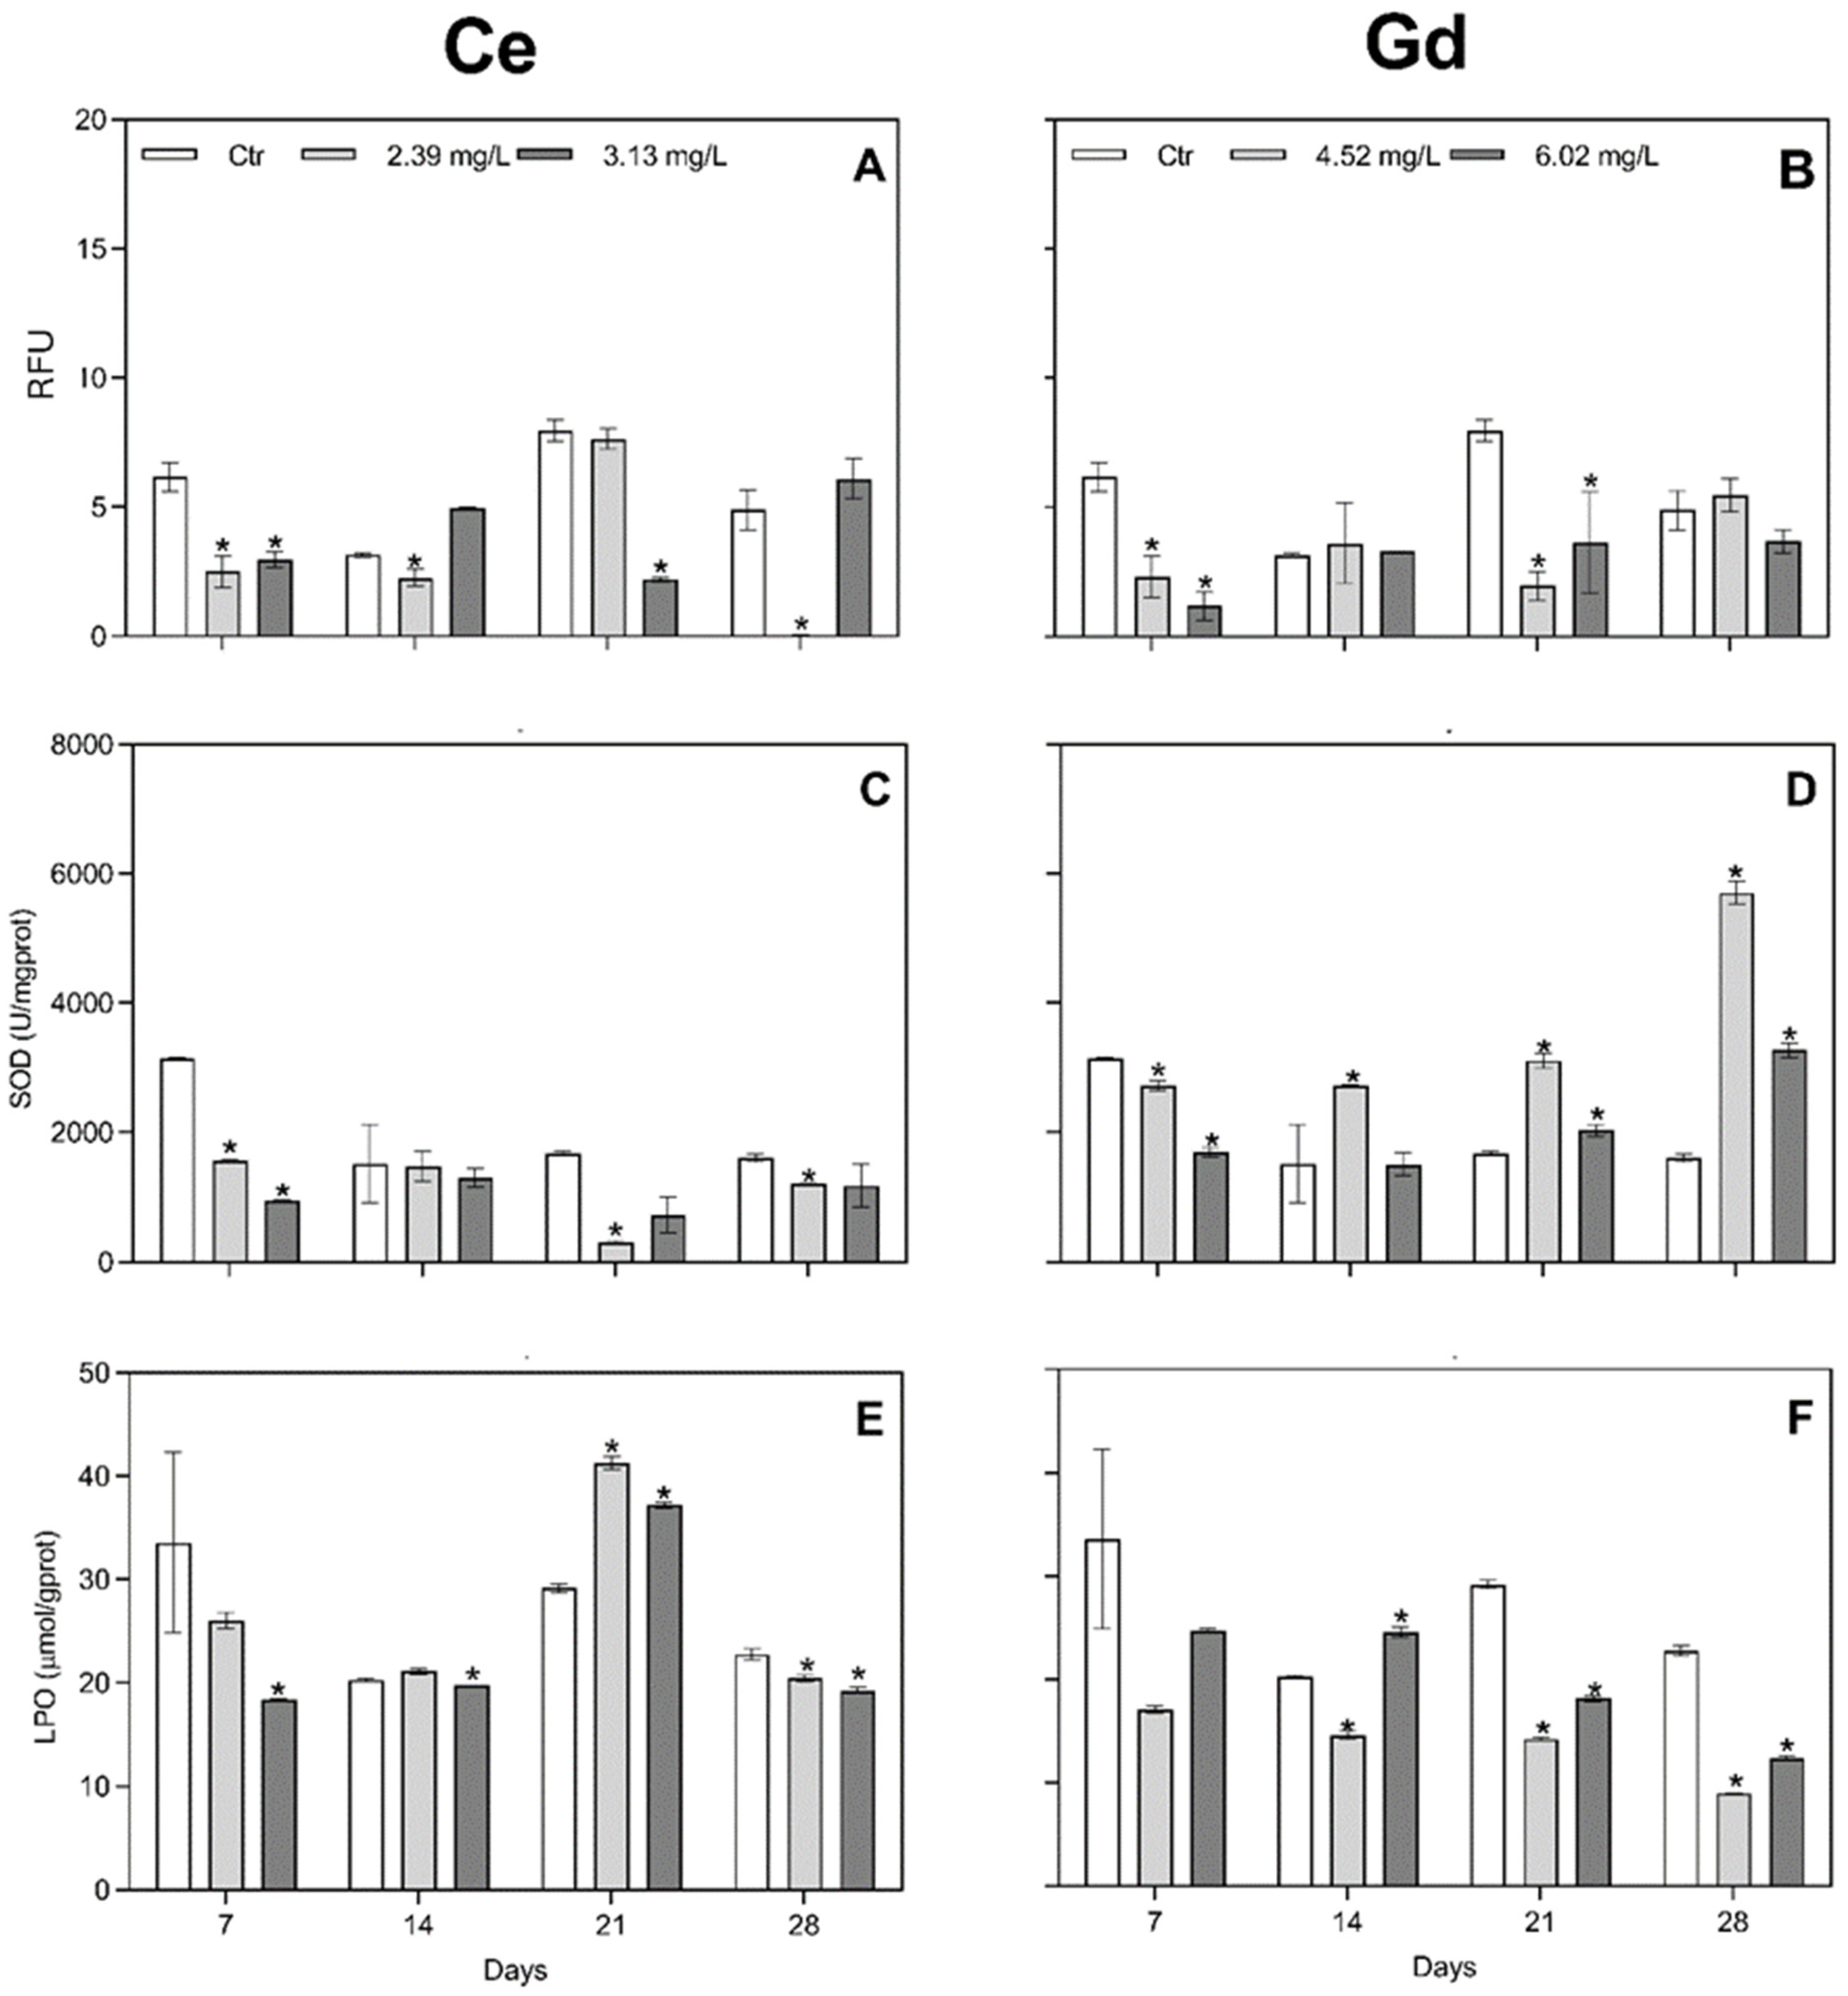
3.2. Oxidative Stress Response

The oxidative response to Ce and Gd exposure are shown in Figure 2. For both elements at all concentration (Ce 2.39–3.13 mg/L and Gd 4.52–6.02 mg/L), the ROS production was lower or comparable with the control.
For the SOD activity, results are displayed in Figure 2C for Ce, and Figure 2D for Gd. Under Ce exposure the SOD activity was maintained similar to the control or below. A significant decrease was observed at 7, 21, and 28 d while remaining in similar values as the control on 14 d. For Gd treatment, in the 4.52 mg/L exposure, the activity was maintained significantly higher than the control and relatively constant during 21 d. However, on 28 d the activity significantly increased, being around three times higher than the control. For the 6.02 mg/L exposure, the activity was significantly lower at 7 d, remained similar on 14 d, and significantly increased on 28 d.
As for the LPO activity, results are displayed in Figure 2E for Ce, and Figure 2F for Gd. For Ce, the 2.39 mg/L exposure did not induce significant changes on 7 and 14 d. While at 21 d the activity was significantly higher but significantly lower at 28 d. For the 3.13 mg/L exposure, changes remained significantly different from the Ctr. The activity was reduced on 7, 14, and 28 d, while on 21 d, it was higher. The Gd exposure, the 4.52 mg/L exposure induced a reduced activity during the 28 d. For the 6.02 mg/L exposure, the activity remained lower on 7, 21, and 28 d and higher on 14 d.

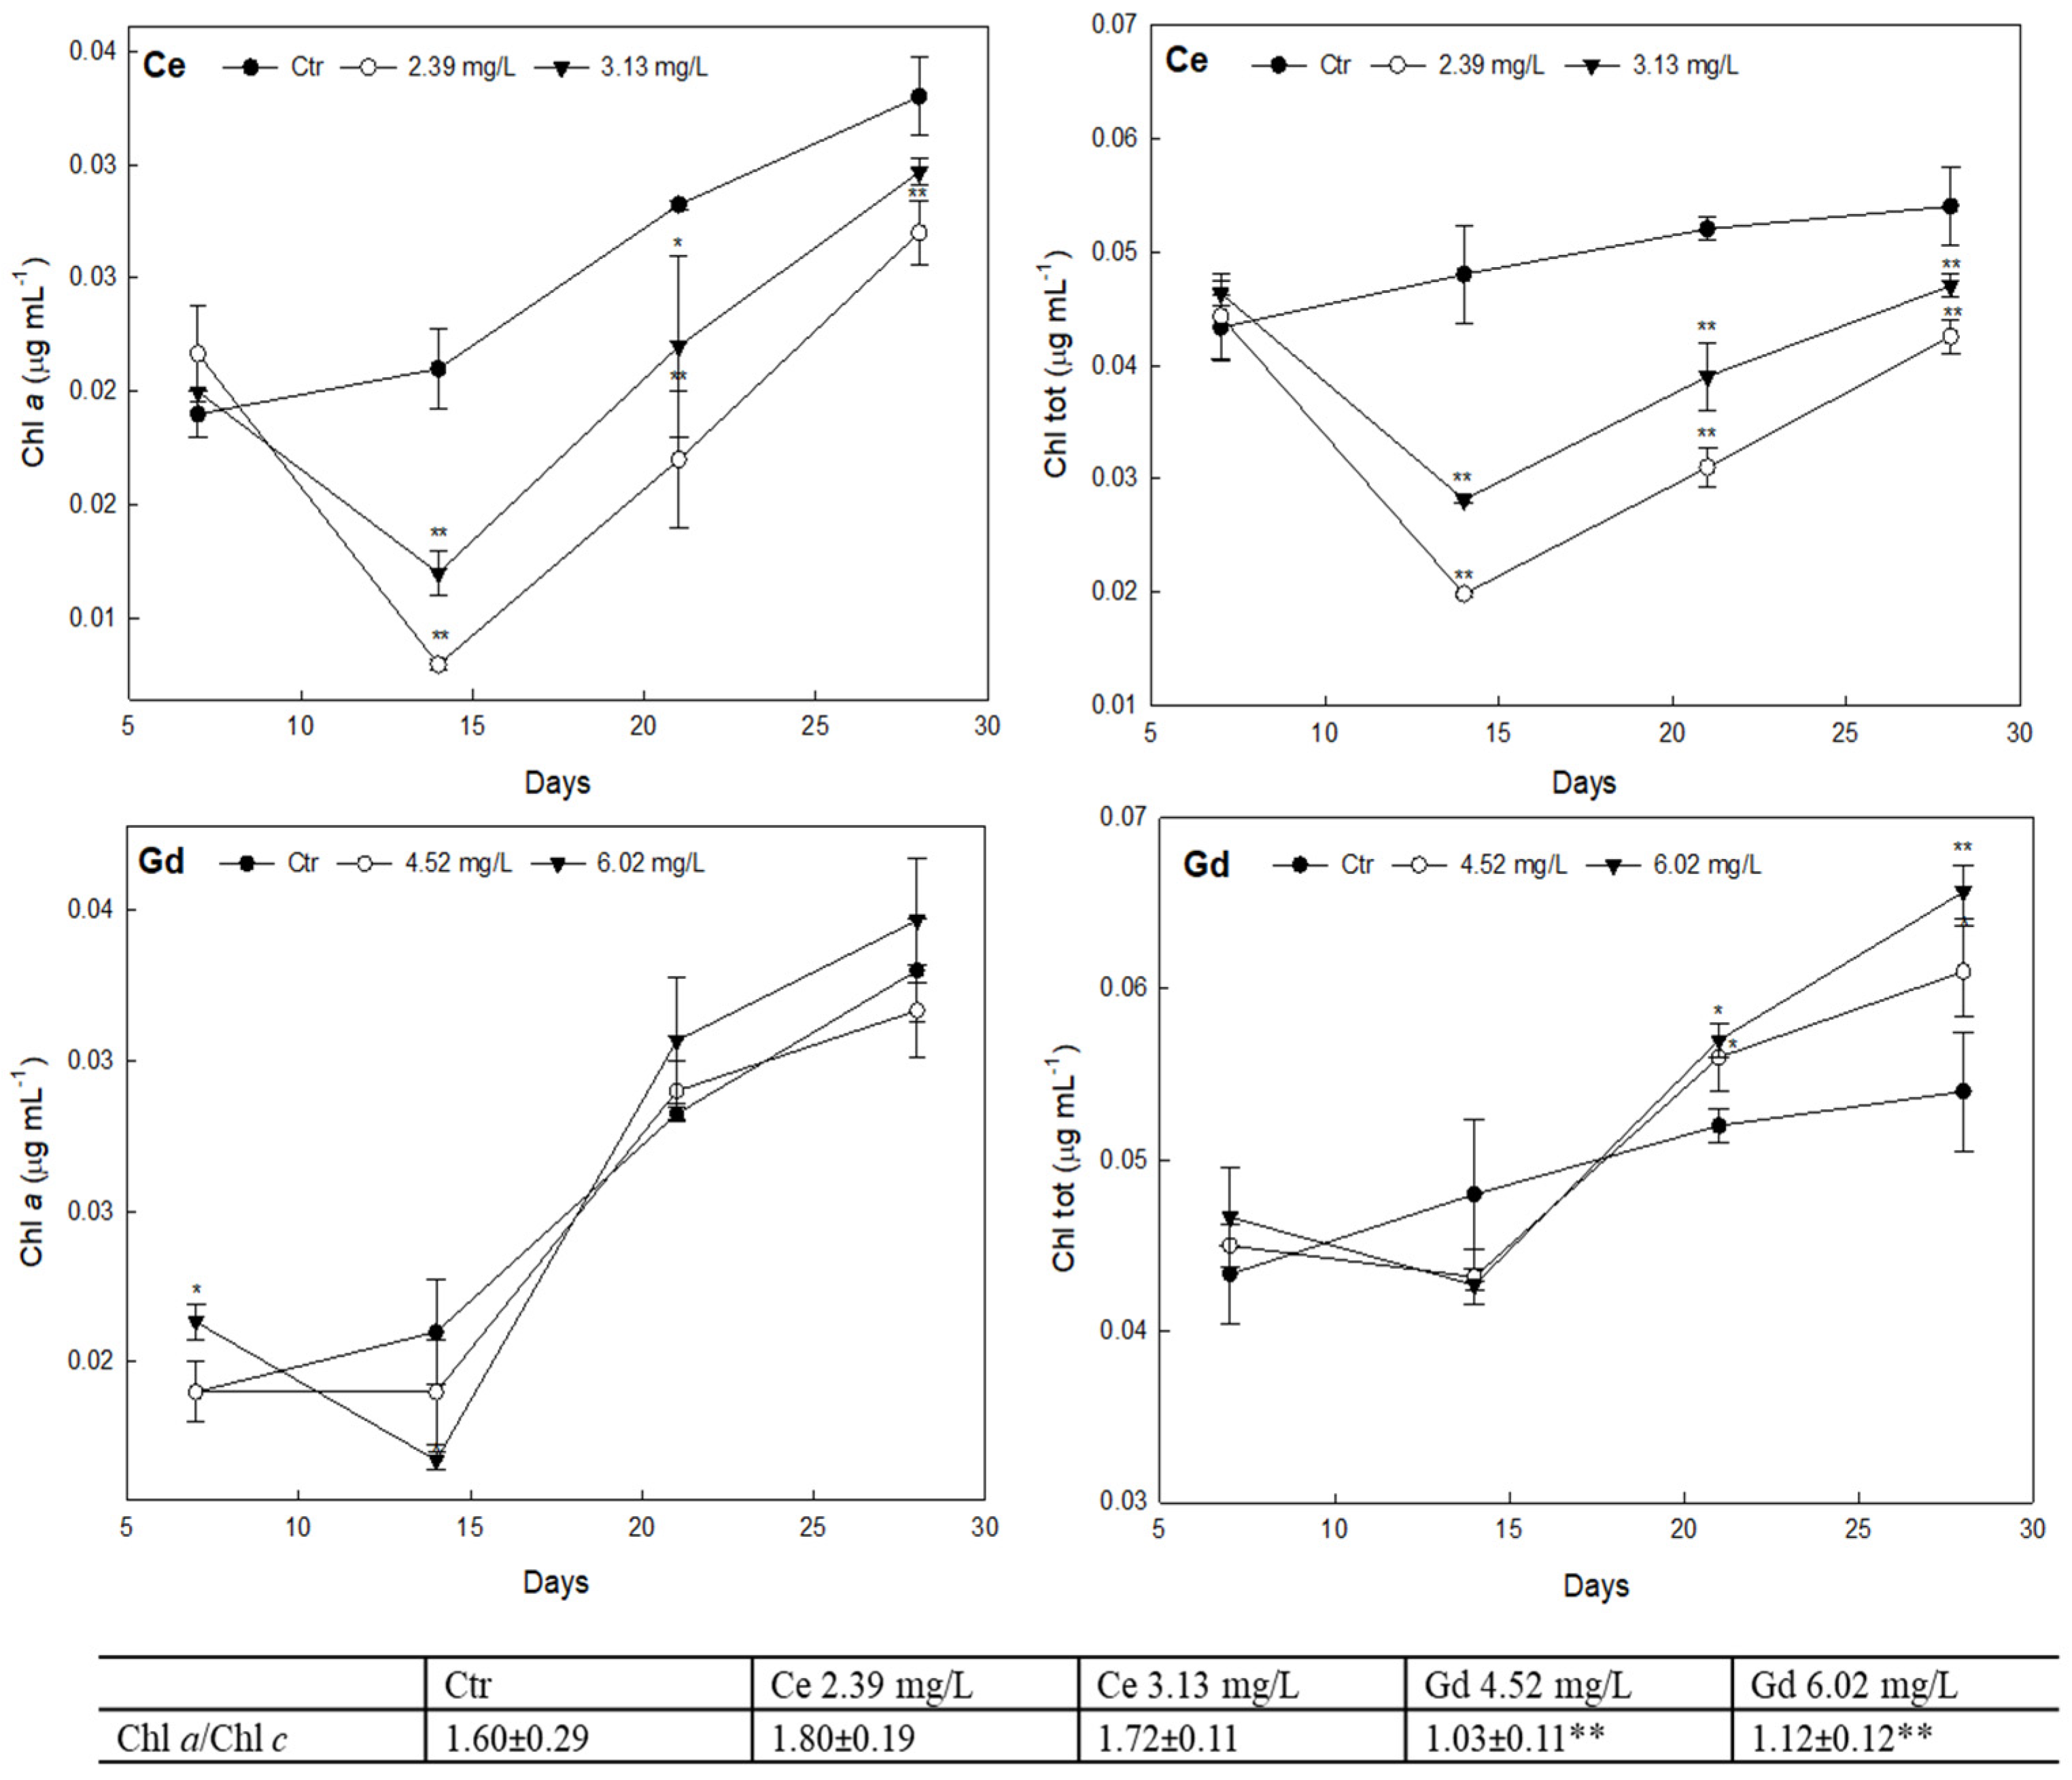
3.3. Photosynthetic Pigments Content

The results on chlorophylls content in P. tricornutum after 28 d of exposure to Ce and Gd are presented in Figure 3. The total chlorophyll content was significantly reduced, respect to Ctr (0.054 ± 0.0034 µg mL−1), in cells grown in presence of Ce 2.39 and 3.13 mg/L (0.042 ± 0.0015 and 0.047 ± 0.0010 µg mL−1, respectively). In contrast, under the Gd exposure, a different trend was observed. At 28 d, the total chlorophylls resulted higher of about 10–20% in Gd exposed cells in respect to the Ctr.
Changes in the Chl a content were opposite between Ce and Gd. Under the Ce exposure, the Chl a values decreased in both Ce concentrations in comparison to the Ctr. However, values were maintained significantly below the control for the duration of the experiment. For the Gd exposure, the content of Chl a remained in a similar range of the Ctr, displaying a similar behaviour between treatments.
In the experimental conditions (Ce and Gd), the chlorophyll ratio showed different trend in response to type of REE exposure (Figure 3). Under Ce treatment the content of Chl a and Chl c maintained the same ratio than the Ctr cells. Under Gd exposure the ration reduced of about 30% respect to algae grown in control medium.

3.4. Chlorophyll Fluorescence

The maximal quantum yield (Fv/Fm) of P. tricornutum grown under control condition and under Ce and Gd exposure for 28 d are presented in Figure 4. No significant differences were observed between control and Ce 2.39 mg/L cultures. However, a significant reduction of Fv/Fm was measured for cells exposed to Ce at 3.13 mg/L and Gd (4.52 and 6.02 mg/L).

3.5. Bioconcentration Factor (BCF)
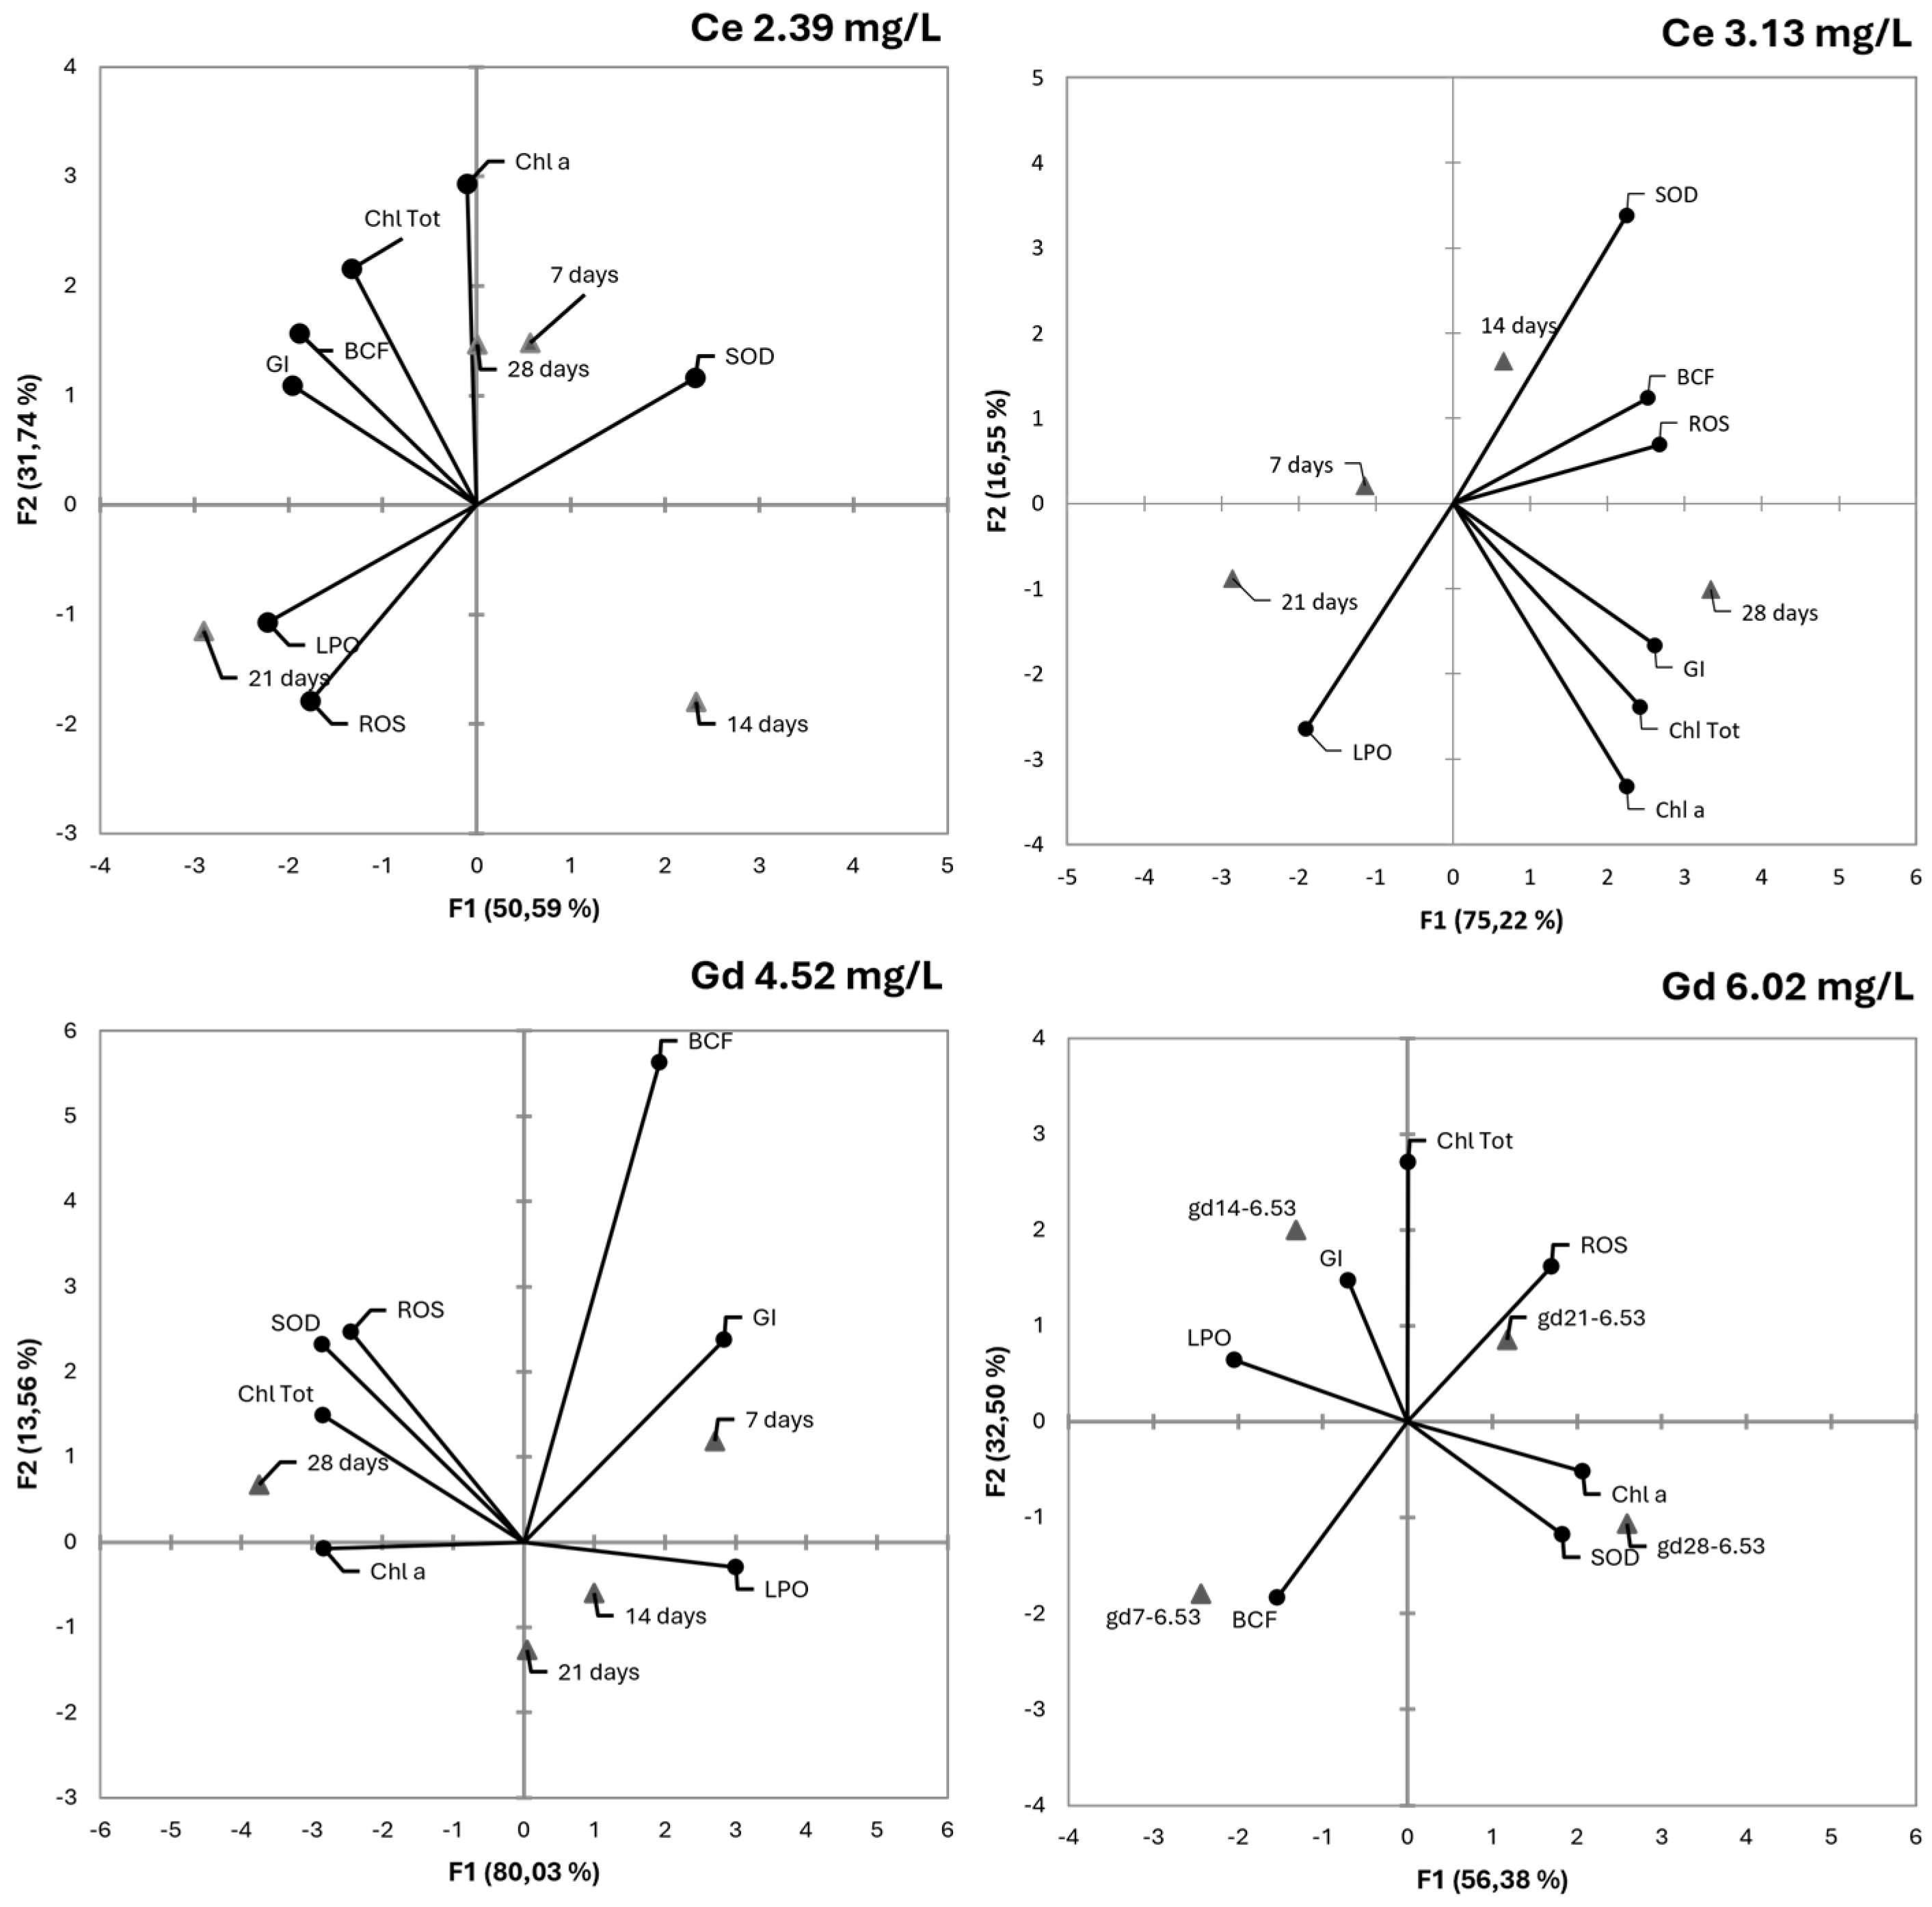
The BCF obtained for Ce and Gd are displayed in Table 1. For Ce, most of the values were maintained in the same order of magnitude, ranging from 1.99 to 8.44. However, the exception was the value obtained for 3.13 mg/L after 7 d of exposure, corresponding to 149. This value is around 18 times higher than the next higher value, 8.44 (3.13 mg/L after 28 d). Moreover, for Gd all values obtained remained in the same order of magnitude, ranging from 1.11 to 8.40. Overall, values remained lower for the concentration of 4.52 mg/L.

3.6. PCA

The Principal Component Analysis (PCA) results for Ce (2.39 and 3.13 mg/L) and Gd (4.52 and 6.02 mg/L) are presented in Figure 5. For Ce 2.39 mg/L, two components explaining 50.59% and 31.74% of the variability were identified, emphasizing the significance of SOD, LPO, and ROS. Ce 3.13 mg/L exhibits two components explaining 75.22% and 16.55% variability, highlighting the roles of ROS, SOD, and Chl Tot. Gd 4.52 mg/L displays two components explaining 80.03%, and 13.56% variability, with ROS, SOD, and Chl tot playing crucial roles. Gd 6.02 mg/L indicated two components explaining 56.38% and 32.50% variability, underscoring the importance of Chl tot, SOD, and Chl a.
A significant negative influence of Ce is observed on growth inhibition (GI), BCF, LPO, and ROS. Conversely, a positive impact on SOD is noted, suggesting a crucial role of Ce in redox processes and the plant’s oxidative stress response. The analysis of contribution percentages and squared cosines highlights which variables contribute most to each factor. Factor loadings underscore a positive influence of Ce on most variables, with a particularly pronounced impact on GI, ROS, and SOD. Contribution percentages and squared cosines underscore the relative importance of each variable in the identified factors.
The presence of Gd showed a positive influence on GI, BCF, and LPO, while negatively impacting ROS, SOD, and variables related to chlorophyll. Contribution percentages and squared cosines illustrate the relative importance and adherence of each variable to the identified factors. At higher concentrations, Gd exhibits a positive influence on GI, BCF, and ROS, with a negative impact on SOD and variables related to chlorophyll. Contribution percentages and squared cosines highlight key contributors and their consistency with the identified factors.

4. Discussion

In seawater, REEEs come mainly from continental weathering and via estuaries [22]. REEs can be divided essentially into three subgroups depending on their atomic numbers: 1. heavy REEs (from La to Pm); 2. medium REEs (from Sm to Gd); 3. light REEs (from Tb to Lu, as well as Sc and Y) [22]. According to Neira et al. [22], heavy REEs tend to remain in solution-forming complexes usually unavailable for organisms, while light REEs (such as Ce) are most likely to be assimilated by them, posing potential biological implications. In general, in seawater, the toxicity of Ce and Gd compounds may be influenced by the interaction of the metal cation (Ce3+ or Gd3+) with other conjugated anions (e.g., SO42− or Cl) [23]. REE concentrations in the ocean generally decrease from surface waters to mid depths (ranging from 6 to 10 m), before increasing near the sea bottom [22,24], and according to Akagi et al. [25], the diatoms’ presence may be a major pathway of REE transport to deeper layers. In this study, we investigated potential adverse effects of REEs on growth and physiology of the diatom P. tricornutum. Here, the nominal EC20 and EC50 obtained from standard 72 h exposure were used for the long-term exposure of P. tricornutum to Ce or Gd. These obtained values were for both Ce (2.39 mg/L for EC20, and 3.13 for EC50) and Gd (4.52 mg/L for EC20, and 6.02 for EC50) higher than those previously obtained by Siciliano et al. [26].
Since studies about the effect of REEs on marine diatoms is still limited, therefore obtained data were compared to available knowledge on microalgae. For Ce, the EC50 values were in the same order of magnitude as those obtained for Raphidocelis subcapitata exposed to cerium chloride (CeCl3, 6.3 mg/L), for Chlamydomonas reinhardtii exposed to cerium oxide nanoparticles (CeO2 4.5 mg/L) and for Skeletonema costatum exposed to cerium nitrate (Ce(NO3)3, 4.2 mg/L) [15,27,28]. Regarding Gd, the EC50 value obtained in this study were also in the same range as the EC50 value obtained for Raphidocelis subcapitata exposed to gadolinium oxide (Gd2O3) and for Raphidocelis subcapitata exposed to gadolinium chloride (GdCl3) with values corresponding to 1.21 mg/L and 3.11 mg/L, respectively [15,29]. The present results suggest that Gd (6.02 mg/L) plays a major role in the cellular toxicity for P. tricornutum. Furthermore, for Ce and Gd (4.52 mg/L), a growth stimulation could be observed over the 28 d of exposure. One potential scenario to explain these effects on P. tricornutum could be related to a developed tolerance or acclimation mechanisms to counteract the adverse effects. These mechanisms may involve enhanced detoxification capacity or the ability to promote the synthesis of some secondary metabolites [30,31], defined some REE, such as Ce, as plants elicitors, due to their effects on secondary metabolites synthesis and on plant growth and development. However, no studies of this type have been carried out on diatoms.
REE tolerance mechanisms have been reported in plants such as Dicranopteris linearis, Phytolacca sp., Helianthus Annuus [32,33,34], and in microalgae such as Galdieria sulphuraria and Desmodesmus quadricauda [35,36], but very little information concerns diatoms [26]. Moreover, these tolerance effects could be attributed to a hormetic response, where low doses of a stressor stimulate beneficial responses [37,38]. The exposure to REEs might have led P. tricornutum to increase growth and their metabolic activity, which led to a lack of significant inhibition when exposed to concentrations that inhibited the growth under shorter periods of exposure.
While specific studies on P. tricornutum are limited [26], drawing upon general knowledge of organisms’ responses to chemical compounds, it is plausible to speculate that P. tricornutum may possess tolerance or adaptation strategies to cope with exposure to cerium (Ce) or gadolinium (Gd), just as observed in some microalgae [13,39,40]. However, Gd showed a more evident effect on P. tricornutum. This behaviour could be further linked to the higher growth inhibition induced by the exposure of 6.02 mg/L, opposite to the stimulation, no effect or very low inhibition caused by the other three exposure conditions.
The changes in ROS production in response to Ce and Gd exposure do not show any important oxidative stress as observed in various aquatic organisms [41]. The decreased or no changes of SOD activity in P. tricornutum under Ce exposure could indicate that the diatom was acclimated to the presence of the element that does not induce evident stress. Under Gd exposure, the increase of SOD activity, during the time, is potentially due to the activation of repair mechanisms or upregulation of SOD expression [42]. The observed fluctuations in lipid peroxidation (LPO) activity indicate a dynamic response, which may reflect the balance between ROS-induced lipid peroxidation and the cellular antioxidant defence system [43].
Regarding the BCF, the fluctuations observed in bioconcentration factors for Ce and Gd over the experimental period could be attributed to the dynamic physiological responses of P. tricornutum. During the exposure periods (days 14 and 28), active uptake and accumulation of Ce and Gd by the microalgae might have led to higher bioconcentration factors. However, at day 21, a potential equilibrium state may have been reached, resulting in lower bioconcentration factors as cellular processes adjust to the presence of these elements. These dynamics reflect the complex interplay between exposure duration, uptake kinetics, and physiological responses of microalgae to Ce and Gd exposure.
Diatoms, such as P. tricornutum, are phylogenetically closer to the brown algae [44], then chlorophyll a and c with carotenoids (essentially fucoxanthin) perform the light harvesting for the photosynthesis [45].
The pigment contents displayed a variation of response depending on the REEs and the exposure concentration. P. tricornutum exposed to Ce showed a reduction in total- and a-chlorophyll contents in comparison to control cells. The inhibitory effect of Ce on chlorophylls content could be attributed to the ability of the element to replace Mg2+, to form a cerium-chlorophyll [46]. On the other hand, Gd exposure induced an increase in total chlorophylls but any change in the chlorophyll a content. We attributed the stimulation of chlorophylls synthesis to a mechanism of stress response of the P. tricornutum. As well as in the macroalga Ulva rigida, the increase of pigments after Gd exposure (especially Gd 6.02 mg/L) could indicate, as a response the abiotic stress, an unforeseen energy expense to the biosynthesis of pigments, at the cost of growth [47].
In general, changes of pigment contents involve alterations in pigments ratio. Although Ce exposure of P. tricornutum leads to a reduction in pigment content, the ratio between Chl a and Chl c does not significantly vary compared to that of control cells. Conversely, Gd exposure induced a reduction in chlorophylls ratio (Chl a/Chl c) indicating disturbances concerning the photosynthetic apparatus. While in the control and Ce exposed cells the chlorophylls percentage was approximately ~60% of Chl a and ~40% of Chl c, in the treatment with Gd we measured ~50% of Chl a and ~50% Chl c. No changes in the Chl a/Chl c ratio indicates that physiological adjustments were effective against the exposure to Ce. For Gd, the change in the ratio was due to an increase in the Chl c content. Gonçalves et al. [48], indicate Chl c as a possible biomarker of metal stress, due to its increased under metals exposure.
Variations in pigment content often led to changes in photosynthetic capacity. The maximum quantum efficiency of PSII (Fv/Fm) indicates the performance to convert incident photons into electrons during photosynthesis [49]. In P. tricornutum, the exposure to Ce (3.13 mg/L) and Gd (4.52 and 6.02 mg/L) caused a significant reduction in Fv/Fm. Values of Fv/Fm ranges typically between 0.55 and 0.65 for P. tricornutum under optimal condition (light, temperature, nutrient, pH, etc.) [50,51]. The reduction of Fv/Fm is a sensitive parameter to assess a plant photosynthetic performance; related to lower efficiency or damage to photosystems II and used to detect the PSII photoinhibition induced by a stress factor [52]. According to Cheng et al. [46], exposure of Scenedesmus obliquus to Ce may inactivate the oxygen-evolving complex (OEC). The damage of OEC inhibits electron transfer from water to PSII reaction centre. However, negative effects on photosynthesis performance were observed only under Ce 3.13 mg/L exposure. No studies regarding the effect of gadolinium on algae/diatomos photosynthesis were found to compare our results.
Studies on aquatic primary producers have demonstrated the ability of REEs to bioaccumulate in various species of microalgae such as Galdieria phlegrea [53], Chlorella vulgaris Beijerinck [54] and Chlamydomonas reinhardtii [55], and duckweed [56].
The lower bioaccumulation of Gd relative to Ce observed in P. tricornutum cells could be attributed to Gd oxide complexation in the test media, potentially reducing Gd bioavailability. This aligns with the current understanding of REE behaviour in aquatic environments, where the chemical speciation of REEs plays a crucial role in bioaccumulation [57]. Studies on REE bioaccumulation in aquatic systems are scarce and have primarily focused on environmental monitoring data [58]. Most investigations have assessed REE bioaccumulation in fish [59,60] and microcrustaceans [61], with limited attention given to microalgae.
Squadrone et al. [62] conducted a study on algae in the Ligurian Sea, revealing significant variations in Ce and Gd concentrations across different species. Codium bursa exhibited Ce accumulation at 6300 mg/kg and Gd at 680 mg/kg, Flabellia petiolata showed Ce accumulation at 8800 mg/kg and Gd at 830 mg/kg, while Halopteris filicina displayed Ce accumulation at 6200 mg/kg and Gd at 510 mg/kg, indicating concentrations 100 times higher for Ce than Gd [62]. The concentrations varied significantly among different species and locations, supporting the observed trend of lower Gd bioaccumulation compared to Ce in P. tricornutum. These differences underscore the importance of understanding the bioaccumulation patterns of specific REEs in microalgae and contribute valuable data to the limited studies in this area.

5. Conclusions

The long-term tests performed for P. tricornutum exposed to Gd and Ce during 28 d, revealed a diverse response influenced by the concentration of exposure and by element being tested. However, P. tricornutums seems to be more sensitive to Gd than Ce exposure, influencing different physiological responses. The concentration of exposure played a crucial role in shaping the outcomes. These findings provide a foundation for future studies on the bioaccumulation process of REEs in living organisms and their potential risks due to long-term exposures. Furthermore, the results can inform the development of an early warning network for REE enrichment in living organisms.

Supplementary Materials

The following supporting information can be downloaded at: https://www.mdpi.com/article/10.3390/environments11030058/s1, Table S1: Nominal and analytical concentrations of acute test samples and the relative standard deviations. Concentrations are expressed in mg/L.

Author Contributions

Conceptualization, A.S. and M.G.; methodology, A.S., M.S., G.S. and A.A.B.; software, A.S. and G.S.; formal analysis, A.S., M.S., G.S., A.A.B. and M.T.; investigation, A.S., M.S., G.S., A.A.B. and M.T.; data curation, A.S., M.S., G.S., L.S., R.B. and E.G.P.S.; writing—original draft preparation, A.S., M.S., G.S., A.A.B., E.G.P.S. and G.L.; writing—review and editing, A.S., G.S., S.C. and A.A.B.; visualization M.G., S.C. and A.A.B.; supervision, A.S. and G.L.; project administration, A.S., M.G. and G.L.; funding acquisition, M.G., M.T. and G.L. All authors have read and agreed to the published version of the manuscript.

Funding

This project has received funding from the European Union’s Horizon 2020 research and innovation programme under the Marie Skłodowska-Curie grant agreement No. 857,989 and from the support of NBFC to National Biodiversity Future Center, funded by the Italian Ministry of University and Research, PNRR, Missione 4 Componente 2, “Dalla ricerca all’impresa”, Investimento 1.4, Project CN00000033.

Data Availability Statement

The raw data supporting the conclusions of this article will be made available by the authors on request.

Acknowledgments

We gratefully acknowledge the National Research Council of Italy—Institute for Sustainable Plant Protection (CNR-IPSP) for the use of the Maxi Imaging-PAM M-Series Chlorophyll Fluorometer (Heinz Walz GmbH, Effeltrich, Germany).

Conflicts of Interest

The authors declare no conflict of interest.

References

  1. Xie, Y.; Meng, J.; Guo, L. REE geochemistry of modern eolian dust deposits in Harbin city, Heilongjiang province, China: Implications for provenance. Catena 2014, 123, 70–78. [Google Scholar] [CrossRef]
  2. Arciszewska, Ż.; Gama, S.; Leśniewska, B.; Malejko, J.; Nalewajko-Sieliwoniuk, E.; Zambrzycka-Szelewa, E.; Godlewska-Żyłkiewicz, B. The translocation pathways of rare earth elements from the environment to the food chain and their impact on human health. Process Saf. Environ. Prot. 2022, 168, 205–223. [Google Scholar] [CrossRef]
  3. Liu, S.-L.; Fan, H.-R.; Liu, X.; Meng, J.; Butcher, A.R.; Yann, L.; Yang, K.-F.; Li, X.-C. Global rare earth elements projects: New developments and supply chains. Ore Geol. Rev. 2023, 157, 105428. [Google Scholar] [CrossRef]
  4. Karadaş, C.; Kara, D.; Fisher, A. Determination of rare earth elements in seawater by inductively coupled plasma mass spectrometry with off-line column preconcentration using 2,6-diacetylpyridine functionalized Amberlite XAD-4. Anal. Chim. Acta 2011, 689, 184–189. [Google Scholar] [CrossRef]
  5. Zhu, Y. Determination of rare earth elements in seawater samples by inductively coupled plasma tandem quadrupole mass spectrometry after coprecipitation with magnesium hydroxide. Talanta 2020, 209, 120536. [Google Scholar] [CrossRef]
  6. Goldstein, S.J.; Jacobsen, S.B. Rare earth elements in river waters. Earth Planet. Sci. Lett. 1988, 89, 35–47. [Google Scholar] [CrossRef]
  7. Greaves, M.; Elderfield, H.; Sholkovitz, E. Aeolian sources of rare earth elements to the Western Pacific Ocean. Mar. Chem. 1999, 68, 31–38. [Google Scholar] [CrossRef]
  8. Nozaki, Y. Rare earth elements and their isotopes in the ocean. Encycl. Ocean. Sci. 2001, 4, 2354–2366. [Google Scholar]
  9. Kulaksız, S.; Bau, M. Contrasting behaviour of anthropogenic gadolinium and natural rare earth elements in estuaries and the gadolinium input into the North Sea. Earth Planet. Sci. Lett. 2007, 260, 361–371. [Google Scholar] [CrossRef]
  10. Kulaksız, S.; Bau, M. Rare earth elements in the Rhine River, Germany: First case of anthropogenic lanthanum as a dissolved microcontaminant in the hydrosphere. Environ. Int. 2011, 37, 973–979. [Google Scholar] [CrossRef]
  11. Kulaksız, S.; Bau, M. Anthropogenic dissolved and colloid/nanoparticle-bound samarium, lanthanum and gadolinium in the Rhine River and the impending destruction of the natural rare earth element distribution in rivers. Earth Planet. Sci. Lett. 2013, 362, 43–50. [Google Scholar] [CrossRef]
  12. Lawrence, M.G.; Ort, C.; Keller, J. Detection of anthropogenic gadolinium in treated wastewater in South East Queensland, Australia. Water Res. 2009, 43, 3534–3540. [Google Scholar] [CrossRef]
  13. Danouche, M.; El Ghachtouli, N.; El Baouchi, A.; El Arroussi, H. Heavy metals phycoremediation using tolerant green microalgae: Enzymatic and non-enzymatic antioxidant systems for the management of oxidative stress. J. Environ. Chem. Eng. 2020, 8, 104460. [Google Scholar] [CrossRef]
  14. Freitas, R.; Costa, S.; Cardoso, C.E.; Morais, T.; Moleiro, P.; Matias, A.C.; Pereira, A.F.; Machado, J.; Correia, B.; Pinheiro, D. Toxicological effects of the rare earth element neodymium in Mytilus galloprovincialis. Chemosphere 2020, 244, 125457. [Google Scholar] [CrossRef]
  15. González, V.; Vignati, D.A.; Pons, M.-N.; Montarges-Pelletier, E.; Bojic, C.; Giamberini, L. Lanthanide ecotoxicity: First attempt to measure environmental risk for aquatic organisms. Environ. Pollut. 2015, 199, 139–147. [Google Scholar] [CrossRef]
  16. Eniso, U. Water quality—Marine Algal Growth Inhibition Test with Skeletonema sp. and Phaeodactylum Tricornutum. UNI EN ISO 2016, 10253, 2016. [Google Scholar]
  17. Bradford, M.M. A rapid and sensitive method for the quantitation of microgram quantities of protein utilizing the principle of protein-dye binding. Anal. Biochem. 1976, 72, 248–254. [Google Scholar] [CrossRef]
  18. Salbitani, G.; Del Prete, F.; Carfagna, S.; Sansone, G.; Barone, C.M. Enhancement of pigments production by Nannochloropsis oculata cells in response to bicarbonate supply. Sustainability 2021, 13, 11904. [Google Scholar] [CrossRef]
  19. Inskeep, W.P.; Bloom, P.R. Extinction coefficients of chlorophyll a and b in N,N-dimethylformamide and 80% acetone. Plant Physiol. 1985, 77, 483–485. [Google Scholar] [CrossRef]
  20. Salbitani, G.; Carillo, P.; Di Martino, C.; Bolinesi, F.; Mangoni, O.; Loreto, F.; Carfagna, S. Microalgae cross-fertilization: Short-term effects of Galdieria phlegrea extract on growth, photosynthesis and enzyme activity of Chlorella sorokiniana cells. J. Appl. Phycol. 2022, 34, 1957–1966. [Google Scholar] [CrossRef]
  21. Maxwell, K.; Johnson, G.N. Chlorophyll fluorescence—A practical guide. J. Exp. Bot. 2000, 51, 659–668. [Google Scholar] [CrossRef]
  22. Neira, P.; Romero-Freire, A.; Basallote, M.D.; Qiu, H.; Cobelo-García, A.; Canovas, C.R. Review of the concentration, bioaccumulation, and effects of lanthanides in marine systems. Front. Mar. Sci. 2022, 9, 920405. [Google Scholar] [CrossRef]
  23. Sutorius, M.; Mori, C.; Greskowiak, J.; Boettcher, L.; Bunse, C.; Dittmar, T.; Dlugosch, L.; Hintz, N.H.; Simon, M.; Striebel, M. Rare earth element behaviour in seawater under the influence of organic matter cycling during a phytoplankton spring bloom–A mesocosm study. Front. Mar. Sci. 2022, 9, 895723. [Google Scholar] [CrossRef]
  24. Adebayo, S.B.; Cui, M.; Hong, T.; White, C.D.; Martin, E.E.; Johannesson, K.H. Rare earth elements geochemistry and Nd isotopes in the Mississippi River and Gulf of Mexico mixing zone. Front. Mar. Sci. 2018, 5, 166. [Google Scholar] [CrossRef]
  25. Akagi, T. Rare earth element (REE)–silicic acid complexes in seawater to explain the incorporation of REEs in opal and the “leftover” REEs in surface water: New interpretation of dissolved REE distribution profiles. Geochim. Et. Cosmochim. Acta 2013, 113, 174–192. [Google Scholar] [CrossRef]
  26. Siciliano, A.; Sabatino, M.; Paone, A.; Padilla Suarez, E.G.; Toscanesi, M.; Brouziotis, A.A.; Gambino, E.; Saviano, L.; Trifuoggi, M.; Guida, M. A first attempt to evaluate the toxicity to Phaeodactylum tricornutum Bohlin exposed to rare earth elements. Front. Environ. Sci. 2022, 10, 957943. [Google Scholar] [CrossRef]
  27. Taylor, N.S.; Merrifield, R.; Williams, T.D.; Chipman, J.K.; Lead, J.R.; Viant, M.R. Molecular toxicity of cerium oxide nanoparticles to the freshwater alga Chlamydomonas reinhardtii is associated with supra-environmental exposure concentrations. Nanotoxicology 2016, 10, 32–41. [Google Scholar]
  28. Tai, P.; Zhao, Q.; Su, D.; Li, P.; Stagnitti, F. Biological toxicity of lanthanide elements on algae. Chemosphere 2010, 80, 1031–1035. [Google Scholar] [CrossRef]
  29. Joonas, E.; Aruoja, V.; Olli, K.; Syvertsen-Wiig, G.; Vija, H.; Kahru, A. Potency of (doped) rare earth oxide particles and their constituent metals to inhibit algal growth and induce direct toxic effects. Sci. Total Environ. 2017, 593, 478–486. [Google Scholar] [CrossRef]
  30. Zhang, C.; Li, Q.; Zhang, M.; Zhang, N.; Li, M. Effects of rare earth elements on growth and metabolism of medicinal plants. Acta Pharm. Sin. B 2013, 3, 20–24. [Google Scholar] [CrossRef]
  31. Ouyang, J.; Wang, X.; Zhao, B.; Yuan, X.; Wang, Y. Effects of rare earth elements on the growth of Cistanche deserticola cells and the production of phenylethanoid glycosides. J. Biotechnol. 2003, 102, 129–134. [Google Scholar] [CrossRef]
  32. Liu, W.-S.; Laird, J.S.; Ryan, C.G.; Tang, Y.-T.; Qiu, R.-L.; Echevarria, G.; Morel, J.-L.; van Der Ent, A. Rare earth elements, aluminium and silicon distribution in the fern Dicranopteris linearis revealed by μPIXE Maia analysis. Ann. Bot. 2021, 128, 17–30. [Google Scholar] [CrossRef] [PubMed]
  33. Grosjean, N.; Le Jean, M.; Berthelot, C.; Chalot, M.; Gross, E.M.; Blaudez, D. Accumulation and fractionation of rare earth elements are conserved traits in the Phytolacca genus. Sci. Rep. 2019, 9, 18458. [Google Scholar] [CrossRef]
  34. Dridi, N.; Ferreira, R.; Bouslimi, H.; Brito, P.; Martins-Dias, S.; Caçador, I.; Sleimi, N. Assessment of tolerance to lanthanum and cerium in helianthus annuus plant: Effect on growth, mineral nutrition, and secondary metabolism. Plants 2022, 11, 988. [Google Scholar] [CrossRef] [PubMed]
  35. Singh, A.; Čížková, M.; Náhlík, V.; Mezricky, D.; Schild, D.; Rucki, M.; Vítová, M. Bio-removal of rare earth elements from hazardous industrial waste of CFL bulbs by the extremophile red alga Galdieria sulphuraria. Front. Microbiol. 2023, 14, 1130848. [Google Scholar] [CrossRef]
  36. Ashraf, N.; Vítová, M.; Cloetens, P.; Mijovilovich, A.; Bokhari, S.N.H.; Küpper, H. Effect of nanomolar concentrations of lanthanum on Desmodesmus quadricauda cultivated under environmentally relevant conditions. Aquat. Toxicol. 2021, 235, 105818. [Google Scholar] [CrossRef]
  37. Calabrese, E.J.; Baldwin, L.A. Hormesis: The dose-response revolution. Annu. Rev. Pharmacol. Toxicol. 2003, 43, 175–197. [Google Scholar] [CrossRef]
  38. Moeris, S.; Vanryckeghem, F.; Demeestere, K.; Huysman, S.; Vanhaecke, L.; De Schamphelaere, K.A. Growth stimulation effects of environmentally realistic contaminant mixtures on a marine diatom. Environ. Toxicol. Chem. 2019, 38, 1313–1322. [Google Scholar] [CrossRef]
  39. Danouche, M.; El Ghatchouli, N.; Arroussi, H. Overview of the management of heavy metals toxicity by microalgae. J. Appl. Phycol. 2022, 34, 475–488. [Google Scholar] [CrossRef]
  40. Gauthier, M.; Senhorinho, G.; Scott, J. Microalgae under environmental stress as a source of antioxidants. Algal Res. 2020, 52, 102104. [Google Scholar] [CrossRef]
  41. Malhotra, N.; Hsu, H.-S.; Liang, S.-T.; Roldan, M.J.M.; Lee, J.-S.; Ger, T.-R.; Hsiao, C.-D. An updated review of toxicity effect of the rare earth elements (REEs) on aquatic organisms. Animals 2020, 10, 1663. [Google Scholar] [CrossRef]
  42. Park, S.; Polle, J.E.; Melis, A.; Lee, T.K.; Jin, E. Up-regulation of photoprotection and PSII-repair gene expression by irradiance in the unicellular green alga Dunaliella salina. Mar. Biotechnol. 2006, 8, 120–128. [Google Scholar] [CrossRef]
  43. Janani, B.; Raju, L.L.; Thomas, A.M.; Alyemeni, M.N.; Dudin, G.A.; Wijaya, L.; Alsahli, A.A.; Ahmad, P.; Khan, S.S. Impact of bovine serum albumin–A protein corona on toxicity of ZnO NPs in environmental model systems of plant, bacteria, algae and crustaceans. Chemosphere 2021, 270, 128629. [Google Scholar] [CrossRef]
  44. Falciatore, A.; Jaubert, M.; Bouly, J.-P.; Bailleul, B.; Mock, T. Diatom molecular research comes of age: Model species for studying phytoplankton biology and diversity. Plant Cell 2020, 32, 547–572. [Google Scholar] [CrossRef]
  45. Gelzinis, A.; Butkus, V.; Songaila, E.; Augulis, R.; Gall, A.; Büchel, C.; Robert, B.; Abramavicius, D.; Zigmantas, D.; Valkunas, L. Mapping energy transfer channels in fucoxanthin–chlorophyll protein complex. Biochim. Et. Biophys. Acta (BBA)-Bioenerg. 2015, 1847, 241–247. [Google Scholar] [CrossRef]
  46. Cheng, J.; Du, X.; Long, H.; Zhang, H.; Ji, X. The effects of exogenous cerium on photosystem II as probed by in vivo chlorophyll fluorescence and lipid production of Scenedesmus obliquus XJ002. Biotechnol. Appl. Biochem. 2021, 68, 1216–1226. [Google Scholar]
  47. Figueiredo, C.; Grilo, T.F.; Oliveira, R.; Ferreira, I.J.; Gil, F.; Lopes, C.; Brito, P.; Ré, P.; Caetano, M.; Diniz, M. A triple threat: Ocean warming, acidification, and rare earth elements exposure triggers a superior antioxidant response and pigment production in the adaptable Ulva rigida. Environ. Adv. 2022, 8, 100235. [Google Scholar] [CrossRef]
  48. Goncalves, S.; Almeida, S.F.; Figueira, E.; Kahlert, M. Valve teratologies and Chl c in the freshwater diatom Tabellaria flocculosa as biomarkers for metal contamination. Ecol. Indic. 2019, 101, 476–485. [Google Scholar] [CrossRef]
  49. Martos de la Fuente, G.C.; Viñegla, B.; Illana Rico, E.; Fernández Ocaña, A.M. Study of the Photosynthesis Response during the Gradual Lack of Water for 14 Olea europaea L. subsp europaea Cultivars and Their Adaptation to Climate Change. Plants 2023, 12, 4136. [Google Scholar] [CrossRef]
  50. Jallet, D.; Caballero, M.A.; Gallina, A.A.; Youngblood, M.; Peers, G. Photosynthetic physiology and biomass partitioning in the model diatom Phaeodactylum tricornutum grown in a sinusoidal light regime. Algal Res. 2016, 18, 51–60. [Google Scholar] [CrossRef]
  51. Lepetit, B.; Gélin, G.; Lepetit, M.; Sturm, S.; Vugrinec, S.; Rogato, A.; Kroth, P.G.; Falciatore, A.; Lavaud, J. The diatom Phaeodactylum tricornutum adjusts nonphotochemical fluorescence quenching capacity in response to dynamic light via fine-tuned L hcx and xanthophyll cycle pigment synthesis. New Phytol. 2017, 214, 205–218. [Google Scholar] [CrossRef]
  52. Guidi, L.; Lo Piccolo, E.; Landi, M. Chlorophyll fluorescence, photoinhibition and abiotic stress: Does it make any difference the fact to be a C3 or C4 species? Front. Plant Sci. 2019, 10, 174. [Google Scholar] [CrossRef]
  53. Čížková, M.; Mezricky, P.; Mezricky, D.; Rucki, M.; Zachleder, V.; Vítová, M. Bioaccumulation of rare earth elements from waste luminophores in the red algae, Galdieria phlegrea. Waste Biomass Valorization 2021, 12, 3137–3146. [Google Scholar] [CrossRef]
  54. Hao, S.; Xiaorong, W.; Liansheng, W.; Lemei, D.; Zhong, L.; Yijun, C. Bioconcentration of rare earth elements lanthanum, gadolinium and yttrium in algae (Chlorella vulgarize Beijerinck): Influence of chemical species. Chemosphere 1997, 34, 1753–1760. [Google Scholar] [CrossRef]
  55. El-Akl, P.; Smith, S.; Wilkinson, K.J. Linking the chemical speciation of cerium to its bioavailability in water for a freshwater alga. Environ. Toxicol. Chem. 2015, 34, 1711–1719. [Google Scholar] [CrossRef]
  56. Yang, X.; Yin, D.; Sun, H.; Wang, X.; Dai, L.; Chen, Y.; Cao, M. Distribution and bioavailability of rare earth elements in aquatic microcosm. Chemosphere 1999, 39, 2443–2450. [Google Scholar] [CrossRef]
  57. Khan, A.M.; Bakar, N.K.A.; Bakar, A.F.A.; Ashraf, M.A. Chemical speciation and bioavailability of rare earth elements (REEs) in the ecosystem: A review. Environ. Sci. Pollut. Res. 2017, 24, 22764–22789. [Google Scholar] [CrossRef]
  58. Costa, M.; Henriques, B.; Pinto, J.; Fabre, E.; Dias, M.; Soares, J.; Carvalho, L.; Vale, C.; Pinheiro-Torres, J.; Pereira, E. Influence of toxic elements on the simultaneous uptake of rare earth elements from contaminated waters by estuarine macroalgae. Chemosphere 2020, 252, 126562. [Google Scholar] [CrossRef] [PubMed]
  59. Qiang, T.; Xiao-Rong, W.; Li-Qing, T.; Le-Mei, D. Bioaccumulation of the rare earth elements lanthanum, gadolinium and yttrium in carp (Cyprinus carpio). Environ. Pollut. 1994, 85, 345–350. [Google Scholar] [CrossRef] [PubMed]
  60. Kang, S.; Guo, C.; Xue, C.; Ma, C.; Mu, H.; Sun, L. Toxic Effects of Two Representative Rare Earth Elements (La and Gd) on Danio rerio Based on Transcriptome Analysis. Toxics 2022, 10, 519. [Google Scholar] [CrossRef]
  61. Lachaux, N.; Catrouillet, C.; Marsac, R.; Poirier, L.; Pain-Devin, S.; Gross, E.M.; Giamberini, L. Implications of speciation on rare earth element toxicity: A focus on organic matter influence in Daphnia magna standard test. Environ. Pollut. 2022, 307, 119554. [Google Scholar] [CrossRef] [PubMed]
  62. Squadrone, S.; Brizio, P.; Battuello, M.; Nurra, N.; Sartor, R.M.; Benedetto, A.; Pessani, D.; Abete, M.C. A first report of rare earth elements in northwestern Mediterranean seaweeds. Mar. Pollut. Bull. 2017, 122, 236–242. [Google Scholar] [CrossRef] [PubMed]
Figure 1. Effect on P. tricornutum of Cerium (A) and gadolinium (B) exposure on growth inhibition during 28 d of exposure normalized to negative controls. Results are presented as mean values with standard error (SD).
Environments 11 00058 g001
Figure 2. Relative fluorescence (RFU) of the reactive oxygen species (ROS) (A,B), SOD activity (C,D), and LPO concentration (E,F) after normalization on protein content (expressed as U/mg protein). Results are presented as mean ± SD (n = 3). Asterisks (*) represent significant differences (* p < 0.05).
Environments 11 00058 g002
Figure 3. Pigment contents (Chl tot and Chl a) in Ctr and Ce- and Gd-exposed cells of P. tricornutum. The diatoms were grown for 28 d under different concentrations of REEs (Ce: 2.39 and 3.13 mg/L; Gd: 4.52 and 6.02 mg/L). Error bars represent SD (n = 3). Significant differences respect to the control (Ctrl) were determined using one-way ANOVA with post hoc Tukey HSD Test (* p < 0.05, ** p < 0.01).
Environments 11 00058 g003
Figure 4. (A) Maximal quantum yield of PSII in the dark (Fv/Fm). The chlorophyll fluorescence was measured in Ctr, Ce, and Gd cells at 28 d from the beginning of the experiment. Error bars represent SD (n = 3). Significant differences respect to the Ctrl were determined using one-way ANOVA with post hoc Tukey HSD Test (** p < 0.01). (B) The image representing Fv/Fm was obtained using Imaging-PAM. The false-colour scale ranging from black (0) to purple (1), is indicated under the bars.
Environments 11 00058 g004
Figure 5. Principal component analysis (PCA) as biplot representation with loadings and scores in the coordinates of the first two principal components (F1 and F2) of Ce and Gd exposure.
Environments 11 00058 g005
Table 1. Bioconcentration factors (BCFs) for the exposure concentrations (mg/L) of Ce and Gd at multiple sampling times during the 28 d of exposure period.
BioconcentrationFactor (BFC)
Exposure Time (d)Ce 2.39 mg/LCe 3.13 mg/LGd 4.52 mg/LGd 6.02 mg/L
72.761492.298.40
141.997.171.373.48
213.504.321.111.20
283.808.441.303.24
Disclaimer/Publisher’s Note: The statements, opinions and data contained in all publications are solely those of the individual author(s) and contributor(s) and not of MDPI and/or the editor(s). MDPI and/or the editor(s) disclaim responsibility for any injury to people or property resulting from any ideas, methods, instructions or products referred to in the content.

