Article

Determinants of Individual Level Satisfaction with Community Based Natural Resources Management: A Case of Five Communities in Namibia

Center for African Studies and School of Natural Resources and Environment, University of Florida, FL 32611, USA
Environments 2015, 2(4), 608-623; https://doi.org/10.3390/environments2040608
Submission received: 2 July 2015 / Revised: 23 November 2015 / Accepted: 27 November 2015 / Published: 10 December 2015

Abstract

:
Using a logistic regression model, this paper examines key factors that influence individual support for communal conservancies in Namibia. It tests the hypothesis that if individuals are compensated for their wildlife related losses, they are more likely to support community based wildlife management projects. Data for this study were collected from 472 members of five conservancies in the Caprivi Region of Namibia. Respondents were selected through convenience sampling. The key findings are that receiving meat, activity during the Annual General Meeting (AGM), and being a member of a specific conservancy are the key predictors of satisfaction with the conservancy among the respondents. On the other hand, cash and jobs have no significant impact on individual attitudes toward communal conservancies. Based on these findings, the paper argues that the focus on incentives omits broader factors that motivate individuals to participate in community-based conservation.

Graphical Abstract

1. Introduction

That biodiversity conservation depends on the participation of local communities is a common perspective among proponents of community based natural resources management [1,2,3]. The most compelling evidence to support the role of community participation in conservation is that, globally, locals manage about 11% of the conserved forest areas (420 million hectares) [2]. The ideological basis for lobbying for increased community participation in conservation is that the “fines and fences” approach often criminalizes local consumption in favor of preservationist approaches [4,5,6]. While the fences and fines approach excluded some communities from extracting essential livelihood resources and, in some cases, led to “adversarial relationships” between park authorities and local communities [7], it was an effective means for conserving some forest resources in other areas [8].
In southern Africa, natural resource management evolved from “fortress conservation” to Community based Natural Resources Management (CBNRM) in response to political, social, and economic factors [9]. Colonial governments in Africa relied on the fortress conservation approach to manage wildlife, whereby use of game for commercial and non-commercial use was highly restricted [10]. Post-independence governments slowly replaced fortress approaches with Integrated Conservation and Development Plans (ICDPs) that emphasized the linkages between conservation and development [11,12]. Neumann’s review of ICDPs found that they constituted coercive practices and expanded state authority into rural areas rather than emphasizing benefit sharing and participation [11]. CBNRM approaches also emerged around the early 1980s in order to increase the flow of benefits from the natural resources to communities and also expanding opportunities for communities to participate in local governance-termed democratization and empowerment [13]. The CBNRM approach thus brings communities to the fore in managing and benefiting from locally available resources. With the introduction of CBNRM, communities gained resource use rights and varying levels of decision making over the utilization and allocation of these resources [14].
CBNRM is premised on giving financial value to local resources and then giving the proceeds as incentives to locals in order for them to participate in conservation activities [13]. The underlying hypothesis is that if the benefits of participating in conservation activities outweigh the costs, individuals will participate in conservation activities. Based on this assumption, CBNRM initiatives seek to compensate locals with meat, cash dividends, jobs, and infrastructure in order to offset the negative costs of living with wildlife such as crop damage, livestock loss, human injury and death [15]. While most researchers do not make explicit reference to theoretical mechanisms that link the causal relations between incentives and behavior or attitudinal change, the incentive theory offers possible explanation of how incentives can be used to change both attitudes and behavior [16]. Incentive theory has its roots in behavioral psychology, which demonstrated how behaviors could be conditioned or shaped through structured reinforcement. CBNRM thus seeks, among other things, to transform individuals’ attitudes to positive and increase local support for conservation, by providing incentives such as meat, cash, jobs, and community infrastructure.
The relationship between behavior and attitude is complex and theoretical studies on the subject have yielded competing explanations. Ajzen’s study concluded that behavioral intent could be predicted with high accuracy from attitudes toward the behavior, subjective norms, and perceived behavioral control [17]. Other studies also noted that while positive attitudes are essential for the success of conservation projects, behavioral changes are required to reduce the threat to natural resources but the link between the two is not straight forward [18,19]. In another study, Siex and Struhsaker [20] found that perceptions of farmers are usually not correlated with actual events on the ground. A more elaborate study of the attitude behavior link was conducted by Bentler and Speckhart [21] who highlighted the of limits Ajzen and Fishbein model and concluded that “effects of attitudes and previous behavior on subsequent behavior are, to a significant extent, not mediated by intentions (i.e., a nontrivial portion of behavioral variability is predictable from attitudes and previous behavior with the effects of intentions partialled out).” Based on Bentler and Speckhart’s observation, the paper interrogates the community attitudes toward CBNRM in order to understand part of the factors that influence community conservation behaviors.
Within CBNRM literature, the two perspectives around the relationship between incentives and conservation attitudes and behaviors are that either incentives are correlated with pro-conservation behaviors or not related [22]. Udaya Sekhar for example notes reports a positive relationship between incentives and attitudes noting that: “There appears to be correlation between benefits obtained by local people from wildlife tourism and other sources, and support for protected area existence, suggesting that benefits impact people’s attitudes towards conservation” [23]. The link between incentives and attitudes is often mediated by individuals’ level of education and employment in the park [24]. Mehta and Kellert [25] found that that people held ambivalent attitudes toward different components of the project. These reported studies reported the positive effect of incentives on attitudes and the specific conditions this relationship can be strengthened, i.e., more positive attitudes if people are educated or employed in the park.
On the other hand, several studies also report that financial incentives alone do not motivate individuals to act or affect their attitudes [26,27]. Lynne and Rola [26] reported that financial incentives were not statistically significant predictors of conservation behavior but higher-level cognitive values such as “comfortable life”. Arjuran et al. [27], in their work around the Tiger Reserve, also led them to conclude that “providing benefits has not changed the underlying attitudes of the communities” because the magnitude of the incentives did not improve the livelihoods of the poor households. In some cases, researchers have found positive individual attitudes toward the park and wildlife and negative attitudes toward the park personnel [28]. The two question whether incentives affect behaviors or attitudes can best be answered by synthesizing contextual factors and understanding human behavior within a broader framework of community-conservation feedbacks [28] rather than simple cause-effect relations such as: incentives translate to positive attitudes [29,30].
The paper uses a survey to examine whether incentives motivate people to support and consequently participate in community conservation programs that seek to conserve wildlife in five communal conservancies in Namibia. At present, a limited number of studies have systematically tested the relationship between incentives and individual support for community conservation. This paper uses logistic regression to test key factors that affect individual support for CBNRM using data from five communal conservancies in Namibia. Additionally, the paper assesses whether support for CBNRM varies by location, gender, age, and general participation in conservancy-related activities. Based on the results, the paper seeks to contribute toward understanding factors that determine whether or not an individual supports local conservation initiatives.
The rest of the paper is as follows: Section 1 discusses pertinent literature. Section 2 describes the methods, study site, and the statistical methods used for analyzing the data. Section 3 presents the results and discussion. Section 4 provides the research conclusions.

1.1. The Development of CBNRM in Southern Africa

In southern Africa, CBNRM emerged out of local experimentation with wildlife policies. The results of such local experiments were various community-based conservation initiatives such as CAMPFIRE (Zimbabwe), ADMADE (Zambia), CBO/Trust (Botswana), Chuma Chetu (Mozambique), and Communal Conservancies (Namibia). These programs were characterized by the following: (a) moving away from the state to “local society,” with possibilities of transferring all management and allocation decisions to these localities or partial rights (co-management) [31], (b) embracing sustainable use in order to allow communities to benefit from natural resources, and (c) allowing markets to influence people choices and land use options by removing subsidies that distort natural resources values [32] (especially in marginal rural landscapes where local communities preferred agriculture over natural resources).

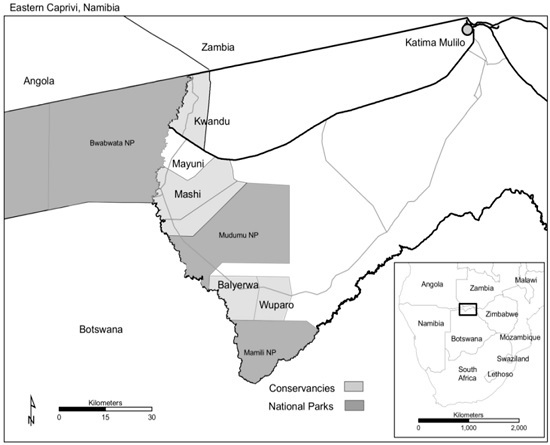
1.2. The Development of CBNRM in Namibia

Namibia’s Community Based Natural Resources Management program was developed through collaboration between traditional leaders and local NGOs [33]. The first communal conservancy to be registered was Torra Conservancy in 1998 following the pilot project in the northwestern region (Kunene) of Namibia that trained local game scouts to patrol community areas to deter poachers [34]. This pilot project was followed by similar projects across the country and fifty communal conservancies were established between 2000 and 2007.
Communal conservancies are legal entities with clearly defined boundaries, roles, and membership that allow them to derive conservation benefits [35]. Each conservancy has clearly defined boundaries, which specify the wildlife management areas for a given community. In addition, the community is required to adopt a constitution that clearly specifies the role of its members and elected conservancy committee. The elected members will then manage wildlife and tourism revenue on behalf of the communities.
Namibia’s CBNRM program is guided by the following principles: (a) incentivizing farmers through meat shares from safari hunting, cash dividends from joint venture agreements between communities and professional hunters; (b) providing communal projects such as schools, clinics, and boreholes; (c) employment and training as conservancy guards, lodge staff, tour guides and professional hunters; and (d) compensating farmers for livestock and crop losses.
While CBNRM is a preferred approach for engaging communities in the management of natural resources, it has implementation and equity challenges. Hill noted that the expansion of CBNRM into remote areas of Africa did not provide communities with opportunities to participate in their affairs but provide central state with increased opportunities to exert central control [36]. In addition Blaikie’s prominent critique also notes the absence of community voices, lack of monitoring and evidence of impact of most CBNRM initiatives [37]. Similarly, local level evidence also suggests that CBNRM initiatives are prone to local elite capture and can be hijacked for partisan political goals [38,39,40]. The efficacy of CBNRM not only lies in aligning the incentives and costs but also ensuring that governance structures are set up in ways that ensure these incentives are realized at the community level.

2. Methods

2.1. Description of the Survey

The survey data was collected from five conservancies in the northeastern part of the Caprivi Strip, Namibia. These are namely: Balyerwa, Kwandu, Mashi, Sobbe, and Wuparo. These five communities were conveniently selected since they participated in a governance “dashboard” project implemented jointly by the University of Florida and a local Non-Governmental Organizations called Integrated Rural Development and Nature Conservation [41]. Second, all five conservancies derive significant incomes from tourism and hunting. Kwandu, Mashi, and Sobbe are part of the north complex and Wuparo and Balyerwa-the south complex. Kwandu conservancy is the oldest and it was founded in 1999, followed by Mashi in 2003 and Sobbe in 2006 42 Wuparo, at the time of the study was also beginning to earn significant income from tourism, and Balyerwa are on the southern side of Mudumu National Park. Livelihood strategies for these five communities include subsistence agriculture and pastoralism, remittances and wage labor [42,43]. Figure 1 shows the geographic location of the study sites and table one summarizes the key characteristics of each conservancy.
The overall questionnaire asked questions on the following: demographics, participation in conservancy meetings, whether they voted in the election of leaders, perception of their rights, knowledge of the conservancy finances, rating of community projects and level of satisfaction with the community based conservation program (i.e., the conservancy). Locally trained enumerators were closely supervised in order to ensure survey completeness. In conducting the survey, the participants were first read out a consent statement that specified their rights as respondents and the researchers then sought the consent of the participants to proceed with the interview. Once consent was acquired, the questions were then asked in vernacular and the responses were captured on a copy written in English.
A convenient sample of 472 conservancy members was drawn from the five conservancies between June and July 2011. Survey respondents were identified in an ad hoc manner based on random walks. At each household, either the head of household or the eldest household member was interviewed. Locally trained research assistants conducted the survey in local languages. The completed and verified questionnaires were entered and cleaned using Statistical Package for the Social Sciences (SPSS). The analysis presented in this paper was performed with R statistics. Table 1 below provides a summary of the demographic factors across the five communities.
Figure 1. Map of Eastern Caprivi, Namibia.
Environments 02 00608 g001
Table 1. Population, ethnic diversity, total area, and income activities.
NamePopulation (Ethnic Diversity) aYear EstablishedSize (km2)Income Activities
Mashi3900 (3)2003297Hunting, Lodge, Crafts
Kwandu4300 (2)1999190Timber, Hunting, Campsite
Sobbe2000 (1)2006404Hunting, Crafts
Wuparo2100 (1)1999148Hunting, Craft
Balyerwa1500 (1)2006223Hunting, Lodge
Notes: Source: NASCO, (2008). State of the conservancy report www.nasco.org.na; a Ethnic diversity is used here to represent the main languages that are spoken in each community.

2.2. Outcome Variable

The dependent variable in this research, satisfaction, is a dichotomous type that assesses whether or not individuals support the conservancy or not. Multiple factors were assessed in order to determine their effect on individual support for the conservancy. Table 2 summarizes all explanatory variables used in this study. Since the response variable is a binary outcome, a logistic regression model is appropriate [25]. The response variable is satisfaction = 1 and non-satisfied = 0. Explanatory variables in the model include gender (two levels), location (5 levels), (Annual General Meeting (AGM) attendance) 2 levels costs and benefits (2 levels).
Table 2. Summary of variables.
Survey QuestionsVariablesDescription of Variables
Indicate sex of respondentSexFemales = 0Male = 1
How old are you, please record exact age)Age−22 years
−29 years = 1
−55 years = 2
+ = 3
Indicate the name of the ConservancyConservancyKwandu
Mashi = 1
Balyerwa = 2
Wuparo = 3
Sobbe = 4
Did you attend the last Annual General Meeting (AGM)AGMNot attend = 0Attend = 1
Did you receive cash dividends from the conservancy in the last 12 monthsCashNo = 0Yes = 1
Are you or any member of your household employed in the conservancyJobsNo = 0Yes = 1
Did you receive meat in the last 12 monthsMeatNo = 0Yes = 1
Did you suffer any crop loss or damages due to wildlife in the last 12 monthsCrop damage/Grain lossNo = 0Yes = 1
Did you suffer any livestock loss or damages due to wildlife in the last 12 monthsLivestock lossNo = 0Yes = 1
Has any person in your household, including your self been injured or killed by wildlife?InjuryNo = 0Yes = 1
Overall how do you rate the conservancy 1 = Strongly support
2 = Support
3 = Neutral
4 = Do not support
5 = Strongly dislike
Computed value 1:2 = Satisfied, 3:5 Not satisfiedSatisfactionNo = 0Yes = 1

2.3. Characteristics of the Respondents

Table 3 below shows the number of males and females interviewed in each conservancy. Overall, 56 percent of the respondents were female while 46 percent were males.
Table 3. Sample summary statistics.
KwanduMashiBalyerwaWuparoSobbe
Sample size Female (Male)52 (49)69 (57)56 (33)48 (36)39 (33)
Total (n)101126898472
Age Mean (SD)38.20 (16.28)37.89 (16.61)42.05 (17.96)40.65 (15.10)34.01 (15.07)
Household size Mean (SD)4.69 (2.80)4.94 (2.57)4.44 (2.23)5.05 (2.43)4.20 (2.30)
The age mean age for respondents was 38.64 years in the five areas. Each household had an average of 4.75 family members.

2.4. Statistical Analysis

Logistic regression analysis was used to compute the odds ratios for whether or not community members were satisfied with the conservancy or not based on the predictor variables listed in Table 2. Table 2 provides three columns showing the survey questions, variable code and the response scale. The following variables solicited for a binary yes/no response: AGM, Cash, Meat, Grain Loss, Livestock loss, and Injury. The variable sex was dichotomized to 0 and 1 (Male), while natural breaks were applied to individual ages with the first age group as the reference group. Individual satisfaction was measured on a five-point scale and later dichotomized to 0 (not satisfied) and 1 (satisfied). Other researchers have also dichotomized five point scales using the median value [25].
Logistic regression is a multivariate procedure for analyzing bivariate data. Logistic regression assumes that non-linearity and is often used to predict a binary dependent variable from a set of independent variables [44,25]. A core model is run first to test the role of the incentives and disincentives in determining whether or not people are satisfied with the Conservancy. The core model is then extended by adding variables to test specific hypotheses.

3. Results and Discussion

The data consisted of 472 adult males and females from five conservancies. Of these, 62.5 percent reported they were satisfied with the conservancy while 37.5 percent were dissatisfied. Table 4 below shows the level of support for conservancies. Table 5, Table 6 and Table 7 provide conservancy disaggregated statistics for numeric and binary variables.
Table 4. Distribution of outcome variable.
Dichotomized Outcome Variable FrequencyPercent
Dissatisfied17737.5
Satisfied29562.5
Total472100.0
Table 5. Summary table binary predictor variables.
PredictorsValuesKwandu N (%)Mashi N (%)Balyerwa N (%)Wuparo N (%)Sobbe N (%)
AGMNo55 (54.45)40 (31.74)38 (42.69)28 (33.33)17 (23.61)
Yes46 (45.54)86 (68.25)51 (57.30)56 (66.66)55 (76.38)
CashNo39 (38.61)71 (56.34)4 (4.49)5 (5.95)2 (2.77)
Yes62 (61.38)55 (43.65)85 (95.50)79 (94.04)70 (97.22)
JobsNo82 (81.18)86 (68.25)69 (77.52)42 (50.00)47 (65.27)
Yes19 (18.81)40 (31.74)20 (22.47)42 (50.00)25 (34.72)
MeatNo41 (40.59)21 (16.66)19 (21.34)5 (5.95)6 (8.33)
Yes60 (59.40)105 (83.33)70 (78.65)79 (94.04)66 (91.66)
GrainNo37 (36.63)28 (22.22)47 (52.80)39 (46.42)32 (44.44)
Yes64 (63.36)98 (77.77)42 (47.19)45 (53.57)40 (55.55)
Livestock LossNo76 (75.24)92 (73.01)58 (65.16)53 (63.09)50 (69.44)
Yes25 (24.75)34 (26.98)31 (34.83)31 (36.90)22 (30.55)
InjuryNo89 (88.11)118 (93.65)85 (95.50)71 (84.52)70 (97.22)
Yes12 (11.88)8 (6.34)4 (4.49)13 (15.47)2 (2.77)
SatisfactionDissatisfied48 (47.52)44 (34.92)40 (44.94)20 (23.80)25 (34.72)
Satisfied53 (52.47)82 (65.07)49 (55.05)64 (76.19)47 (65.27)
Total (N)101126898472

3.1. Logistic Regression Models

Three models were run to test the main effects of demographic characteristic against incentives and disincentives. Additional models were run to test addition hypothesis with variables such as Annual General Meeting attendance, sex of respondent, and conservancy. Variables to include in the models were informed by the hypothesis that if individuals are incentivized, they are likely to support conservation initiatives. The three generalized linear models that were run are summarized in the table below. Model 1 is the core model that tests the effects of incentives and disincentives. Model 2 tests the hypothesis whether participation at the AGM and the gender of the responded affect support for the conservancy. Model 3 tests an additional hypothesis of whether membership satisfaction varies by conservancy and age. The test of significance for individual coefficients in the model is assessed using the Wald Statistic [45].
Table 6. Logistic regression models.
Predictor VariablesModel 1Model 2Model 3
Estimate (SD) Estimate (SD)Estimate (SD)
(Intercept) −0.0039 (0.2462 ) −0.3519 (0.3955)−0.3649 (0.4131)
Meat [T.YES] 0.8064 (0.2663) **0.7108 (0.2716) **0.6117 (0.2819) *
Livestock Loss [T.YES] 0.1810 (0.2235)0.1725 (0.2265)0.1884 (0.2297)
Jobs [T.YES] 0.1196 (0.2246)0.0824 (0.2305)−0.0357 (0.2366 )
Injury [T.YES] −0.1845 (0.3571)−0.1855 (0.3612)−0.2549 (0.3714 )
Grain [T.YES] −0.0456 (0.2009)−0.0884 (0.2045)−0.0984 (0.2125)
Cash [T.YES] −0.2512 (0.2322)−0.2269 (0.2349)−0.2783 (0.2644)
AGECAT [T.23–39 YEARS] 0.2417 (0.3349)0.2409 (0.3409)
AGECAT [T.40–55 YEARS] −0.1072 (0.3720)−0.1538 (0.3779)
AGECAT [T.55+] 0.0718 (0.3849)0.0347 (0.3964)
AGM [T.YES] 0.5261 (0.2024) **0.5057 (0.2073) *
Sex [T.MALE] 0.0394 (0.1991)0.0411 (0.2018)
Conservancy [T.MASHI] 0.1939 (0.2983)
Conservancy [T.BALYERWA] −0.1026 (0.3157)
Conservancy [T.WUPARO] 0.8439 (0.3535) *
Conservancy [T.SOBBE] 0.2002 (0.3504)
Notes: Signif. Codes: 0; ** p < 0.01; * p < 0.05.
Table 7. Overall model comparisons.
AICX2DFP(>X2)
Model 1625.4512.960.045
Model 2626.4512.1100.28
Model 3625.6528.5150.019

3.2. Summary of Logistic Regression Results

From Model 1, receiving meat is a significant predictor of satisfaction (alpha 0.01) while the rest of the variables are not. Model 2 fits gender, AGM attendance, and age, to six variables in Model 1 in order to explore their contribution toward member satisfaction. Meat and AGM attendance significantly influence the rating of the conservancy. People that attend AGMs and those that receive meat are more likely to report that they support the conservancy. Model 3 shows that community members’ support for the conservancy also varies by location. Community members in Wuparo are more likely to report being satisfied with their conservancy than community members in Kwandu. For residents in Balyerwa, Mashi, and Sobbe, their reported satisfaction is statistically the same as that of Kwandu.
Across the three models, meat, conservancy and AGM attendance were found to be significant predictors of community satisfaction. For example receiving meat increases the positive odds by a factor of 0.61–0.70 and attending meeting by a factor of between 0.50 and 0.52. These findings indicate that those participants that received meat are 0.61 times more likely to report being satisfied with the conservancy compared to those that did not receive meat and similarly those that attended the Annual General Meeting are 0.5 times more likely to report that they support their conservancy. The findings indicate that some of the often-perceived incentives have not had an effect on the support for CBNRM in the context of the five communities discussed above.

3.2.1. Meat

Table 5 shows the distribution of responses for the survey respondents that reported that they received meat. The proportion of respondents that received meat was very high in Wuparo (94.04%), Sobbe (91.66%), Mashi (83.33%), Balyerwa (78.65%) and lastly Kwandu (59.40%). The logistic regression model shows that meat is a reliable predictor of individual satisfaction with CBNRM. In previous studies [46], reported that most household members identified game meat as the major CBNRM benefit. In Namibia, and elsewhere in southern Africa, meat allocations are conducted regularly and transparently during the hunting season. The survey shows that per year, each household reported to have received an average of 3 kilograms (SD, 4.649, mode 2 kg/year). Meat is often reported as a major benefit because it benefits members at the household level. Therefore, the chances are that most of the people that were interviewed would have enjoyed this benefit. Therefore, household level benefits are likely to the better at predicting community level satisfaction compared to those that can be easily privatized such as cash and jobs.

3.2.2. Cash

The summary statistics (Table 7) show that at least 40 percent of the respondents in each community had received cash benefits. The highest percentage of cash benefits was reported in Sobbe where 97.22 percent of the respondents reported having received cash. The three models discussed above show that cash is not a significant predictor of individual level satisfaction with the communal conservancy. Cash benefits across the conservancies are still marginal. Based on the survey data, mean annual cash dividends were N$60 (US$7.89) SD N$51, (US$6. 71) and mode N$33 (US$4.34). In addition, interviews with some of the local members indicated that most of cash benefits do not reach the members of the household especially in cases where males receive the dividends. Compared to the CBNRM program in Botswana where no cash dividends have been paid out to communities [47], the communal conservancies in Namibia provide cash dividends that are too little [48].

3.2.3. Jobs

Regarding access to jobs, the respondents indicated the follows: Wuparo (50%), Sobbe (34.72%), Mashi (31.72%), Balyerwa (22.47%) and Mashi (18.81%). The three logistic regression models show that jobs do not significantly predict whether individuals will rate the conservancy either negatively or positively. The survey findings regarding few job opportunities from CBNRM programs have also been reported of similar initiatives in southern Africa. For example, previous research also notes the lack of new job opportunities in local CBNRM initiatives [49]. In Namibian conservancies, most people are employed in lodges, craft shops, and as community game guards. However, these jobs are few and most positions are occupied on a permanent basis limiting the circulation of opportunities within communities. Limited job opportunities with the CBNRM industry deprives other community members the opportunity to diversity their livelihoods. In short, for the few job opportunities that are available, locals complain that the elite award these opportunities to their friends and relatives [50].

3.2.4. Livestock Loss, Grain Loss, and Injury to Humans

Few people reported having lost livestock with the past 12 months and with the highest percentage recorded in Wuparo (36.90%). Regarding loss of grain and damage to crops, most individuals reported having lost crops to problem animals (47.19%–77%). The reported cases of human related injury were low in all communities and ranged from 2.77% (Sobbe) to 15.47% (Wuparo). Both Model 2 and Model 3 show that livestock loss, grain loss, and injury to humans are not significant predictors of the individual satisfaction with the communal conservancy. In Namibia, individuals are compensated for such losses through a program called the Human and Animal Conflict Compensation Scheme (HACSS) whereby community members report the incurred damages. Once reported, the damages will be assessed and assigned a financial value that they will be compensated. Some researchers report that while the process appears simple on paper, it often marginalizes locals since filing these compensation claims involves additional costs [51]. In Kwandu Conservancy, for example, the HACSS scheme pays N$5000 (~USD 490) to cover funeral costs for wildlife-induced losses. The government often sets the compensation figure and community members complained that these rates are often below the competitive market rate. At the time of this research, the HACSS schemes were not fully functional and depended on additional revenue from the government.

4. Conclusions

Whilst the findings of this study could be used to test the current incentive based conservation programs, their generalizability is limited due to the research design and sampling approach. In particular, the sample is not truly random but convenient based on members of the household that could be located at the time of the interview. Future studies could test the same hypotheses by generating truly random samples and including control cases. In addition, some important variables have not been fully explored—for example, the composition of the household and whether the household head is male or female so that we can understand how the CBNRM benefits are shared at household level. In addition, the data are self-reported measures and could suffer from desirability effects and also suffered for the lack of clearly quantitative measures to measure the reported indicated—at most, these are subjective measures and further research can investigate the incentive hypothesis with less subjective indicators.
The findings of this study indicate that local people that received meat, attended the AGM, and are from a particular conservancy are more likely to rate their level of satisfaction with the conservancy differently. For example, the three models show that a positive rating of the communal conservancy is associated with having received meat and attended an AGM. Communal conservancy members in Wuparo also indicated being satisfied with their conservancy compared to Kwandu (reference group).
The positive effects of meat on communal conservancies have been reported in earlier studies [47]. As discussed in their work, Lendolvo et al. also found that most households reported having received meat as a conservation benefit [46]. In addition to being the most reported benefit, the meat often supplements household consumption; hence, it can be shared by members of the household compared to cash, can be easily withheld by mostly male recipients, and might never reach other members of the household. In communities where opportunities for meat distribution exist, enhanced transparency in the allocation of meat shares will enhance people’s satisfaction with the conservancy. In general, most conservancies in Namibia have not developed robust benefit sharing models [52] and developing these guidelines can start around meat distribution. If done properly, sharing meat can enforce equity, transparency and accountability, which can, in turn, increase people’s confidence and support for their communal conservancies.
AGM attendance is also a significant predictor on individual satisfaction. Participatory processes have a transformational effect within communities and foster a greater sense of rights and ownership [53]. Individuals that participate in governance process are more informed of the communal conservancies. Since AGMs represent a premier decision-making platform in the governance of communal conservancies where financial matters, annual plans, and strategic are presented and discussed [54,55]. In addition, since participation is voluntary, there are chances that broader social and political factors could influence collective action processes in different communities.
The conservancy variable and indicated that members of the Wuparo conservancy are more likely to rate the conservancy positively compared to individuals from Kwandu. This reported effect requires further research, but qualitative data gathered during the project showed that all the five communities had governance challenges, but only Wuparo community leaders agreed to experiment with new governance structures in order to solve these challenges [56]. The governance structures in Wuparo were decentralized from three central areas to seven in order to improve project performance and local participation. These changes were resisted by other conservancies, but it also signals some qualitative differences between Wuparo and other conservancies. The available data shows that satisfaction with the conservancy is multifaceted and broader community level factors are important in ensuring that people eventually express their support for the communal conservancies.
The findings in this paper are useful in the implementation and design of CBNRM programs. The findings show that positive incentives motivate individuals to change their attitudes toward communal conservancies. However, in doing so, there is a need to pay attention to the types of incentives, participation mechanisms and community level factors. In conclusion, individual support for conservation activities is multi-faceted and the design of incentive-led conservation approaches should avoid focusing on material incentives while negating participation and governance issues.

Acknowledgments

The first author acknowledges the financial support provided by the 2011 PSTC-Compton Fellow in Environment and Sustainability from the Compton Foundation to the University of Florida’s Program for Studies in Tropical Conservation. Additional funding for conducting this work was provided by the Wildlife Conservation Society (WCS) 2011 Research Fellowship Program. I am grateful for the support from the local communities in Namibia and the research assistants helped with data collection. I also appreciate the insightful comments provided by two anonymous reviewers and the journal editors.

Conflicts of Interest

The author declares no conflict of interest.

References

  1. Berkes, F. Community conserved areas: Policy issues in historic and contemporary context. Conserv. Lett. 2009, 2, 20–25. [Google Scholar] [CrossRef]
  2. Borrini, G.; Kothari, A.; Oviedo, G. Indigenous and Local Communities and Protected Areas: Towards Equity and Enhanced Conservation: Guidance on Policy and Practice for Co-Managed Protected Areas and Community Conserved Areas; IUCN: Gland, Switzerland, 2004. [Google Scholar]
  3. Shahabuddin, G.; Rao, M. Do community-conserved areas effectively conserve biological diversity? Global insights and the Indian context. Biol. Conserv. 2010, 143, 2926–2936. [Google Scholar] [CrossRef]
  4. Adams, W.M.; Hulme, D. If community conservation is the answer in Africa, what is the question? Oryx 2001, 35, 193–200. [Google Scholar] [CrossRef]
  5. Hoole, A.; Berkes, F. Breaking down fences: Recoupling social–ecological systems for biodiversity conservation in Namibia. Geoforum 2010, 41, 304–317. [Google Scholar] [CrossRef]
  6. Spierenburg, M.; Wels, H. “Securing Space” mapping and fencing in Transfrontier conservation in Southern Africa. Space Cult. 2006, 9, 294–312. [Google Scholar] [CrossRef]
  7. Muchapondwa, E.; Biggs, H.; Driver, A.; Matose, F.; Moore, K.; Mungatana, E.; Scheepers, K. Using Economic Incentives to Encourage Conservation in Bioregions in South Africa. Available online: https://ideas.repec.org/p/rza/wpaper/120.html (accessed on 30 November 2015).
  8. Brockington, D. Community conservation, inequality and injustice: Myths of power in protected area management. Conserv. Soc. 2004, 2, 411–432. [Google Scholar]
  9. Jones, B.; Wahome, J.; Araseb, N. Development of a Five-Year Strategic Vision for CBNRM in Namibia: Report of a Consultancy Carried out for the Namibian Association of CBNRM Support Organisations (NACSO); NACSO: Windhoek, Namibia, 2001. [Google Scholar]
  10. Child, B. Evolution and Innovation in Wildlife Conservation: Parks and Game Ranches to Transfrontier Conservation Areas; Routledge: London, UK, 2009. [Google Scholar]
  11. Alpert, P. Integrated conservation and development projects. BioScience 1996, 46, 845–855. [Google Scholar] [CrossRef]
  12. Neumann, R. Primitive Ideas: Protected area buffer zones and the politics of land in Africa. Dev. Chang. 1997, 28, 559–582. [Google Scholar] [CrossRef]
  13. Child, B. Origins and efficacy of modern community based natural resources management (CBNRM) practices in the southern African region. In Regional Workshop on Local Communities and Conservation: Issues and Challenges towards a More Equitable and Sustainable Future, Pretoria (South Africa); PLAAS: Cape Town, South Africa, 2003; pp. 26–28. [Google Scholar]
  14. Beebe, M. Community development trust(s) in Botswana: Institutional arrangements and social policy for savanna sustainability. South Afr. Geogr. J. 2003, 85, 58–68. [Google Scholar] [CrossRef]
  15. Jones, B.; Weaver, C. CBNRM in Namibia: Growth, trends, lessons and constraints. Evol. Innov. Wildl. Conserv. South. Afr. UK Earthscan 2009, 223–242. [Google Scholar]
  16. Killeen, P.R. Incentive theory: II. Models for choice. J. Exp. Anal. Behav. 1982, 38, 217–232. [Google Scholar] [CrossRef] [PubMed]
  17. Ajzen, I. The theory of planned behavior. Organ. Behav. Hum. Decis. Process. 1991, 50, 179–211. [Google Scholar] [CrossRef]
  18. Brooks, J.S.; Franzen, M.A.; Holmes, C.M.; Grote, M.N.; Mulder, M.B. Testing hypotheses for the success of different conservation strategies. Conserv. Biol. 2006, 20, 1528–1538. [Google Scholar] [CrossRef] [PubMed]
  19. Holmes, C.M. The influence of protected area outreach on conservation attitudes and resource use patterns: A case study from western Tanzania. Oryx 2003, 37, 305–315. [Google Scholar] [CrossRef]
  20. Siex, K.S.; Struhsaker, T.T. Colobus monkeys and coconuts: A study of perceived human-wildlife conflicts. J. Appl. Ecol. 1999, 36, 1009–1020. [Google Scholar] [CrossRef]
  21. Bentler, P.M.; Speckart, G. Models of attitude-behavior relations. Psychol. Rev. 1979, 86, 452–464. [Google Scholar] [CrossRef]
  22. Lepp, A.; Holland, S.A. comparison of attitudes toward state-led conservation and community-based conservation in the village of Bigodi, Uganda. Soc. Nat. Resour. 2006, 19, 609–623. [Google Scholar] [CrossRef]
  23. Sekhar, N.U. Local people’s attitudes towards conservation and wildlife tourism around Sariska Tiger Reserve, India. J. Environ. Manag. 2003, 69, 339–347. [Google Scholar] [CrossRef] [PubMed]
  24. Chidakel, A. Conservation Attitudes and Community Based Natural Resource Management in an Understocked Game Management Area of Zambia. Available online: http://digitalcommons.fiu.edu/etd/450/ (accessed on 30 November 2015).
  25. Mehta, J.N.; Kellert, S.R. Local attitudes toward community-based conservation policy and programmes in Nepal: A case study in the Makalu-Barun conservation Area. Environ. Conserv. 1998, 25, 320–333. [Google Scholar] [CrossRef]
  26. Lynne, G.D.; Rola, L.R. Improving attitude-behavior prediction models with economic variables: Farmer actions toward soil conservation. J. Soc. Psychol. 1988, 128, 19–28. [Google Scholar] [CrossRef]
  27. Arjunan, M.; Holmes, C.; Puyravaud, J.-P.; Davidar, P. Do developmental initiatives influence local attitudes toward conservation? A case study from the Kalakad-Mundanthurai tiger reserve, India. J. Environ. Manag. 2006, 79, 188–197. [Google Scholar] [CrossRef] [PubMed]
  28. Weladji, R.B.; Moe, S.R.; Vedeld, P.I. Stakeholder attitudes towards wildlife policy and the Bénoué wildlife conservation area, North Cameroon. Environ. Conserv. 2003, 30, 334–343. [Google Scholar] [CrossRef]
  29. Salafsky, N.; Cauley, H.; Balachander, G.; Cordes, B.; Parks, J.; Margoluis, C.; Bhatt, S.; Encarnacion, C.; Russell, D.; Margoluis, R. A Systematic Test of an enterprise strategy for community-based biodiversity conservation. Conserv. Biol. 2001, 15, 1585–1595. [Google Scholar] [CrossRef]
  30. Waylen, K.A.; Fischer, A.; McGowan, P.J.K.; Thirgood, S.J.; Milner-Gulland, E.J. The Effect of Local Cultural Context on Community-Based Conservation Interventions: Evaluating Ecological, Economic, Attitudinal, and Behavioural Outcomes. Available online: http://citeseerx.ist.psu.edu/viewdoc/download?doi=10.1.1.368.8996&rep=rep1&type=pdf (accessed on 30 November 2015).
  31. Rihoy, E.; Maguranyanga, B. Devolution and Democratisation of Natural Resource Management in Southern Africa: A Comparative Analysis of CBNRM Policy Processes in Botswana and Zimbabwe; PLAAS: Cape Town, South Africa, 2007. [Google Scholar]
  32. Child, G. The role of community-based wild resource management in Zimbabwe. Biodivers. Conserv. 1996, 5, 355–367. [Google Scholar] [CrossRef]
  33. Murphree, M.W. The strategic pillars of communal natural resource management: Benefit, empowerment and conservation. Biodivers. Conserv. 2009, 18, 2551–2562. [Google Scholar] [CrossRef]
  34. Boudreaux, K.; Nelson, F. Community conservation in Namibia: Empowering the poor with property rights. Econ. Aff. 2011, 31, 17–24. [Google Scholar] [CrossRef]
  35. Naidoo, R.; Weaver, L.C.; Stuart-Hill, G.; Tagg, J. Effect of biodiversity on economic benefits from communal lands in Namibia. J. Appl. Ecol. 2011, 48, 310–316. [Google Scholar] [CrossRef]
  36. Hill, K.A. Zimbabwe’s wildlife utilization programs: Grassroots democracy or an extension of state power? Afr. Stud. Rev. 1996, 39, 103–121. [Google Scholar] [CrossRef]
  37. Blaikie, P. Is Small Really Beautiful? Community-based natural resource management in Malawi and Botswana. World Dev. 2006, 34, 1942–1957. [Google Scholar] [CrossRef]
  38. Iversen, V.; Chhetry, B.; Francis, P.; Gurung, M.; Kafle, G.; Pain, A.; Seeley, J. High value forests, hidden economies and elite capture: Evidence from forest user groups in Nepal’s Terai. Ecol. Econ. 2006, 58, 93–107. [Google Scholar] [CrossRef]
  39. Mapedza, E.; Bond, I. Political deadlock and devolved wildlife management in Zimbabwe: The case of Nenyunga ward. J. Environ. Dev. 2006, 15, 407–427. [Google Scholar] [CrossRef]
  40. Balint, P.J.; Mashinya, J. CAMPFIRE During Zimbabwe’s national crisis: Local impacts and broader implications for community-based wildlife management. Soc. Nat. Resour. 2008, 21, 783–796. [Google Scholar] [CrossRef]
  41. Collomb, J.-G.; Kanapaux, W.; Mupeta, P.; Barnes, G.; Saqui, J.; Child, B. Assessing the Success of Community-Based Natural Resources Management through the Integration of Governance, livelihood and Conservation Attitude Indicators: Case Studies from Caprivi, Namibia. Available online: http://iasc2008.glos.ac.uk/conference%20papers/papers/C/Collomb_212501.pdf (accessed on 30 November 2015).
  42. O’Connell-Rodwell, C.E.; Rodwell, T.; Rice, M.; Hart, L.A. Living with the modern conservation paradigm: Can agricultural communities co-exist with elephants? A five-year case study in East Caprivi, Namibia. Biol. Conserv. 2000, 93, 381–391. [Google Scholar] [CrossRef]
  43. Ashley, C.; LaFranchi, C. Livelihood Strategies of Rural Households in Caprivi: Implications for Conservancies and Natural Resource Management; Directorate of Environmental Affairs, Ministry of Environment and Tourism: Windhoek, Namibia, 1997.
  44. Alexopoulos, E.C. Introduction to multivariate regression analysis. Hippokratia 2010, 14, 23–28. [Google Scholar] [PubMed]
  45. Bewick, V.; Cheek, L.; Ball, J. Statistics review 14: Logistic regression. Crit Care 2005, 9, 112–118. [Google Scholar] [CrossRef] [PubMed]
  46. Lendelvo, S.; Munyebvu, F.; Suich, H. Linking women’s participation and benefits within the Namibian community based natural resource management program. J. Sustain. Dev. 2012, 5. [Google Scholar] [CrossRef]
  47. Rozemeijer, N. Evolution and Innovation in Wildlife Conservation: Parks and Game Ranches to Transfrontier. Available online: http://samples.sainsburysebooks.co.uk/9781136566103_sample_858966.pdf (accessed on 30 November 2015).
  48. Jones, B.T. Community Benefits from Safari Hunting and Related Activities in Southern Africa; Recreat; Wiley-Blackwell: Oxford, UK, 2009; pp. 158–177. [Google Scholar]
  49. Sebele, L.S. The Social Impacts of Community-Based Tourism: A Case Study of Khama Rhino Sanctuary Trust in the Central District of Botswana. Available online: http://mobile.wiredspace.wits.ac.za/handle/10539/1797 (accessed on 30 November 2015).
  50. Muyengwa, S.; Child, B.; Lubilo, R. Adaptive Cross-Scalar Governance of Natural Resources; Routledge: London, UK, 2014. [Google Scholar]
  51. DeMotts, R.; Hoon, H. Whose elephants? Conserving, compensating, and competing in Northern Botswana. Soc. Nat. Resour. 2012, 25, 837–851. [Google Scholar] [CrossRef]
  52. Mosimane, A.W.; Silva, J.A. Local governance institutions, CBNRM, and benefit-sharing systems in Namibian conservancies. J. Sustain. Dev. 2015, 8. [Google Scholar] [CrossRef]
  53. Stoll-Kleemann, S.; de la Vega-Leinert, A.C.; Schultz, L. The role of community participation in the effectiveness of UNESCO biosphere reserve management: Evidence and reflections from two parallel global surveys. Environ. Conserv. 2010, 37, 227–238. [Google Scholar] [CrossRef]
  54. Collomb, J.G.E.; Mupeta, P.; Barnes, G.; Child, B. Integrating governance and socioeconomic indicators to assess the performance of community-based natural resources management in Caprivi (Namibia). Environ. Conserv. 2010, 37, 303–309. [Google Scholar] [CrossRef]
  55. Mupeta-Muyamwa, P.C. Democratization of Wildlife Management: A Comparative Study of the Community Based Natural Resource Management (CBNRM) Programs in Botswana and Zambia. Ph.D. Thesis, University of Florida, Gainesville, FL, USA, December 2012. [Google Scholar]
  56. Muyengwa, S.; Kangueehi, G. Decentralized governance in Wuparo conservancy, Caprivi, Namibia. In Community-Based Natural Resource Management in Southern Africa: An Introduction; AuthorHouse: Bloomington, IL, USA, 2013; pp. 205–214. [Google Scholar]

