1. Introduction
Most of the sensitive and specific methods for analysing dilute mixtures of volatile compounds in air utilize mass spectrometric detection. Traditionally gas chromatography-mass spectrometry (GC/MS) methods have been the method of choice for more than 50 years [
1]. In GC/MS, physical separation of the volatile analytes is achieved in the capillary column of the GC. Transfer of the column output into the mass spectrometer is followed by ionization and then analysis providing identification and quantification. It sounds simple, but in practice a good knowledge of the methodology is required. For example, when mixtures of chemically different analytes are examined, different polarity chromatographic columns must be used which increases the time for analysis. On some occasions—depending on the analyte concentrations—column overload can occur. At the other extreme, when very dilute mixtures are being analysed it is often necessary to go through a pre-concentration step by first adsorbing the analyte mixture onto a substrate and subsequently heating the substrate to release the concentrated analytes at a later stage. This pre-concentration step is then followed by passage of the sample through the chromatographic column and then mass spectrometric analysis. The entire process can take longer than an hour and each step in the process can reduce the accuracy of the analysis.
In the past few years, several new and more direct analytical techniques for monitoring volatiles in air have become available [
2]. The advantage of some of the direct techniques is that they may avoid the delays that occur in the more conventional but labour-intensive GC/MS and Liquid Chromatography-Mass Spectrometry (LC/MS) techniques arising from chromatography. One of these newer techniques, Selected Ion Flow Tube-Mass Spectrometry (SIFT-MS), is the topic of this review. The analytical application of SIFT-MS was pioneered by Spanel and Smith in 1996 [
3]. SIFT-MS utilizes known ion-molecule reactions of mass-selected reagent ions with an analyte. The mass-selected reagent ions (traditionally H
3O
+, NO
+, and O
2+) are introduced into a flow tube at low energy into a carrier gas where they undergo chemical reactions with the analytes in the gas sample that is drawn directly into the SIFT-MS flow tube at a known rate. The ensuing reagent ion-analyte ion-molecule reaction enables identification of the analyte in seconds and provides quantitation from the ratio of peak heights of the analyte product ion(s) relative to the reagent ion [
4].
Since its introduction by Spanel and Smith, the SIFT-MS technique has been applied to monitoring volatile analytes in air utilizing the speed and ease of operation of the technique in many applications ranging from breath analysis [
5,
6,
7,
8,
9], disease diagnosis [
10,
11,
12,
13,
14,
15,
16], environmental monitoring [
17,
18,
19,
20,
21,
22,
23,
24,
25] (including hazardous air pollutants) [
26], and food and flavour characterization [
27,
28,
29,
30,
31,
32,
33,
34,
35,
36,
37], to name but a few.
In this review of applications of the SIFT-MS technique, we discuss the principles on which it is based and go on to describe some of the developments that have occurred recently to make it perhaps the simplest to operate and the fastest direct analytical technique for analysing mixtures of volatile compounds in air. A comparative study between SIFT-MS and GC/MS in which 25 Volatile Organic Compounds (VOCs) from the toxic organic compendium methods (TO-14A and TO-15) from the United States Environmental Protection Agency (EPA) were jointly examined by each technique [
38]. The investigation found that 85% of the VOCs examined in the test mixture were within 35% of their stated concentrations by the SIFT-MS measurements without any calibration. The concentrations of these VOCs were found simply by utilizing the known ion-molecule chemistry of the mass-selected reagent ions and the ratio of the reaction product ion counts to the reagent ion counts [
4].
A side-by-side comparison of GC/MS and SIFT-MS confirmed that SIFT-MS provides a viable alternative to GC/MS down to pptv levels but with the marked additional benefit of eliminating the pre-concentration steps required by GC/MS for trace level gas analysis [
38]. In addition, the linear concentration range found in SIFT-MS is up to six orders of magnitude compared to the one–two orders of magnitude linear relationship with concentrations typically found in GC/MS [
38].
Up until 2015, the traditional reagent ions used in SIFT-MS were H3O+, NO+, and O2+, which were chosen because they are readily generated from a microwave discharge of moist air and they do not react with the major constituents of air. However, one disadvantage of restricting the reagent ions to just these three positively charged ions is that not all volatile analytes react with them. There are a number of environmentally significant volatiles (such as HF, HCl, SO2, and SO3) that are ubiquitous pollutants in some industries but do not react with H3O+, NO+, and O2+. Similarly, quite a number of different small molecules are used as fumigants in shipping containers. Some of these common fumigants are hydrogen cyanide, HCN; ethylene dibromide, C2H4Br2; ethylene oxide, C2H4O; methyl bromide, CH3Br; chloropicrin, CCl3NO2; formaldehyde, HCHO; acetaldehyde, CH3CHO; phosphine, PH3 and Vikane (sulfuryl fluoride), SO2F2. Several of these fumigants such as Vikane are unreactive with positive reagent ions. Others such as phosphine have ambiguities when other analytes such as H2S are present with positive ion reagents. For reasons such as these, we have extended the range of reagent ions available for analysis of samples by adding five additional negative ions O−, OH−, O2−, NO2−, and NO3−. These ions can also be generated from the same microwave ion source of moist air as the positive reagent ions. We also examined the consequences of changing the bath gas from helium to nitrogen.
2. Experimental Method
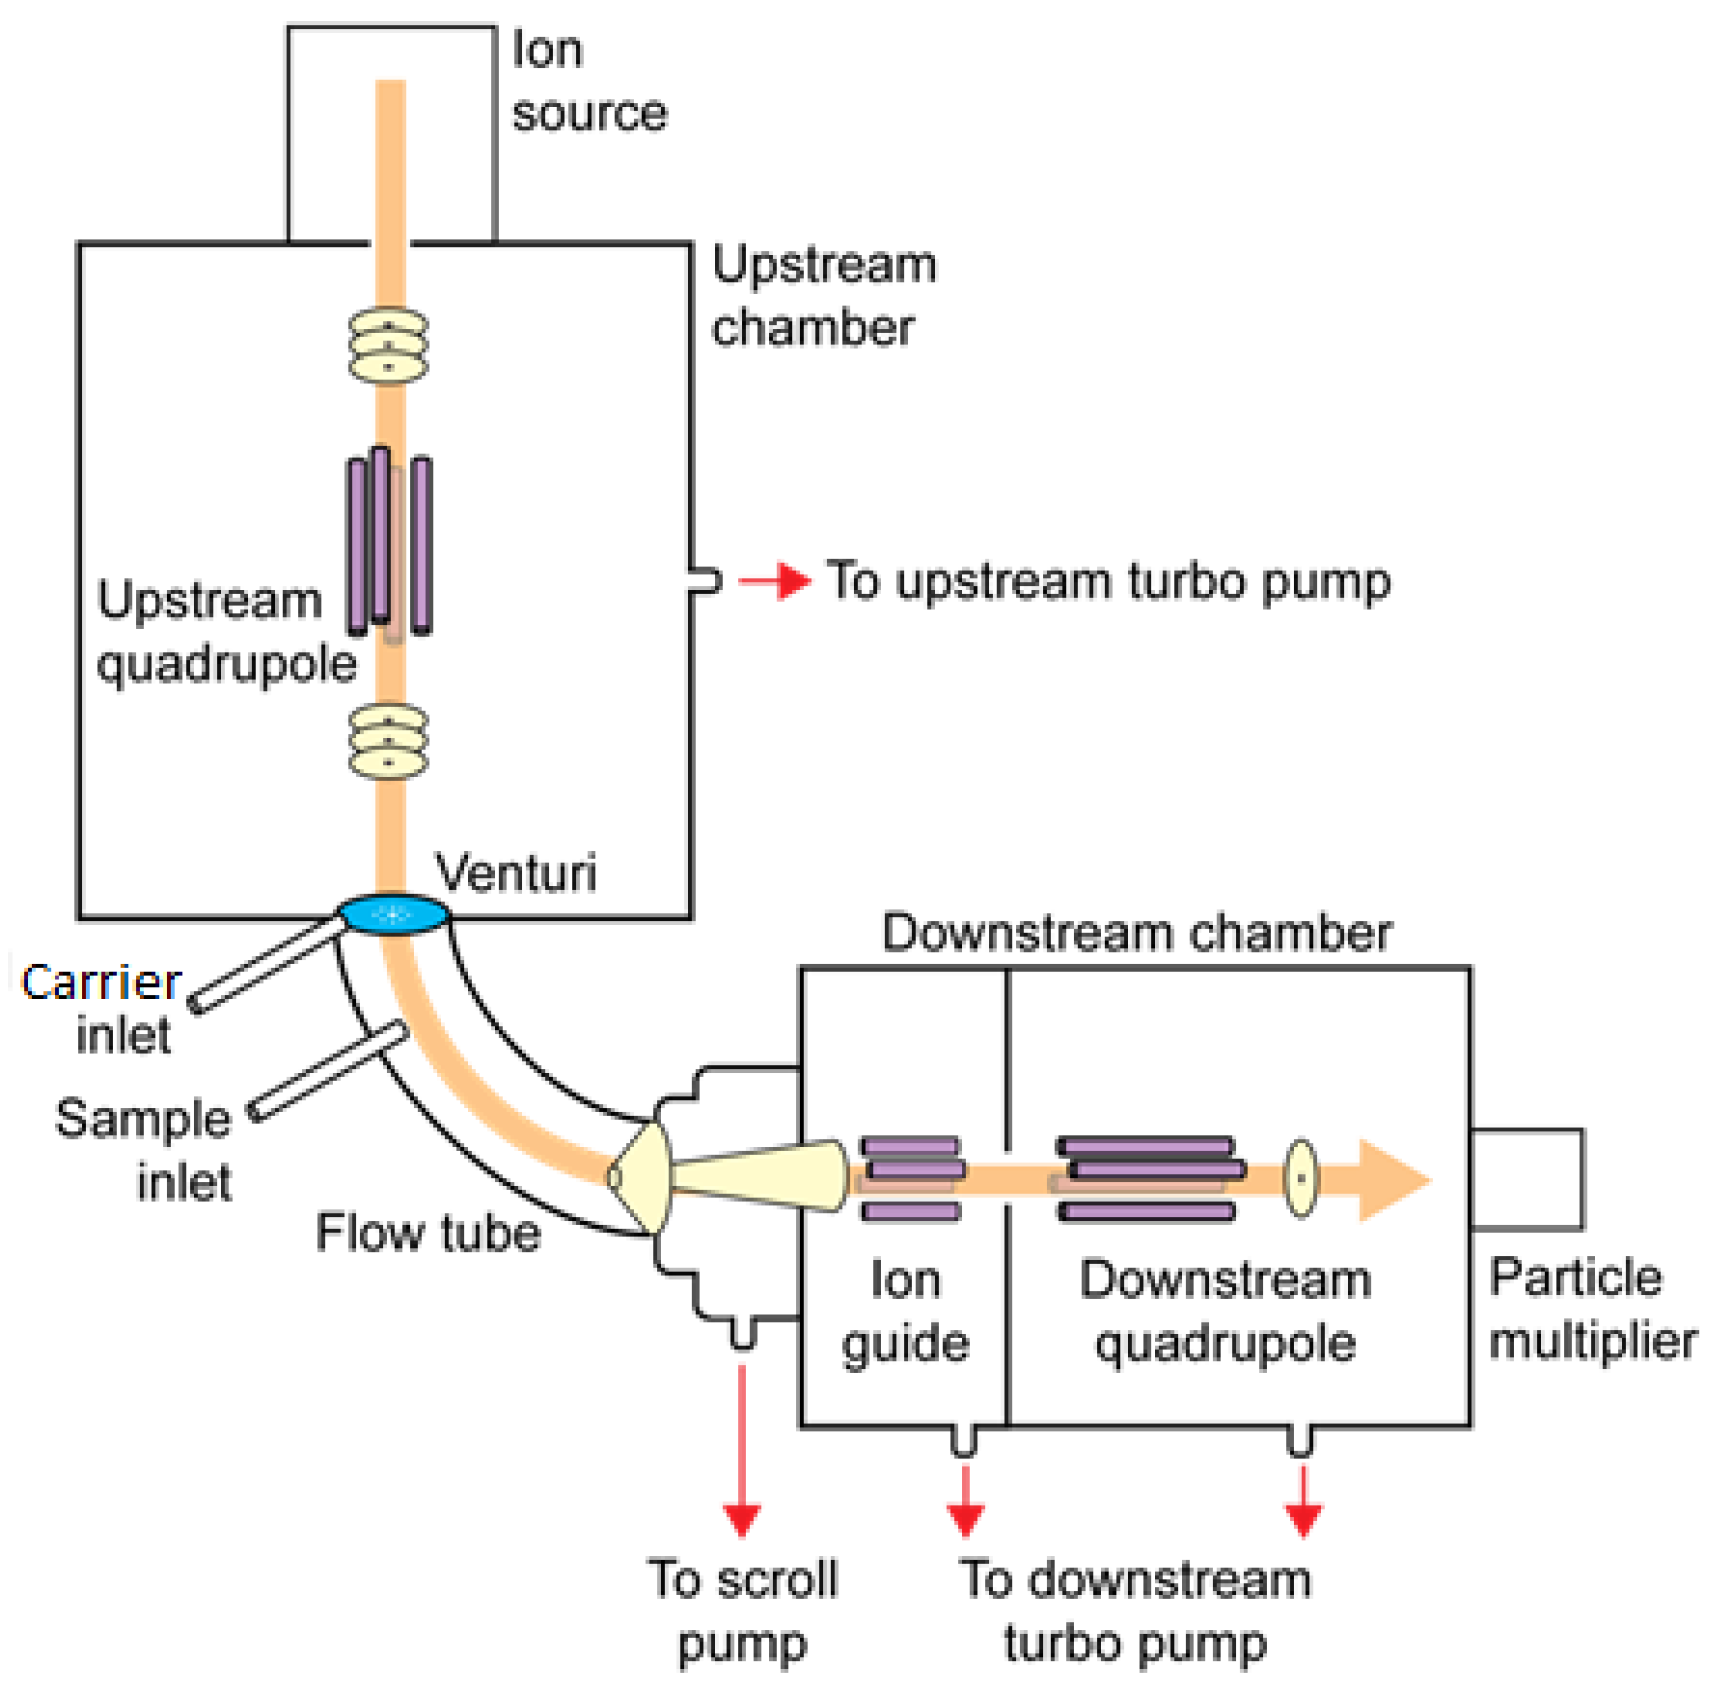
A schematic outline of a commercial SIFT-MS instrument is shown in
Figure 1. It has four distinct regions. The ion source region traditionally operates at 400 millitorr of moist air generating the major ions H
3O
+, NO
+, and O
2+ which are then mass-selected by the upstream quadrupole. The mass-selected ions then pass into the flow tube where the reagent ion-analyte reactions take place. The unreacted reagent ions together with the product ions resulting from the reactions are mass-selected by the downstream quadrupole and counted.
In order to generate negative reagent ions, the pressure in the ion source was increased to above 700 millitorr and a negative voltage gradient (up to 500 V) was introduced into the microwave discharge. Adjustments to lens voltages required for changing between positively and negatively charged reagent ions can be done in milliseconds. However, changes to the ion source pressure conditions take longer (seconds). For this reason, several strategic changes were also introduced into the software controlling the moisture and pressure conditions in the ion source allowing easy switching between positive and negative ion formation. Five negatively charged reagent ions were found.
The reagent ions OH− and O2− are usually generated from moist air and O−, NO2−, and NO3− from a dry air source. These negative reagent ions are mass-selected by the upstream quadrupole in the same way as the positive reagent ions before entering the flow tube. The reagent ions can generally be interchanged within 8 ms, although switching between moist and dry negative ion sources takes several seconds.
The carrier gas is added through the inlet labelled “carrier inlet” in
Figure 1, and the sample is simply drawn into the flow tube via the sample inlet at a known rate defined by the sample capillary dimensions.
2.1. Nitrogen Carrier Gas
When nitrogen was used as the carrier gas, the pressure in the flow tube was usually reduced from 600 millitorr (with helium as the carrier gas) to around 450 millitorr. Entry of the reagent ions into the flow tube is assisted by means of a Venturi inlet [
4,
39] which facilitates the transmission of ions against the pressure gradient. Although helium had been the carrier gas of choice, in view of the unreliable supplies in some countries and its cost, we have utilized nitrogen which can be supplied by a nitrogen generator. A consequence of using nitrogen means it is necessary to know the rate coefficients of any three body reactions if relevant in the chemistry that is used to evaluate analyte concentrations. Most of the data in the literature has been evaluated for a helium carrier gas and although these data may be applied to nitrogen for binary exothermic ion molecule reactions, some adjustments may need to be made for three body reactions in nitrogen.
2.2. Negative Reagent Ions
Typical reagent ion counts for positive ions are usually greater than 10
7 cps, which enables concentrations of analytes as low as pptv to be monitored in real time [
40], although the negative ions have a slightly lower abundance.
A comparison between the positive and negative mode of ion source operation is informative. For the positive reagent ions of H
3O
+, NO
+, and O
2+, typical analogue currents after transmission through the upstream quadrupole as measured on the last lens before transmission into the flow tube are around 10.5 nA for each ion. After transmission through the flow tube, the ion current measured at the lens sampling the ions at the downstream end is reduced to ~110 pA. For the negative reagent ions of O
−, OH
−, O
2−. and NO
2−, the analogue currents transmitted by the upstream quadrupole are typically ~−6 nA reducing to ~−70 pA after passage along the flow tube, but with some variation depending on the reagent ion. Prior to injection of the reagent ions from the upstream quadrupole chamber, the lens voltages are optimized to minimise the presence of any ions to less than ~5% of the mass-selected reagent ion counts [
41]. As noted in the next section, the reactions of some negative reagent ions with atmospheric CO
2 yield cluster ions that can participate in secondary ion chemistry. Those instruments operating with a nitrogen carrier gas instead of helium require a little more care in adjusting the lens voltages and ion source pressure than for positive reagent ions, in order to optimize the negative reagent ion signal.
In the experiments that follow, negative reagent ions were mass selected by the upstream quadrupole and passed into the flow tube where a nitrogen carrier gas carried them along to the downstream quadrupole. Here, the product and reagent ions of the reactions examined were counted. Certified concentration mixtures of specific analytes were obtained from the suppliers specified in the next section, and gas mixtures of these specified analytes were added through the sample inlet at a known flow rate into the reaction tube. The known rate coefficients of the negative reagent ions with those analytes were used to monitor their concentrations using the SIFT-MS instrument which were then compared with the concentrations of the mixtures specified by the suppliers using the methods discussed in the literature for SIFT-MS [
5]. In the case of the fumigants examined in this work (with the exception of sulfuryl fluoride), rather than using gas mixtures of analytes from reference mixtures at certified concentrations, permeation tubes (supplied by Kintek, La Marque, TX, USA) were used that supply certified concentrations of the fumigant at a specified temperature and oven flowrate for the nitrogen carrier gas.
2.3. Chemicals
Two certified mixtures of CO2 were obtained from a commercial supplier (CAC Gas and Instrumentation, Arndell Park, NSW, Australia) of 500 ppmv (in nitrogen) and 40,000 ppmv (in synthetic air) both with a stated accuracy of ±2%.
A certified mixture of sulfuryl fluoride (Vikane) (5.02 ppmv in air (±2%) was supplied by Scott Marrin, Riverside, CA, USA). Certified concentrations of the acid gases in nitrogen HCl (10 ppm ± 10%); SO2 (10 ppm ± 10%); H2S (25 ppm ± 5%), and NO2 (10 ppm ± 10%) were obtained from CAC Gas, NSW, Australia. A certified mixture of HF in nitrogen (10 ppm ± 20%) was obtained from Matheson, Aendell Park, Australia and SO3 (>99% contained in a stabilizer) was obtained from Aldrich, St. Louis, MO, USA. The remaining fumigants (chloropicrin, HCN, CH3Cl, PH3, and dibromoethane) were obtained from known concentrations of these fumigants in nitrogen obtained from permeation tubes operating at their calibrated flows and temperatures as supplied by Kintek (La Marque, TX, USA).
3. Results and Discussion
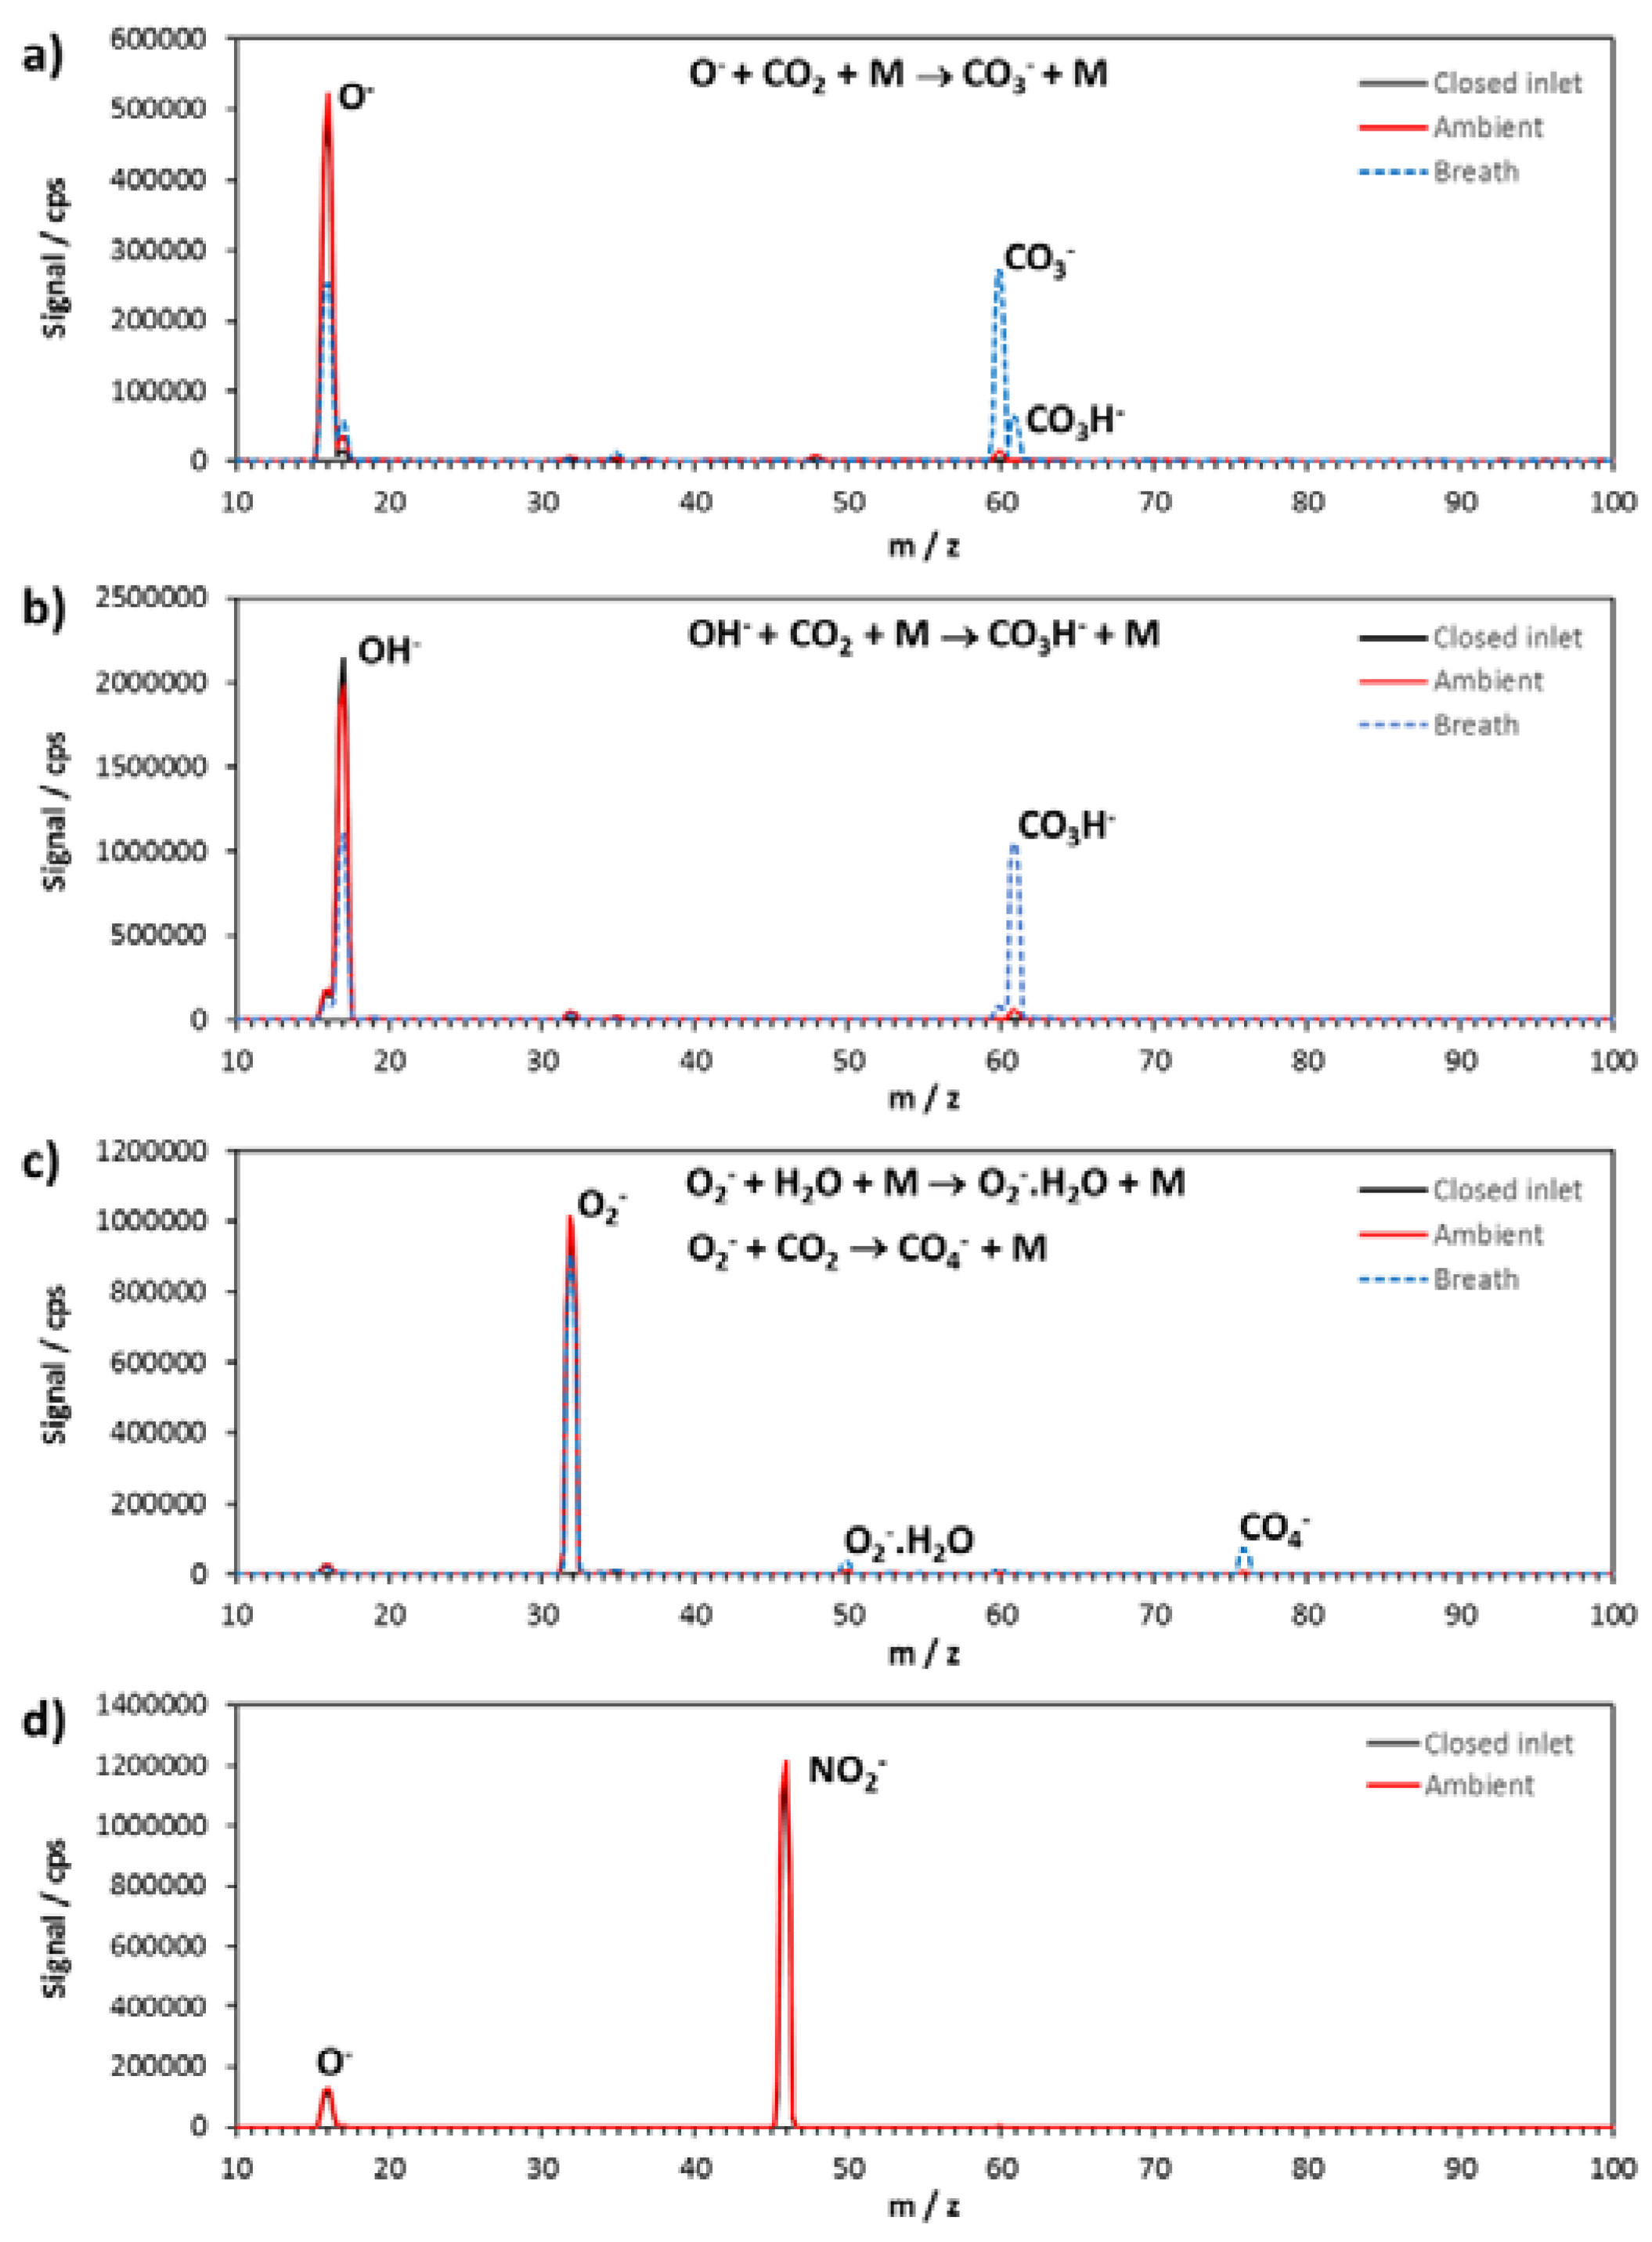
All the results shown here were obtained using a nitrogen carrier gas and at a flow tube temperature of 120 °C. We show the mass spectra of four of the negative reagent ions in the flow tube with and without an air sample of laboratory air flowing into the flow tube through the reaction tube sample inlet and also with a breath exhalation (
Figure 2a, O
−;
Figure 2b, OH
−;
Figure 2c, O
2−; and
Figure 2d, NO
2−). The reason for the inclusion of the sample air and breath exhalation is to show the presence of CO
2. CO
2 is present naturally in air, and slow termolecular association reactions of the negative reagent ions occur with it. The products of these negative ion reactions with CO
2 reactions are therefore present in every scan of a sample in air. Base levels of CO
2 in New Zealand are around 390 ppmv [
42]. Usually bimolecular ion-molecule reactions occurring at the collision rate (~3 × 10
−9 cm
3·s
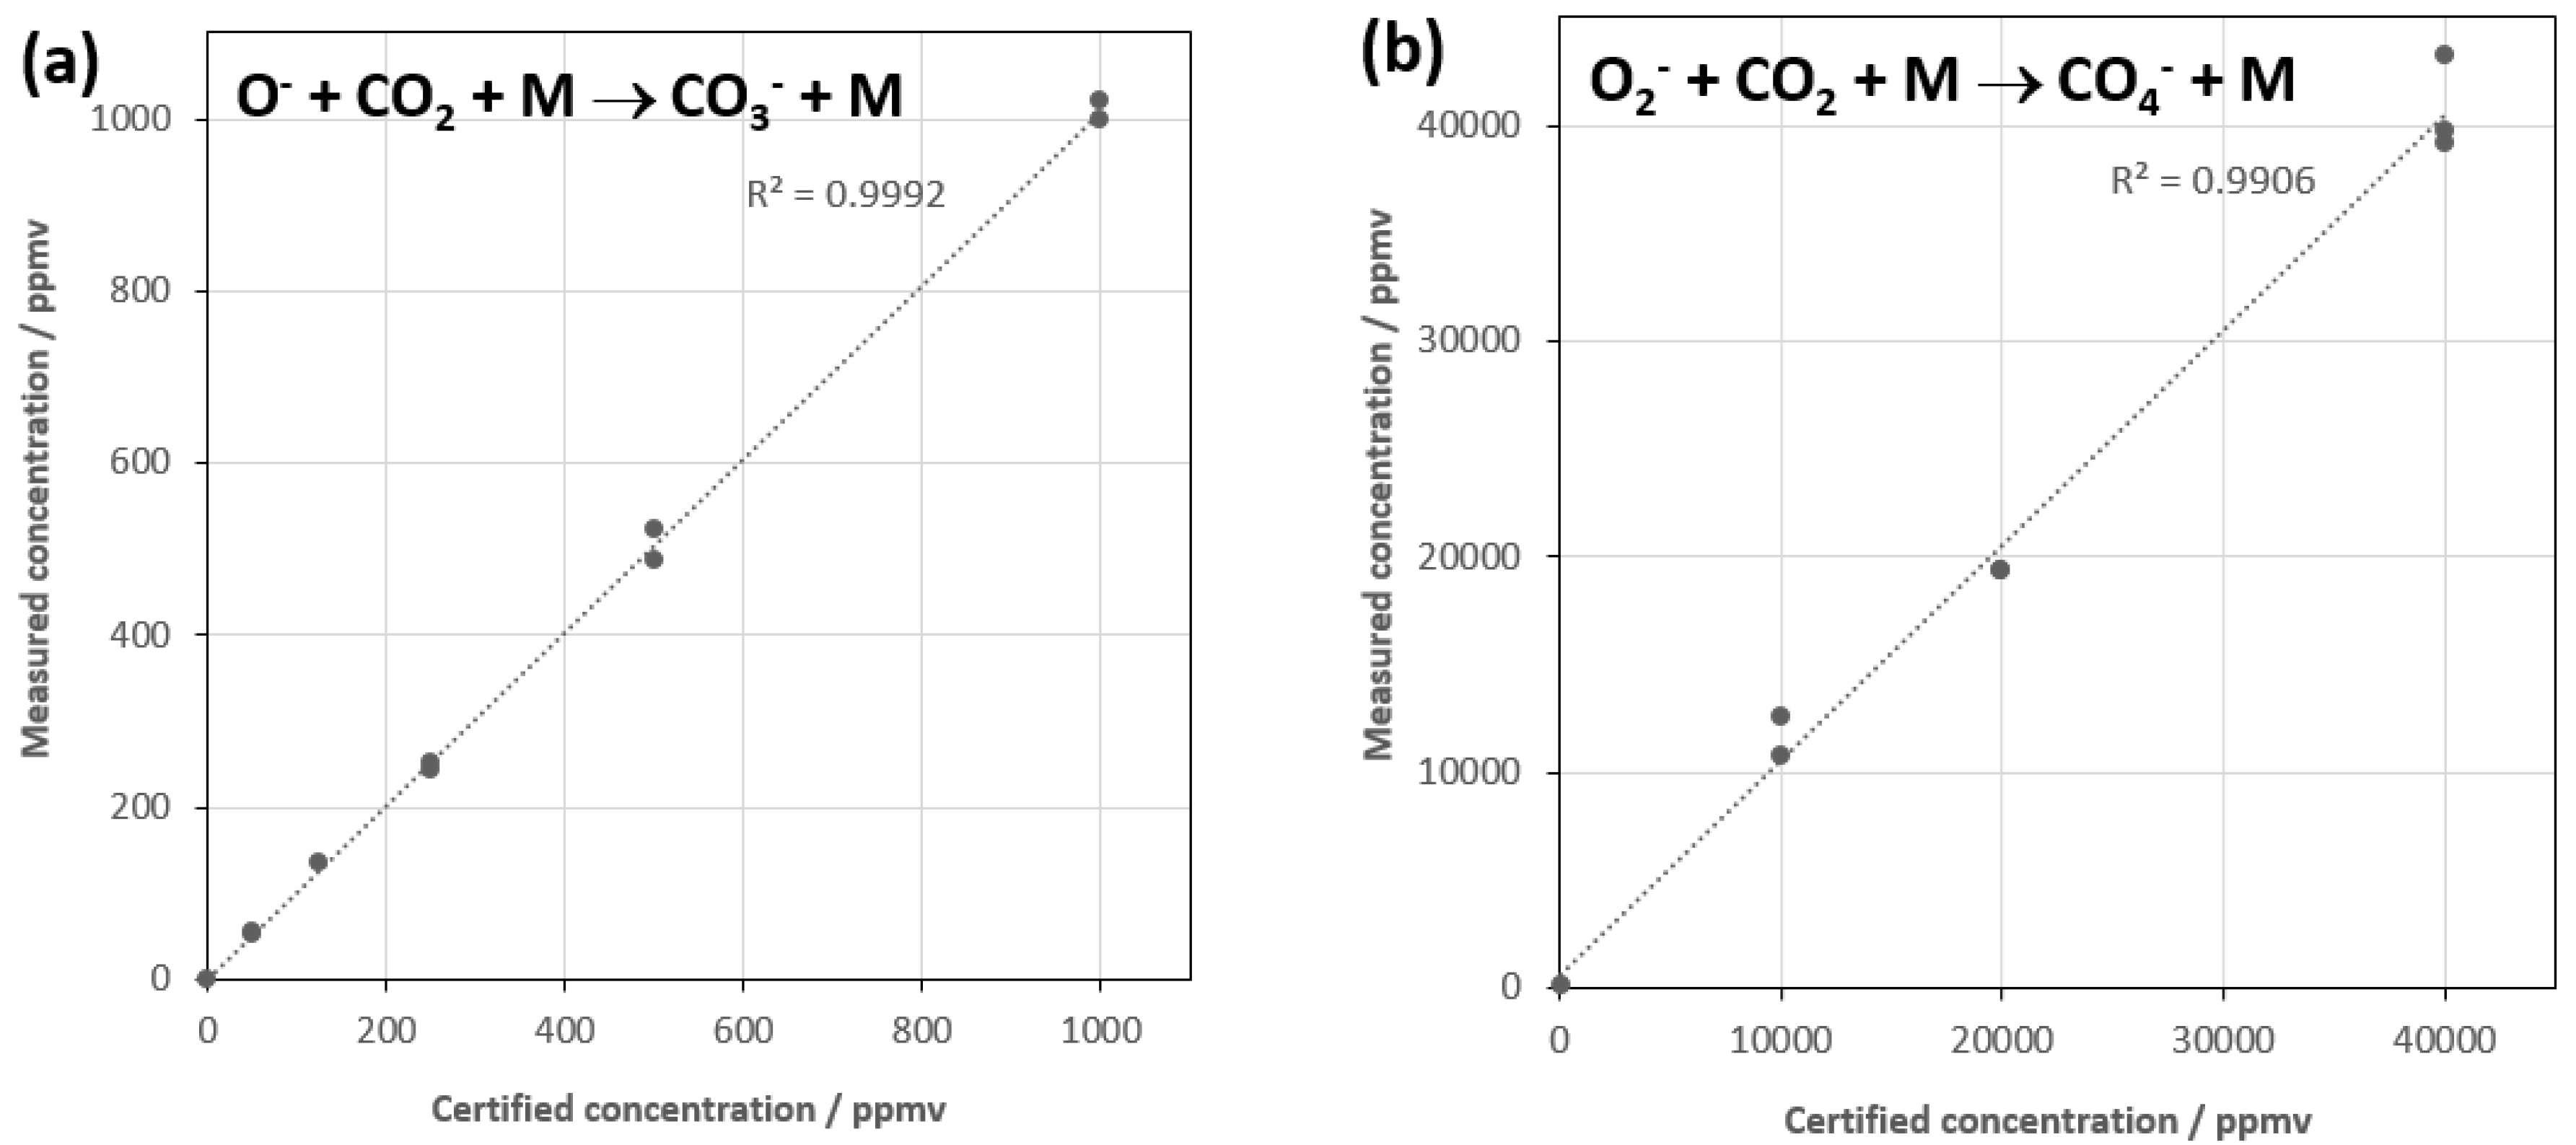
−1) limit analyte concentrations measured in a SIFT-MS instrument to less than 20 ppmv. Concentrations of analytes higher than this would require sample dilution. In the present case, however, an association rate coefficient of 3.1 × 10
−28 cm
6·molec
−2·s
−1 is equivalent to a binary rate coefficient of 3.2 × 10
−12 cm
3·s
−1. This rate coefficient is effectively three orders of magnitude less than a typical exoergic binary rate coefficient, allowing much higher concentrations of CO
2 to be measured. A rate coefficient of this magnitude allows linear changes with CO
2 concentrations up to 1000 ppmv for O
− (reaction 1) and over 40,000 ppmv for O
2− (reaction 2) to be monitored. The rate coefficients for CO
2 have been previously determined [
43].
The linearity with concentrations of the two certified mixtures of CO
2 was checked using each reaction, and the results are shown in
Figure 3a,b. Two additional secondary binary reactions that have some small contribution to the product ions in reactions (1) and (3) and that need to be included in the analysis as they also contribute to the magnitude of CO
3− and CO
4− are reactions (4) and (5) [
44,
45]:
An interesting side effect of the concentration range for O2− and CO2 is that it can be used to directly monitor CO2 in breath, which typically ranges between 3% and 6% of a breath exhalation.
3.1. Reactions with Fumigants
Vikane: Because of their rapid response time and ease of use, SIFT-MS instruments have been used widely by Border Protection Agencies and Contract Testing Companies to monitor shipping containers that have been fumigated. One of these fumigant chemicals is Vikane (sulfuryl fluoride) or SO2F2. SO2F2 is not reactive with the three positive reagent ions, but does exhibit rapid reactions with O−, OH−, and O2−.
These reagent ions give excellent concentration data, as is demonstrated in
Figure 4 for reaction of the OH
− reagent ion with Vikane in comparison with static dilutions of the certified mixture of Vikane (5.02 ppmv ± 2%) in air.
3.2. Other Fumigants
A summary of the reaction chemistry observed for other fumigants examined with the negative reagent ions are presented in
Table 1 (O
−),
Table 2 (OH
−), and
Table 3 (O
2−). In these tables, the rate coefficients that have been estimated in the present work for chloropicrin and phosphine have been based on the certified concentations of these fumigants in permeation tubes in the low ppmv range. These concentrations were also confirmed by the known reactions of these fumigants with the positively charged reagent ions H
3O
+ or O
2+. Based on these known data, the rate coefficients for chloropicrin and phosphine were adjusted for the negative ion reagents to give the same values as for the positive reagent ions, and are presented as approximate by the ~ symbol. The branching ratio column refers to a reaction of the reagent ion with the analyte in which multiple product ions with the fumigant are formed. It represents the fraction of reactions that terminate in the stated product ion.
3.3. Acid Gases
Most of the acid gases are unreactive with the three positively charged reagent ions commonly used in SIFT-MS instruments. The present expansion of the reagent ions used in SIFT-MS to the negative ions O
−, OH
−, O
2−, NO
2−, and NO
3− has made monitoring of these acid gases relatively simple using the direct analysis technique of SIFT-MS. The ion chemistry is summarised in
Table 4,
Table 5 and
Table 6, and known concentrations were investigated using calibrated mixtures of each analyte in nitrogen (unless specified otherwise), as discussed previously.
Perhaps the biggest problem in monitoring the most reactive acid gases such as HF using a direct technique was having an inlet system conditioned to the transmission of HF without loss of HF to the walls of the inlet tubing. In this test, heated ¼ inch OD polytetrafluoroethylene tubing was used to transport a calibrated mixture (10 ppmv) into the instrument. Inlet conditioning times of at least three hours were required before the HF concentration stabilized and monitored concentrations approached the manufacturers’ levels. Once the conditioning process was completed, the HF measurements can be completed in a few seconds.
3.4. Other Negatively Charged Reagent Ions
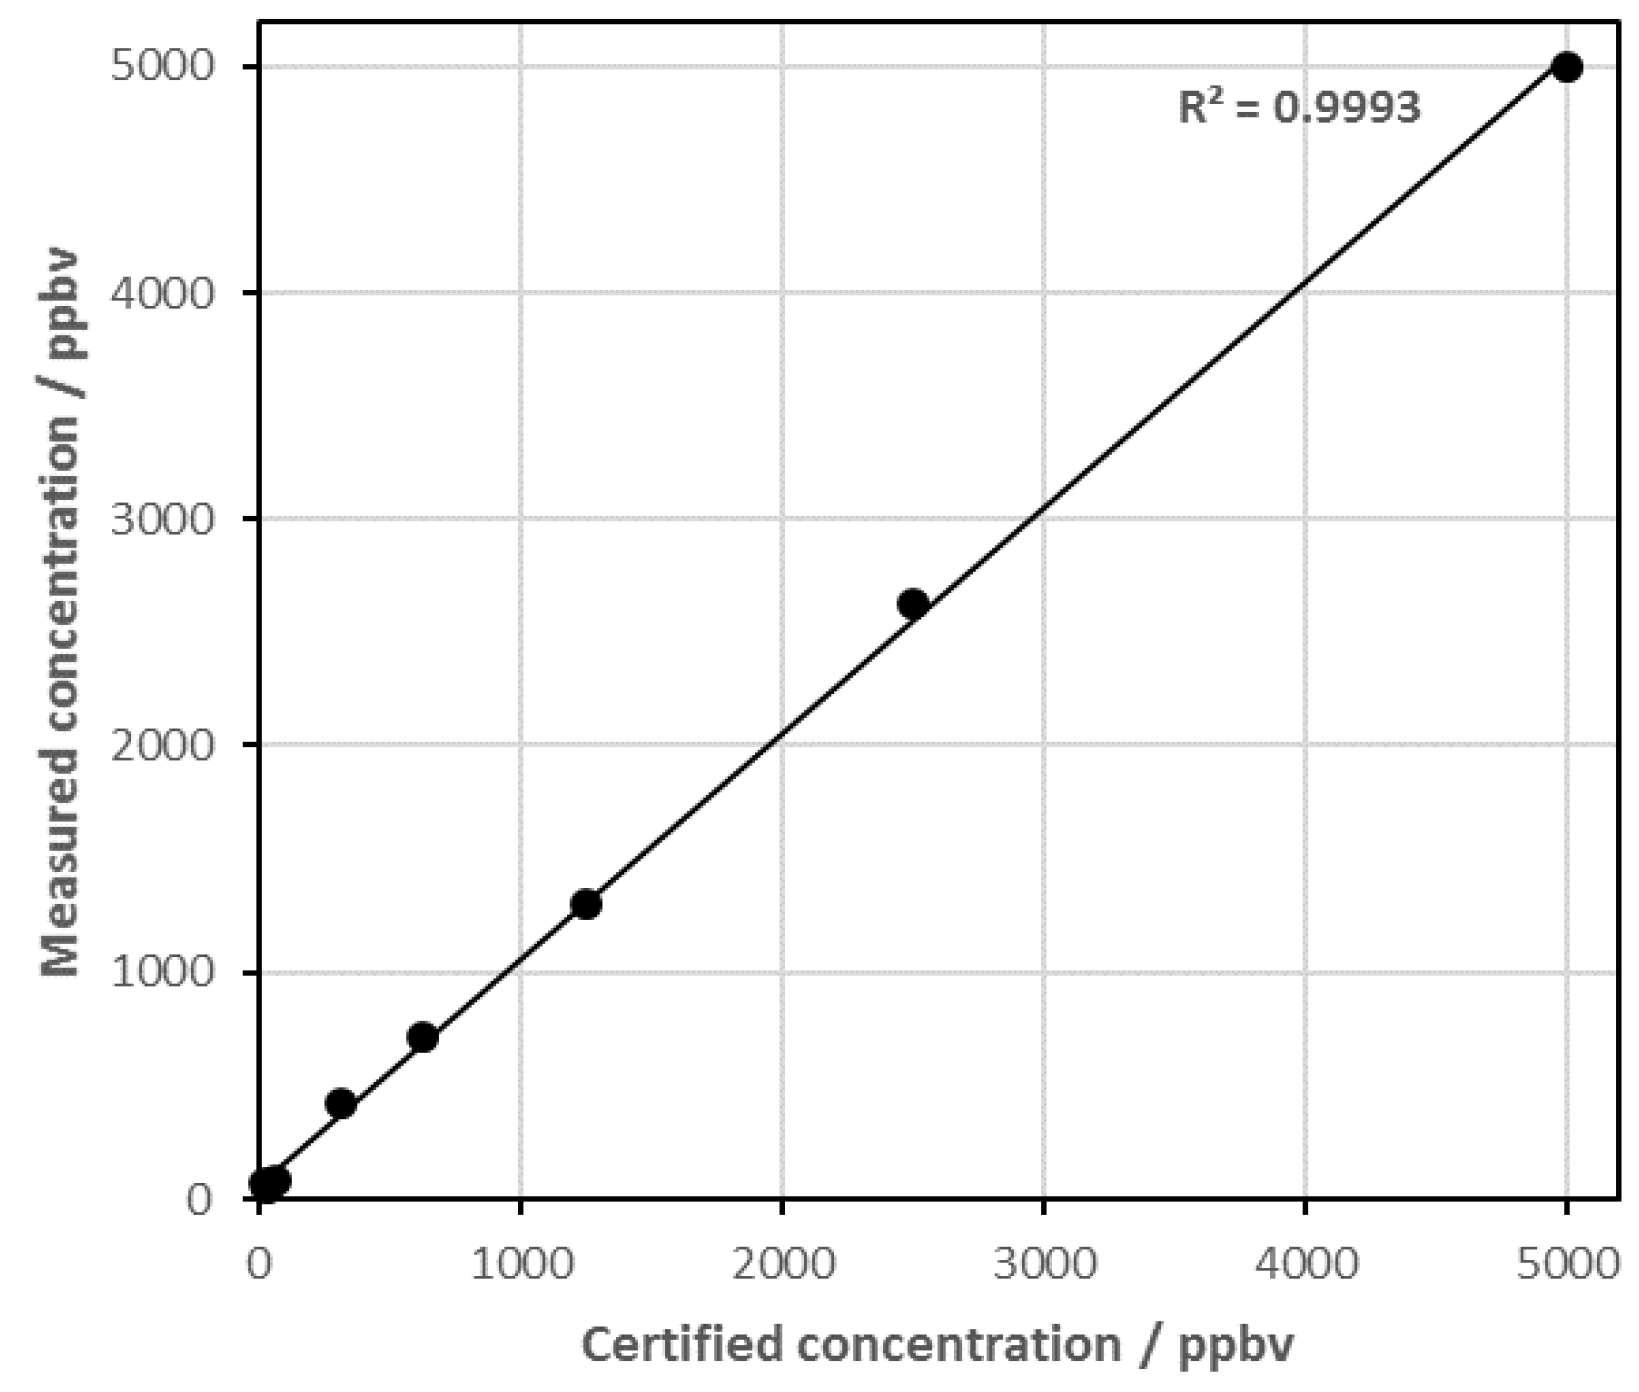
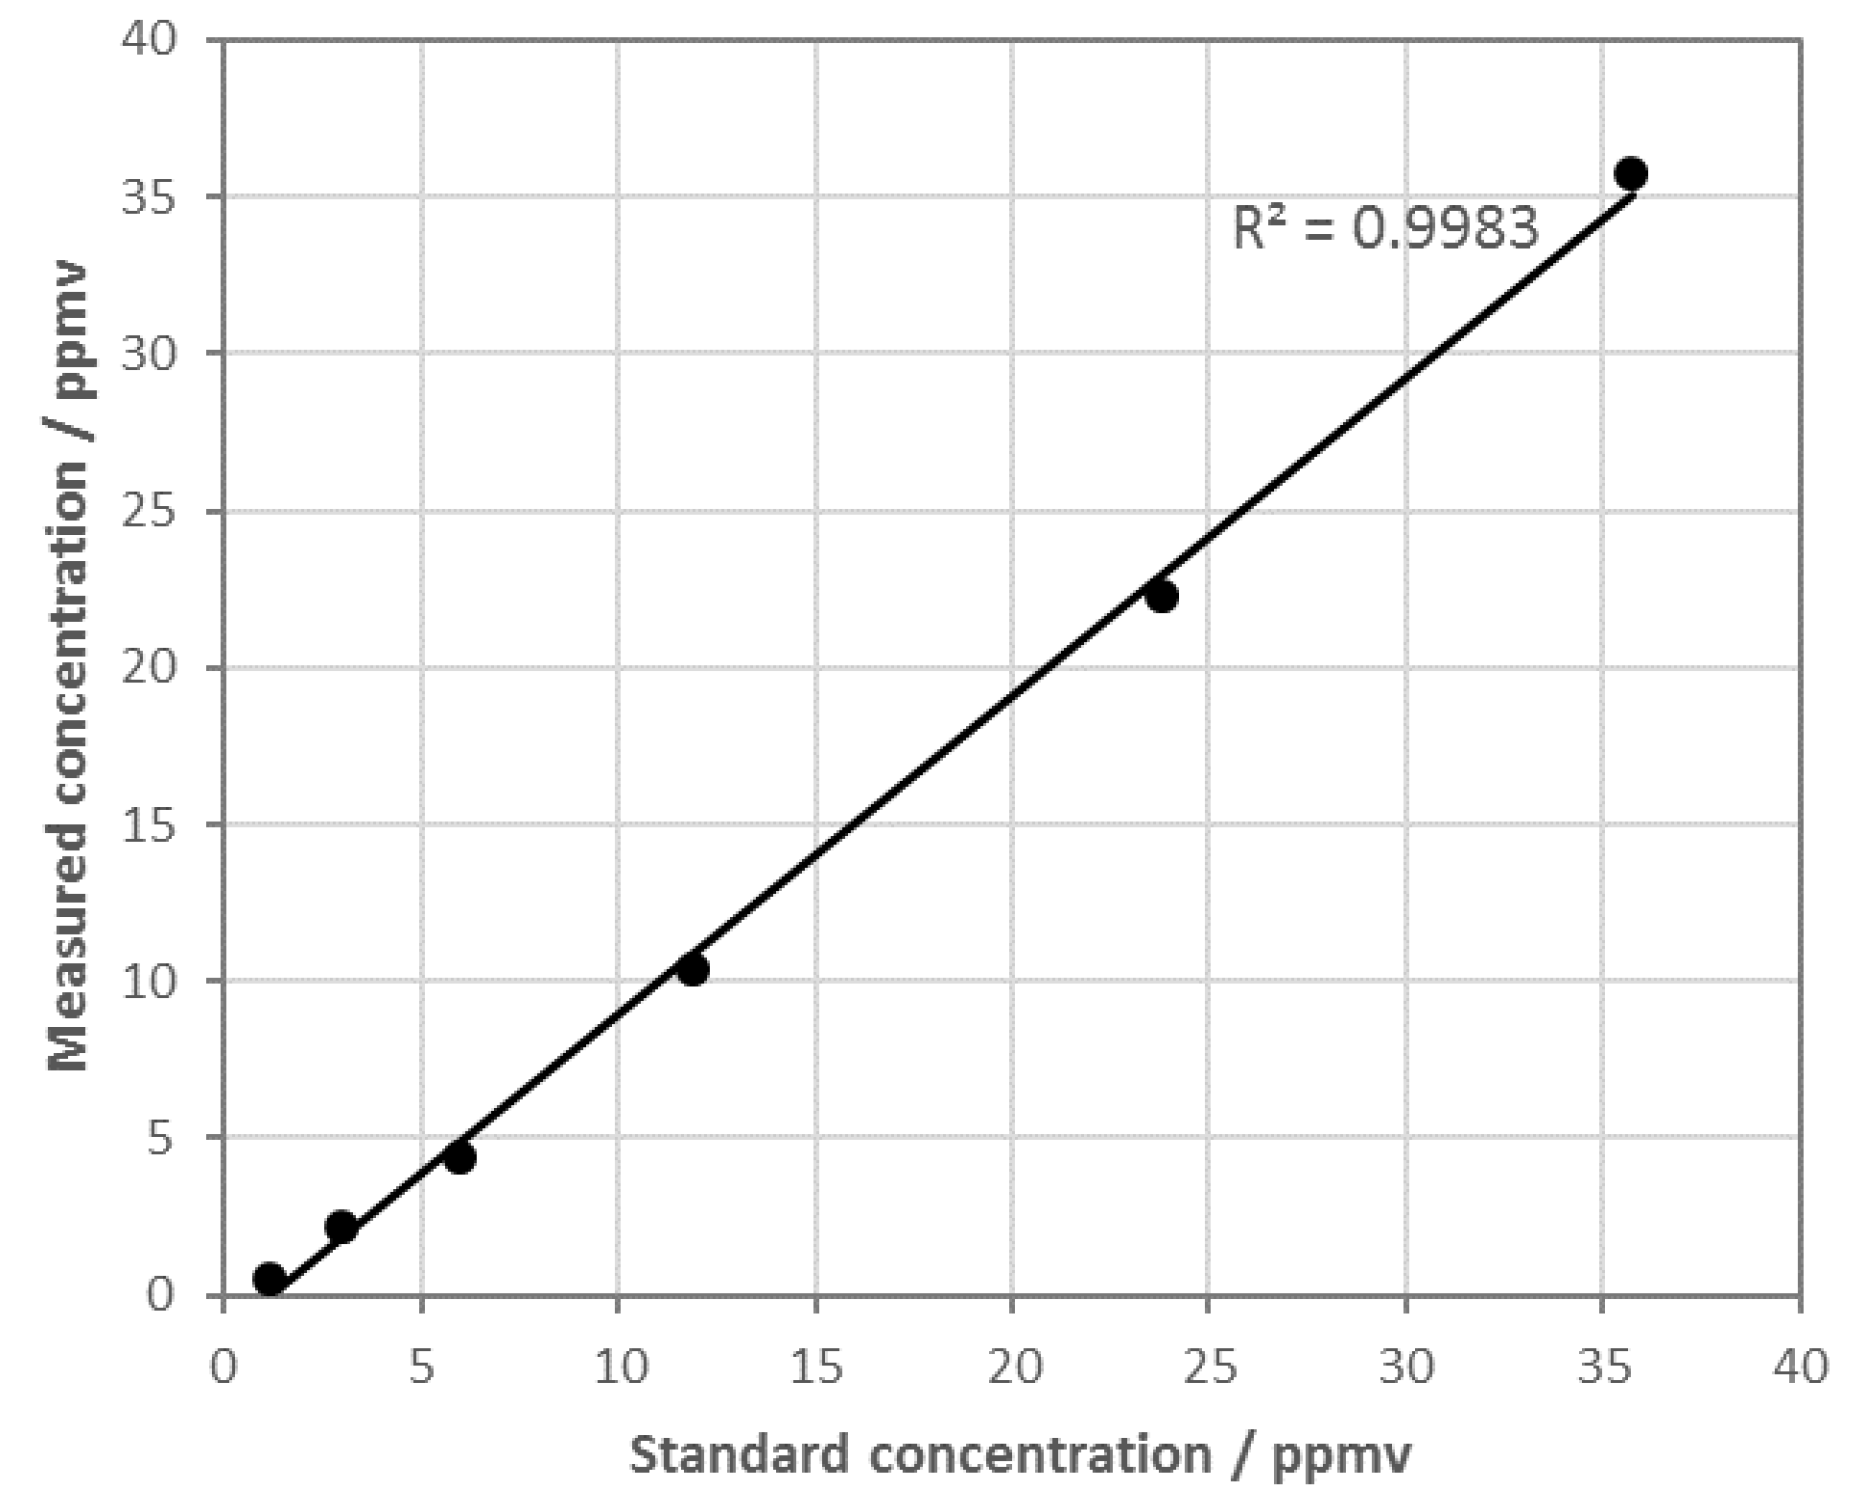
In the brief discussion outlined here on the application of negative reagent ions with various analytes, we have not discussed much of the ion-molecule chemistry of NO2− and NO3−. These two ions are also produced from a microwave discharge of dry air in the instrument ion source with air as the source gas. The NO3− ion is largely unreactive with many of the common environmental contaminants but the NO2− ion, although less reactive than the negative ions already discussed, does undergo some useful reactions with some analytes. One example is the reaction of NO2− and HCl, which provides a very useful measure of the HCl concentration.
The reaction between NO
2− and HCl is [
59]
A linear relationship is found using a SIFT-MS instrument by monitoring the ratio of the Cl
− product ion and the NO
2− reagent ion for concentrations of HCl from ppbv ranging up to 35 ppmv, and is shown in
Figure 5.
Finally, we note that in all the analytes mentioned in this work in
Table 1,
Table 2,
Table 3,
Table 4,
Table 5 and
Table 6, linear correlations were found with concentration using nitrogen as the carrier flow gas, further underscoring the usefulness of the SIFT-MS technique by extending the carrier gas from helium to nitrogen. We also note that when the change from a helium to a nitrogen carrier gas is implemented, enhanced association reactions may occur such as the reactions coverting H
3O
+ to H
3O
+.(H
2O)
n where
n = 1–3.
4. Conclusions
In the past few years, direct analytical techniques utilizing mass spectrometric detection have greatly simplified the process of monitoring analytes at trace levels in air samples. SIFT-MS, in particular, because of the selection of reagent ions readily available to the technique and the ease of transitioning between them, has proven very effective at monitoring a wide range of analytes in the areas of medicine, the environment, and food and flavor chemistry. The analyte concentration is simply found from the ratio of the product ion counts to the reagent ion counts, the known flow conditions, and an instrument calibration factor [
4].
One constraint to the number of applications previously available to SIFT-MS was that not all analytes were accessible to the technique. Several smaller analyte molecules in areas such as fumigation and those of the acid gases were unreactive with the positively charged reagent ions used. In this work, we have extended the number of reagent ions to negatively charged ions, and in the process generated five new negatively charged ions (O−, OH−, O2−, NO2−, and NO3−) that may be used to react with analyte molecules. We have demonstrated their effectiveness at monitoring selected analytes that were formerly blind to positive reagent ions over a wide concentration range. We have also demonstrated the effectiveness of using nitrogen as a carrier gas for the SIFT-MS flow tube reactor in comparison with helium.


