Article

Combining Ecosystem Services with Cost-Benefit Analysis for Selection of Green and Grey Infrastructure for Flood Protection in a Cultural Setting

1
UNESCO-IHE, Institute for Water Education, Westvest 7, AX Delft 2611, The Netherlands
2
College of Engineering, Mathematics and Physics, University of Exeter, Exeter EX4 4QF, UK
3
Faculty of Civil Engineering, Department of Hydraulic and Environmental Engineering, University of Belgrade, Bulevar kralja Aleksandra 73, Beograd 11000, Serbia
4
School of Engineering and Technology, Asian Institute of Technology, P.O. Box 4 Klong Luang, Pathumthani 12120, Thailand
5
Hydro and Agro Informatics Institute (HAII), Khwaeng Thanon Phaya Thai, Khet Ratchathewi, Krung Thep Maha Nakhon 10400, Bangkok, Thailand
6
Pudar Mitigation Consulting, Inc., P.O. Box 680725, Marietta, GA 30067, USA
*
Author to whom correspondence should be addressed.
Environments 2017, 4(1), 3; https://doi.org/10.3390/environments4010003
Submission received: 4 December 2016 / Revised: 21 December 2016 / Accepted: 23 December 2016 / Published: 28 December 2016

Abstract

:
The present paper describes a methodological framework that combines ecosystem services (flood protection, education, art/culture, recreation and tourism) with economic analysis for selection of multifunctional measures for flood resilience. The framework includes active stakeholder participation and it consists of the four main components: (1) identification and valuation of ecosystem services pertinent to the project site under various mitigation scenarios, including baseline (pre-mitigation conditions); (2) evaluation of most effective flood mitigation measures through hydrodynamic simulations, and evaluation of economic viability using cost-benefit analysis; (3) selection of measures through consideration of ecosystem services, and solicitation of stakeholders’ inputs; (4) development of the conceptual landscape design. Application of the framework was demonstrated in a case study of Ayutthaya Island, Thailand. Results of our research suggest that taking a holistic perspective of ecosystem services and economic assessments, marshalled through active stakeholder participation, has the potential to achieve more ecologically sustainable and socially acceptable solutions for flood protection in areas with cultural heritage. However, there is still a considerable challenge in taking this framework to a full-scale practical implementation, and this mainly relates to the selection of indicators that can enable proper application of ecosystem services.

1. Introduction

Despite the great achievements in technological capabilities, the world is being overwhelmed by record disasters such as hurricanes (or tornados), tsunamis, widespread flooding, droughts, and climate extremes, all of which are associated with devastating losses and suffering, that occur almost daily (e.g., [1,2,3,4]). However, the majority of these events, although commonly referred to as natural disasters, are, to an ever-increasing extent, directly attributable to the actions of human beings and sociotechnical interactions that shape these processes (see, for example, [5,6,7,8,9]). Therefore, the search for optimal configurations of urban water infrastructure systems represents a great challenge for researchers and practitioners (e.g., [10,11,12,13,14,15]).
The uncertainty brought by climate change (or climate extremes) elevates the above challenge even further. Some of the early efforts associated with the search and selection of stormwater management and flood protection measures were only concerned with economic consideration of structures (e.g., levees, floodwalls, dams, embankments, storage basins, diversions, etc.) with little consideration of other aspects that are nowadays proving to be at least equally (if not more) important than the mere economic analyses. Nowadays, although the approaches for effective decision-making have advanced in many areas, the current practice is still dominated by the traditional cost-benefit type of analysis (i.e., CBA, sometimes also referred to as benefit-cost analysis, BCA). As discussed at some length in [9] and also in [16], this approach may appear appealing, but it is very much a simplistic and limited in relation to aspects such as ethics, culture and ecosystems functioning. A classic example is a cultural heritage asset that may consist of simple materials with little, or insignificant, monetary value, but it can embody immense intangible cultural significance (which can be priceless) to the local community. Furthermore, this approach is also restrictive in dealing with impacts to the low-income residents (and, particularly, those residents of informal or squatter settlements—i.e., slum areas or shanty towns). Therefore, finding the right way forward poses a formidable challenge to researchers and practitioners, and it requires development and application of advanced concepts, framework and tools that can enable holistic planning and working.
The conceptual framework for holistic planning, which is essentially an ecosystem-based framework, has been discussed in [9] and also in [16] (Figure 1). Such framework places human values and those of nature into primary focus, and it assumes the existence of coevolutionary nonlinear interactions between the ever-changing social, technical and natural processes. It suggests that adaptive capacity is created and constrained by understanding interactions between different aspects and phenomena. As mentioned earlier, the evidence available from current practice suggests that there is a clear lack of integration between economic and social and cultural considerations within the analyses, and this emerges as a major hindrance for selecting sustainable measures for flood resilience. Some of these observations are already highlighted in the Chengdu Declaration for Action of the UN International Strategy for Disaster Reduction (UNISDR). Furthermore, the Intergovernmental Panel on Climate Change (IPCC) [17] Special Report on Managing the Risks of Extreme Events and Disasters to Advance Climate Change Adaptation (SREX) argues strongly for frameworks or approaches that can better understand not only physical and social systems generating hazard and risk but also their interactions and contexts across different scales, and it highlights that they must be at the forefront of improved agendas for adaptive risk governance [16].
As illustrated in [16], a conceptual framework for holistic planning (Figure 1) progresses beyond the traditional integrated urban flood management approach in a series of domains:
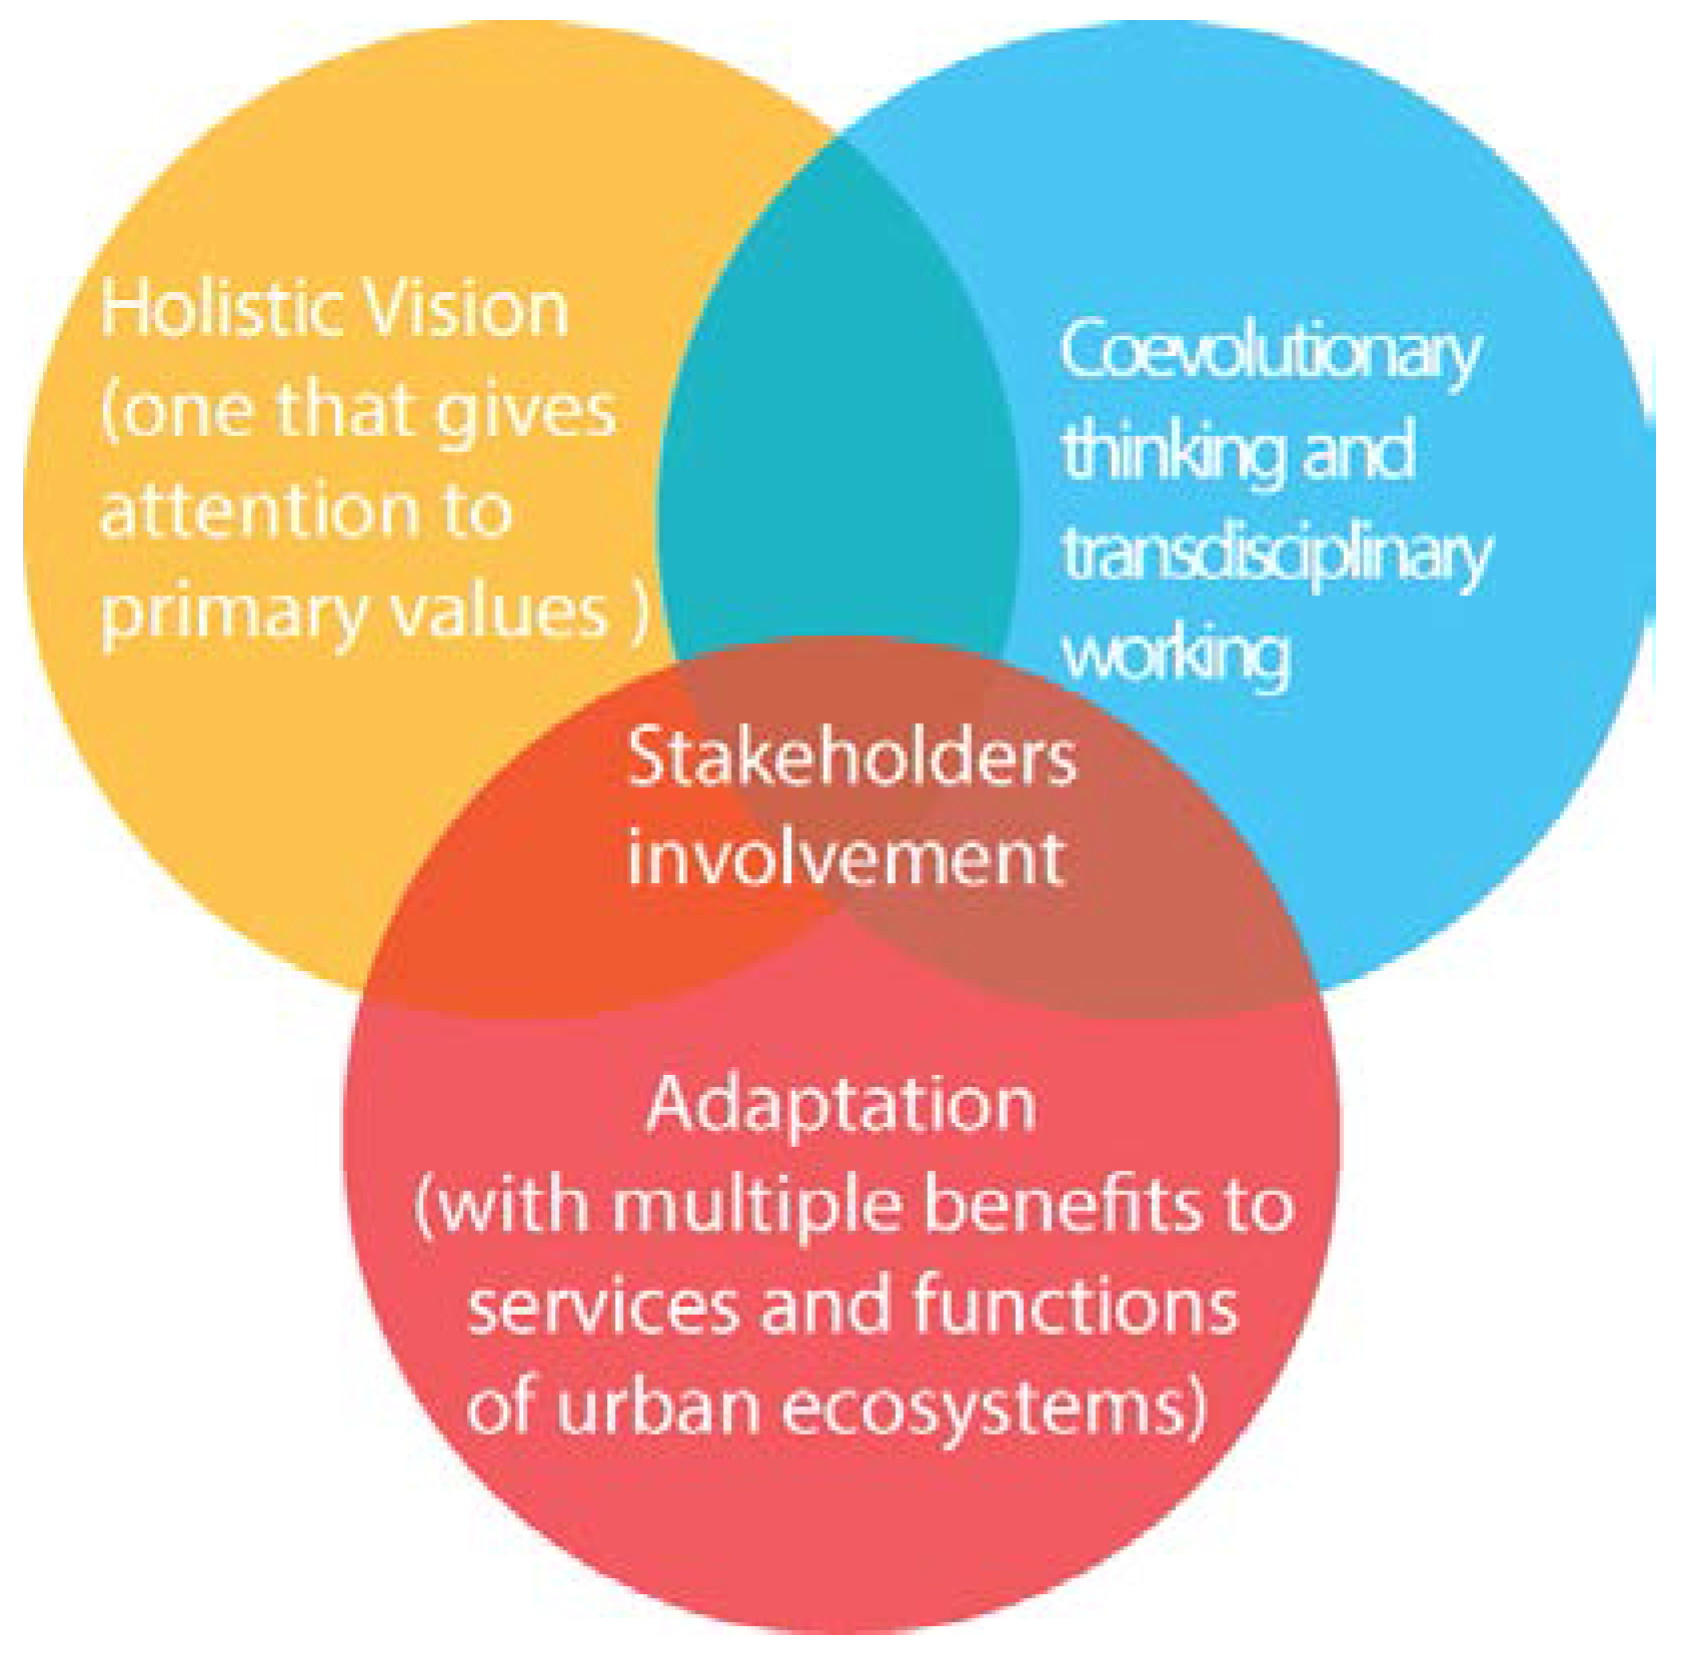
  • Adopts a holistic vision—one that gives a more profound attention to primary values (i.e., values that concern human well-being, culture, ethics, ecosystems functioning, etc.).
  • Undertakes a transdisciplinary way of working to gain an understanding of the coevolving processes between nature, society and technology—one that transcends the boundaries of scientific disciplines by bringing together humanities, science and technology.
  • Aims towards selection and design of resilient and adaptive measures and policies—one that is not only directed towards single benefits but also towards multiple benefits to services and functions of urban ecosystems while being flexible in response to actual or changing expectations in climate or other drivers of risk.
  • Enables active stakeholder participation—one that brings together individuals and key organisations who share an interest in, and responsibility for, solving problems throughout the entire risk governance process.
The present paper describes an attempt to incorporate the principles of ecosystem services into the practical methodological framework that combines ecosystem services with cost-benefit analysis for the selection of flood protection measures in a cultural setting. The methodology developed is based on the use of quantitative and qualitative data and methods. The quantitative methods employ mathematical, probabilistic and monetary evaluation (hence, they are applied in hazard assessment through physically-based models and estimation of tangible damages), whereas qualitative methods employ perceptive, sensuous-intuitive and subjective methods for capturing stakeholders’ experiences and evidence (these are typically derived through interviews and consultations). The work described here demonstrates how a combination of quantitative and qualitative data and methods can be used in a complementary and transdisciplinary way of working. The work is demonstrated in a case study of Ayutthaya, Thailand.

2. The Methodological Framework

Figure 2 depicts the key steps of the methodological framework developed and used in the present work. The following steps are included within the framework: (1) Ecosystem services identification and valuation; (2) Evaluation of mitigation scenarios, hydrodynamic flood simulations; and cost-benefit valuation of mitigation measures; (3) Selection of measures; and (4) Development of the conceptual landscape layout plan.

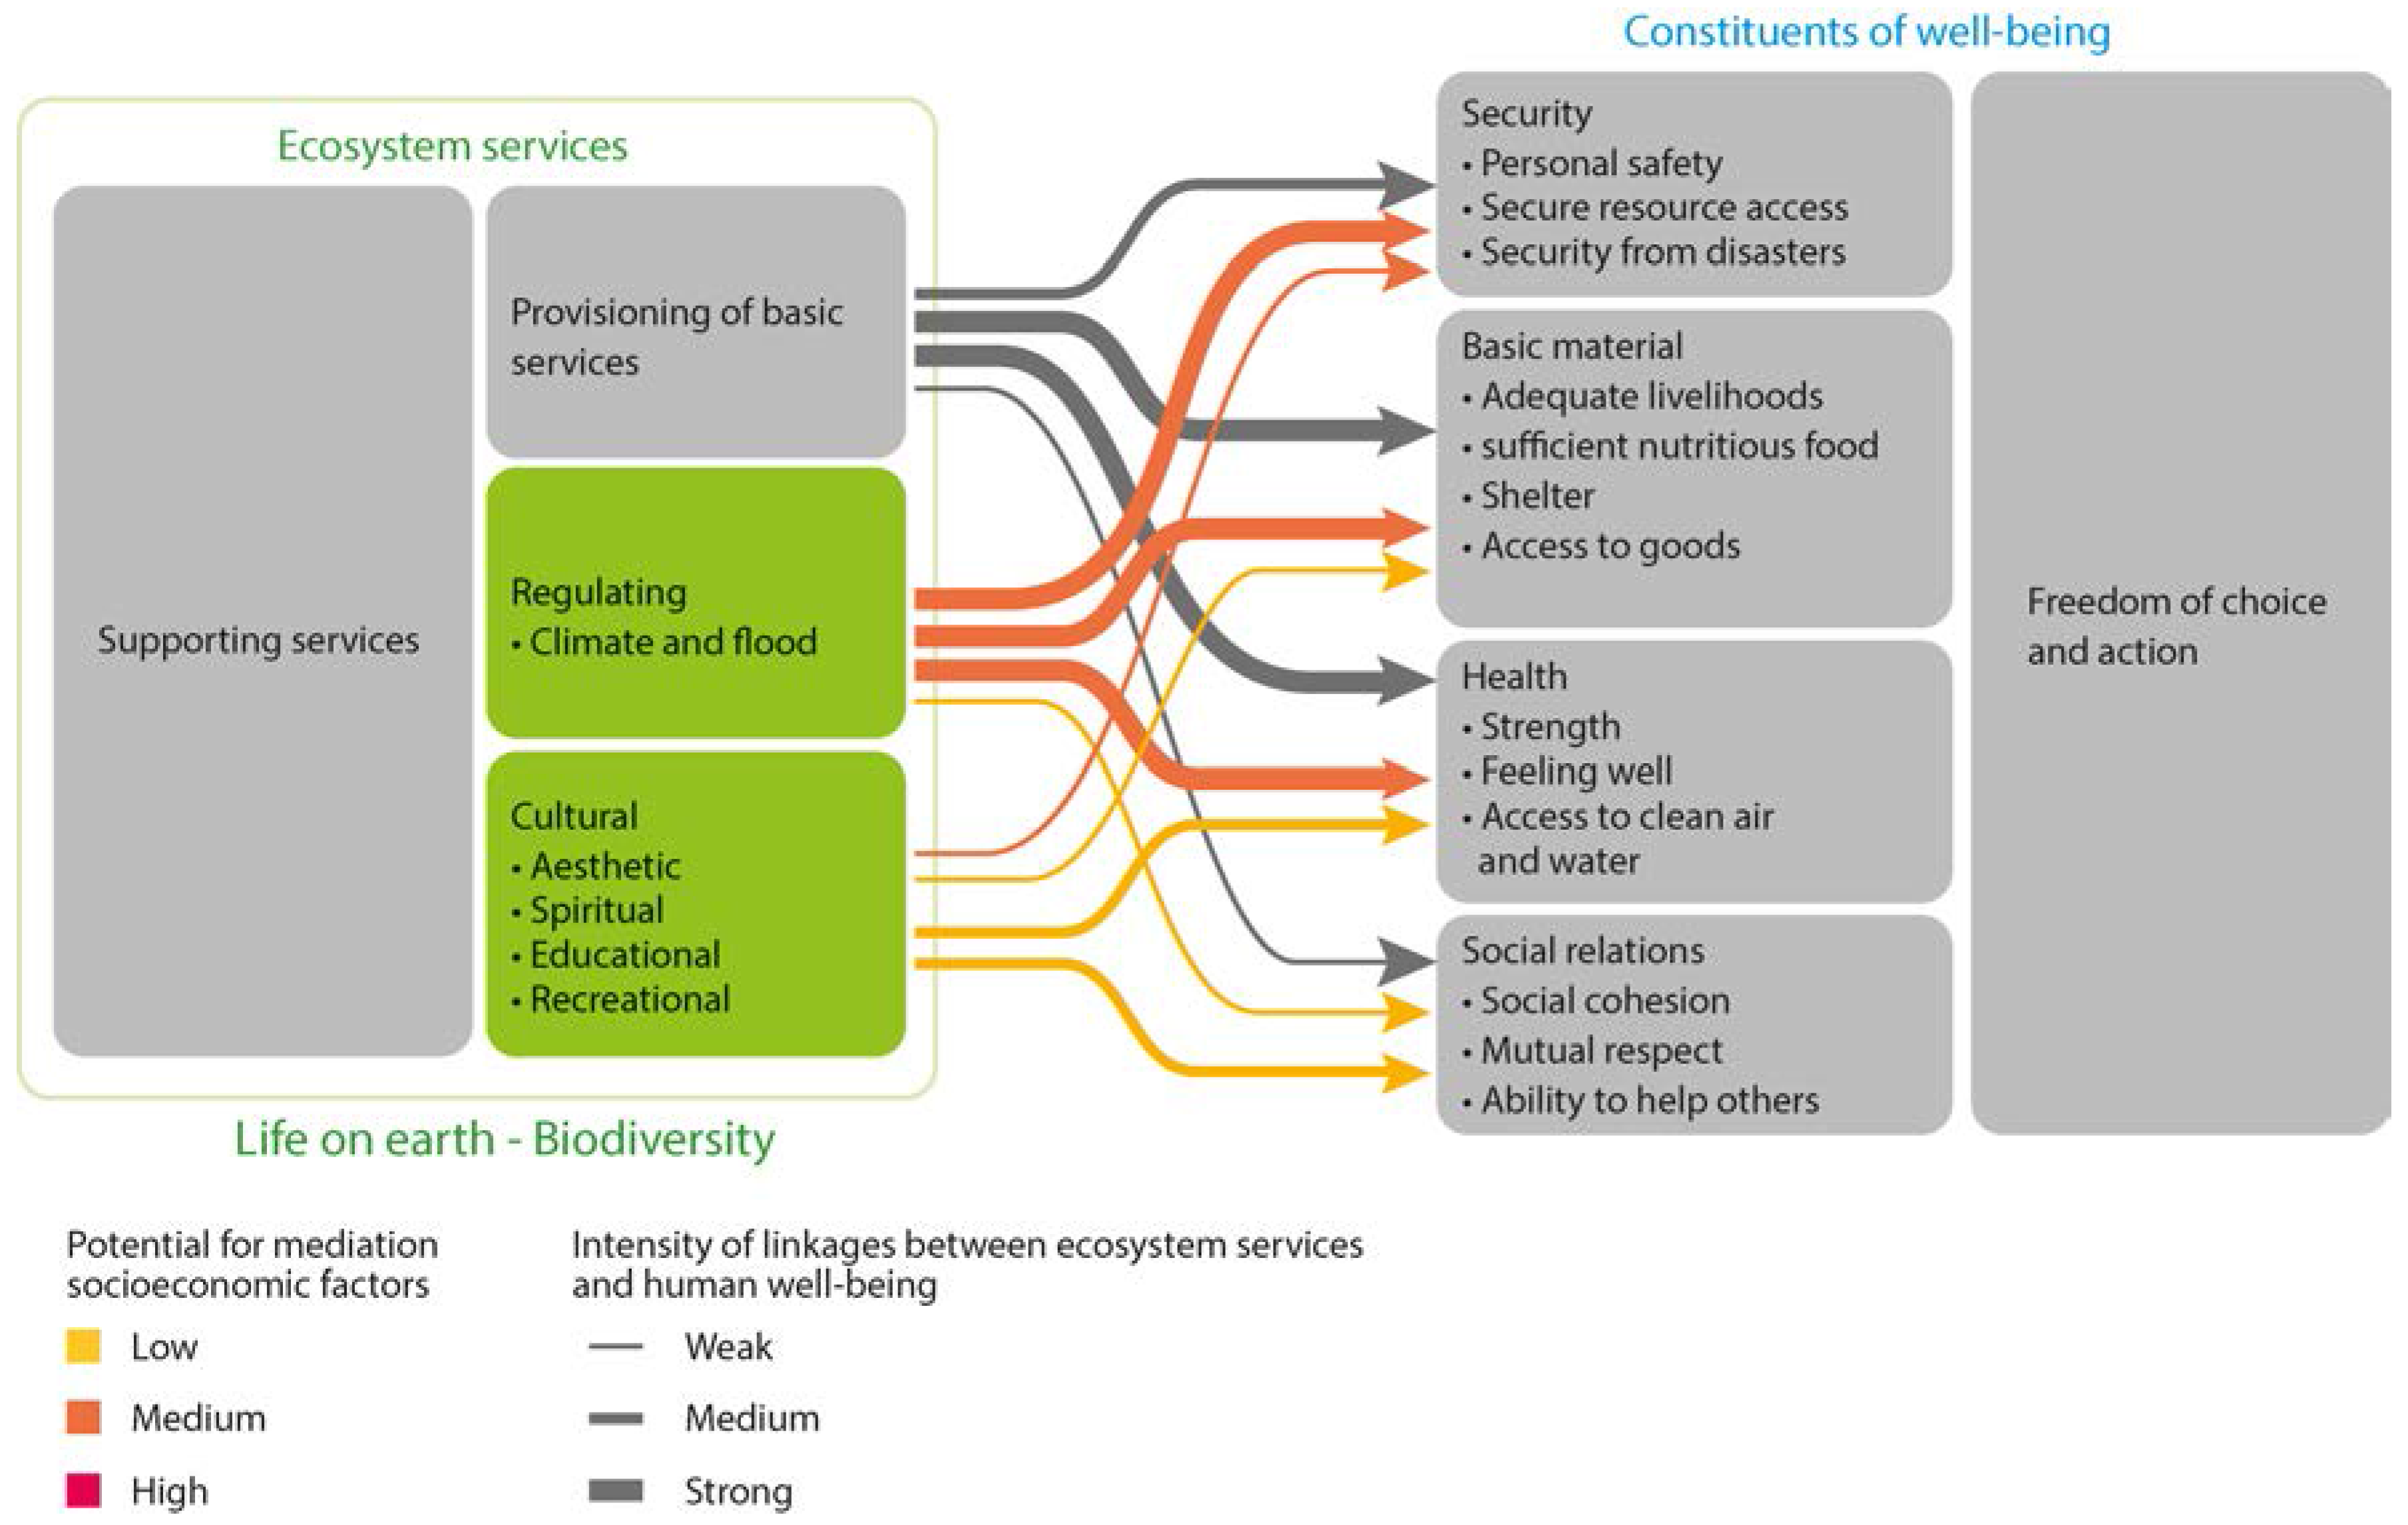
2.1. The Concept of Ecosystem Services

The concept of ecosystem services forms an important part in the present framework. It has been referred to as the benefits that humans derive from functioning ecosystems [18]. It is concerned with safeguarding of social and natural systems from hazards (e.g., floods), while promoting those primary values, and it necessitates a synergic relation between the flood-related activities (i.e., security) on one side and the delivery of ecosystem services on the other. The concept of ecosystem services provides a structured way of addressing and understanding the synergies, interactions, linkages, interdependencies and trade-offs between, social, technical and natural systems. It “separates” the world between ecosystem services and constituents of well-being (Figure 3).
Figure 3 illustrates the conceptual framework for ecosystem assessment that considers linkages between the following main components: ecosystems and their services (i.e., ecosystems and ecosystem services), human well-being and poverty reduction (ecosystem services and human well-being), and indirect and direct drivers of change (see also [19]). It also considers multiple temporal and spatial scales and integrates feedback loops between the components, thus allowing for a dynamic, or a holistic, perspective. By examining the environment through interactions and linkages, it enables a more effective way of identifying how changes in ecosystems can influence human well-being, where the security from flood disasters is just one aspect, and provides information in a form that decision-makers can weigh alongside other information such as social, ethical, cultural, technical and economic.
As depicted in Figure 3, the concept of ecosystem services can be classified into four distinct categories: provisioning services, regulating services, habitat or supporting services and cultural services. The present work deals with ecosystem services that mainly originate from the cultural and regulating categories, namely:
  • Regulating Services—flood disturbance regulation, water regulation,
  • Cultural Services—aesthetic, recreation and tourism, scientific and educational, spiritual and religious.

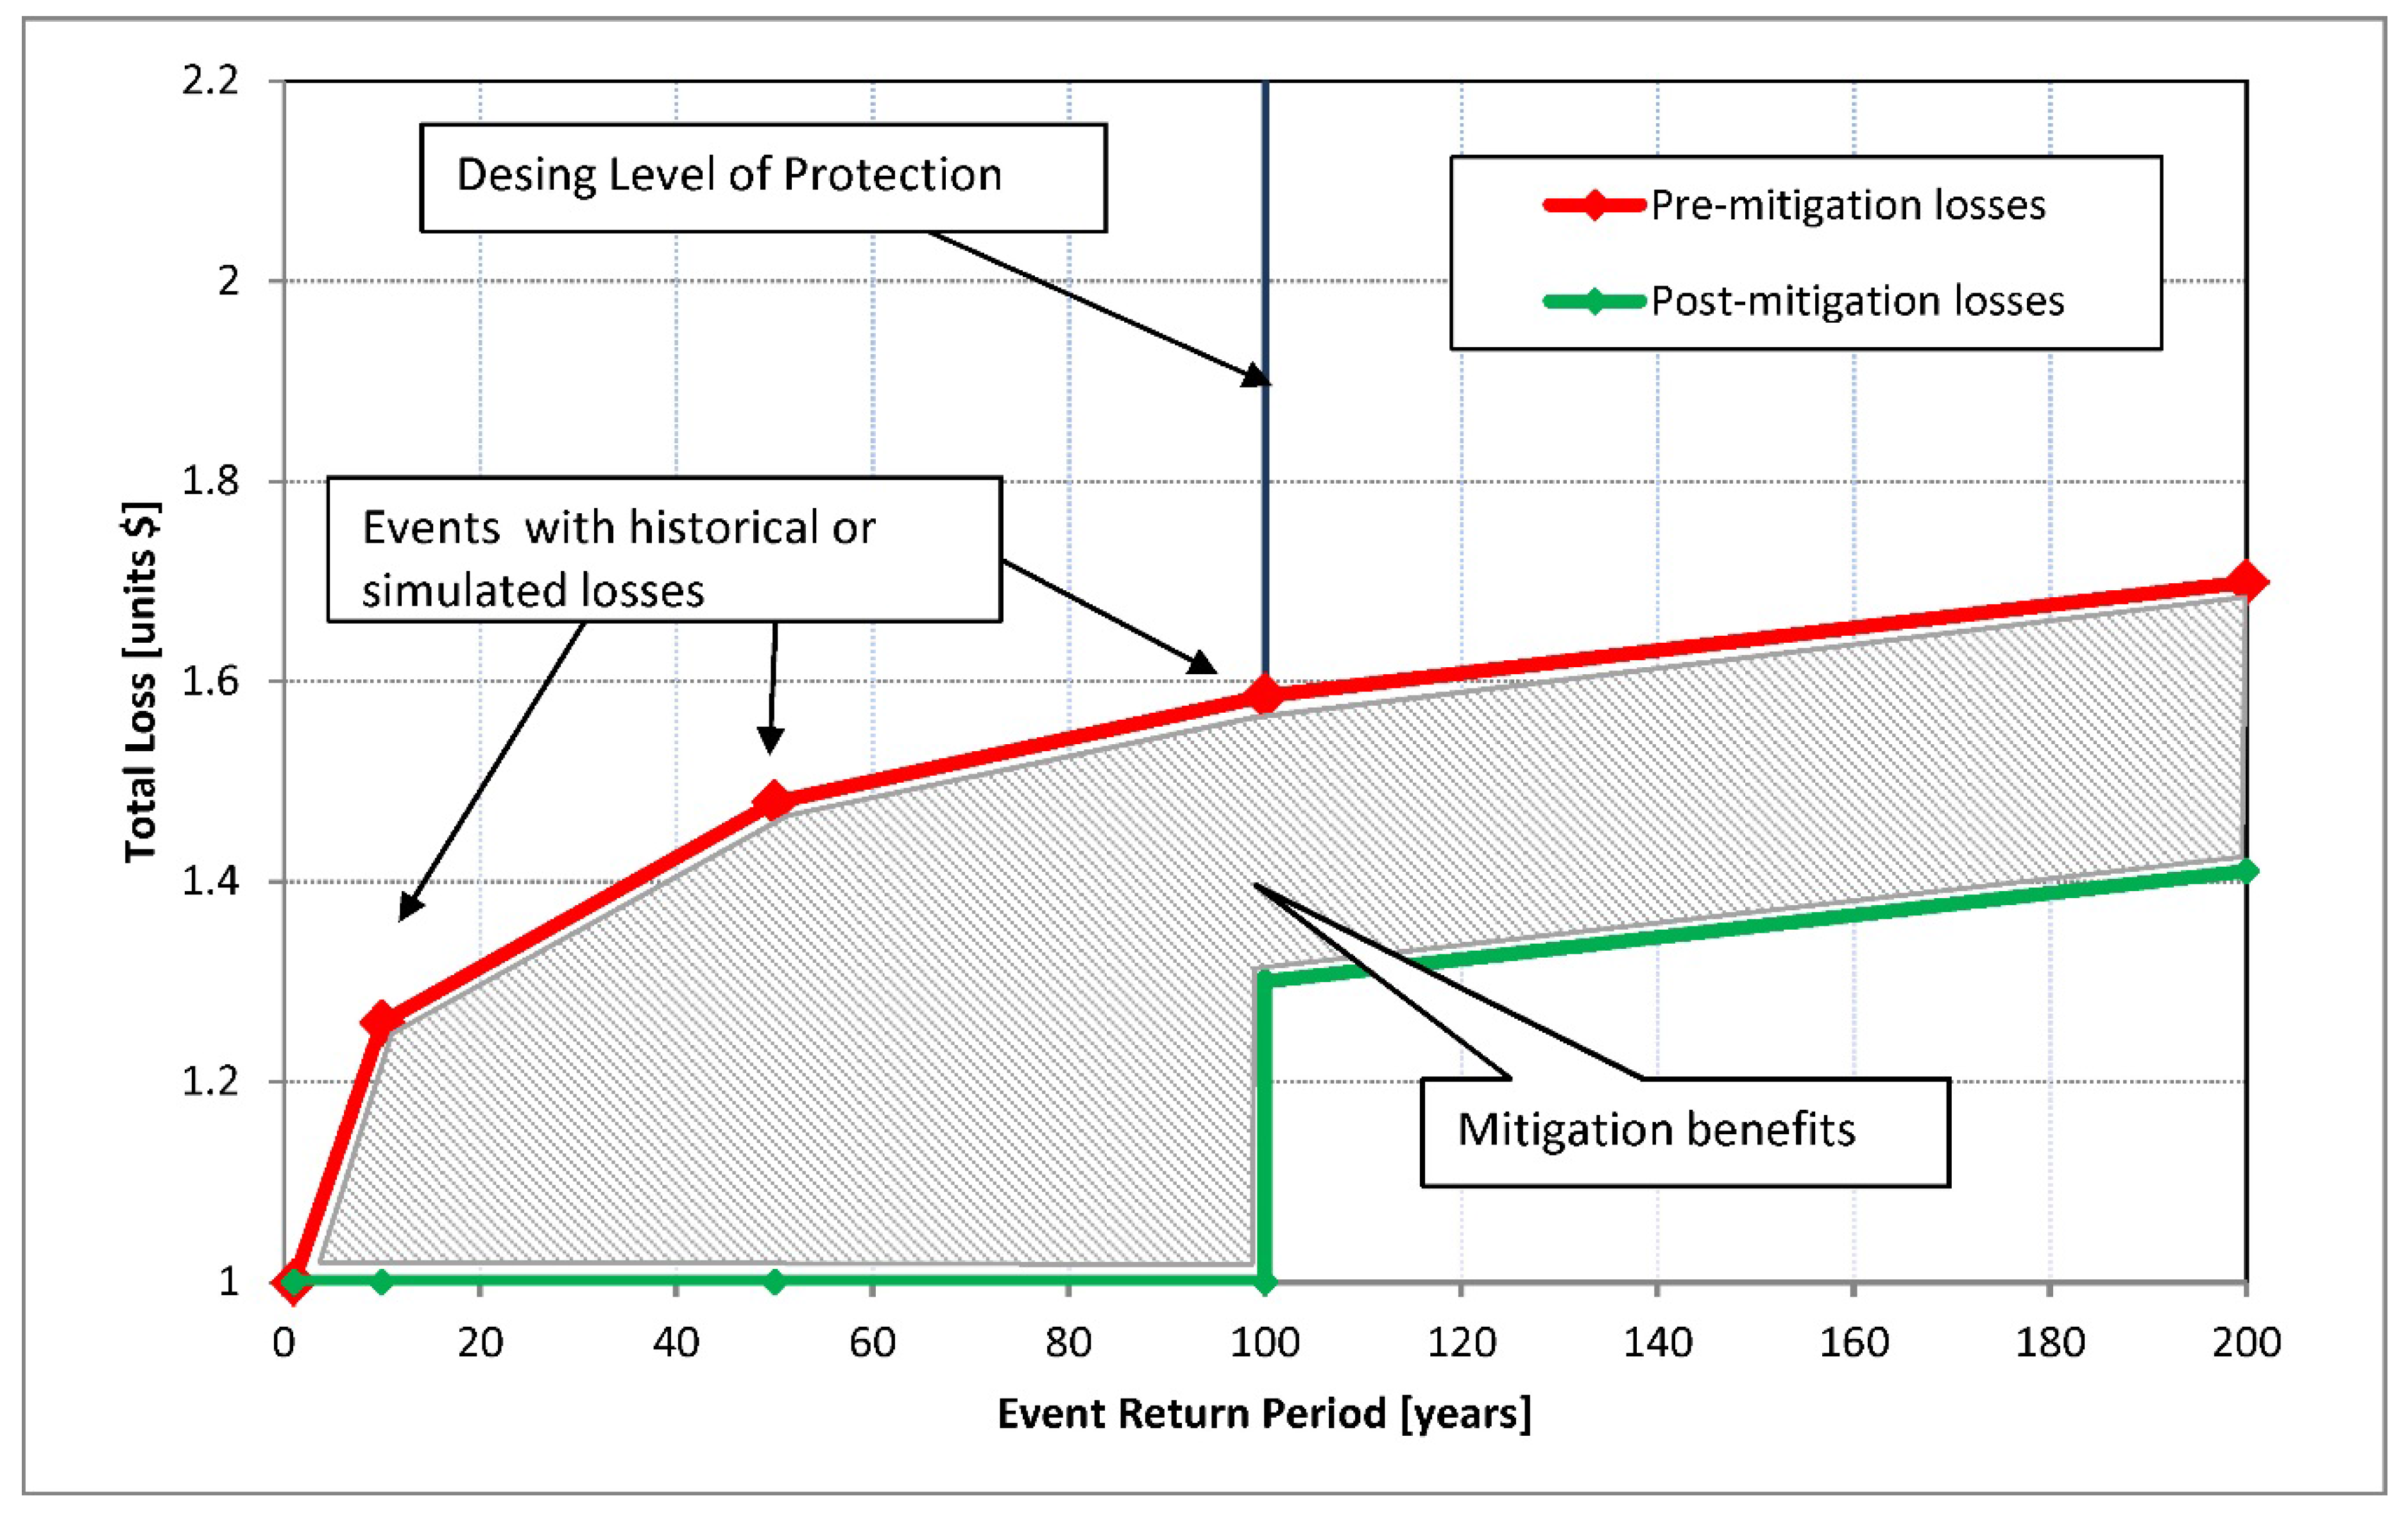
2.2. The Concept of Cost-Benefit Analysis

The Cost-Benefit Analysis (CBA, used interchangeably with “benefit-cost analysis” in the literature and practice) is a concept routinely used in engineering for screening and ranking of the proposed projects by their economic efficiency. In practice, the proof of a project’s economic viability is typically evaluated using this technique. The quantitative indicator is a Benefit-Cost Ratio (BCR), which, within a mitigation project framework, can be defined in a simplified manner as:
B C R = L o s s P r e L o s s P o s t C o s t s
where:
  • L o s s P r e denotes losses recorded for base conditions (before mitigation),
  • L o s s P o s t denotes residual losses, recorded with mitigation in place, and
  • C o s t s denotes the sum of all project and maintenance costs, accumulated over the life of project.
The numerator in the above equation represents potential losses that can avoided due to mitigation, which are also known as “mitigation benefits”. Figure 4 depicts the basic concept of mitigation benefits, which is illustrated as a highlighted area between pre- and post-mitigation damage curves. While the mitigation project usually aims to eliminate most of the losses up to a design level of protection, the more benefits that can be realised, the stronger the economic viability of the project.
While the analysis of project costs can be a relatively straightforward task, the definition and quantification of losses is a much more complex part, specifically when the project is placed within the framework of ecosystem services. Traditionally, losses (or damages) can be broadly categorized as follows:
Direct Losses
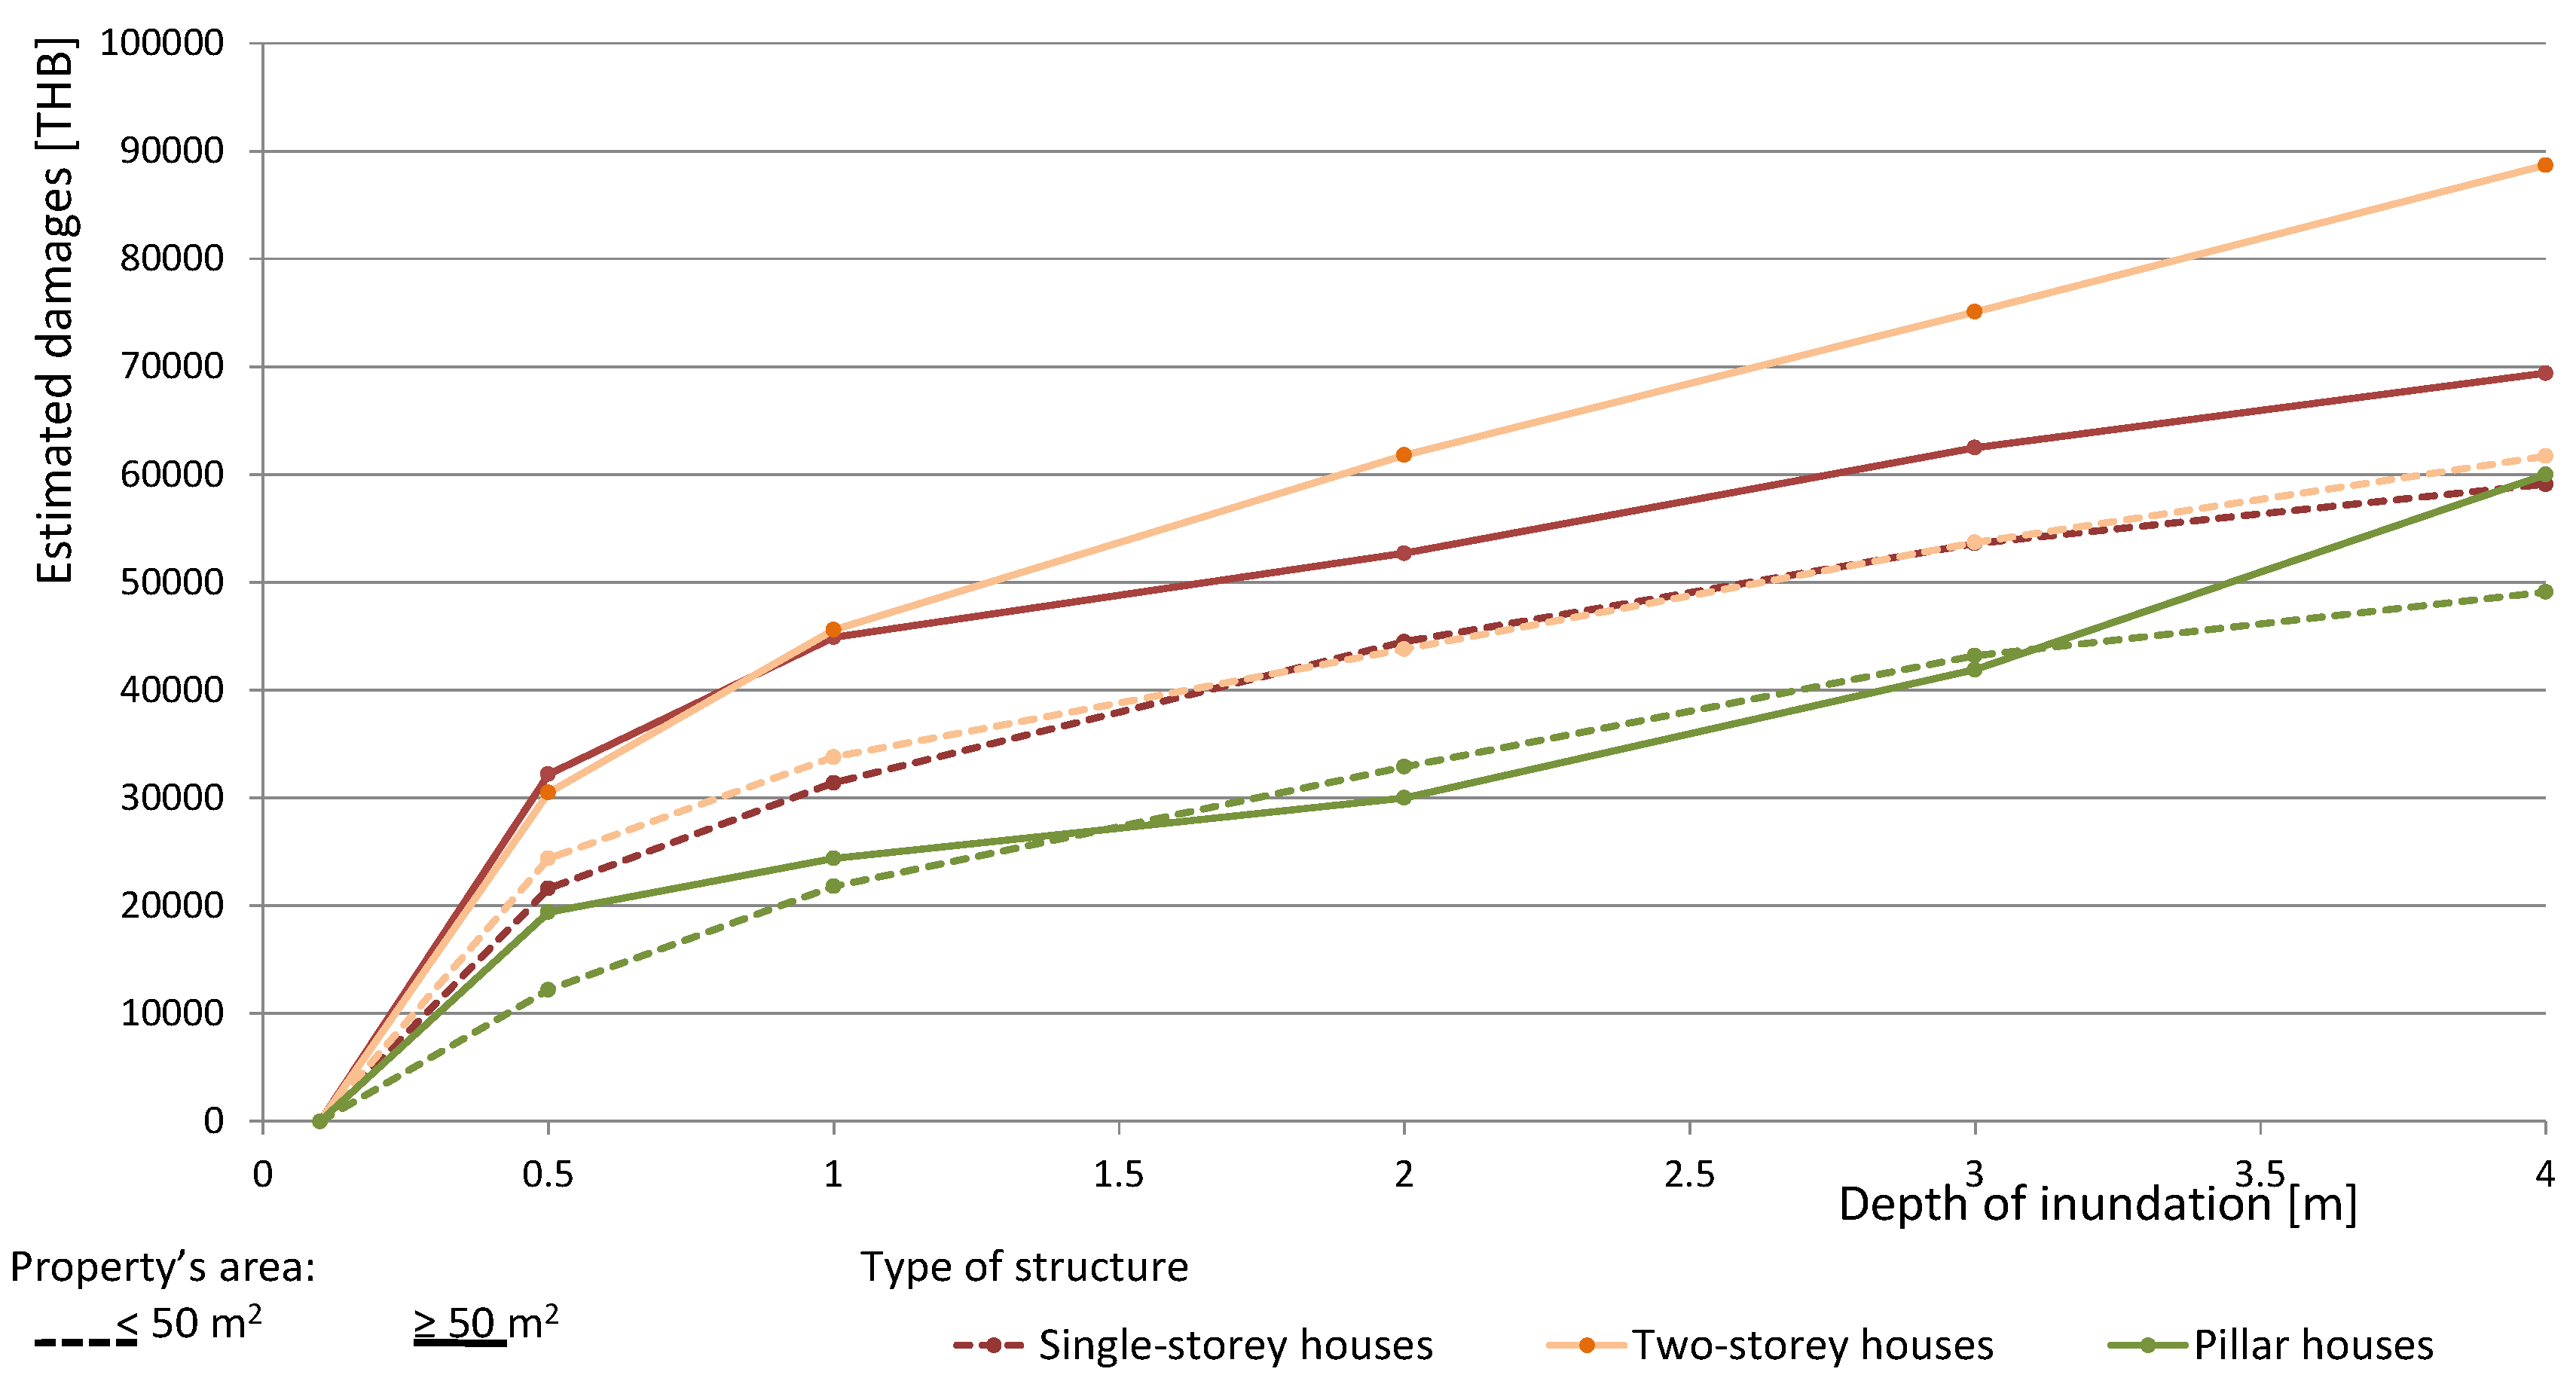
  • Physical Damages: buildings, contents, infrastructure, site contamination, vehicles, equipment, landscaping;
  • Emergency Management: costs for emergency operations centers, evacuations and rescues, security, temporary protective measures, and debris removal and cleanup;
Indirect Losses
  • Loss of Function: functional down time, lost wages, loss of public services, loss of emergency services;
  • Casualties: deaths, injuries, and illnesses.
With the introduction of the ecosystem services concept, the potential for recognizing new mitigation benefits (as a function of avoided losses) can be increased substantially, provided that the pertinent ecosystem services can be valued adequately. Within the ecosystems, there are generally three valuation domains—ecological, socio-cultural and economic (see, for example, [20,21]). Within the urban areas with cultural assets, the ecological domain does not play a significant role, while the role of the other two domains becomes more prominent.
Within the socio-cultural and economic domains, the services with the highest potential of mitigation benefits are the cultural services (where the socio-cultural input from stakeholders plays an important aspect) and the regulation services (where the proposed flood mitigation alternatives are the direct drivers of benefits).
In conjunction with the engineering design, optimization and modelling for viable mitigation scenarios, CBA (or BCA) is a principal step in trade-off analysis, aimed at technical and economic evaluation of mitigation alternatives.

3. The Notion of Multifunctionality

There is a strong connection between ecosystem services and multifunctional land use. “Multifunctionality” has become a popular term in landscape design and planning. It has been particularly influential in Europe, and it has been associated with protective and creative measures promoted through the European Landscape Convention ([22]) and with nature-based solutions (green infrastructure) through the European Environment Agency ([23]). To respond to some of the great challenges such as the urbanization growth (e.g., [24,25]), inefficient drainage (and flood protection) systems, lack of biodiversity and climate change (e.g., [26]), it is required to change not only the thinking in terms of traditional flood management, which places a greater focus on grey infrastructure (pipes, concrete channels and other hard core engineering measures), but also the traditional landscape planning practice and much more on integration between the two, resulting in multifunctional green infrastructure approach (see also [14]).
According to [27], multifunctional land-use is achieved if at least one of the following four conditions is met: (1) increase in the efficiency of land-use (intensification of land use); (2) interweaving of land-use (which they define as the use of the same area for several functions); (3) use of the third dimension of the land (i.e., vertical space such as the below and/or above ground level along with the surface area); and (4) use of the fourth dimension of the land (i.e., over a certain time frame). Therefore, it is important to consider not only the number of functions (diversity) but also the use of vertical space and time in developing multifunctional landscapes. Given the importance of temporal analysis, the use of one- and two-dimensional numerical hydrodynamic models has proved to be invaluable (e.g., [28,29,30]). However, there are numerous issues associated with data, models and mapping of results and so they require careful consideration (see, for example, [31,32,33,34,35,36,37,38,39,40,41,42]).
In [43], the authors gave a definition of multifunctional landscape as a space at which different material processes in nature and society can take place simultaneously. According to them, multifunctionality in landscapes relates to the co-existence of different spheres such as ecology, economics, culture, history and aesthetics.
In flood risk management, open detention basins (with flood detention as a primary function) offer a great potential for multifunctional use during dry weather. For this reason, municipalities in many countries have been implementing floodplain or detention basins for the purpose of achieving multifunctional use during dry weather ([44]). The notion of multifunctionality also has been taken into consideration as a criteria for the selection of measures within the present framework.

4. Demonstration of the Framework

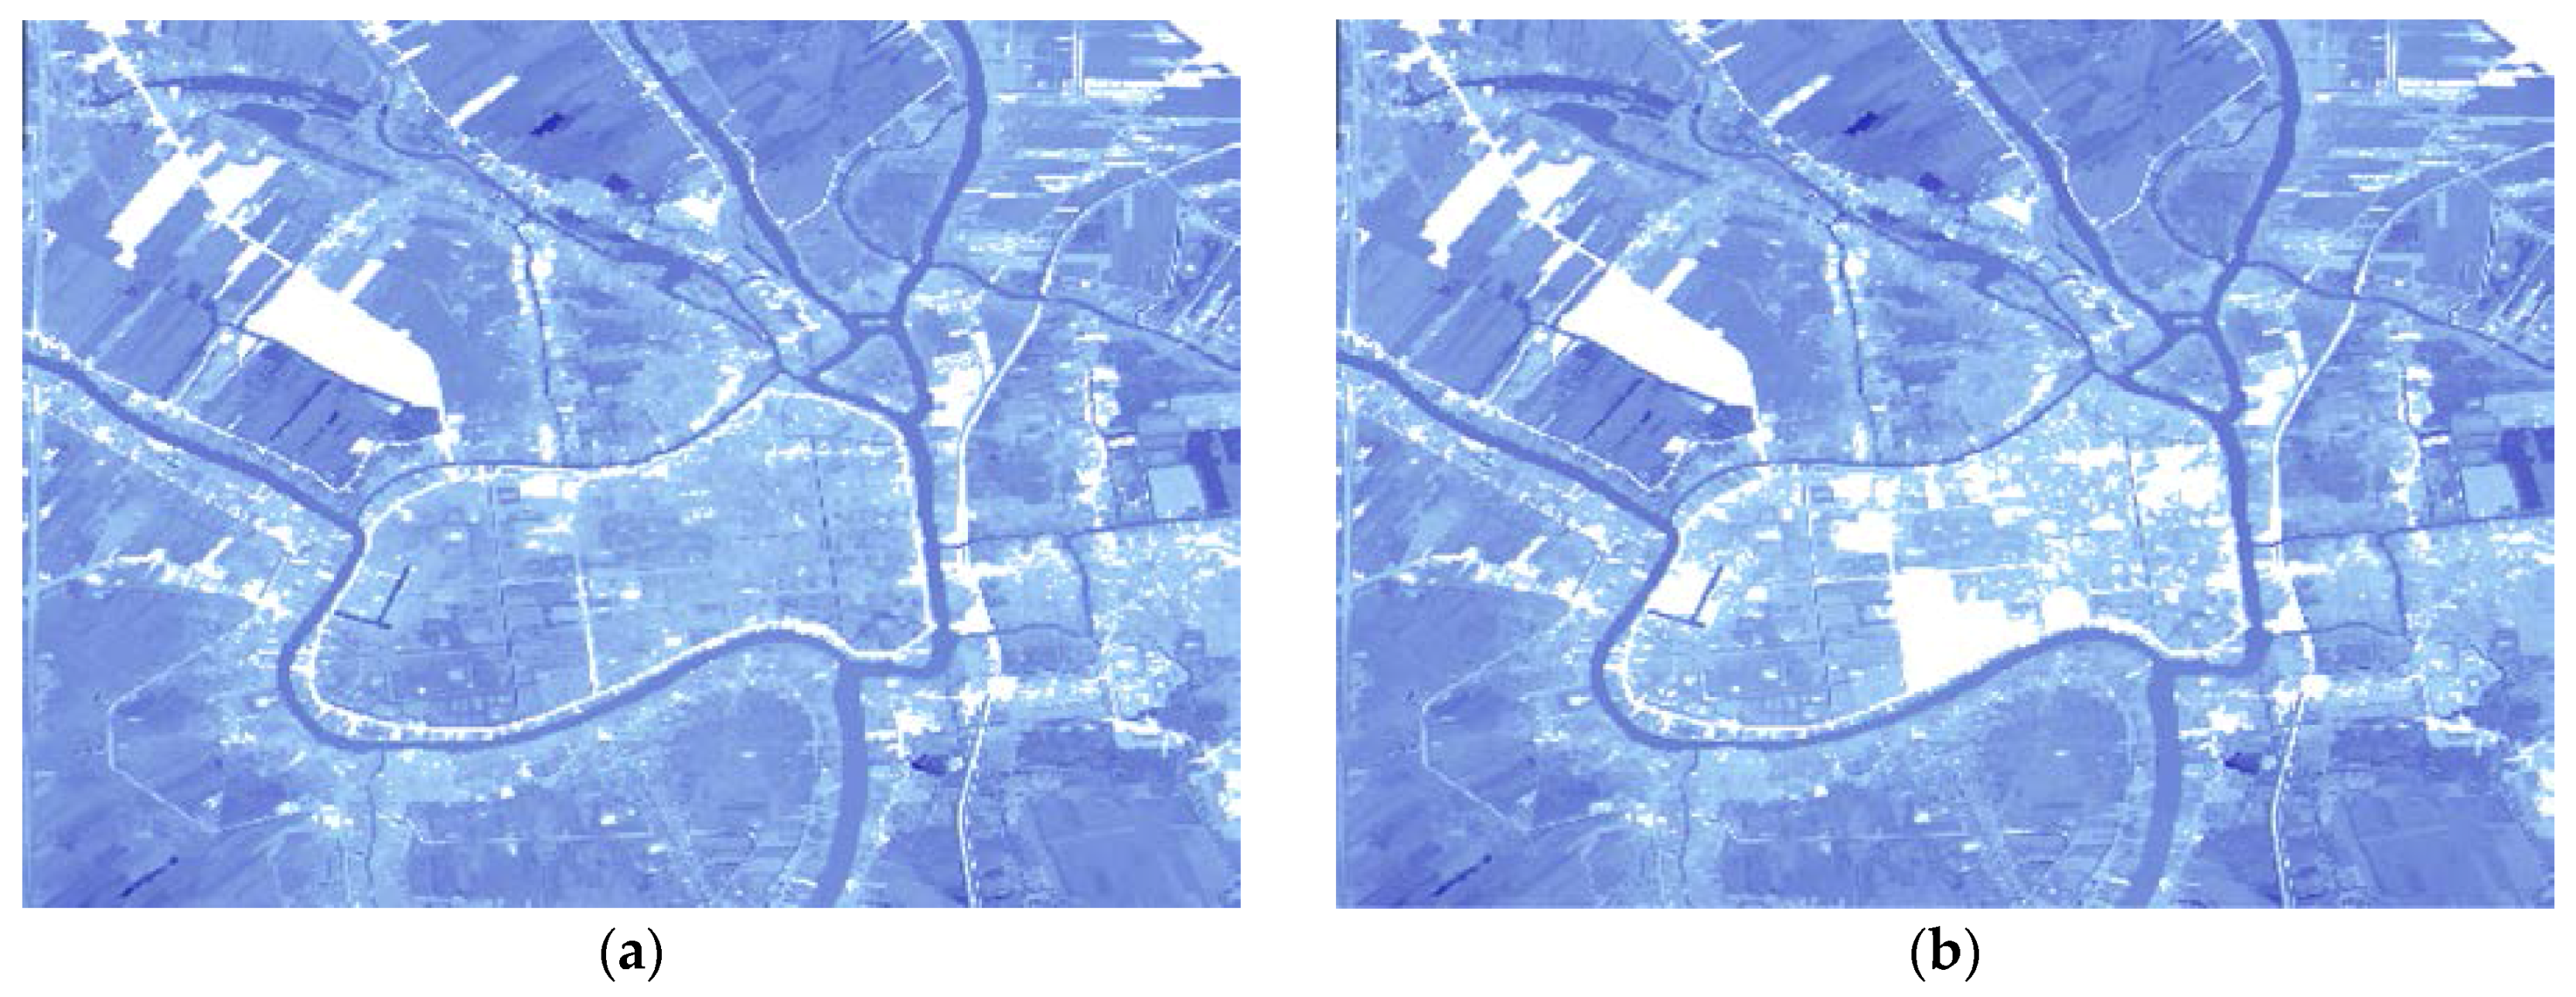
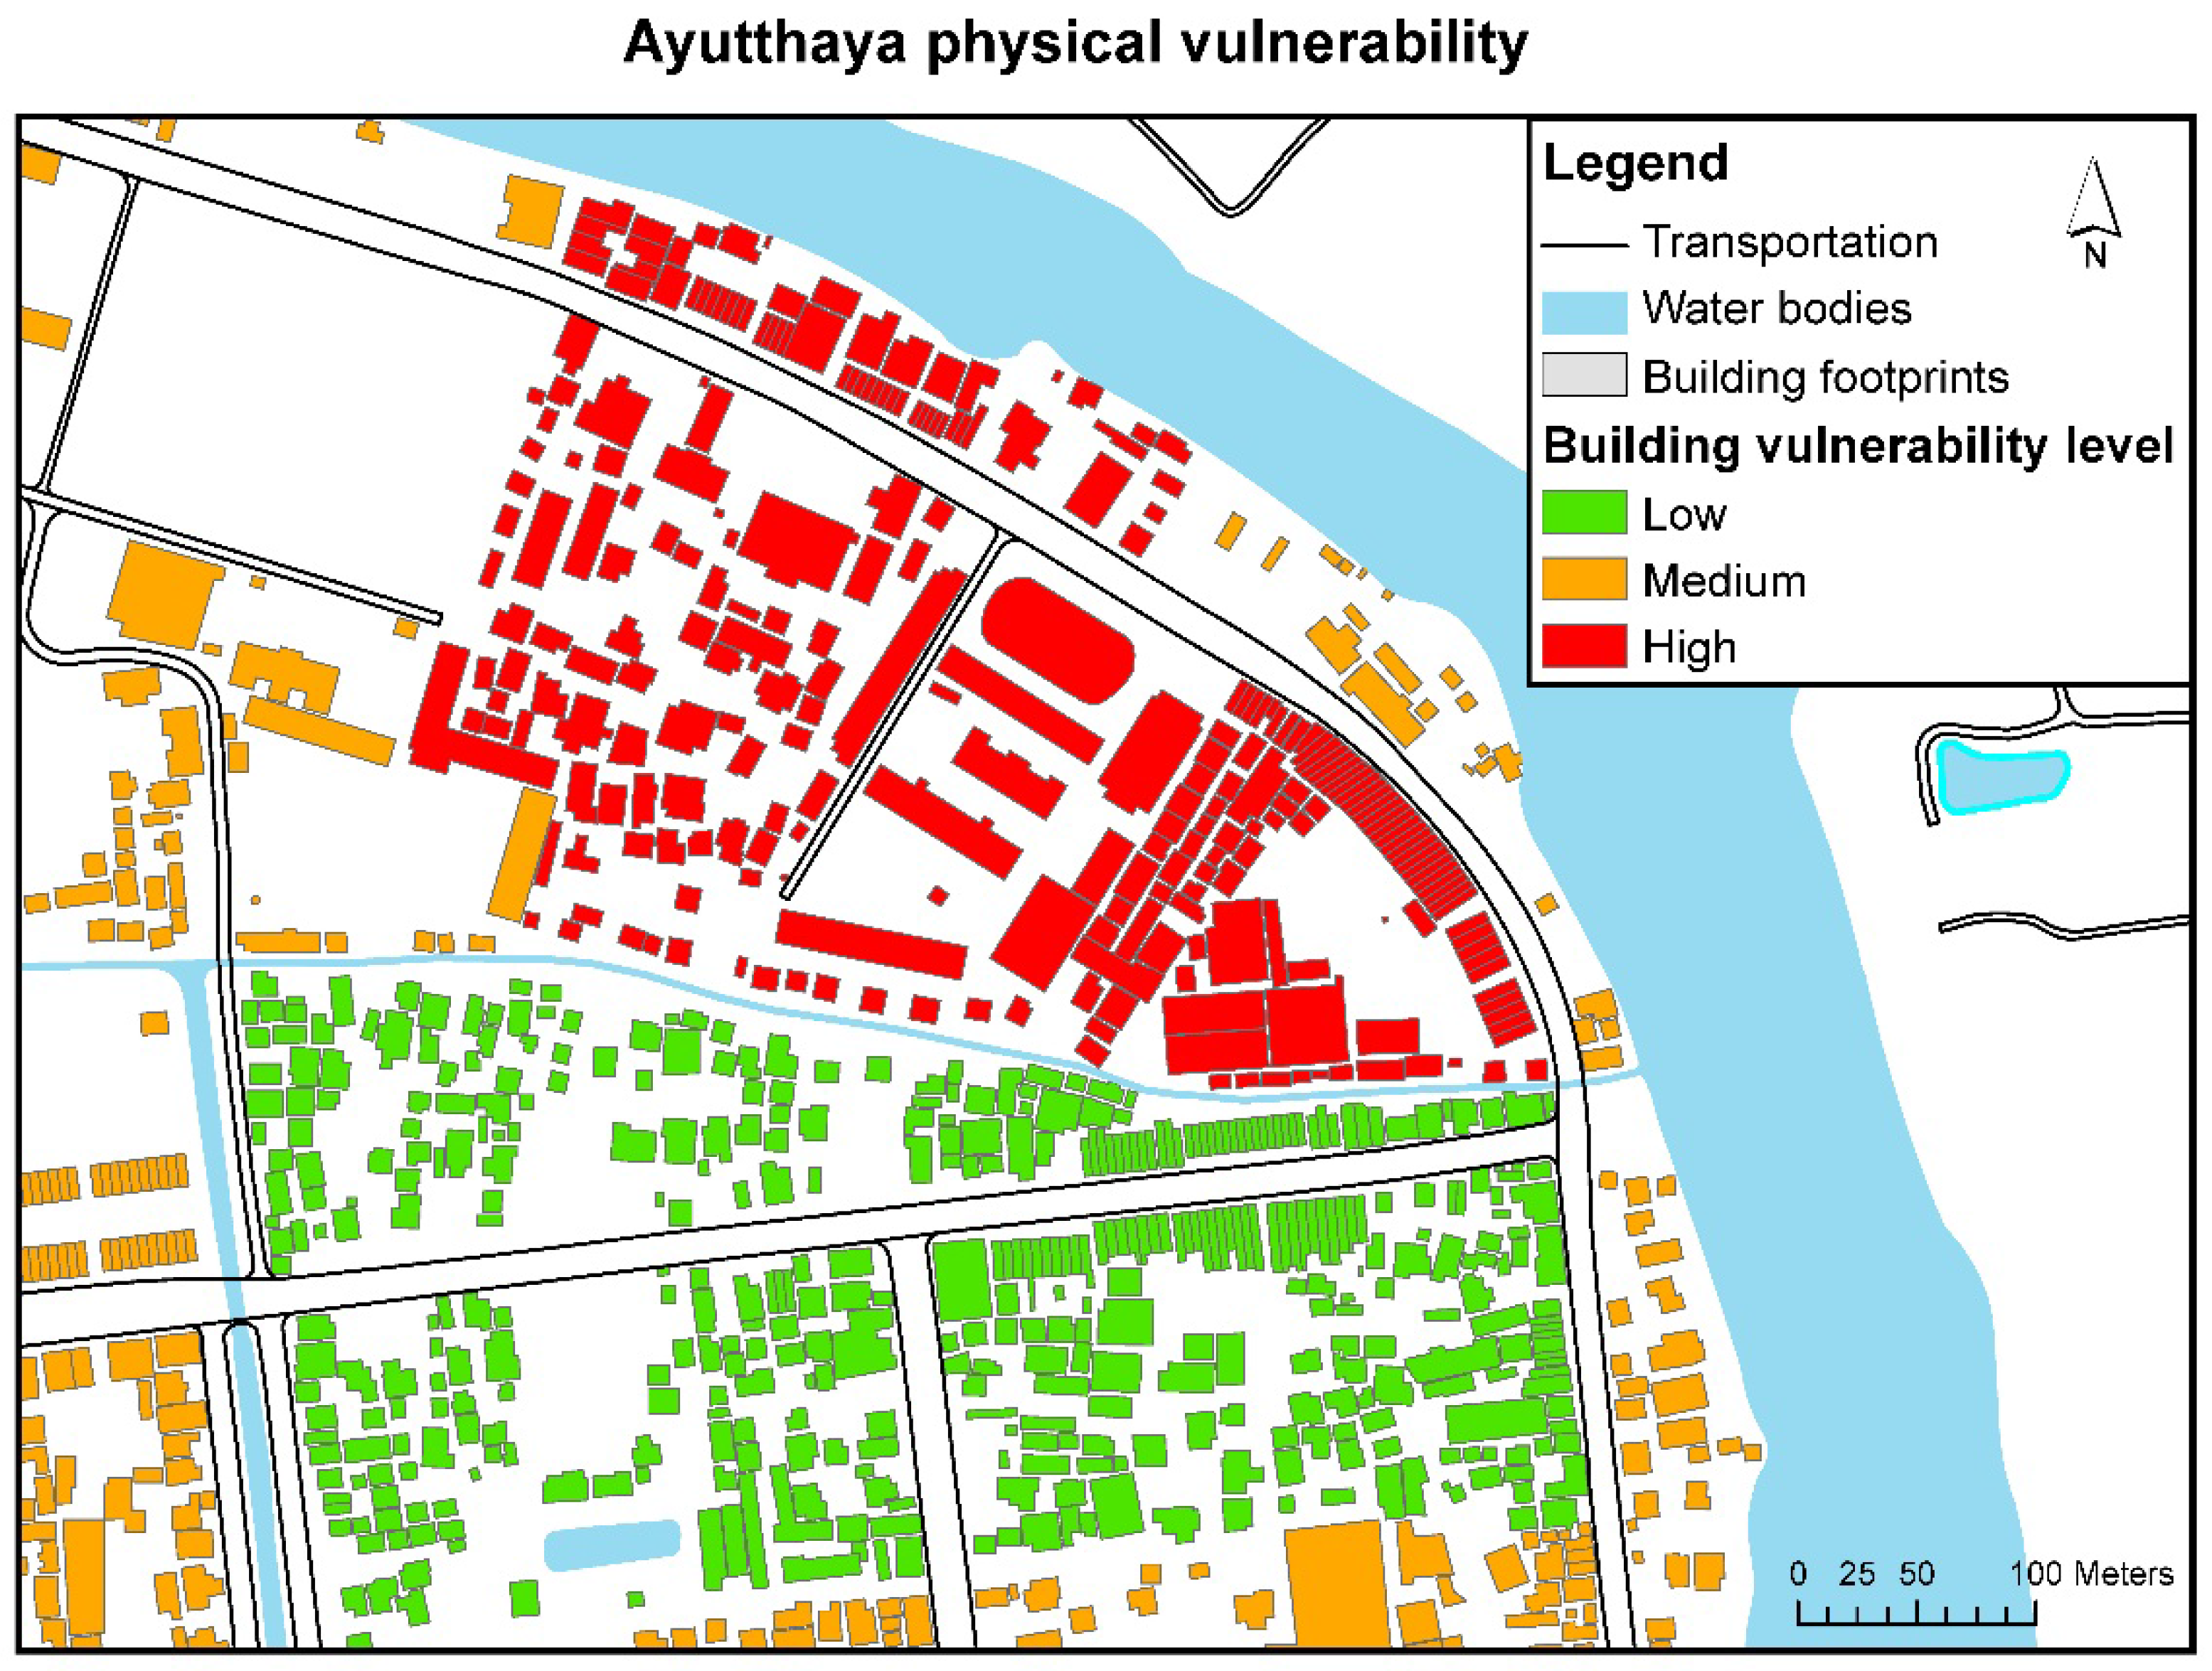
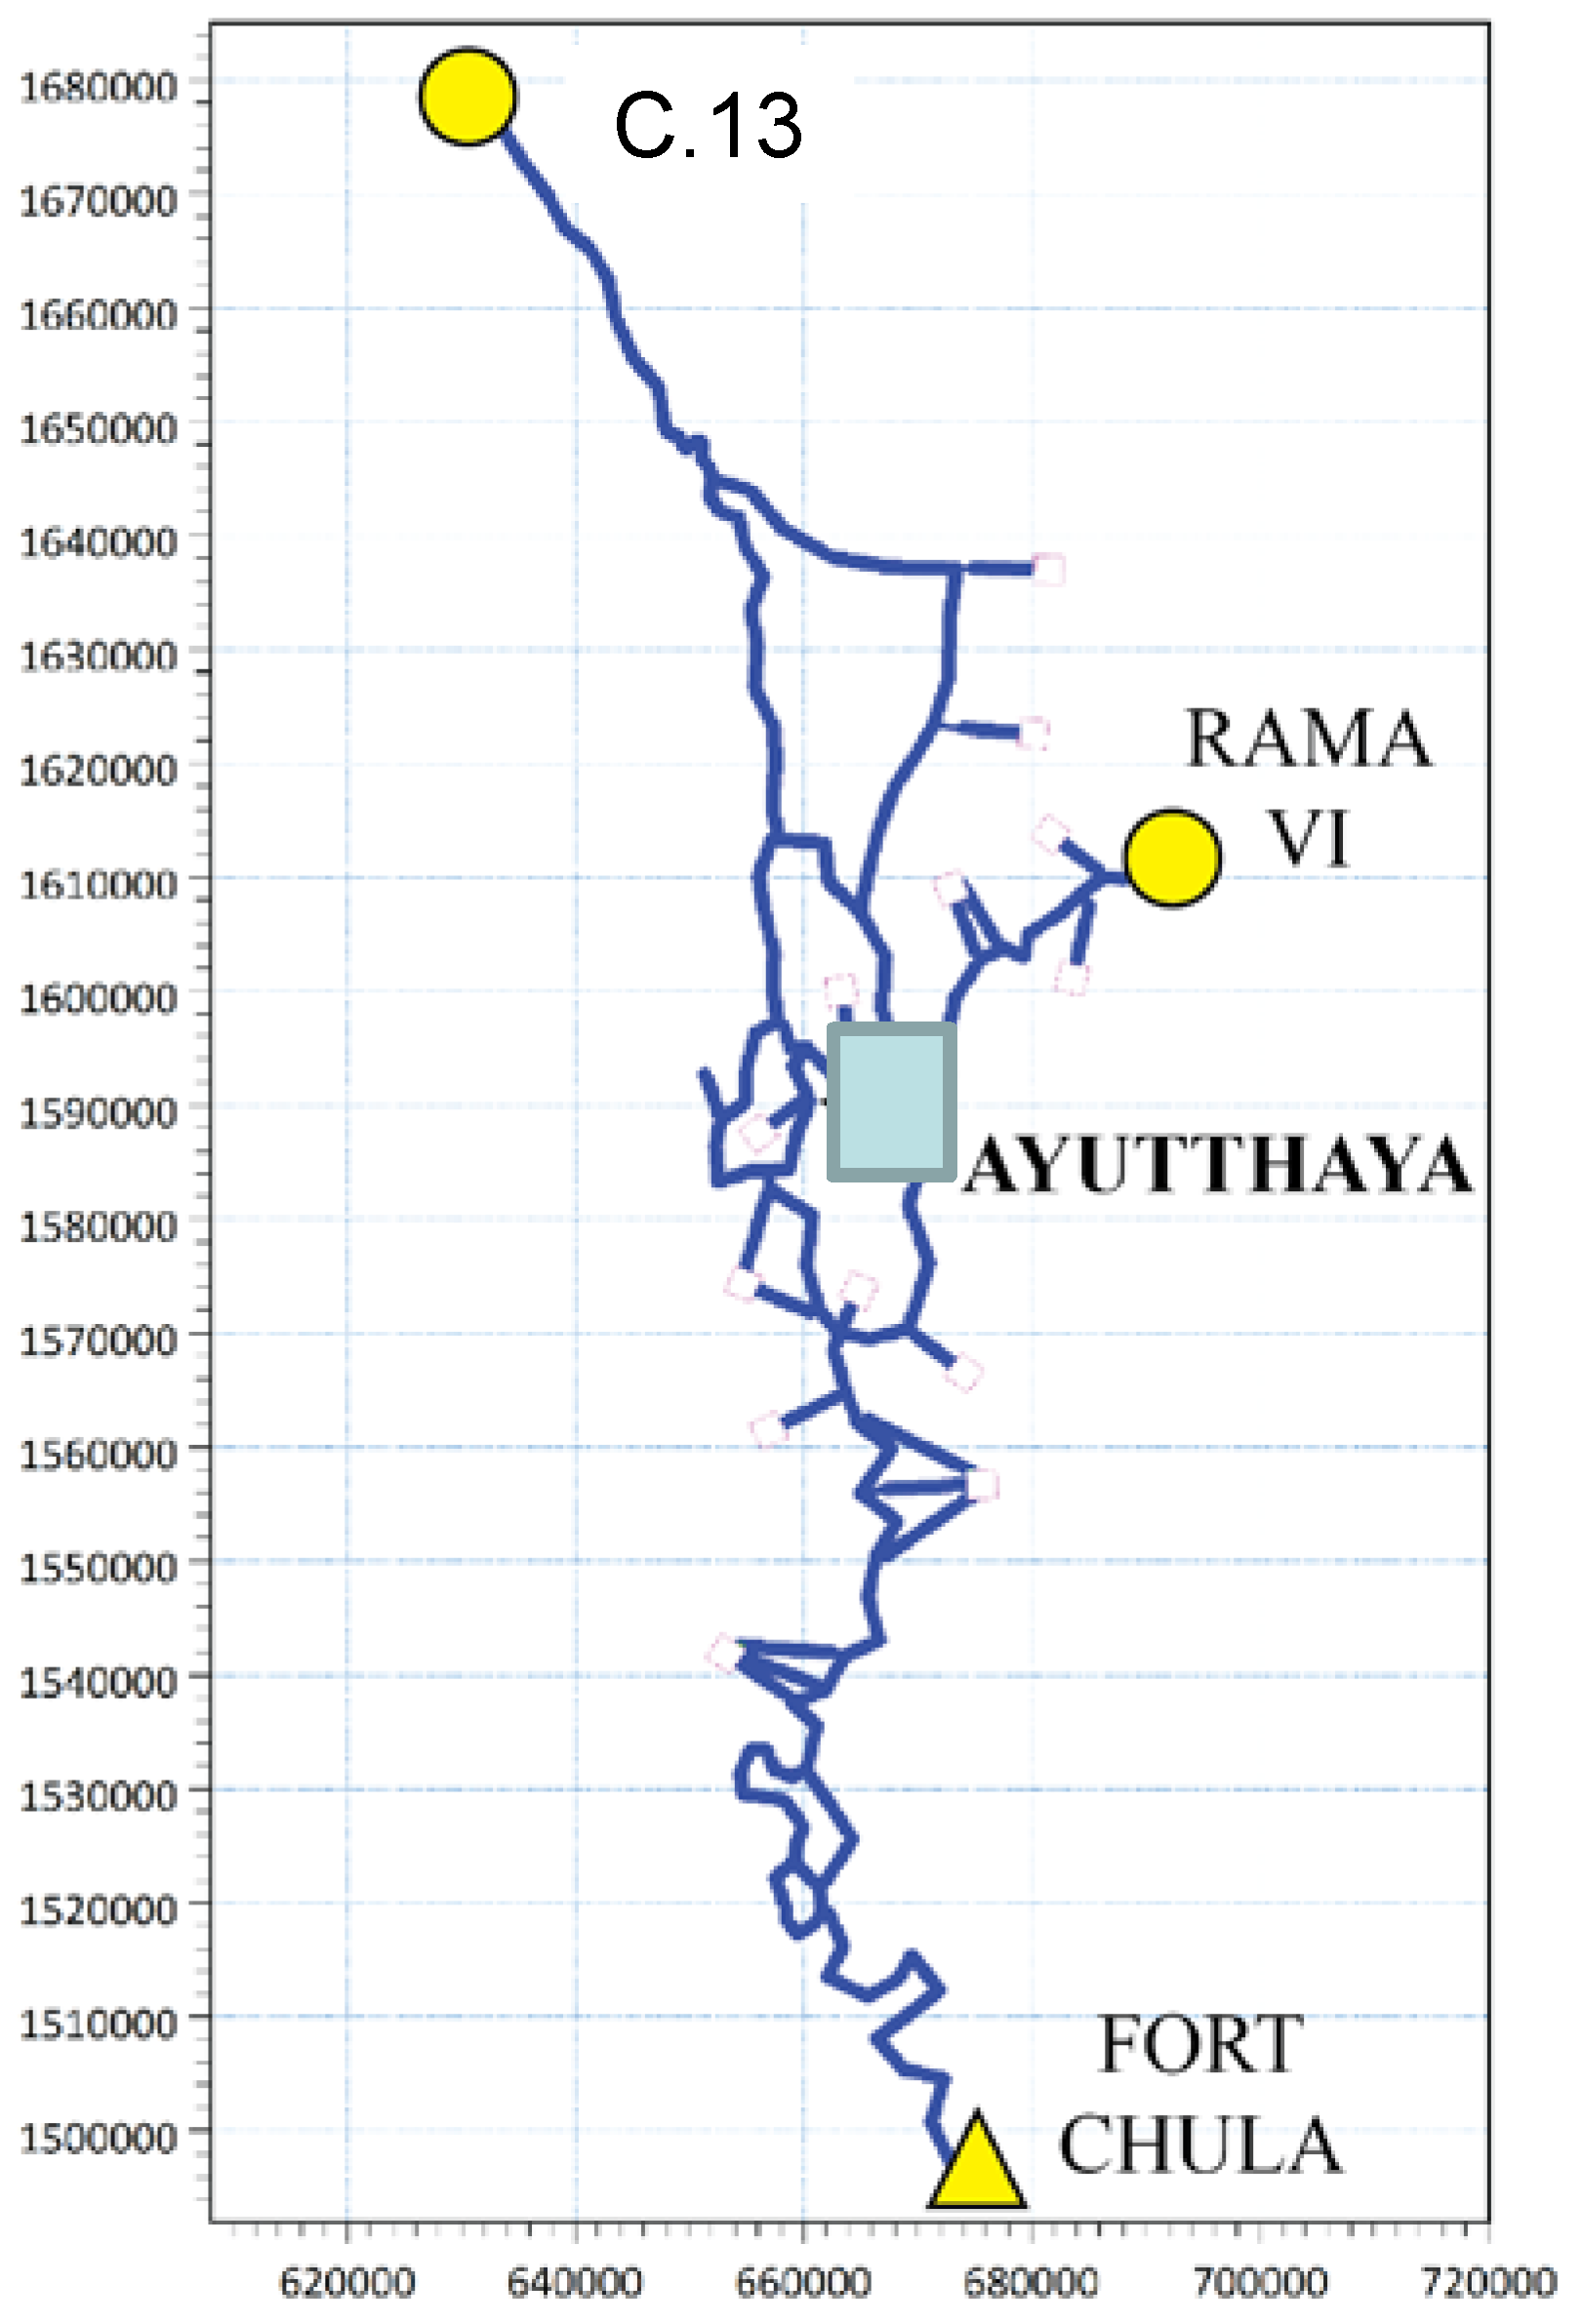
4.1. Case Study Area

The case study area used in the present work is Koh Mueng in Phra Nakorn Si Ayutthaya province, which is about 80 km north of Bangkok, the capital city of Thailand. The precise geographical location is 14°21′08″ N latitude and 100°33′38″ E longtitude. It has an area of 7 km2 and is surrounded with three rivers, namely Chao Phraya River, Pasak River, and Lop Buri River. The land-use is primarily residential with some minor commercial activities. Since it is surrounded by three rivers, Koh Mueng is also called Ayutthaya City Island. Very often, this area has been subject to flood incidents that were primarily due to high water levels in three rivers (i.e., fluvial flooding). There are also examples of incidents where the flooding was caused by heavy rainfall, as ground level is relatively low (i.e., pluvial flooding), resulting in a long inundation ([45]). The flood protection of the area consists of a dyke at +5.30 m mean sea level (MSL) as a primary measure. Despite this dyke, the Ayutthaya Island was greatly affected during the severe flood in 2011, estimated to have an approximately 100-year return interval.
The lowest area is situated on the southwest of the Island, which has an elevation at about 2.5 m MSL, where the flood water accumulates during flood events. The Historic City of Ayutthaya was inscribed on the World Heritage List according to criterion III, since Ayutthaya is identified “to bear a unique or at least exceptional testimony to a cultural tradition or to a civilization which is living or which has disappeared” [46].
The designated area of the World Heritage property, presently at 289 ha, is confined to the former Royal Palace precinct and its immediate surroundings and covers the most important sites and monuments and ensures the preservation of the property’s Outstanding Universal Value (Figure 5). Initially, it was intended to manage the remaining historic monuments through complementary planning and protection controls; however, present economic and social factors warrant an extension of the historical park to cover the whole of Ayutthaya Island for the protection of all associated ancient monuments and sites as well as to strengthen the integrity of the World Heritage property.

4.2. Application of the Framework

The framework applied in the case study work is based on the following four steps (see also Figure 2):
(1)
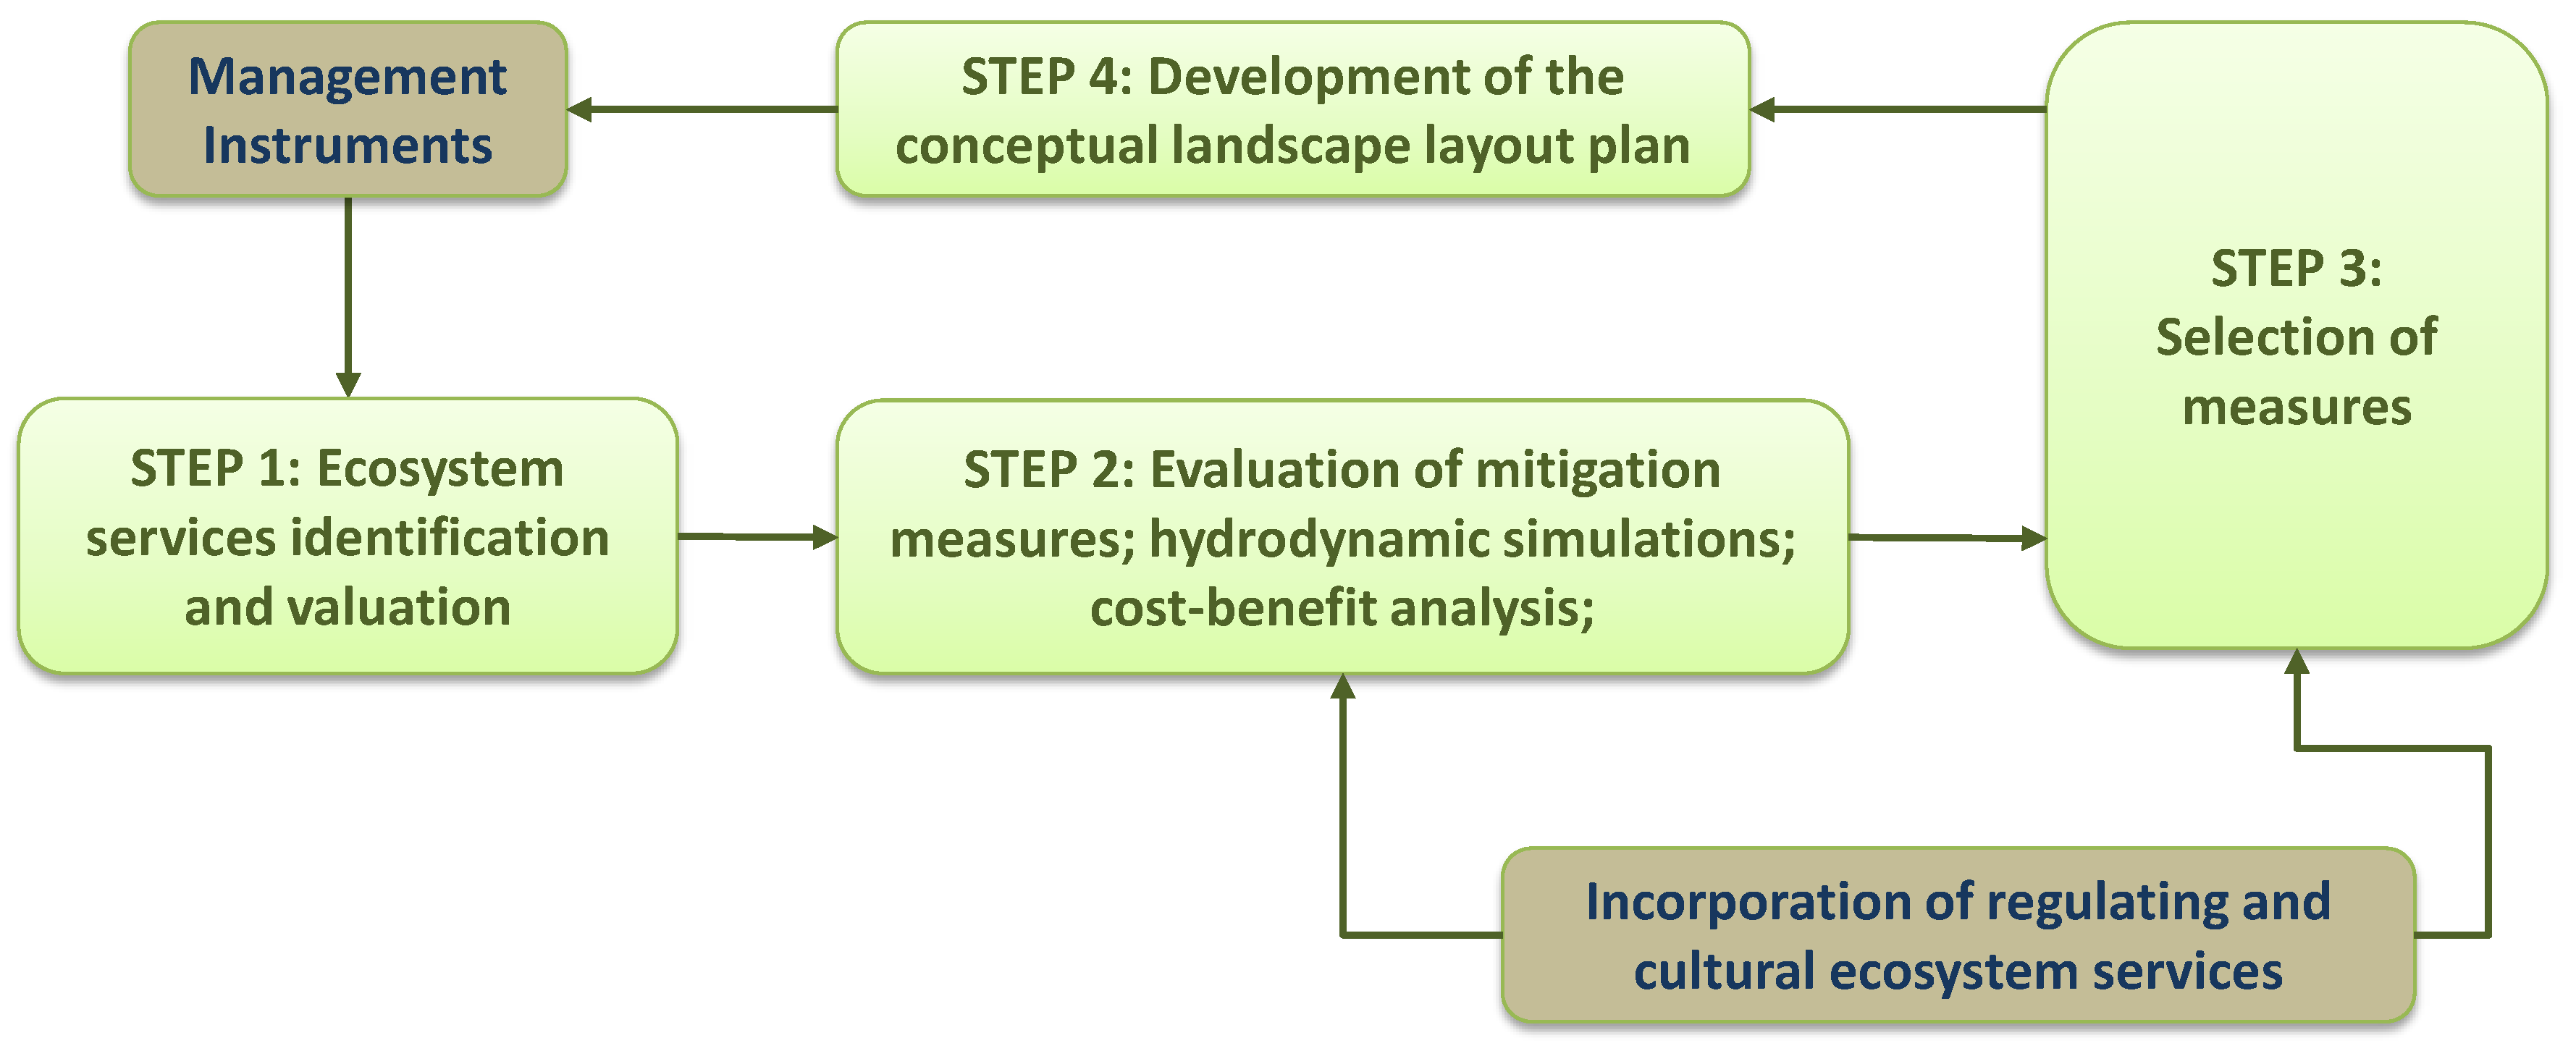
Identification and valuation of ecosystem services pertinent to the project site under various mitigation scenarios, including baseline (pre-mitigation conditions);
(2)
Evaluation of the most effective flood mitigation measures through hydrodynamic simulations, and evaluation of economic viability using benefit-cost analysis;
(3)
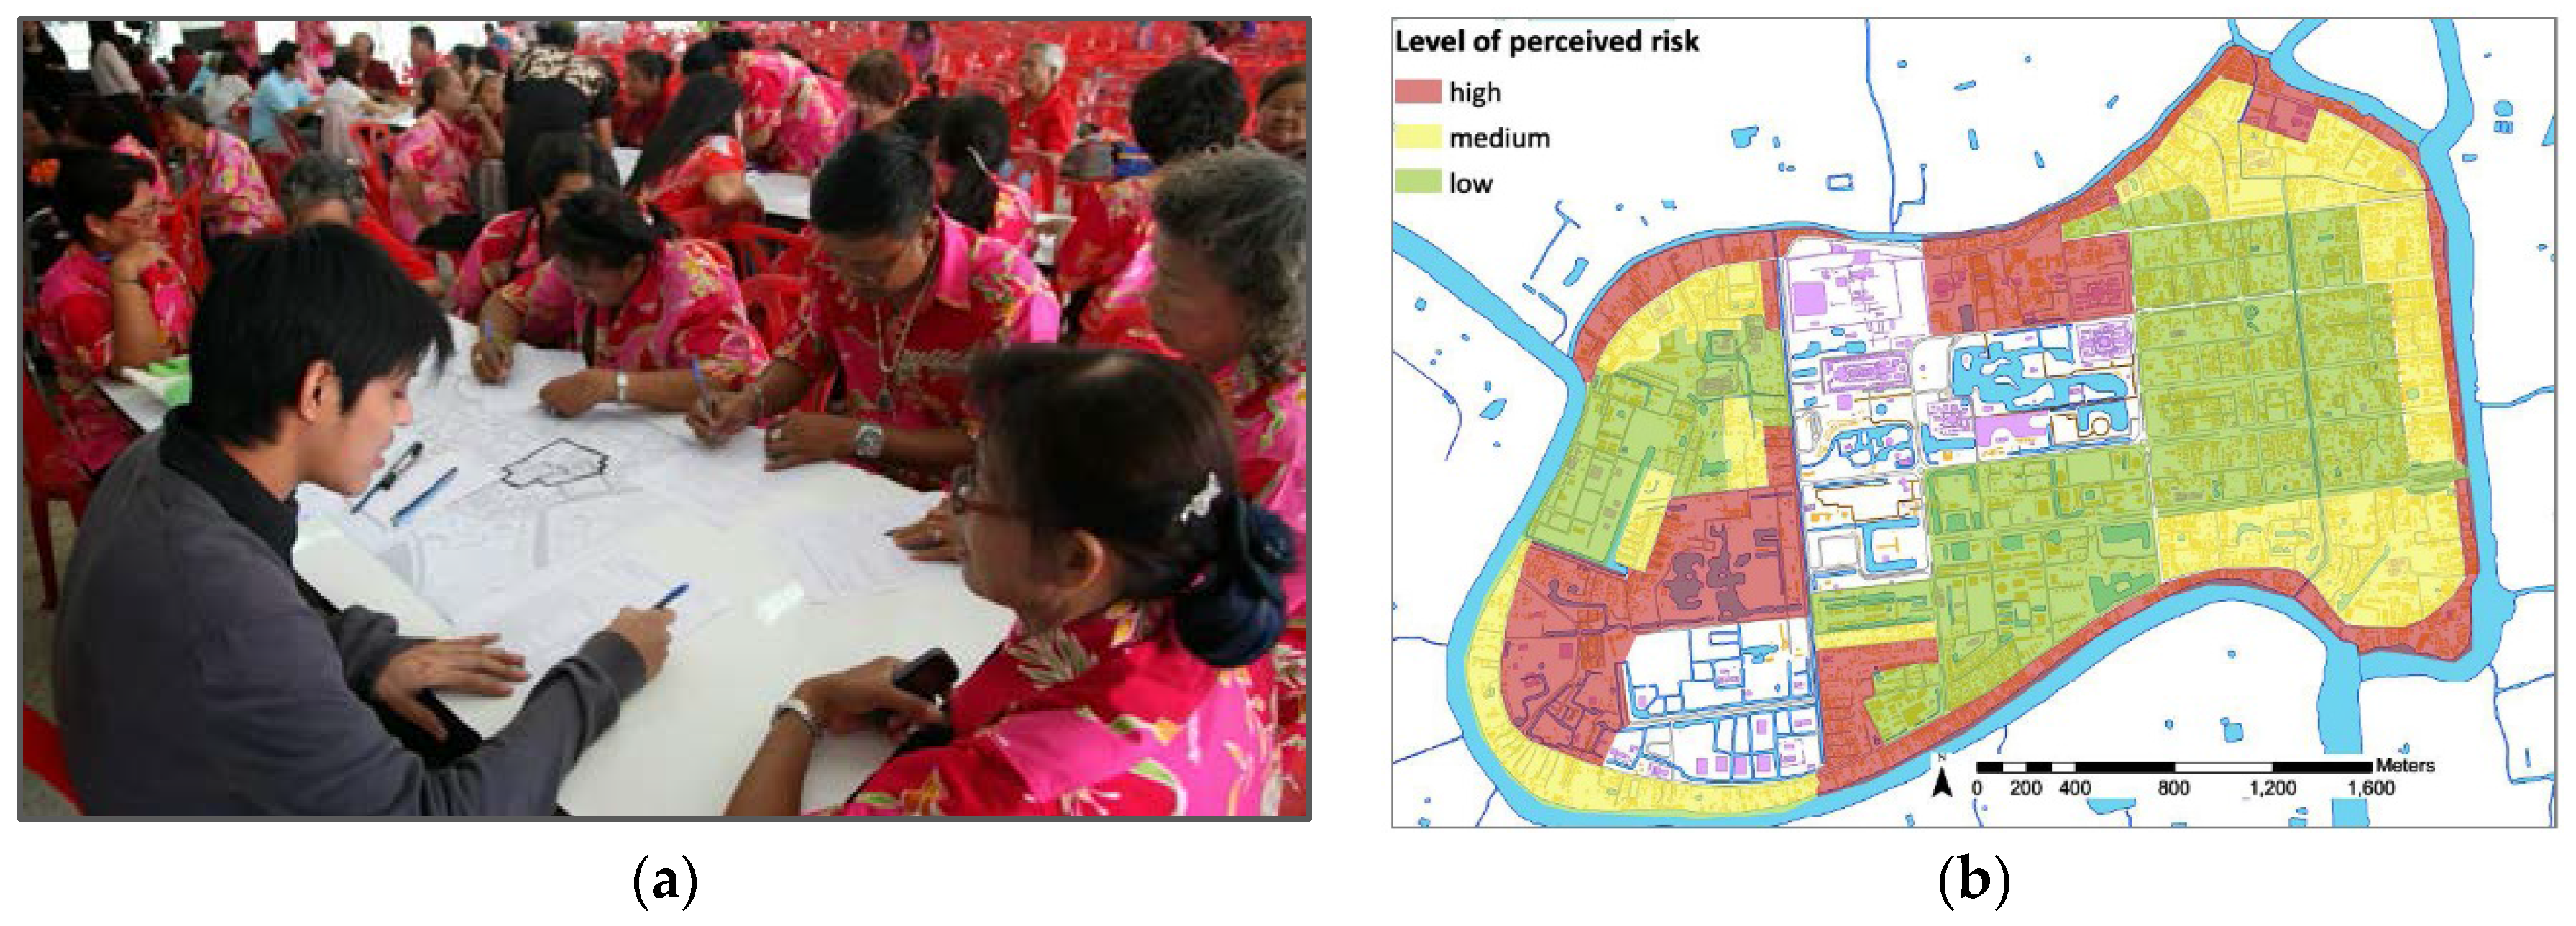
Selection of flood management measures through consideration of ecosystem services, and through solicitation of public and stakeholders input;
(4)
Development of the conceptual landscape layout plan.
The case study work started with acquisition of essential data via experts, stakeholders, site surveys, and interviews. The data included: hydrological and hydraulic data (i.e., rainfall time series, drainage system), geographical data (i.e., digital elevation model, DEM, GIS data, land use), existing flood protection system of the case study, holistic and long-term planning of flood mitigation in the study area and stakeholder needs and preferences. Based on the extensive stakeholder consultations and through the review of historical cultural heritage records, the following ecosystem services were found to be pertinent to the present work:
(a)
flood regulation (regulating category);
(b)
aesthetic (cultural category);
(c)
recreation and tourism (cultural category);
(d)
scientific and educational (cultural category);
(e)
spiritual and religious (cultural category).
For the ecosystem services identified above, a combination of monetary (mainly flood regulation through flood mitigation measures) and qualitative (based on stakeholder inputs and cultural assets’ significance) indicators were identified.
Following the identification of applicable ecosystem services, the so-called “constituents of well-being” were also identified (security from flood disasters, shelters in case of flood disasters and community cohesion), and these were also taken into consideration. A series of interviews were carried out in order to obtain inputs from communities and key organizational stakeholders.
The next step involved the use of hydrologic, morphologic, meteorological, land-use and hydraulic data and historic records to set up a detailed 1D/2D model. This was done in the MIKE FLOOD™ modelling system developed by DHI™ (https://www.mikepoweredbydhi.com/products/mike-flood), and 1D MIKE 11™ was used for river modeling (Figure 6). The time-series containing discharges (C.13 and RAMA VI) and water levels (FORT CHULA) were used as external boundary conditions for the 1D model. These data were recorded by the Royal Irrigation Department, Ministry of Agriculture and Cooperatives (RID/MOAC) (http://www.rid.go.th/eng/ and https://eng.moac.go.th/main.php?filename=main) during the 2011 flood event. The model instantiation and calibration were originally undertaken in the study of Keerakamolchai [47], and the same model was further enhanced to suit the present study objectives.
The evaluation of effective flood mitigation measures was conducted through several sub-steps, including assessment of flood hazards, assessment of physical and economic vulnerability, and assessment of ecosystem service values. Figure 6 depicts the schematization of the 1D/2D model used in the present work.
To produce flood hazard information, model simulations were performed for different scenarios, including regional flood mitigation measures, local measures, and combination of reginal and local measures (Table 1). Figure 7 illustrated an example of model results for different mitigation scenarios, expressed through 2D raster-based flood water depth grids.
Three groups of scenarios with different mitigation measures were analysed and compared against the existing scenario (i.e., existing drainage management and flood protection). The regional mitigation measures include an Ayutthaya bypass channel with a capacity of 1200 m3 and the Chainat-Pasak canal with a capacity of 1000 m3. Local mitigation measures include increasing retention/detention pond areas, reviving ancient canals, and increasing the dike height (around the U-Thong Road, which runs along the edge of the island). These measures are varied and their effects are modelled using 1D/2D models. An overview of key scenarios containing different mitigation measures is given in Table 1.
Figure 7 shows examples of model results with channel flows generated by the coupled 1D/2D model superimposed on the flood plain identified by a Digital TerrainModel (DTM) of the 2D ground surface. The derived variables are calculated for every cell at every time step, and they can be animated as a time–varying thematic map. A derived data set shown in Figure 7 is the peak flood water depth data set, that is, the peak value of flood water depth for a particular scenario, regardless of time.
Scenarios given in Table 1 were further evaluated by assessing vulnerabilities to the flood hazard in the case study area. Of the four major vulnerability components (physical, economic, social, and cultural), cost-benefit analysis evaluated direct and indirect losses (or damages) through physical vulnerability of the building stock, infrastructure and cultural artifacts, and economic vulnerability of the study area, including the tourism industry. Physical vulnerability of the buildings was also quantified utilizing pertinent depth-damage functions for typical local building types (Figure 8) and intersecting them with flood hazards for each mitigation scenario.
Figure 9 presents general physical vulnerability of building stock in Ayutthaya, where buildings were categorized into objects with high, medium and low vulnerability, depending on the construction type and their proximity to flood hazards. Figure 10 depicts an example of economic vulnerability analysis, where economic zones were also labeled with high, medium and low vulnerability, depending on the type of services offered with respect to the tourist industry.
The subsequent cost-benefit analysis incorporated monetary values for physical and economic vulnerability and other quantifiable direct and indirect simulated losses, including monetized valuations for some of the ecosystem services. The resulting comparison of the mitigation scenarios indicated that a variety of local green and grey infrastructure (e.g., multifunctional detention facilities combined with enhancement of local drainage network mainly though revitalized ancient drainage system) is socially and culturally most acceptable and the most effective solution economically.
The next step involved confirmation of the technical analysis by soliciting input from the community groups and key stakeholder organisations. While the cost-benefit analysis indicated the most cost effective and technically feasible solution, the incorporation of community/stakeholder inputs and preferences was the most dominant aspect used in the selection of individual measures. The group workshops and public solicitations were sought to address the social and cultural vulnerability of the Ayutthaya site, and to address the concerns related to their cultural heritage, so that the proposed flood mitigation measures would enhance the cultural, aesthetic, and spiritual ecosystem services, rather than reducing them. The participants were encouraged to address these issues and produce a consensus-based, composite risk assessment of the area (based on their perceptions and experiences), further narrowing the location of the proposed flood mitigation measures. Figure 11b depicts a composite risk perception map of the area (see also [48]).
All relevant inputs from community groups and key stakeholder organisations were combined with technical (numerical modelling) and cost-benefit analyses, and the details of the proposed flood mitigation measures were identified. The selection process also incorporated the analyses of topography, land-use and drainage system characteristics (e.g., the area with lowest elevations proved to be the most suitable location for ponds and so on, Figure 12). The individual characteristics of cultural assets (which ranged from structural integrity to cultural, spiritual and religious significance) were also taken into the analysis.
The final set of measures involved a combination between regional and local measures (Figure 13). This stage of the analysis involved a landscape design with a layout plan, production of cross-sections, and development of the appropriate material for stakeholder consultations. The key stakeholders consulted throughout this process were: the Ministry of Culture Fine Arts Department, local communities, the government, UNESCO Bangkok, and the Royal irrigation department.

5. Conclusions

The present paper demonstrates a methodological framework that incorporates some important ecosystem services (flood regulation, education, art/culture, recreation and tourism) into the selection and design of green and grey infrastructure measures for flood protection at the Ayutthaya Heritage Site in Thailand. The work presented described a framework that combines qualitative and quantitative data and methods for selection of green and grey infrastructure for flood protection in a cultural setting. The framework involved four main components: (1) identification and valuation of ecosystem services pertinent to the project site under various mitigation scenarios, including baseline (pre-mitigation conditions); (2) evaluation of the most effective flood mitigation measures through hydrodynamic simulations, and economic viability using cost-benefit analysis; (3) selection of flood protection measures through consideration of ecosystem services and community/stakeholder inputs; and (4) development of the conceptual landscape layout plan.
The process involved extensive stakeholder participation activities through interviews, questionnaires, consultation meetings, and workshops. Locations of flood protection measures were identified by considering topography, significance of cultural heritage assets, land-use and drainage system characteristics.
The work performed suggests that taking a holistic perspective through ecosystem services and economic assessments, marshalled through active stakeholder participation, has the potential to achieve more ecologically sustainable and socially acceptable solutions for flood protection in areas with cultural heritage. However, there is still a considerable challenge in taking this framework to a full-scale practical implementation, and this is mainly directed towards the development of appropriate indicators that can reflect various aspects of ecosystem services.

Acknowledgments

The research leading to these results has received partial funding from the Asian Development Bank and the European Union Seventh Framework Programme (FP7/2007–2013) under Grant agreement No. 603663 for the research project PEARL (Preparing for Extreme And Rare events in coastaL regions). The study reflects only the authors’ views and the European Union is not liable for any use that may be made of the information contained herein.

Author Contributions

Zoran Vojinovic wrote the paper. Weeraya Keerakamolchai performed model simulations and initial evaluation of measures through her MSc research work. Weeraya Keerakamolchai’s work was supervised and guided by Zoran Vojinovic and Sutat Weesakul. Ranko S. Pudar performed additional analysis in relation to ecosystem services and CBA. Ranko S. Pudar also contributed to the development of the methodological framework together with Zoran Vojinovic. Neiler Medina worked on the development of GIS maps, and Alida Alves provided some useful comments and suggestions. All authors have provided relevant inputs to the development of this paper.

Conflicts of Interest

The authors declare no conflict of interest.

References

  1. Vojinovic, Z.; van Teeffelen, J. An Integrated Stormwater Management Approach for Small Islands in Tropical Climates. Urban Water J. 2007, 4, 211–231. [Google Scholar] [CrossRef]
  2. Price, R.K.; Vojinovic, Z. Urban Flood Disaster Management. Urban Water J. 2008, 5, 259–276. [Google Scholar] [CrossRef]
  3. Mynett, A.; Vojinovic, Z. Hydroinformatics in Multi-Colours—Part Red: Urban Flood and Disaster Management. J. Hydroinform. 2009, 11 (3-4), 166–180. [Google Scholar] [CrossRef]
  4. Vojinovic, Z. Supporting Flood Disaster Management with Numerical Modelling and Spatial Mapping Tools. Int. J. Geoinform. 2010, 5, 33–40. [Google Scholar]
  5. Abbott, M.B.; Vojinovic, Z. Realising Social Justice in Water Sector: Part 1. J. Hydroinform. 2010, 12, 110–130. [Google Scholar]
  6. Abbott, M.B.; Vojinovic, Z. Realising Social Justice in Water Sector: Part 2. J. Hydroinform. 2010, 12, 225–239. [Google Scholar] [CrossRef]
  7. Abbott, M.B.; Vojinovic, Z. Towards a Hydroinformatics for China. J. Hydroinform. 2012, 15, 1189–1202. [Google Scholar] [CrossRef]
  8. Abbott, M.B.; Vojinovic, Z. Towards a hydroinformatics praxis in the service of social justice. J. Hydroinform. 2014, 16, 516–530. [Google Scholar] [CrossRef]
  9. Vojinovic, Z.; Abbott, M.B. Flood Risk and Social Justice: From Quantitative to Qualitative Flood Risk Assessment and Mitigation; IWA Publishing: London, UK, 2012. [Google Scholar]
  10. Vojinovic, Z.; Solomatine, D.P.; Price, R.K. Dynamic Least-Cost Optimisation of Wastewater System Remedial Works Requirements. Water Sci. Technol. 2006, 54, 467–475. [Google Scholar] [CrossRef] [PubMed]
  11. Vojinovic, Z.; Sanchez, A.; Barreto, W.J. Optimising sewer system rehabilitation strategies between flooding, overflow emissions and investment costs. In Proceedings of the 11th International Conference on Urban Drainage, Edinburgh, UK, 31 August–5 September 2008.
  12. Barreto, W.J.; Vojinovic, Z.; Price, R.; Solomatine, D. Approaches to multi-objective multi-tier optimisation in Urban Drainage Planning. In Proceedings of the 7th International Conference on Hydroinformatics, Acropolis, Nice, France, 4–8 September 2006.
  13. Barreto, W.; Vojinovic, Z.; Price, R.K.; Solomatine, D.P. Multi-objective Evolutionary Approach for Rehabilitation of Urban Drainage Systems. ASCE J. Water Resour. Plan. Manag. 2010, 136, 547–554. [Google Scholar] [CrossRef]
  14. Alves, A.; Sanchez, A.; Vojinovic, Z.; Seyoum, S.; Babel, M.; Brdjanovic, D. Evolutionary and Holistic Assessment of Green-Grey Infrastructure for CSO Reduction. Water 2016, 8, 402. [Google Scholar] [CrossRef]
  15. Vojinovic, Z.; Sahlu, S.; Seyoum, S.; Sanchez, A.; Matungulu, H.; Kapelan, Z.; Savic, D. Multi-objective rehabilitation of urban drainage systems under uncertainties. J. Hydroinform. 2014, 16, 1044–1061. [Google Scholar] [CrossRef]
  16. Vojinovic, Z. Flood Risk: The Holistic Perspective, from Integrated to Interactive Planning for Flood Resilience; IWA Publishing: London, UK, 2015. [Google Scholar]
  17. Intergovernmental Panel on Climate Change (IPCC). Summary for policymakers. In Managing the Risks of Extreme Events and Disasters to Advance Climate Change Adaptation; Field, C.B., Barros, V., Stocker, T.F., Qin, D., Dokken, D.J., Ebi, K.L., Mastrandrea, M.D., Mach, K.J., Plattner, G.-K., Allen, S.K., et al., Eds.; A Special Report of Working Groups I and II of the Intergovernmental Panel on Climate Change; Cambridge University Press: Cambridge, UK; New York, NY, USA, 2012. [Google Scholar]
  18. Millennium Ecosystem Assessment. Ecosystems and Human Well-Being: Synthesis; Island Press: Washington, DC, USA, 2005. [Google Scholar]
  19. Boyd, J.; Banzhaf, S. What are ecosystem services? Ecol. Econ. 2007, 63, 616–626. [Google Scholar] [CrossRef]
  20. De Groot, R.S.; Alkemade, R.; Braat, L.; Hein, L.; Willemen, L. Challenges in integrating the concept of ecosystem services and values in landscape planning, management and decision making. Ecol. Complex. 2010, 7, 260–272. [Google Scholar] [CrossRef]
  21. Millennium Ecosystem Assessment. Ecosystems and Human Well-Being: A Framework for Assessment; Island Press: Washington, DC, USA, 2003. [Google Scholar]
  22. Council of Europe. The European Landscape Convention; Council of Europe: Strasbourg, France, 2000. [Google Scholar]
  23. European Environment Agency (EEA). Exploring Nature-Based Solutions; EEA Technical Report No 12/2015; EEA: Copenhagen, Denmark, 2015. [Google Scholar]
  24. Sanchez, A.; Medina, N.; Vojinovic, Z.; Price, R. An integrated cellular automata evolutionary-based approach for evaluating future scenarios and the expansion of urban drainage networks. J. Hydroinform. 2014, 16, 319–340. [Google Scholar] [CrossRef]
  25. Kumar, D.S.; Arya, D.S.; Vojinovic, Z. Modelling of urban growth dynamics and its impact on surface runoff characteristics, Computers. Environ. Urban Syst. 2013, 41, 124–135. [Google Scholar] [CrossRef]
  26. Singh, R.; Arya, D.S.; Taxak, A.; Vojinovic, Z. Potential impact of climate change on Rainfall Intensity-Duration-Frequency (IDF) Curves in Roorkee. Water Resour. Manag. 2016, 1–14. [Google Scholar] [CrossRef]
  27. Lagendijk, A.; Wisserhof, J. Meer ruimte voor kennis. Verkenning van de kennisinfrastructuur voor Meervoudig Ruimtegebruik. In Give Knowledge to Space, Give Space to Knowledge, Part 1: Exploration of Knowledge Infrastructure for Multifunctional Land Use Series; RMNO Report 136; NLRO: Den Haag, The Netherlands, 1999. [Google Scholar]
  28. Abbott, M.B.; Tumwesigye, B.M.; Vojinovic, Z. The fifth generation of modelling in Hydroinformatics. In Proceedings of the 7th International Conference on Hydroinformatics, Acropolis, Nice, France, 4–8 September 2006.
  29. Abbott, M.B.; Vojinovic, Z. Applications of Numerical Modelling in Hydroinformatics. J. Hydroinform. 2009, 11, 308–319. [Google Scholar] [CrossRef]
  30. Abebe, Y.; Seyoum, S.; Vojinovic, Z.; Price, R. Effects of reducing convective acceleration terms in modelling supercritical and transcritical flow conditions. Water 2016, 8, 562. [Google Scholar]
  31. Vojinovic, Z.; Kecman, V.; Babovic, V. A Hybrid Approach for Modelling Wet Weather Response in Wastewater Systems. ASCE J. Water Resour. Plan. Manag. 2003, 129, 511–521. [Google Scholar] [CrossRef]
  32. Vojinovic, Z.; Bonillo, B.; Chitranjan, K.; Price, R. Modelling flow transitions at street junctions with 1D and 2D models. In Proceedings of the 7th International Conference on Hydroinformatics, Acropolis, Nice, France, 4–8 September 2006.
  33. Vojinovic, Z. A Complementary Modelling Approach to Manage Uncertainty of Computationally Expensive Models. Water Sci. Technol. 2007, 56, 1–9. [Google Scholar] [CrossRef] [PubMed]
  34. Vojinovic, Z.; Tutulic, D. On the use of 1D and coupled 1D-2D approaches for assessment of flood damages in urban areas. Urban Water J. 2009, 6, 183–199. [Google Scholar] [CrossRef]
  35. Vojinovic, Z.; Seyoum, S.D.; Mwalwaka, J.M.; Price, R.K. Effects of Model Schematization, Geometry and Parameter Values on Urban Flood Modelling. Water Sci. Technol. 2011, 63, 462–467. [Google Scholar] [CrossRef] [PubMed]
  36. Abdullah, A.; Rahman, A.; Vojinovic, Z. LiDAR filtering algorithms for urban flood application: Review on current algorithms and filters test. Laserscanning 2009, 38, 30–36. [Google Scholar]
  37. Abdullah, A.F.; Vojinovic, Z.; Price, R.K. A Methodology for Processing Raw LIDAR Data to Support 1D/2D Urban Flood Modelling Framework. J. Hydroinform. 2011. [Google Scholar] [CrossRef]
  38. Abdullah, A.F.; Vojinovic, Z.; Price, R.K. Improved Methodology for Processing Raw LIDAR Data to Support Urban Flood Modelling—Accounting for Elevated Roads and Bridges. J. Hydroinform. 2011. [Google Scholar] [CrossRef]
  39. Vojinovic, Z.; Seyoum, S.; Salum, M.H.; Price, R.K.; Fikri, A.F.; Abebe, Y. Modelling floods in urban areas and representation of buildings with a method based on adjusted conveyance and storage characteristics. J. Hydroinform. 2012, 15, 1150–1168. [Google Scholar] [CrossRef]
  40. Seyoum, S.D.; Vojinovic, Z.; Price, R.K.; Weesakul, S. Coupled 1d and non-inertia 2D flood inundation model for simulation of urban pluvial flooding. ASCE J. Hydraul. Eng. 2012, 138, 23–34. [Google Scholar] [CrossRef]
  41. Meesuk, V.; Vojinovic, Z.; Mynett, A.; Abdullah, A.F. Urban flood modelling combining top-view LiDAR data with ground-view SfM observations. Adv. Water Resour. 2015, 75, 105–117. [Google Scholar] [CrossRef]
  42. Doong, D.; Lo, W.; Vojinovic, Z.; Lee, W.; Lee, S. Development of a New Generation of Flood Inundation Maps—A Case Study of the Coastal City of Tainan, Taiwan. Water 2016, 8, 521. [Google Scholar] [CrossRef]
  43. Haines-Young, R.H.; Potschin, M.P. The links between biodiversity, ecosystem services and human well-being. In Ecosystem Ecology: A New Synthesis; Raffaelli, D., Frid, C., Eds.; BES Ecological Reviews Series; Cambridge University Press (CUP): Cambridge, UK, 2010; p. 172. [Google Scholar]
  44. Park, D.; Jang, S.; Roesner, L.A. Evaluation of Multi-Use Stormwater Detention Basins for Improved Urban Watershed Management. 2012. Available online: https://www.academia.edu/2335122/Evaluation_of_multi_use_stormwater_detention_basins_for_improved_urban_watershed_management (accessed on 18 April 2014).
  45. SPAN Co., Ltd.; VEGA Engineering Consultants Co., Ltd. The Study and Detailed Design of Flood Protection System of Phra Nakorn Si Ayutthaya Urbanized Area; Public Works Department, Ministry of Interior: Buenos Aires, Argentina, 1997; Volume 1–2. [Google Scholar]
  46. UNESCO World Heritage Centre. Historic City of Ayutthaya. Available online: http://whc.unesco.org/en/list/576 (accessed on 1 December 2016).
  47. Keerakamolchai, W. Towards a Framework for Multifunctional Flood Detention Facilities Design in a Mixed Land Use Area: The Case of Ayutthaya World Heritage Site, Thailand; AIT, Pathumthani and UNESCO-IHE: Delft, The Netherlands, 2014. [Google Scholar]
  48. Vojinovic, Z.; Hammond, M.; Golub, D.; Hirunsalee, S.; Weesakul, S.; Meesuk, V.; Medina, N.P.; Abbott, M.; Sanchez, A.; Kumara, S. Holistic approach to flood risk assessment in urban areas with cultural heritage: A practical application in Ayutthaya, Thailand. Nat. Hazards 2016, 81, 589–616. [Google Scholar] [CrossRef]
Figure 1. Planning for resilience—a conceptual framework (adopted from [16]).
Environments 04 00003 g001
Figure 2. Illustration of the methodological framework that combines ecosystem services with cost-benefit analysis, CBA (or benefit-cost analysis, BCA), for selection of green and grey infrastructure for flood protection in a cultural setting.
Environments 04 00003 g002
Figure 3. Linkages between ecosystem services and constituents of well-being (after [18]).
Environments 04 00003 g003
Figure 4. Illustration of the concept of mitigation benefits, defined as an integrated area of difference between two sets of damage curves, for pre-mitigation and post-mitigation conditions. Note the assumption of zero residual losses, up to the design level of protection. The magnitude of flooding events is in correlation with their return periods. All numeric values are arbitrary and for illustration purposes.
Environments 04 00003 g004
Figure 5. Cultural Heritage assets in Ayutthaya, Thailand.
Environments 04 00003 g005
Figure 6. Illustration of the 1D/2D MIKEFLOOD model set up, which was used in the present work (the square shaded symbol represents the Ayutthaya region, which is the extent of the 2D model domain). The two circles, C.13 and RAMA VI denote upstream inflow points (i.e., upstream boundary conditions). The triangle FORT CHULA denotes the downstream tidal point at Fort Chula, Gulf of Thailand (i.e., downstream boundary condition). The horizontal and vertical axes show longitude and latitude positions.
Environments 04 00003 g006
Figure 7. Example of the model simulation results, expressing computed flood depths for different combinations of flood protection measures ((a) current situation—Scenario 1, or “business as usual”; (b) combination of measures—Scenario 4; and (c) combination of measures—Scenario 7), 2011 flood event. The combination of measures included a variety of measures such as regional, local and combinations between regional and local (Table 1).
Environments 04 00003 g007aEnvironments 04 00003 g007b
Figure 8. Depth-damage functions for Ayutthaya.
Environments 04 00003 g008
Figure 9. Illustration of the physical vulnerability of the Ayutthaya building stock to flood hazard (details). Categorization based on the type of local architecture and its structural resilience to floods, expressed through pertinent depth-damage functions.
Environments 04 00003 g009
Figure 10. Illustration of the economic vulnerability of the Ayutthaya commercial zones to floods. Categorization is based on the type of services offered with respect to the tourist industry.
Environments 04 00003 g010
Figure 11. (a) stakeholder consultations and (b) illustration of the composite risk perception map, based on stakeholders’ inputs [48].
Environments 04 00003 g011
Figure 12. Analysis of locations for potential flood mitigation measures. Arrows indicate the flood propagation towards the southwest region.
Environments 04 00003 g012
Figure 13. Final set of flood protection measures in Ayutthaya (grey infrastructure: dike, canals, pumping stations; green infrastructure: multifunctional detention and retention ponds, stormwater harvesting and reuse, productive landscapes, etc.).
Environments 04 00003 g013
Table 1. Overview of key scenarios with different mitigation measures.
ScenariosMitigation Measures
1Existing drainage management and flood protection (existing scenario)
2Construction of Ayutthaya bypass channel (regional measure)
3Construction of Ayutthaya bypass channel and Chainat-Pasak canal (regional measures)
4Increase of the U-Thong Road dike height and reinstatement of Ancient canals (local measures)
5Ayutthaya Bypass Channel + Increasing Dike Height (combination of regional and local measures)
6Ayutthaya Bypass Channel + Ponds + Ancient Canals (combination of regional and local measures)
7Ayutthaya Bypass Channel + Increasing Dike Height + Ponds + Ancient Canals (combination of regional and local measures)

