Article

Response of Red-Backed Salamanders (Plethodon Cinereus) to Changes in Hemlock Forest Soil Driven by Invasive Hemlock Woolly Adelgid (Adelges Tsugae)

by
Alison Ochs
1,* and
Ahmed A. H. Siddig
2,3,4
1
Mount Holyoke College, 50 College Street, South Hadley, MA 01075, USA
2
Harvard Forest, Harvard University, 324 N. Main Street, Petersham, MA 01366, USA
3
Faculty of Forestry, University of Khartoum, Khartoum North 13314, Khartoum State, Sudan
4
Department of Biometry and Environmental Systems Analysis, University of Freiburg, Tennenbacher Str. 4, Freiburg 79106, Germany
*
Author to whom correspondence should be addressed.
Environments 2017, 4(1), 8; https://doi.org/10.3390/environments4010008
Submission received: 31 August 2016 / Revised: 30 December 2016 / Accepted: 16 January 2017 / Published: 21 January 2017

Abstract

:
Hemlock forests of the northeastern United States are declining due to the invasive hemlock woolly adelgid (HWA) (Adelges tsugae). Hardwood species replace these forests, which affects soil properties that may influence other communities, such as red-backed salamanders (red-backs) (Plethodon cinereus). This study examined the effects of HWA invasion on soil properties and how this affects red-backs at the Hemlock Removal Experiment at Harvard Forest, which consists of eight 0.8 ha plots treated with girdling to simulate HWA invasion, logging to simulate common management practices, or hemlock- or hardwood-dominated controls. Coverboard surveys were used to determine the relative abundance of red-backs between plots during June and July 2014 and soil cores were collected from which the bulk density, moisture, pH, temperature, leaf litter, and carbon-nitrogen ratio were measured. Ordination provided a soil quality index based on temperature, pH, and carbon-to-nitrogen ratio, which was significantly different between plot treatments (p < 0.05) and showed a significant negative correlation with the red-back relative abundance (p < 0.05). The findings support the hypothesis that red-backs are affected by soil quality, which is affected by plot treatment and thus HWA invasion. Further studies should explore how salamanders react in the long term towards changing environments and consider the use of red-backs as indicator species.

1. Introduction

The hemlock forests of the northeastern United States are currently declining due to an invasive insect, the hemlock woolly adelgid (hereafter HWA), Adelges tsugae Annand, which attaches to the base of eastern hemlock (Tsuga canadensis) needles and causes a slow death of the tree over several years [1,2]. With the decline of the hemlock, the characteristic heavy canopy and cool, dark microclimate give way to hardwood species such as oak, birch, and maple [2,3,4,5]. This transition from hemlock to hardwood forest is expected to bring changes to the microclimate, including changes in the soil properties [4,6].
Many aspects of the soil are affected by vegetation. Chemically, variables such as pH can be affected by changes in leaf litter inputs and cation uptake [7]. Bulk density has been linked to deforestation and cultivation [8] as well as reforestation [9], and can be used as a measure of soil structure [10,11]. Soil moisture can be affected by canopy cover and has been shown to decrease in areas infested with hemlock woolly adelgid [12], potentially due to higher evaporation [13]. Temperature can also be affected by canopy cover and has been speculated to increase with infestation [14,15]. Hemlock dominance has been shown to lead to a higher amount of detritus [16] so the leaf litter depth would likely be higher in hemlock-dominated areas and would change as hemlock trees lose their needles and are replaced by deciduous trees. Species composition further affects the leaf litter chemistry, which can affect the decomposition of leaf matter, soil respiration, and nitrogen mineralization [16,17]. The leaf litter of infested hemlock trees has been found to have more nitrogen than uninfested leaf litter and a lower carbon-to-nitrogen ratio (hereafter C:N), as feeding residue from HWA increases fluxes of organic nitrogen [18]. Soil carbon may be affected indirectly through changes in other aspects of the soil, such as temperature, soil moisture, and pH, and a higher soil temperature can lead to greater nitrogen availability [12].
In response to the invasion of HWA, forest managers sometimes choose to salvage or preemptively log hemlock woods before the infestation makes them worthless, which unsurprisingly introduces additional changes including depriving the soil of detritus and sudden canopy gaps increasing light availability. A study by Jenkins et al. [14] suggested that leaching from dead hemlock trees would affect the C:N, an effect missing from logged forests.
Hemlock forests are considered a unique habitat for many animal taxa [2,3]. Most of these species rely on soil properties directly or indirectly and may be affected by changes in soil quality due to the shift in forest type in response to invasion by HWA. Red-backed salamanders (hereafter red-backs) (Plethodon cinereus) are ecologically significant both by affecting the decomposition rates by preying on leaf litter fragmenters [19] and by serving as important prey items for several bird and snake species [2], and they are particularly sensitive to changes in the microclimate [20]. They are lungless and completely terrestrial, remaining in the soil for their entire lives, and thus have been shown to react to changes in soil moisture [21] and temperature [22], as well as pH [23,24].
Previous studies have linked many of these variables to red-back abundance and population dynamics. For instance, they have been shown to be less abundant in areas where the pH is below 3.8, possibly due to resulting sodium imbalances [23], though they may be able to survive in such areas for some short time [24]. Cameron et al. [25] found that red-backs may not be affected by small changes in pH, but suggested that a higher pH may negatively affect arthropods and thus alter red-back prey communities. Clearly, leaf litter, bulk density and C:N may also affect these organisms due to their direct influences on the soil moisture and temperature [21].
Obviously, these soil factors are likely to be negatively influenced by the change in vegetation structure and composition resulting from hemlock decline in New England forests. We hypothesized that as the hemlock forests decline due to HWA invasion, the soil quality will be affected, which will negatively impact the abundance of red-backs. Therefore, the aim of this study was to investigate how the invasion of HWA and the associated loss of hemlock forests affect soil characteristics and how this may further affect animal species that rely on the soil. Specifically, we (1) investigate the possible effects of hemlock decline on some soil quality measures, and (2) determine the effects of these soil qualities on the abundance of red-backs.

2. Materials and Methods

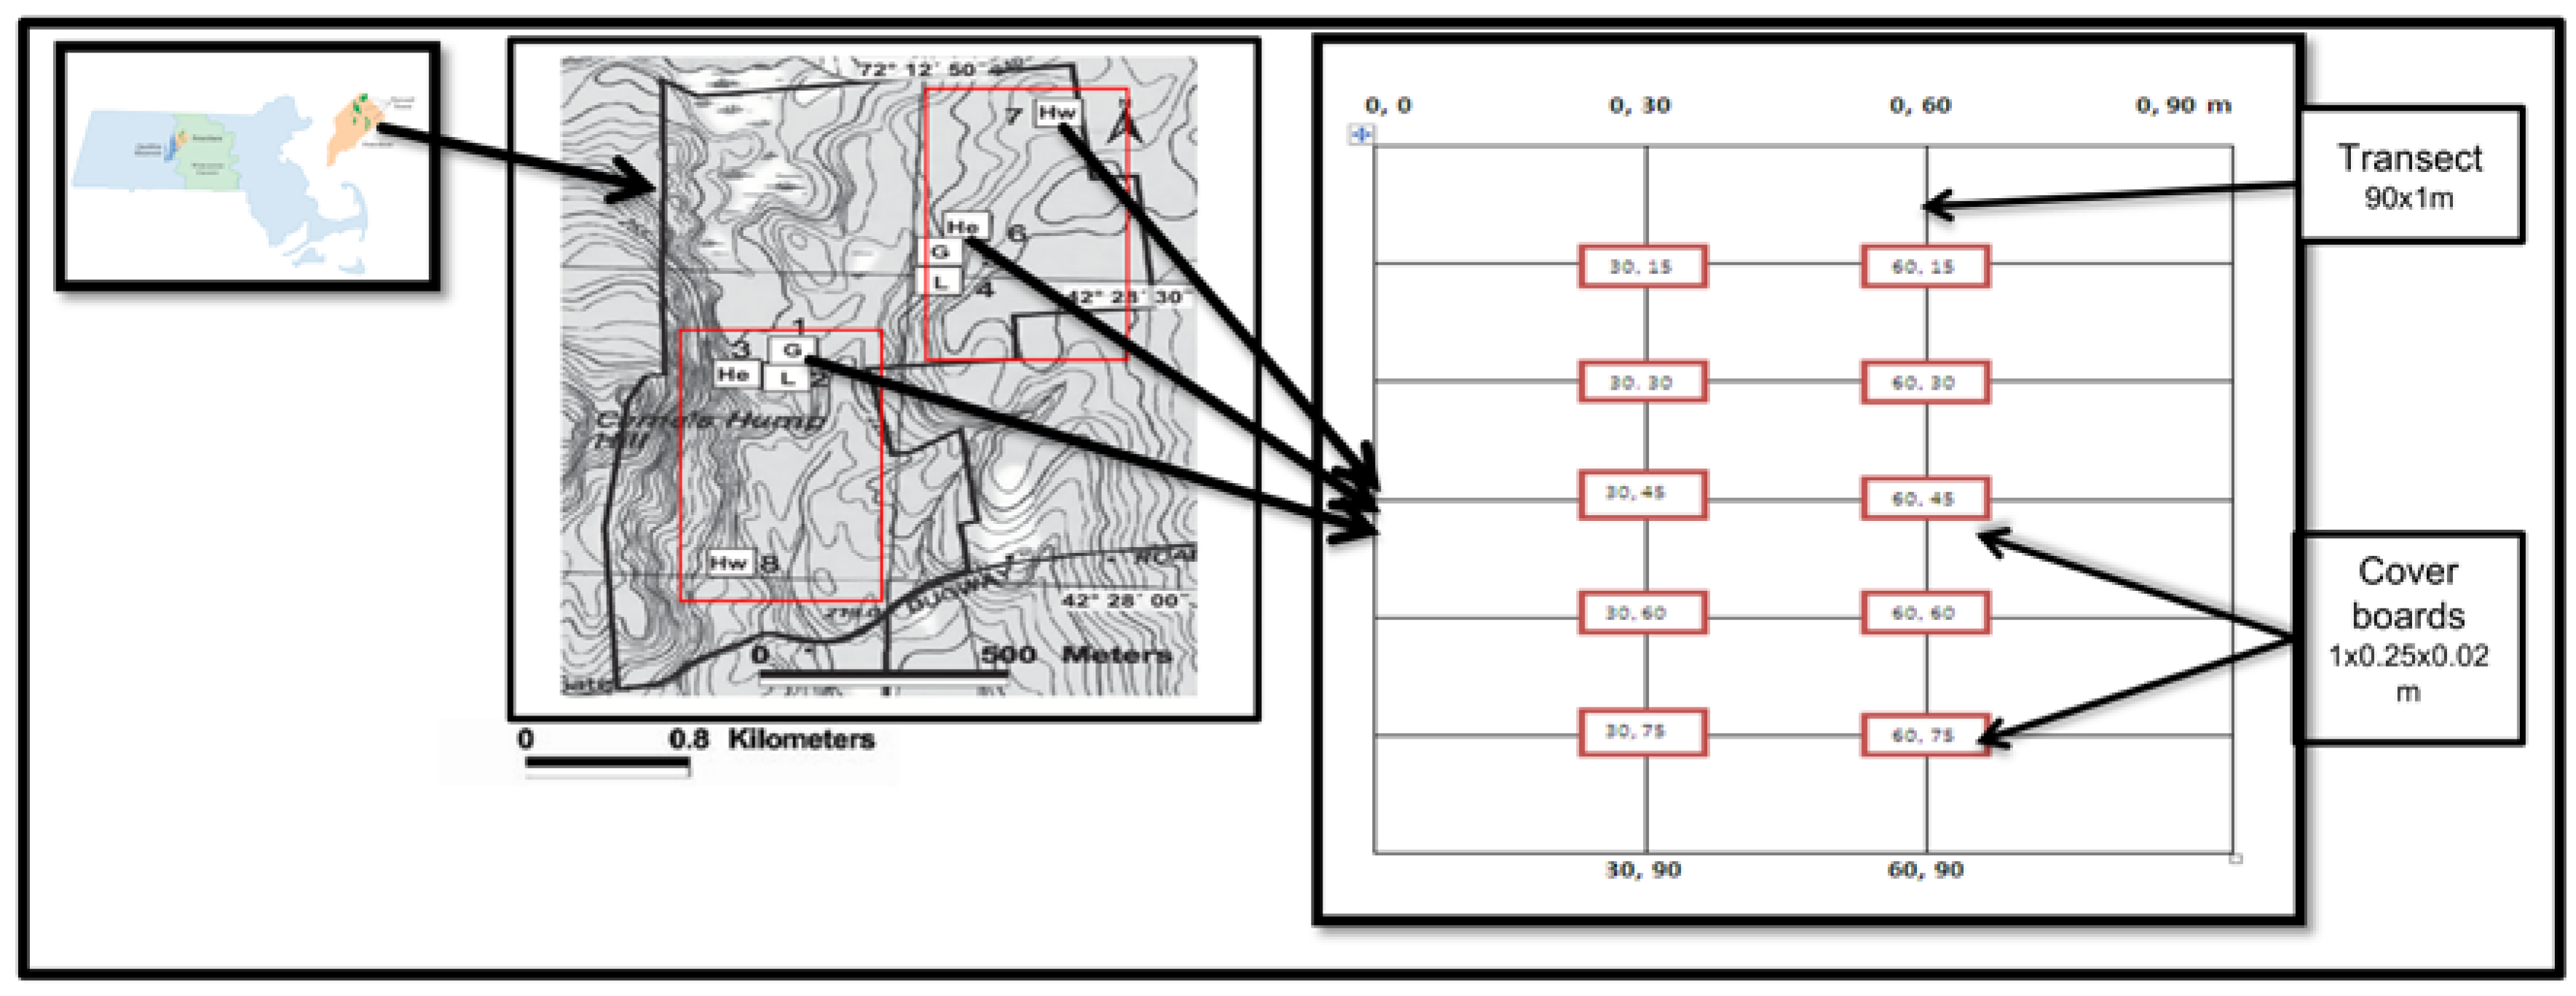
2.1. Study Site and Design

This study was conducted at the Hemlock Removal Experiment (HeRE) plots in Harvard Forest, Petersham, MA, USA, during June and July 2014. The aim of HeRE was to experimentally asses the long-term ecosystem responses of losing hemlock forests in the New England region. Following a replicated block design, the experiment has two blocks reflecting the topography of the forest—the ridge and valley. In each block, four 0.8 ha plots were established and four canopy treatments were applied. The four treatments considered at HeRE were girdling, logging, hardwood control, and hemlock control. Hemlock trees in girdled plots had a narrow strip of bark removed from the entire circumference, severing the phloem and killing the tree, to simulate the slow death seen with the invasion of HWA. Logged plots had all commercially valuable trees cut and removed, simulating a common response to the possibility of adelgid invasion. Control plots were designated either hemlock-dominated controls or hardwood-dominated controls, allowing the study to encompass both a relatively healthy hemlock forest and the eventual outcome of the insect invasion. For more about the full description of the site and design see Figure 1 and Ellison et al. [4].

2.2. Salamander Sampling

Salamander relative abundance was assessed using cover boards, which best simulate salamander’s preferred habitat (i.e., logs and debris). In each of the eight plots, two 60 m transects were established and five 1 × 0.25 × 0.02-m cover boards were placed on each transect at even intervals (Figure 1). The cover boards were cut from hemlock wood and placed two years prior to this study. Once a week, observers checked under each cover board and counted the number of salamanders found. Data from six sampling sessions from 3 June to 3 July 2014, were used in this study in order to avoid using data temporally different from our soil data. The number of salamanders found under each cover board was averaged and the relative abundance (salamanders/m2) was used for the analysis following the procedure recommended by Siddig et al. (2015) [26]. As this study compared the relative abundance between plots, imperfect detection or other problems that would affect all plots equally would not affect the data, as the relative abundances of each cover board were compared with each other and thus if all plots were affected equally, any effects on the data would be negligible. Red-back sampling methods were approved by Harvard University’s Institutional Animal Care and Use Committee (File 13-02-144; last updated 2 June 2014).

2.3. Soil Sampling

On 18 June 2014 three soil cores were taken from each plot, next to three randomly chosen cover boards. This smaller subset allowed us to gain a reasonable understanding of the soil variables over the entirety of the plot. The diameter and length of the core was measured to determine the volume, and the leaf litter depth was estimated to nearest millimeter using a ruler at the pits of the soil cores. Soil temperature was measured using a soil thermometer, and soil samples were kept cold to retain moisture and transported to the lab and weighed, then dried in the oven at 100 °C for 48 h [27]. Dry samples were weighed again, sieved with a 2 mm mesh and ground to prepare for combustion analysis [28]. The analysis was used to obtain the C:N. For pH, sieved samples were mixed with water in a 1:5 soil to water ratio to allow for proper suspension of the soil, then stirred for 30 min. After sitting 30 min, suspensions were stirred for an additional 30 min, and then pH was measured [29]. Moisture was calculated by subtracting the dry weight from the original weight and dividing by the original weight [5]. By dividing the dry weight by the sample volume, the bulk density was obtained [30].

2.4. Statistical Analysis

Data analysis was performed using the R platform [31]. First, soil variables were explored using a correlation matrix to assess the data and multicollinearity between these soil factors (Figure 2). Due to some expected severe correlations between these variables a composite index of soil characteristics was established by using a multivariate principal component analysis (PCA) that provided principle component scores (Table 1). These scores act as a new variable that describes the variance in the soil variables, thus working as an index for soil characteristics. Two sets of component scores, PC1 and PC2, were used. PC1 considered a higher proportion of variance of the data (Table 1), while PC2 related more to variables used in previous research on the relationships between salamander relative abundance and pH and soil temperature (Figure 3). While PC2 explained a lower proportion of the variance than PC1, PC1 was less related to carbon-nitrogen and temperature, variables of high interest for this study. The effects of plot treatment on the soil characteristics (i.e., PC scores) were then evaluated using one-way analysis of variance (ANOVA). Simple linear regression was also used to assess the effect of soil characteristics on red-back abundance.

3. Results

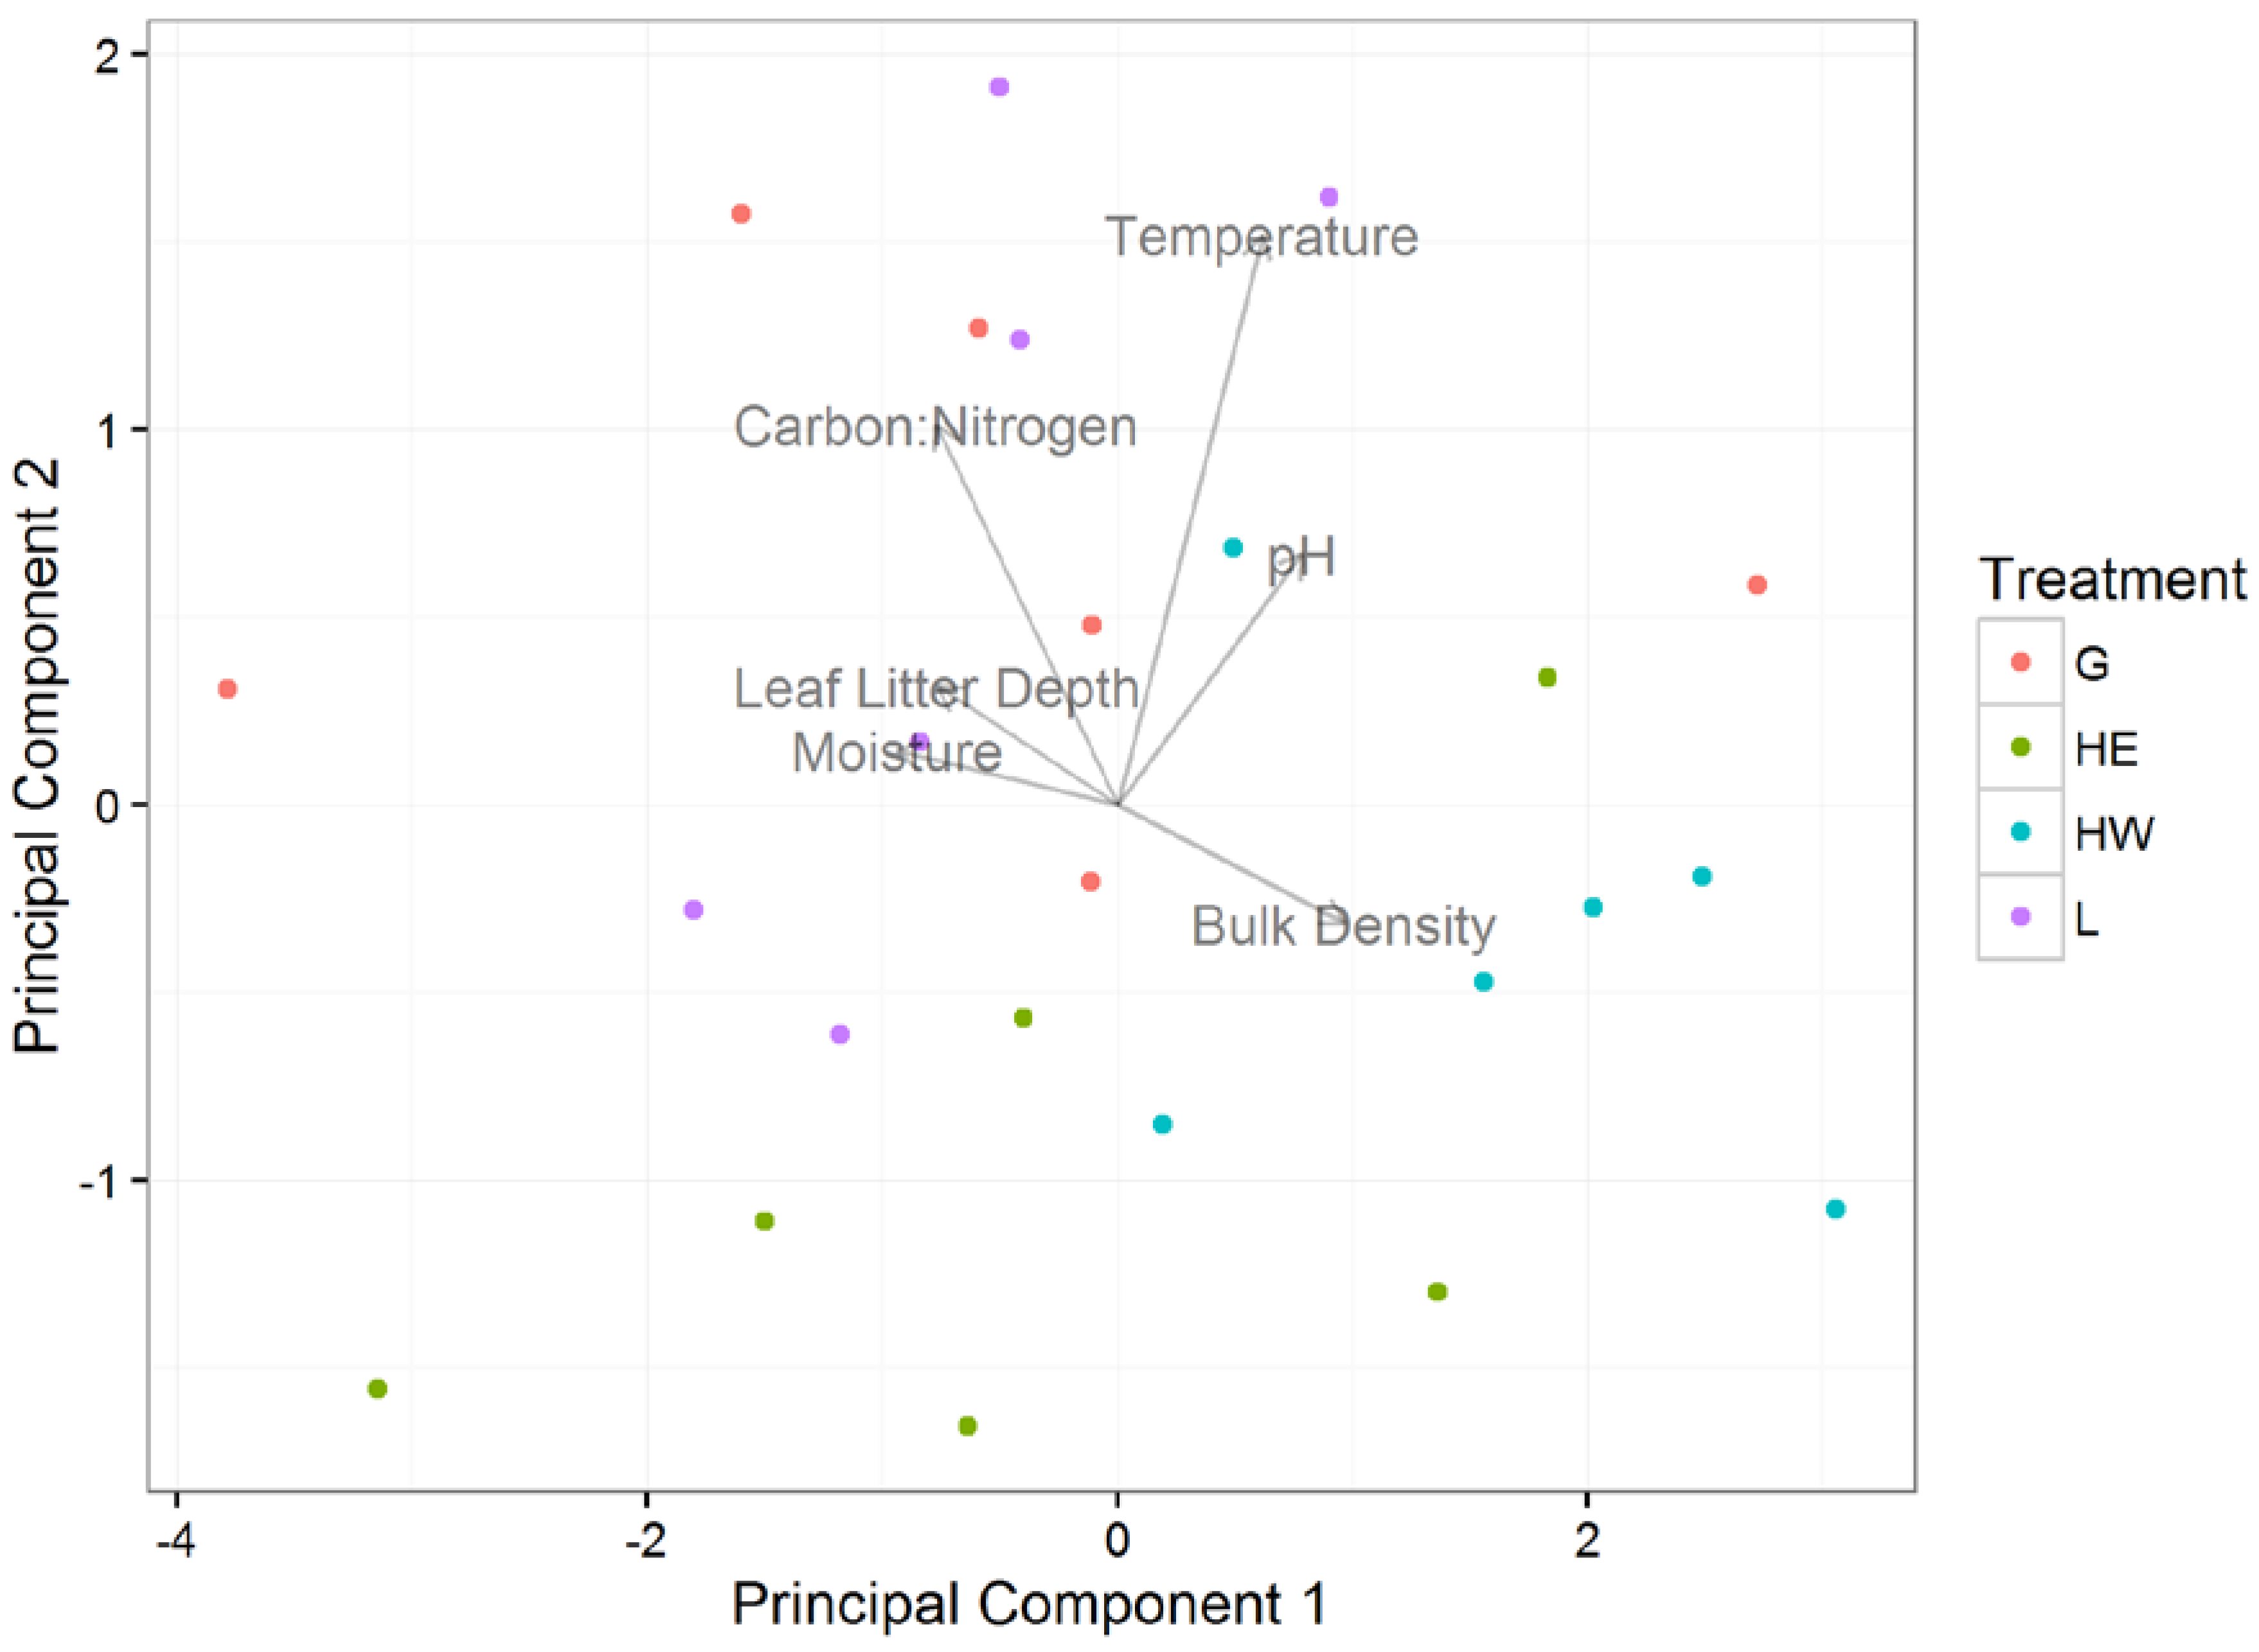
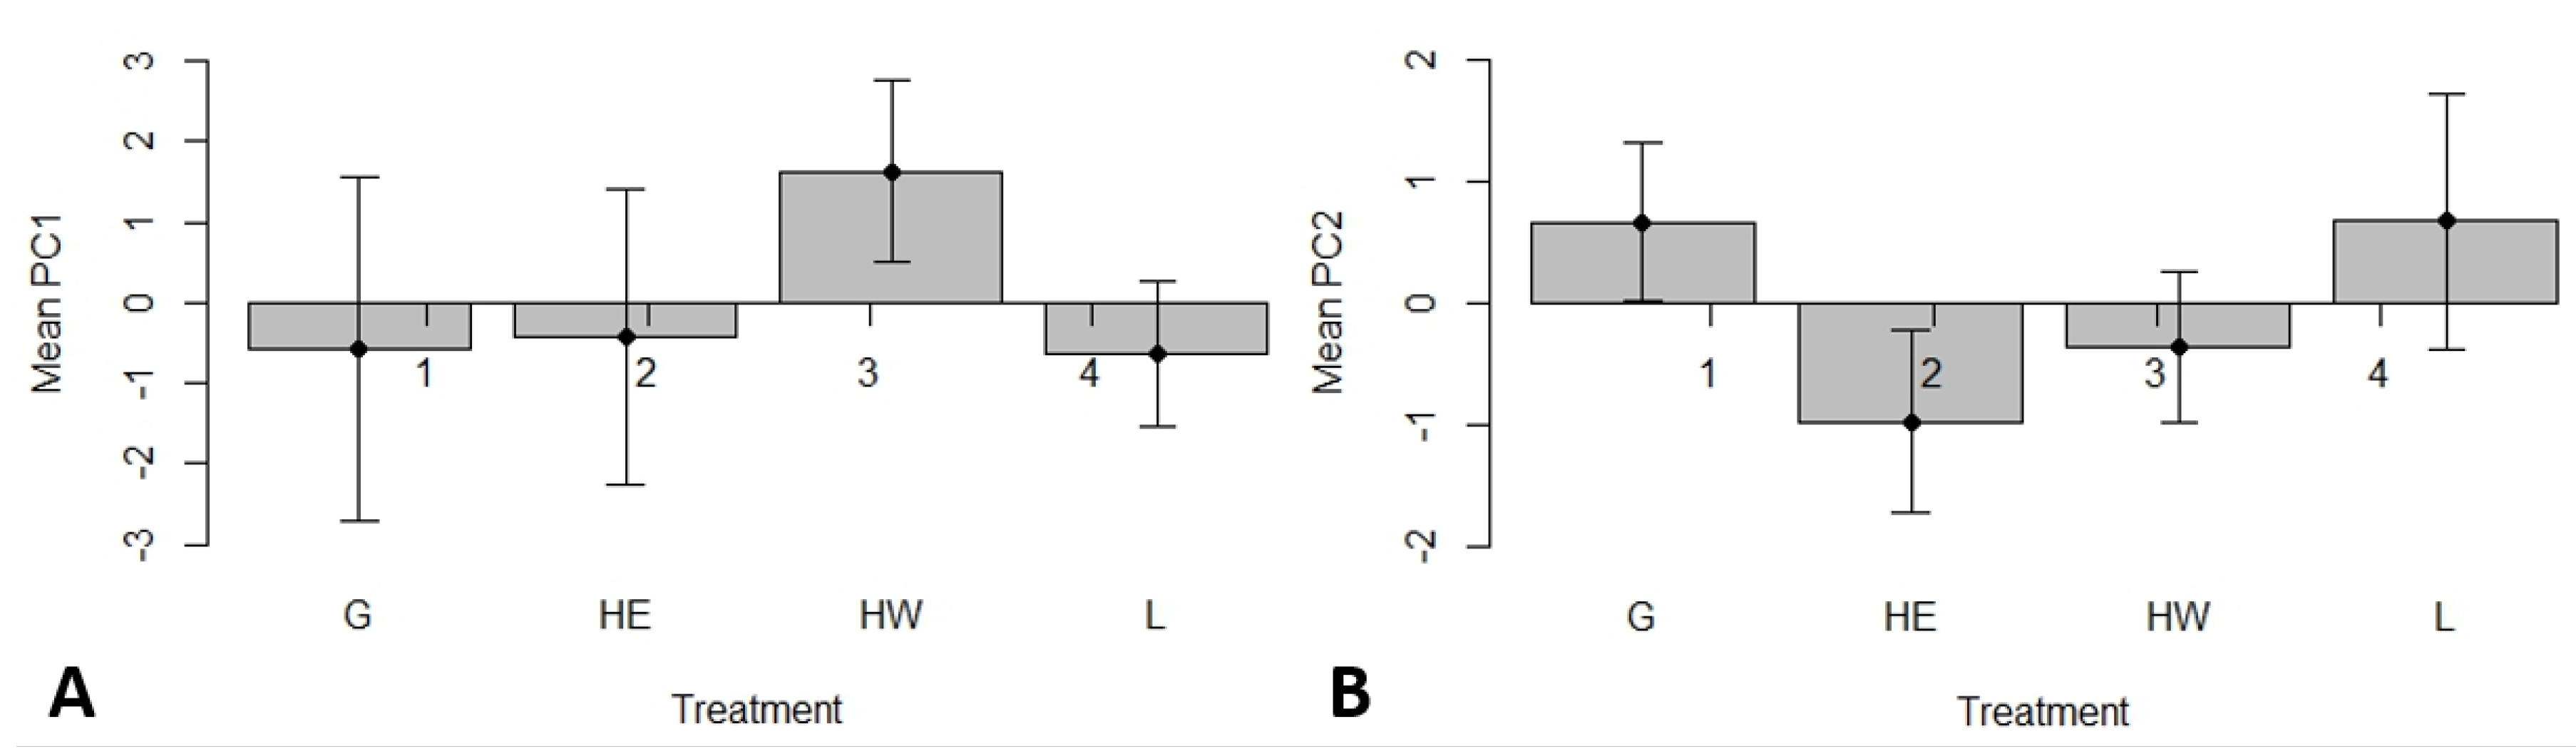
3.1. Effects of Plot Treatment on Soil Characteristics and Salamander Relative Abundance

The study did not find a significant difference in PC1 between treatments (p = 0.0617, df = 20, F = −2.9). Mean PC1 was higher in hardwood control plots, but similar between girdled, logged, and hemlock control plots (Figure 4A). PC1 reflected the bulk density, leaf litter, and soil moisture, with a higher PC1 such as that in hardwood control plots indicating a higher bulk density, lower leaf litter, and lower soil moisture (Figure 2).
The study found a significant difference in PC2 between treatments (p = 0.0032, df = 20, F = 6.4). The mean PC2 was higher in girdled and logged plots and lower in hemlock and hardwood control plots. Hardwood control plots had a higher mean PC2 than hemlock control plots (Figure 4B). PC2 primarily looked at the C:N, soil temperature, and soil pH, and a lower PC2 indicating a lower C:N, temperature, and pH (Figure 2). Thus, the study found a lower C:N, temperature, and pH in the hemlock control plots than the other plots, and a higher C:N, temperature, and pH in the girdled and logged plots.

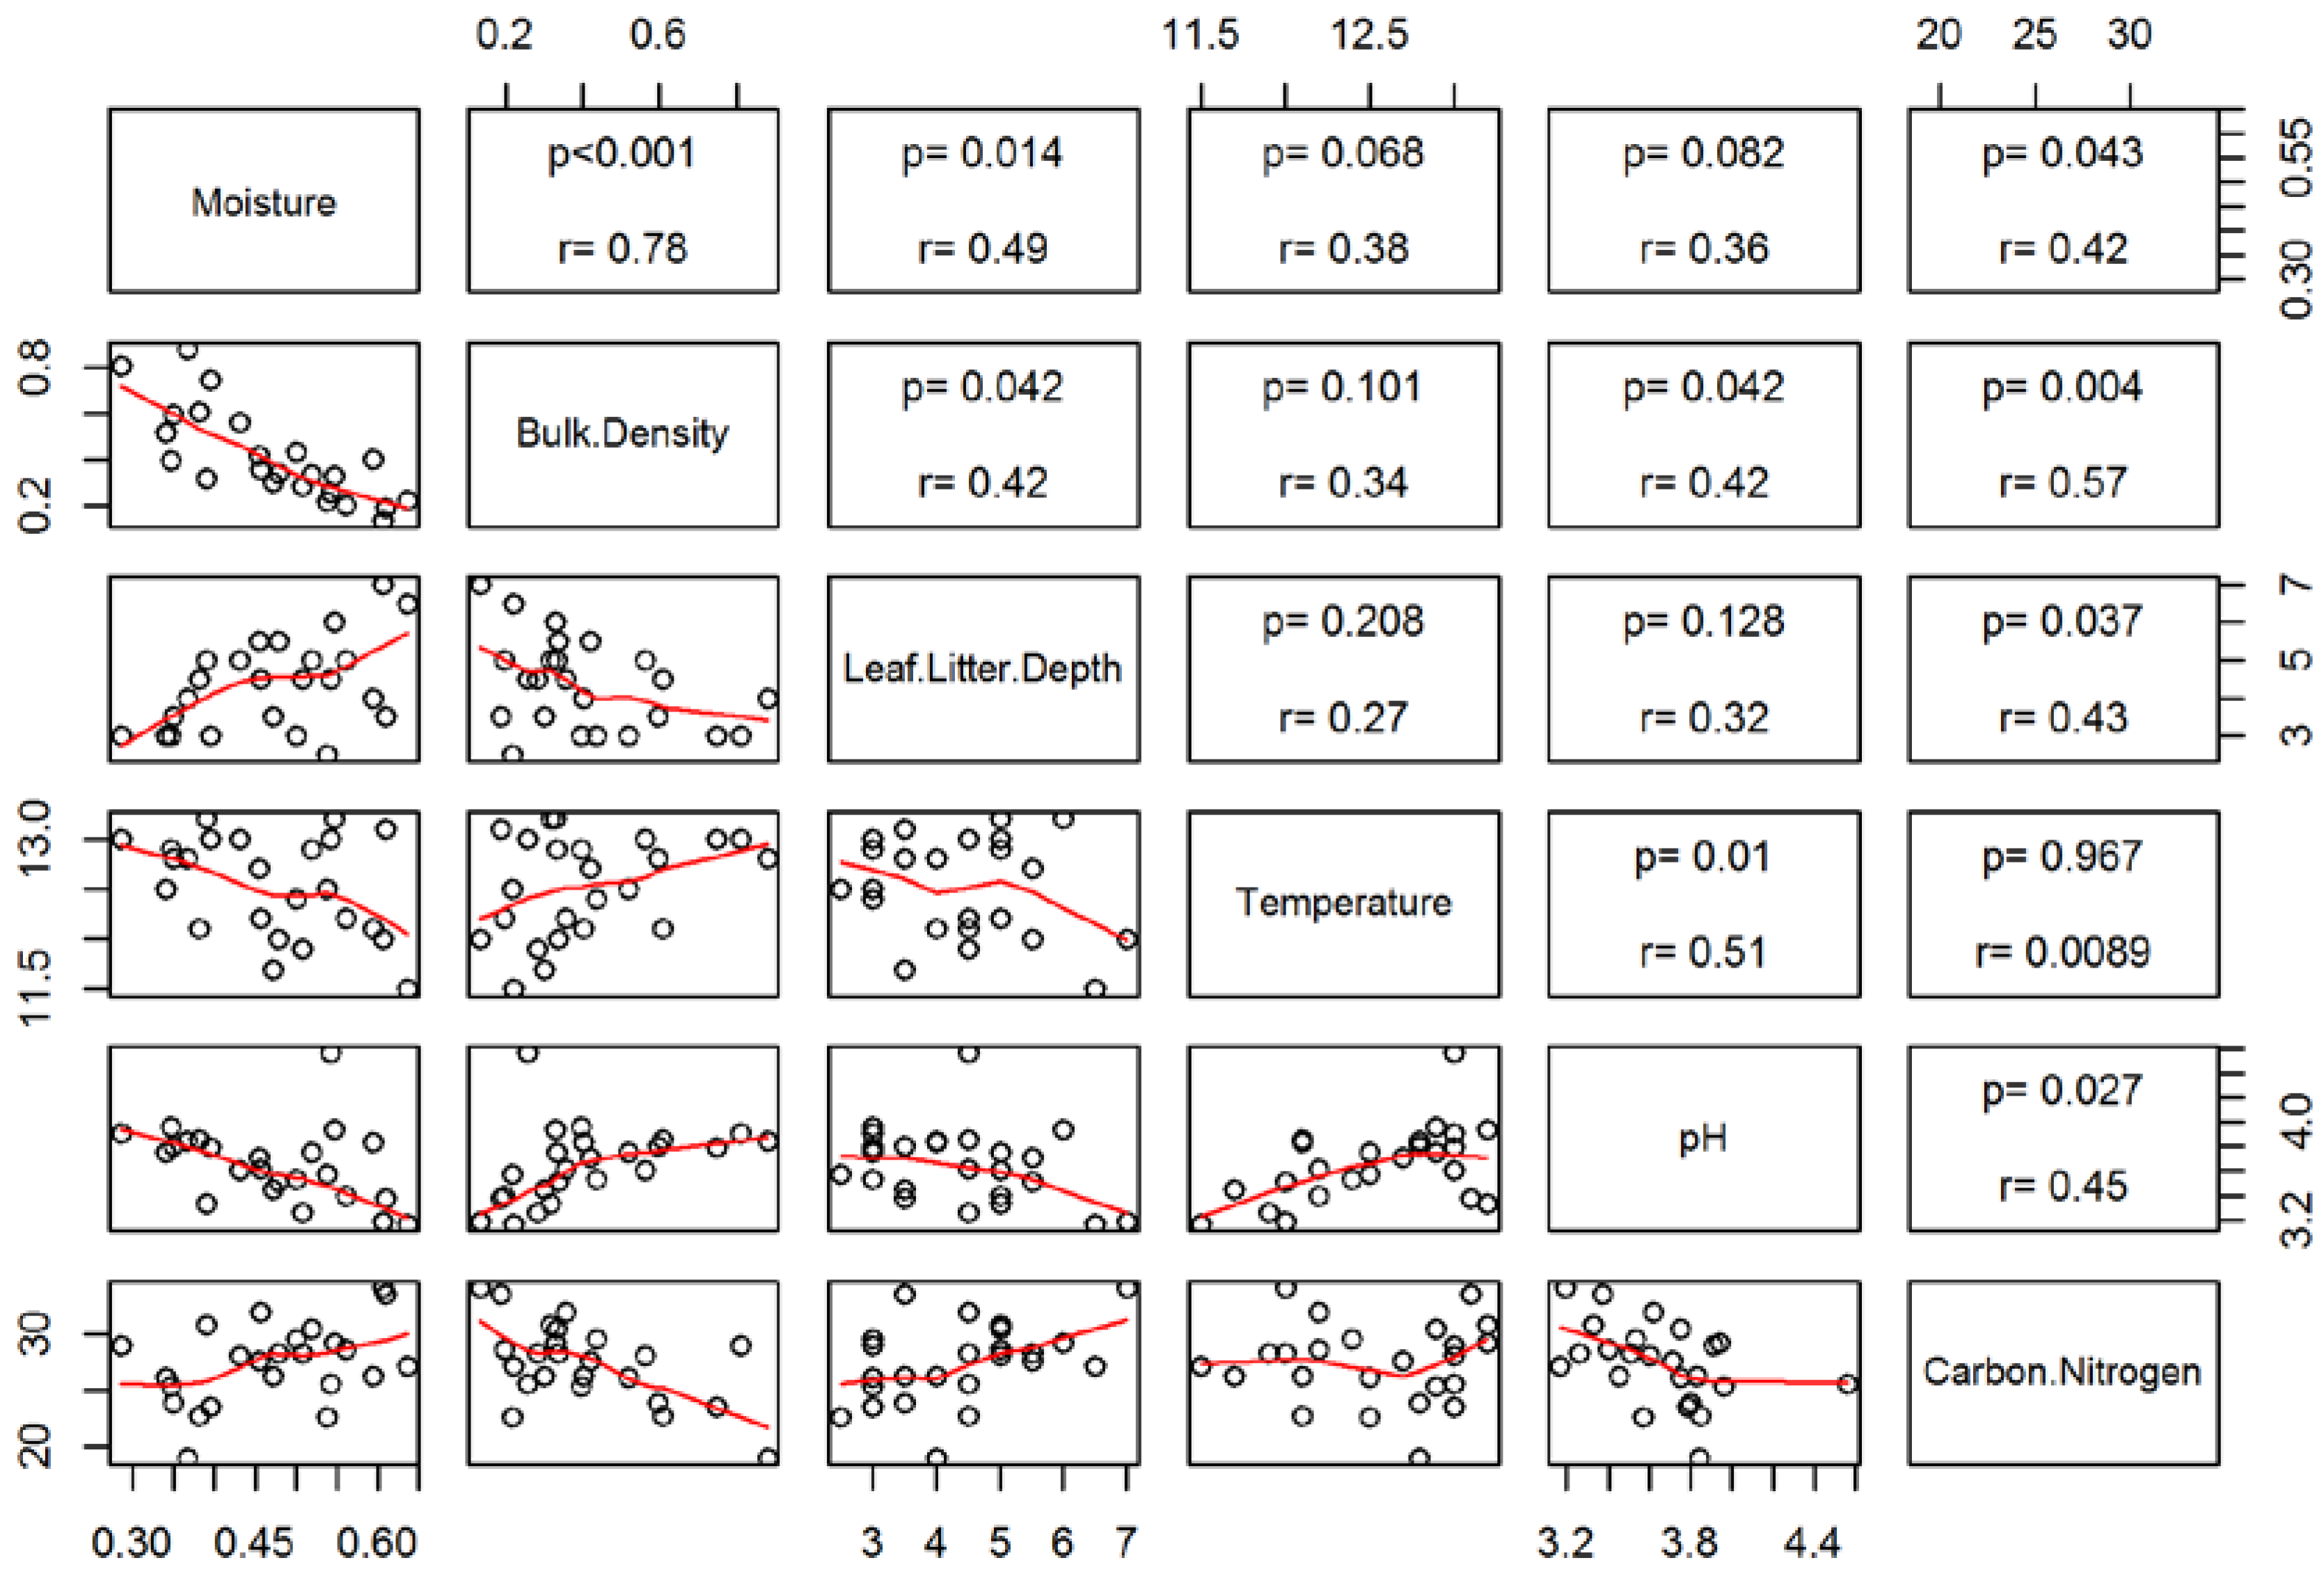
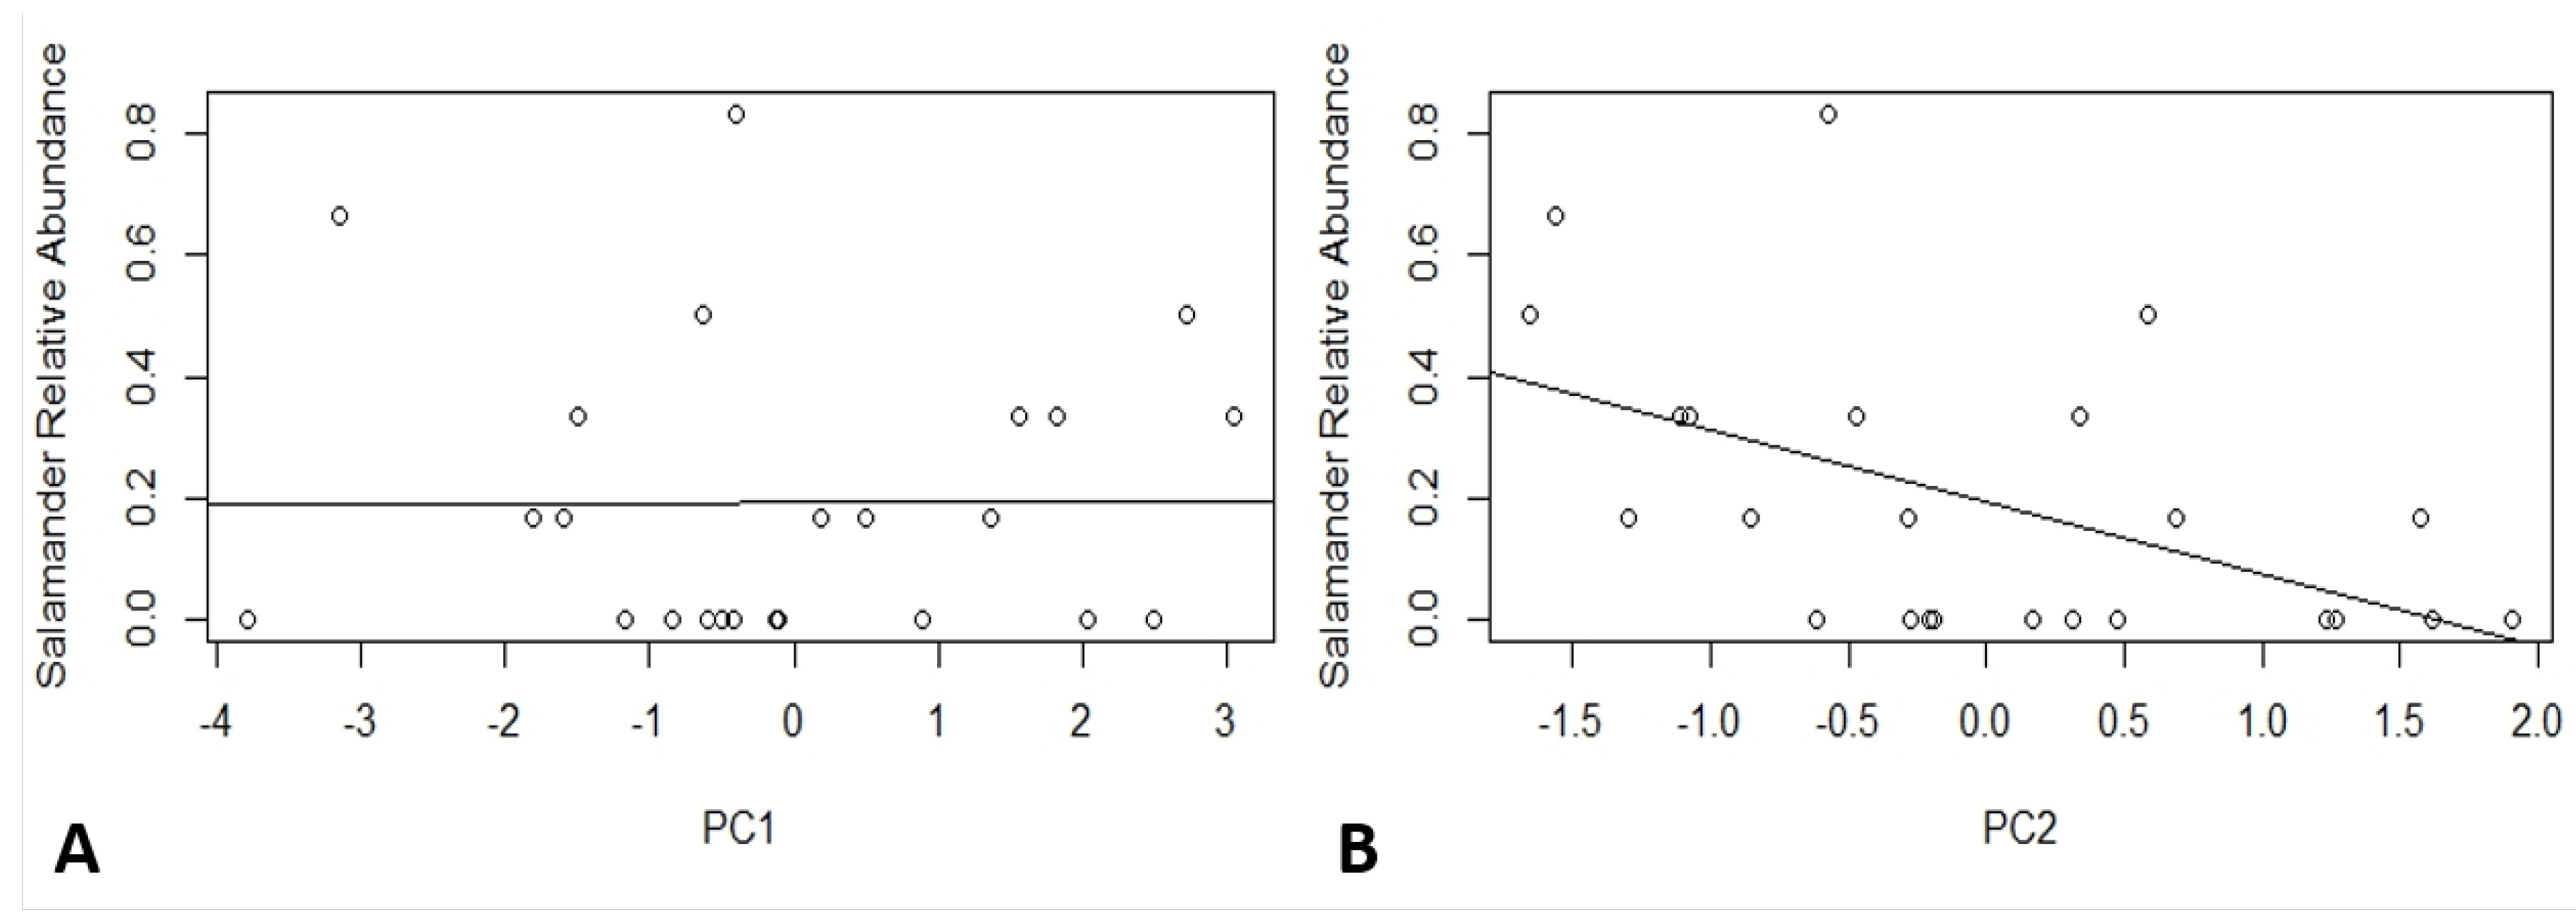
3.2. Soil Characteristics and Salamander Relative Abundance

This study did not find a significant relationship between PC1 and salamander relative abundance (p = 0.9877, R2adj = −0.045). The high p-value and low coefficient (0.0004) suggest that any relationship between PC1 and salamander relative abundance is very weak and likely nonexistent (Figure 5A). However, a significant negative linear relationship was detected between PC2 and salamander relative abundance (p = 0.01185, R2adj = 0.221). The p-value suggests that the chance of finding the slope from our data if there is no correlation is extremely low, and the R2adj examines the distance of the data from the regression line. Salamanders were more abundant where PC2 was low, indicating a lower C:N, soil temperature, and soil pH (Figure 5B).

4. Discussion

Our data show a distinct difference in PC2 between plot treatments, and a noticeable correlation between PC2 and salamander relative abundance. With clear relationships between the variables, this supports red-backs being affected by PC2, which is affected by plot type. As the plots reflected forest changes due to HWA invasion, our data support that invasion by HWA affects the forest and causes changes in some soil characteristics, which affects red-backs.
Changes in forest composition are likely to affect soil qualities [32]. The increase in the C:N, temperature, and pH in the soil from a hemlock plot to a girdled or logged plot shows how the loss of the hemlocks affects the soil. As the hemlock dies, more light becomes available, which can raise the temperature of the soil [13]. Deciduous trees replace the fallen hemlocks, with a higher C:N in their leaves [33] which is transferred through the leaf litter to the soil [34]. The pH can be lower in conifer forests than in hardwood forests [33], so vegetation changes would likely affect this variable. Our data support that the changes and loss of the hemlock forest as indicated by plot treatment are affecting the quality of the soil.
Red-backs have been shown to have close relationships to the soil [20]. Our study showed that they were more prevalent in areas with a lower pH, C:N, and temperature. Because they breathe through their skin and so must remain moist, plethodontid salamanders such as red-backs have been shown to prefer cooler temperatures in the soil [22] which can affect rehydration rates. They generally prefer a higher pH, as this helps them maintain a sodium balance [23], but if the temperature fluctuates greatly this may overshadow any effect the pH may have on the salamander relative abundance. Cameron et al. [25] also found that red-backs may not be affected by small changes in pH, and while pH may also affect red-back prey communities, the salamanders’ generalist nature could allow them to vary their diet and avoid such effects. It was noted that the temperature had a higher standard deviation (0.51) than the pH (0.31) in this study. In light of this, it is possible that the relationship between the soil quality and red-back abundance in this study was primarily influenced by the soil temperature rather than the pH. Our analysis does support that changes in soil quality are correlated to salamander relative abundance.

5. Conclusions

The decline in the hemlock forests and the succession of hardwood forests is likely to affect many species, not only red-backs. Further studies should examine how other critical species will be affected by these changes, as well as exploring how red-backs will react in the long term to the loss of hemlock forests. A wider scale should also be considered, as other species may colonize or dominate the failing hemlock forest, with different effects on soil and fauna. It may also be worth exploring the use of red-backs as an indicator species for hemlock forest health in the face of HWA invasion, as they appear to respond significantly to such events and have been suggested as indicators of forest conditions [35].
Overall, this study has demonstrated the impacts of decline in hemlock forests on red-backed salamanders through changes in soil characteristics. These conclusions are timely and consistent with many recent studies in the region [36,37,38] that found a declining trend in abundance of red-backs in New England forests. Moreover, although the coverage of this study is relatively small, it confirmed our expectations regarding the contribution of invasive pests and habitat disturbances to the wide scale decline of amphibian populations.

Acknowledgments

We thank Harvard Forest for their support of this project which was conducted under Harvard Forest’s Ecology program for Research Experience for Undergraduates, 2014, supported by NSF grant 10-03938. We also thank Claudia Villar-Leeman and Simone Johnson for field assistance and data collection, and Aaron Ellison for assistance with editing, project design, and statistical advice.

Author Contributions

Alison Ochs and Ahmed A. H. Siddig conceived and designed the experiments; Alison Ochs performed the experiments with some assistance from Ahmed A. H. Siddig; Alison Ochs analyzed the data; equipment and materials were provided by Harvard Forest; Alison Ochs wrote the paper and Ahmed A. H. Siddig assisted with editing.

Conflicts of Interest

The authors declare no conflict of interest.

References

  1. Cheah, C.; Montegomery, M.; Salem, S.; Parker, B.; Skinner, M.; Costa, S.; Reardon, R.; Onken, B. Biological Control of Hemlock Woolly Adelgid; Forest Health Technology Enterprise Team: Fort Collins, CO, USA, 2004; p. 22. [Google Scholar]
  2. Mathewson, B. Salamanders in a changing environment on hemlock hill. Arnoldia 2007, 65, 19–25. [Google Scholar]
  3. Ellison, A.M.; Bank, M.S.; Clinton, B.D.; Colburn, E.A.; Elliott, K.; Ford, C.R.; Kloeppel, B.D.; Knoepp, J.D.; Lovett, G.M.; Orwig, D.A.; et al. Loss of foundation species: Consequences for the structure and dynamics of forested ecosystems. Front. Ecol. Environ. 2005, 3, 479–486. [Google Scholar] [CrossRef]
  4. Ellison, A.M.; Barker-Plotkin, A.A.; Foster, D.R.; Orwig, D.A. Experimentally testing the role of foundation species in forests: The Harvard Forest Hemlock Removal Experiment. Methods Ecol. Evol. 2010, 1, 168–179. [Google Scholar] [CrossRef]
  5. Orwig, D.A.; Barker-Plotkin, A.A.; Davidson, E.A.; Lux, H.; Savage, K.E.; Ellison, A.M. Foundation species loss affects vegetation structure more than ecosystem function in a northeastern USA forest. Peer J. 2013, 1, e41. [Google Scholar] [CrossRef] [Green Version]
  6. Orwig, D.A. Ecosystem to regional impacts of introduced pests and pathogens: Historical context, questions and issues. J. Biogeogr. 2002, 29, 1471–1474. [Google Scholar] [CrossRef]
  7. Ushio, M.; Wagai, R.; Balser, T.C.; Kitayama, K. Variations in the soil microbial community composition of a tropical montane forest ecosystem: Does tree species matter? Soil Biol. Biochem. 2008, 40, 2699–2702. [Google Scholar] [CrossRef]
  8. Hajabbasi, M.A.; Jalalian, A.; Karimzadeh, H.R. Deforestation effects on soil physical and chemical properties, Lordegan, Iran. Plant Soil 1997, 190, 301–308. [Google Scholar] [CrossRef]
  9. Zeng, X.; Zhang, W.; Cao, J.; Liu, X.; Shen, H.; Zhao, X. Changes in soil organic carbon, nitrogen, phosphorus, and bulk density after afforestation of the “Beijing–Tianjin Sandstorm Source Control” program in China. Catena 2014, 118, 186–194. [Google Scholar] [CrossRef]
  10. Black, C.A.; Evans, D.D.; Dinauer, R.C. Methods of Soil Analysis, 1st ed.; American Society of Agronomy: Madison, WI, USA, 1965; p. 768. [Google Scholar]
  11. Grossman, R.B.; Reinsch, T.G. Bulk density and linear extensibility. In Methods of Soil Analysis: Part 4 Physical Methods; Dane, J.H., Topp, C.G., Eds.; Soil Science Society of America: Madison, WI, USA, 2002; pp. 201–228. [Google Scholar]
  12. Orwig, D.A.; Cobb, R.C.; D’Amato, A.W.; Kizlinski, M.L.; Foster, D.R. Multi-year ecosystem response to hemlock woolly adelgid infestation in southern New England forests. Can. J. For. Res. 2008, 38, 834–843. [Google Scholar] [CrossRef]
  13. Kizlinski, M.L.; Orwig, D.A.; Cobb, R.C.; Foster, D.R. Direct and indirect ecosystem consequences of an invasive pest on forests dominated by eastern hemlock. J. Biogeogr. 2002, 29, 1489–1503. [Google Scholar] [CrossRef]
  14. Jenkins, J.C.; Aber, J.D.; Canham, C.D. Hemlock woolly adelgid impacts on community structure and N cycling rates in eastern hemlock forests. Can. J. For. Res. 1999, 29, 630–645. [Google Scholar] [CrossRef]
  15. Covington, W.W.; Fule, P.Z.; Moore, M.M.; Hart, S.C.; Kolb, T.E.; Mast, J.N.; Sackett, S.S.; Wagner, M.R. Restoring ecosystem health in ponderosa pine forests of the Southwest. J. For. 1997, 95, 23–29. [Google Scholar]
  16. Scheller, R.M.; Hua, D.; Bolstad, P.V.; Birdsey, R.A.; Mladenoff, D.J. The effects of forest harvest intensity in combination with wind disturbance on carbon dynamics in Lake States Mesic Forests. Ecol. Model. 2011, 222, 144–153. [Google Scholar] [CrossRef]
  17. Talbot, J.M.; Finzi, A.C. Differential effects of sugar maple, red oak, and hemlock tannins on carbon and nitrogen cycling in temperate forest soils. Oecologia 2008, 155, 583–592. [Google Scholar] [CrossRef] [PubMed]
  18. Stadler, B.; Muller, T.; Orwig, D. The Ecology of Energy and Nutrient Fluxes in Hemlock Forests Invaded by Hemlock Woolly Adelgid. Ecology 2006, 87, 1792–1804. [Google Scholar] [CrossRef]
  19. Wyman, R.L. Experimental assessment of salamanders as predators of detrital food webs: Effects on invertebrates, decomposition and the carbon cycle. Biodivers. Conserv. 1998, 7, 641–650. [Google Scholar] [CrossRef]
  20. Welsh, H.H.; Droege, S. A case for using plethodontid salamanders for monitoring biodiversity and ecosystem integrity of North American Forests. Conserv. Biol. 2001, 15, 558–569. [Google Scholar] [CrossRef]
  21. Spotila, J.R. Role of temperature and water in the ecology of lungless salamanders. Ecol. Monogr. 1972, 42, 95–125. [Google Scholar] [CrossRef]
  22. Feder, M.E. Integrating the ecology and physiology of plethodontid salamanders. Herpetologica 1983, 39, 291–310. [Google Scholar]
  23. Wyman, R.L.; Jancola, J. Degree and scale of terrestrial acidification and amphibian community structure. J. Herpetol. 1992, 26, 392–401. [Google Scholar] [CrossRef]
  24. Frisbie, M.P.; Wyman, R.L. The effects of soil pH on sodium balance in the red-backed salamander, plethodon cinereus, and three other terrestrial salamanders. Physiol. Zool. 1991, 64, 1050–1068. [Google Scholar] [CrossRef]
  25. Cameron, A.C.; Hickerson, C.M.; Anthony, C.D. Plethodon cinereus (Eastern Red-Backed Salamander) Not Affected by Long-Term Exposure to Soil Liming. Northeast. Nat. 2016, 23, 88–99. [Google Scholar] [CrossRef]
  26. Siddig, A.A.; Ellison, A.M.; Jackson, S. Calibrating abundance indices with population size estimators of red back salamanders (Plethodon cinereus) in a New England forest. Peer J. 2015, 14, e952. [Google Scholar] [CrossRef] [PubMed]
  27. Pankhurst, C.; Doube, B.M.; Gupta, V. Biological Indicators of Soil Health; Cab International: Wallingford, UK, 1997. [Google Scholar]
  28. Compton, J.; Boone, R.; Motzkin, G.; Foster, D. Soil carbon and nitrogen in a pine-oak sandplain in central Massachusetts: Role of vegetation and land-use history. Oecologia 1998, 116, 536–542. [Google Scholar] [CrossRef]
  29. Luo, Y.; Durenkamp, M.; De Nobili, M.; Lin, Q.; Brookes, P.C. Short term soil priming effects and the mineralisation of biochar following its incorporation to soils of different pH. Soil Biol. Biochem. 2011, 43, 2304–2314. [Google Scholar] [CrossRef]
  30. Amacher, M.C.; O’Neill, K.P.; Dresbach, R.; Palmer, C. Forest Inventory and Analysis: Manual of Soil Analysis Methods; US Forest Service: Washington, D.C., USA, 2003.
  31. R Core Team. R: A Language and Environment for Statistical Computing; R Foundation for Statistical Computing: Vienna, Austria, 2016. [Google Scholar]
  32. Orwig, D.; Foster, D. Forest response to the introduced hemlock woolly adelgid in southern New England, USA. J. Torrey Bot. Soc. 1998, 125, 60–73. [Google Scholar] [CrossRef]
  33. Lutz, H.; Chandler, R.J. Forest Soils; John Wiley and Sons, Inc.: New York, NY, USA, 1946; p. 514. [Google Scholar]
  34. D’Amico, M.E.; Bonifacio, E.; Zanini, E. Relationships between serpentine soils and vegetation in a xeric inner-Alpine environment. Plant Soil 2014, 376, 111–128. [Google Scholar] [CrossRef]
  35. Welsh, H.H.; Hodgson, G.R. Woodland salamanders as metrics of forest ecosystem recovery: A case study from California’s redwoods. Ecosphere 2013, 4, 1–25. [Google Scholar] [CrossRef]
  36. Highton, R. Declines of eastern North American woodland salamanders (Plethodon). In Amphibian Declines: The Conservation Status United States Species; University of California Press: Berkeley, CA, USA, 2005; pp. 34–46. [Google Scholar]
  37. Hocking, D.J.; Connette, G.M.; Conner, C.A.; Scheffers, B.R.; Pittman, S.E.; Peterman, W.E.; Semlitsch, R.D. Effects of experimental forest management on a terrestrial, woodland salamander in Missouri. For. Ecol. Manag. 2013, 287, 32–39. [Google Scholar] [CrossRef]
  38. Siddig, A.A.H.; Ellison, A.M.; Mathewson, B.G. Assessing and predicting the impacts of the decline of eastern hemlock (Tsuga canadensis) stands on the occurrence of terrestrial amphibians in New England Forest. Ecosphere 2016. [Google Scholar] [CrossRef]
Figure 1. Study locations, treatments of the Harvard Forest Hemlock Removal Experiment (HF-HeRE) eight 0.8 ha plots (HE = Hemlock Control, G = Girdling, L = Logging, and HW = Hardwood Control), and sampling transects within HF-HeRE in the Simes Tract at the Harvard Forest, MA, USA.
Environments 04 00008 g001
Figure 2. Correlation matrix of soil variables. Upper panel report p-value (p) and correlation coefficient (r) between variables, lower panels plot variables against each other. Correlations with r values above 0.10 were considered high.
Environments 04 00008 g002
Figure 3. Biplot displaying variation used by principle component analysis (PCA), with each sample represented by a number in the plot. As principle component 1 (PC1) increases, soil temperature, soil pH, and bulk density increases, while other variables decrease. As principle component 2 (PC2) increases, soil temperature, C:N, and pH increases.
Environments 04 00008 g003
Figure 4. Barplots showing mean PC scores across treatments (G = girdled, HE = hemlock control, HW = hardwood control, L = logged). (A) Mean PC1 across treatments; (B) Mean PC2 across treatments.
Environments 04 00008 g004
Figure 5. Scatterplots with linear regression model showing relationship between salamander relative abundance and PC scores. (A) Salamander relative abundance versus PC1; (B) Salamander relative abundance versus PC2.
Environments 04 00008 g005
Table 1. Principle component analysis (PCA) loadings and results, with loadings for each variable, standard deviation, proportion of variance, and cumulative proportion of variance reported for six sets of principle component scores (PC1–PC6).
LoadingsPC1PC2PC3PC4PC5PC6
Moisture−0.469340.072315−0.493280.2140780.3766230.586082
Bulk Density0.483433−0.157820.259876−0.408740.1112610.703138
Leaf Litter Depth−0.383160.157665−0.14678−0.880090.062283−0.16838
Temperature0.3089390.7596480.0957880.0499760.545623−0.13459
pH0.393070.334458−0.65131−0.05968−0.544480.097004
Carbon:Nitrogen−0.386340.5060410.4839510.08056−0.497730.325926
Importance of ComponentsPC1PC2PC3PC4PC5PC6
Standard deviation1.76241.02850.86410.79990.523110.41958
Proportion of Variance0.51770.17630.12440.10660.045610.02934
Cumulative Proportion0.51770.6940.81840.92510.970661

