Article

Land Use Planning and Wildlife-Inflicted Crop Damage in Zambia

by
Mitelo Subakanya
1,
Gelson Tembo
2 and
Robert B. Richardson
3,*
1
Indaba Agricultural Policy Research Institute, Lusaka 10101, Zambia
2
Department of Agricultural Economics and Extension, University of Zambia, Lusaka 10101, Zambia
3
Department of Community Sustainability, Michigan State University, East Lansing, MI 48824, USA
*
Author to whom correspondence should be addressed.
Environments 2018, 5(10), 110; https://doi.org/10.3390/environments5100110
Submission received: 4 August 2018 / Revised: 21 September 2018 / Accepted: 23 September 2018 / Published: 28 September 2018
(This article belongs to the Special Issue Agricultural Ecosystem Services)

Abstract

:
Damage to crops from wildlife interference is a common threat to food security among rural communities in or near Game Management Areas (GMAs) in Zambia. This study uses a two-stage model and cross-sectional data from a survey of 2769 households to determine the impact of land use planning on the probability and extent of wildlife-inflicted crop damage. The results show that crop damage is higher in GMAs as compared to non-GMAs, and that land use planning could be an effective tool to significantly reduce the likelihood of such damage. These findings suggest that there is merit in the current drive to develop and implement land use plans to minimize human-wildlife conflict such as crop damage. This is especially critical as Zambian conservation policies do not explicitly provide compensation for damage caused by wildlife.

1. Introduction

In sub-Saharan Africa, the basic needs of most rural poor households—food, water, fuel, clothing and shelter—are usually met by natural resources and ecosystem services from the land around them. However, the increase in population growth means that the capacity of the land to support increasing demands continues to diminish [1,2]. In areas around game reserves, agriculture also must compete with wildlife for resources. The ever-increasing demand for land among competing uses suggests a need for land use planning to maximize benefits, minimize losses, and avoid conflict.
The objective of a land use plan is to select and put into practice those land uses that will best meet the needs of the people while safeguarding resources for the future [1]. In Zambia, land use planning in Game Management Areas (GMAs) has been promoted and facilitated by the former Zambia Wildlife Authority (ZAWA) since around 1998 (in 2015, ZAWA was replaced by the Department of National Parks and Wildlife). In Zambia, preparation of land use plans involves the standard format determined by ZAWA and involves a strategic planning process, which addresses ecologically complex areas as influenced by ecological and socio-economic forces surrounding the protected areas [3]. Land use planning is an activity that involves analysis of future community needs, and it typically involves public engagement regarding community goals, alternatives for the future, and the development of a community vision. Land use planning is a consultative process involving stakeholders including the local communities which shows how a particular GMA should be managed [3]. Land use planning has the benefit of increasing agricultural production [4] due to the decrease in wildlife-inflicted damage to the crops in the protected areas. Land use planning is a very important step that should be taken if wildlife conservation is to be effective, because a land use plan will identify appropriate land uses around the GMA [5].
GMAs are defined as buffer zones around national parks in which licensed safari and subsistence hunting are permitted. These are areas where human settlements are allowed to co-exist with wildlife. GMAs were therefore formed to promote wildlife conservation [6] while giving benefits to the rural communities at the same time [7,8]. Benefits which come through from incomes generated from licensed safari and substance hunting, are meant to encourage the communities to help conserve wildlife. Yet, empirical evidence suggests that protected areas like the GMAs are associated with high incidence of wildlife-inflicted crop damage [8,9,10,11,12,13,14,15,16], arguably contributing to rural poverty. This problem is common where conservation is promoted alongside human habitats. In several conservation areas of Nepal, for example, wildlife-inflicted crop damage is rampant [15,17]. Like in Zambia, most of the crop damage in developing countries is caused by elephants [10,15,17,18,19,20,21,22,23] and almost virtually uncompensated [8].
Alternative methods used by households living in GMAs to drive away wildlife from their agricultural fields such as drum beating, fire, and physically guarding the fields, have proved largely ineffective [15,19]. Electric fencing also proved ineffective in Zambia’s Luangwa National Park, whereas village scouts, who could help in some instances, were very slow in responding to the problem of crop damage by wildlife [10]. To many planners, this identifies the need to develop and implement new and more effective ways of solving this problem [11]; ones that can enhance conservation without significantly jeopardizing human livelihoods. Some contend that land use planning should be an important component of such a solution set [20].
The study reported in this paper uses survey data from Zambia’s GMAs to examine the impact of land use planning on wildlife-inflicted crop damage. To the best of our knowledge, no study has done this before. This report is arranged as follows: Section 2 provides background on wildlife conservation and GMAs in Zambia; Section 3 focuses on the conceptual framework, whilst the methods are discussed in Section 4, and include data and data sources and the model specification; results and discussion are presented in Section 5; and finally, the summary and conclusions are presented in Section 6.

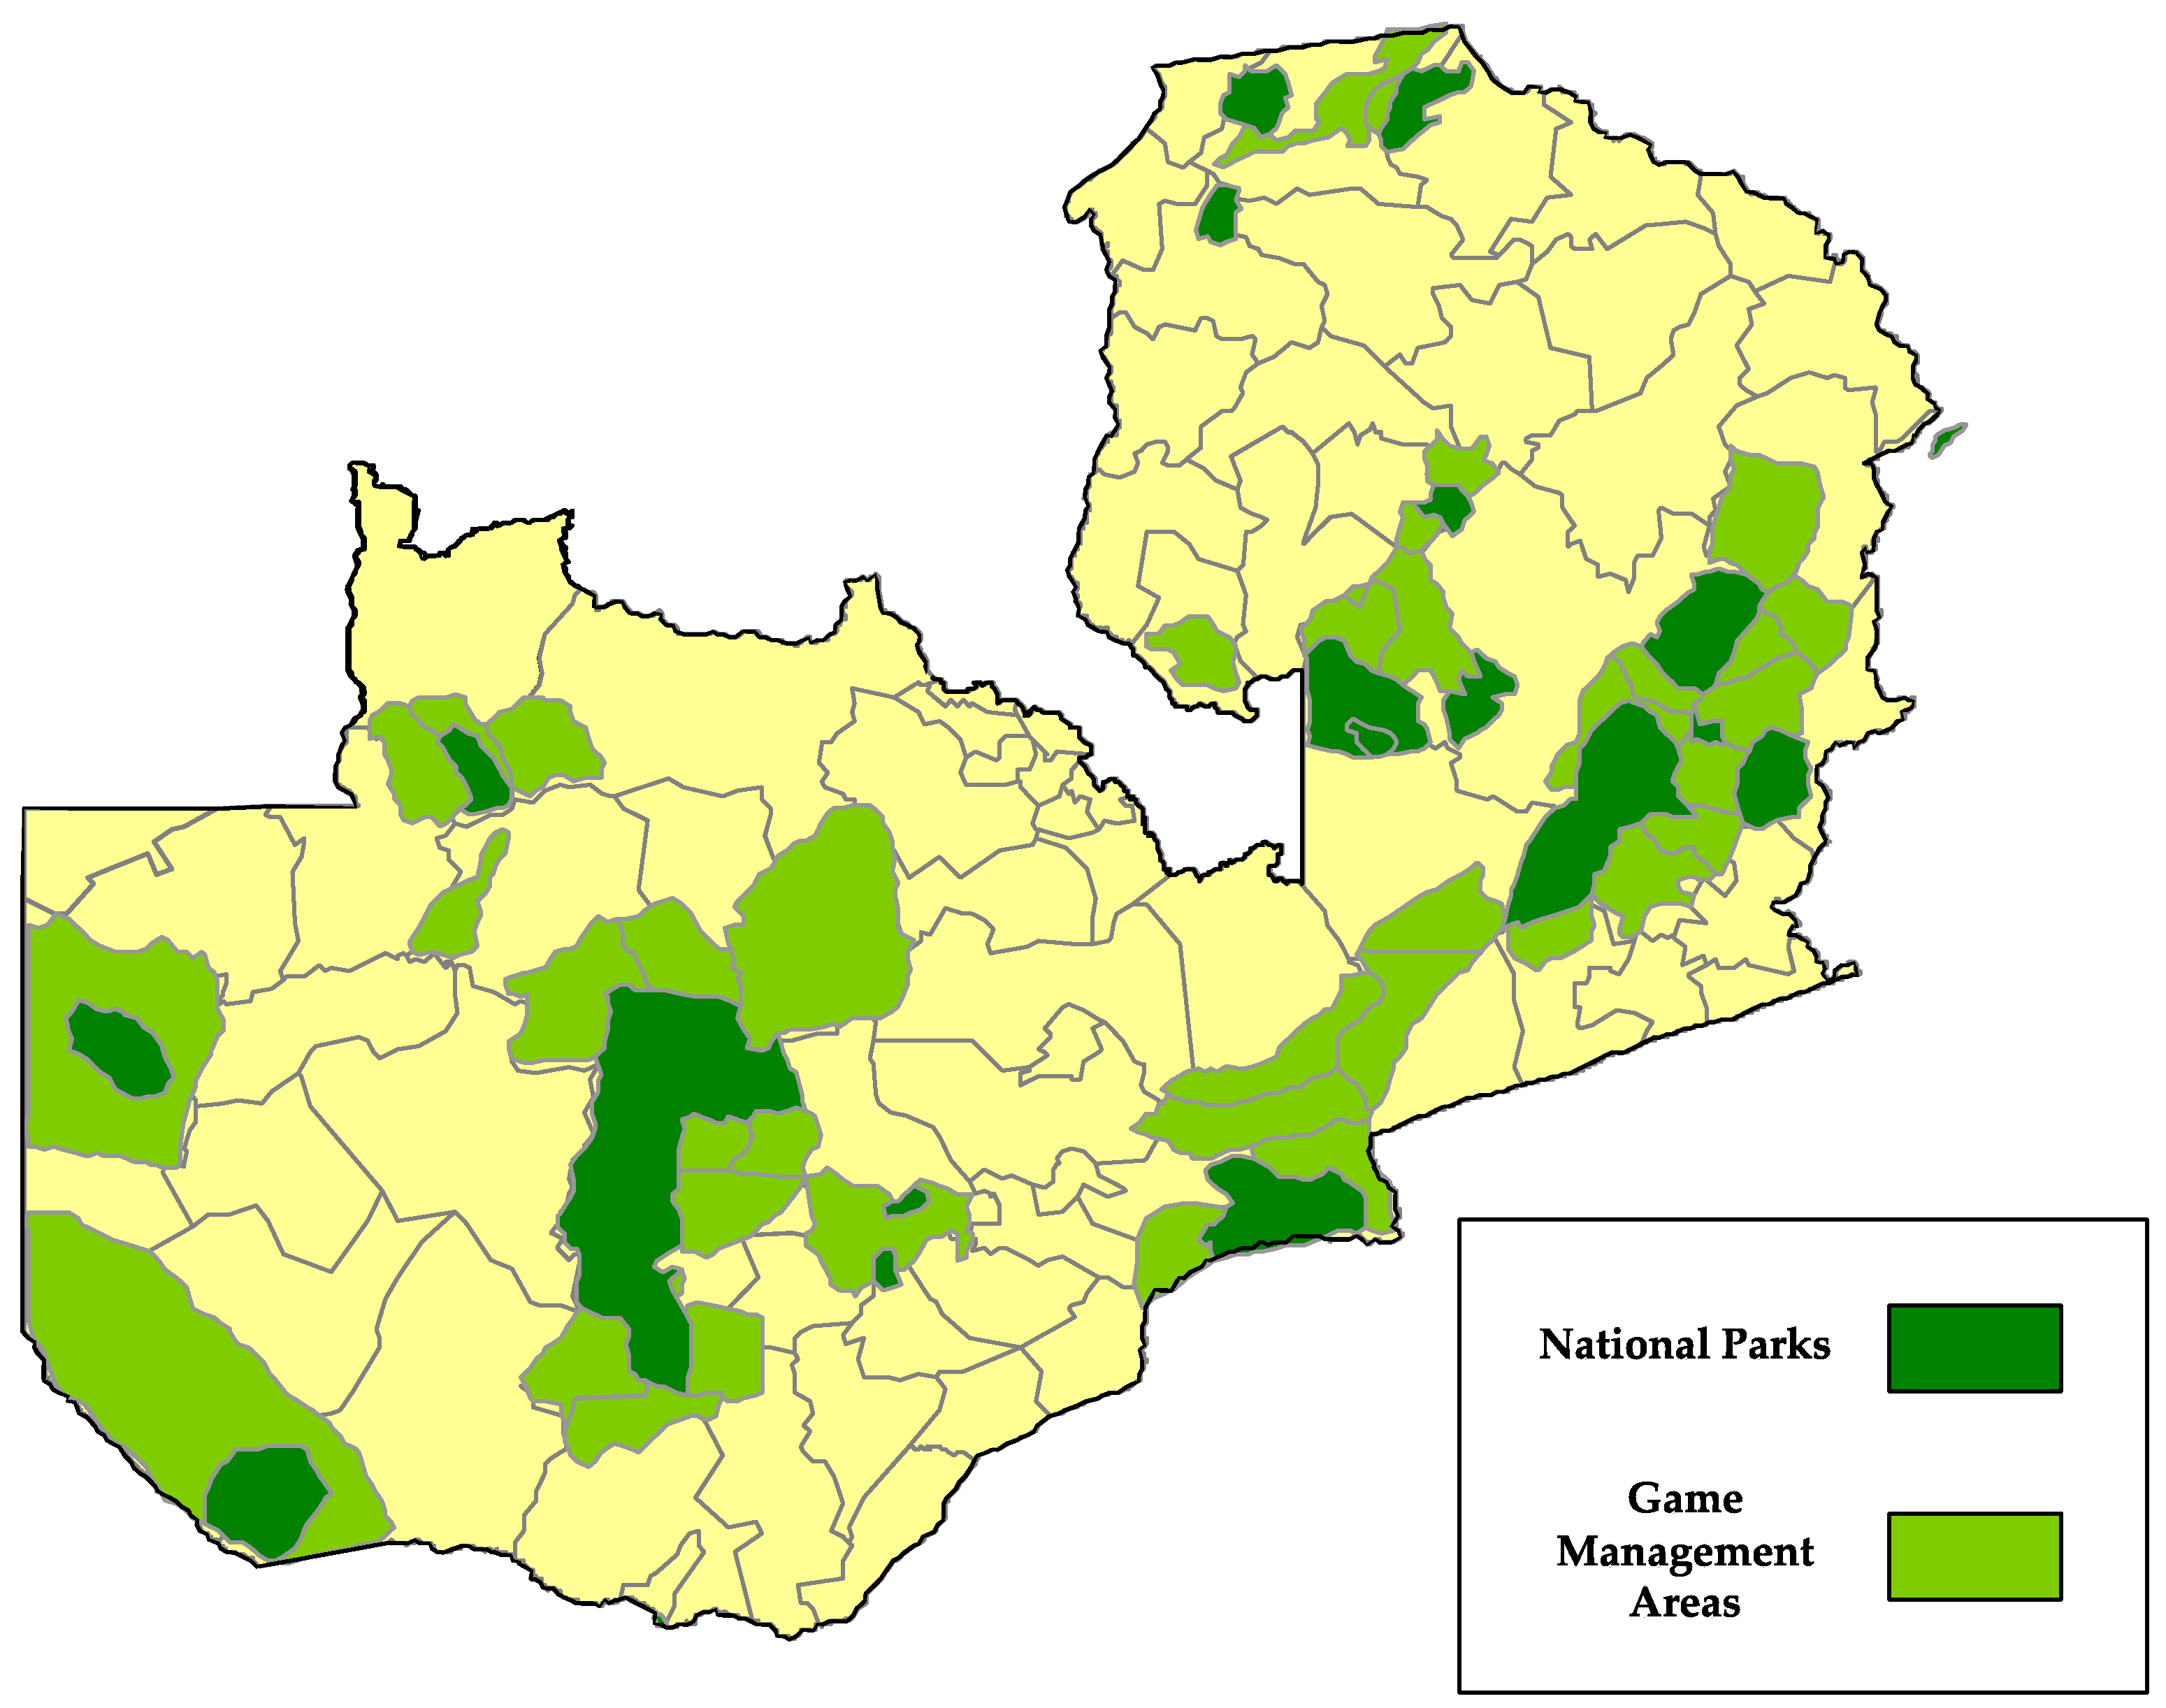
2. Game Management Areas in Zambia

GMAs were declared in the National Parks and Wildlife Act in 1971 where protected areas were reduced to two categories: National Parks and GMAs. This Act was then replaced by the National Parks and Wildlife Act No. 10 of 1991 and later the Zambia Wildlife Act No. 12 of 1998 which established ZAWA. It was also in this Act that the inclusion of local community participation in wildlife conservation was done. ZAWA was the agency responsible for the management of the National Parks and GMAs, with GMAs managed in partnership with the communities through the Community-Based Natural Resource Management (CBNRM) program. A share of revenue collected from hunting licenses is used by the rural communities to employ village scouts and to support development projects, such as schools and clinics through the Community Resource Boards (CRBs) and the Village Action Groups (VAGs) [8,24].
Even with the positive benefits of the CBNRM program (such as creation of employment opportunities [25]), problems like crop damage can lead to negative impacts. Currently, policies do not give any form of compensation to rural farming households that live in the GMAs if wildlife causes damage to their crops [8].
At the time of this study, there were 36 GMAs and 19 national parks distributed around the country (see Figure 1). ZAWA used revenue collected from hunting as a basis for GMA categorization [8]. The four categories of GMAs are: (i) prime, (ii) secondary, (iii) specialized, and (iv) under-stocked. In prime GMAs, there is a relatively greater abundance and diversity of wildlife species, particularly trophy species that are valued by licensed hunters, while in the secondary GMAs wildlife species are less abundant. Sustained hunting can take place in both GMA types. Specialized GMAs have fewer numbers of wildlife species (usually species in the Bovidae family, such as antelopes, impalas, and wildebeests, among others) and are found in wetland areas. As the name suggests, the fourth category, under-stocked, refers to GMAs that have suffered losses to wildlife abundance and diversity, primarily due to uncontrolled hunting and poaching [8].

3. Conceptual Framework

Crop damage from wildlife is a big challenge that farmers face in areas where wildlife and humans must co-exist. Communities participate in wildlife conservation in Zambia through representation in CRBs and VAGs. Although literature has demonstrated that communities do benefit from CBNRM programs [24], losses from crop damage from wildlife can have deleterious effects in rural food security. A land use plan, by design, is expected to influence the way people use their land [1] and to respect land set aside for wildlife. In Zambia, preparation of land use plans includes a strategic planning process that considers the ecological and socioeconomic dynamics of the protected areas.
Land use planning process involves participation from different relevant stakeholders including the rural community. The inclusion of the local community members in land use planning is important, as they better understand the local context and social-ecological dynamics. Ostrom [26] pointed out how community members can organize themselves to achieve certain goals such as land use planning. Thus, the conceptual framework supporting this study proposes that communities that have developed land use plans are expected to experience less human-wildlife conflict and to suffer less crop damage compared to those that have not developed any land use plan.
Even with the social and financial benefits of the CBNRM program, problems like crop damage from wildlife can lead to negative welfare impacts. Currently, policies do not allow for any form of compensation to rural farming households that live in the GMAs in the event of wildlife-inflicted crop damage [8], unlike in other countries such as Botswana [27]. Land use planning is sporadic among VAGs and CRBs, as the practice has not been promoted widely. The existence of land use plans in GMAs allows for the examination of their impact on the probability and extent of losses from wildlife-inflicted crop damage.

4. Methods

4.1. Data

Nationally representative data covering 2769 households from the Impact of Game Management Areas on Household Welfare survey (IGMAW), which was jointly commissioned by the Natural Resources Consultative Forum (NRCF), the World Bank, and ZAWA, as part of an effort to inform policy on the effectiveness of the GMA arrangements, were used. The objective of the survey was to estimate the effects of GMAs on the economic welfare of rural households residing within their borders. The survey covered areas adjacent to four national park systems: (i) Bangweulu (including Isangano, Lavushi and Kasanka National Parks), (ii) Kafue (including Kafue, Blue Lagoon and Lochinvar National Parks), (iii) Lower Zambezi (Lower Zambezi National Park) and (iv) Luangwa (including North and South Luangwa National Parks). This survey was carried out by the Central Statistical Office. For more details on the sampling procedure see References [8,24]. The survey data were also supplemented with secondary data collected from various ZAWA documents.

4.2. Model Specification

The Cragg [28] tobit alternative framework was used to model the probability and extent of crop damage. This method involves doing the estimation in two stages, where a probit model is used in the first stage to estimate the probability of crop damage, and a truncated regression is used in the second stage to estimate the extent of crop damage among those that have suffered the problem. The two-stage model can be represented as follows:
Pr ( c i = 1 | x i ) = β / x i + τ / g i + δ P i + μ i
ln y i = γ / x i + ψ / g i + λ P i + ε i ,
where c is a crop damage dummy variable taking a value of 1 if the household had suffered crop damage during the 2004/2005 agricultural season, y i is the value of crop losses incurred, x is a vector of covariates postulated to explain crop damage, P is a land use dummy variable equal to 1 if the community had already developed a land use plan, g is a vector of GMA dummy variables equal to 1 for each type of GMA, δ and λ are coefficients to be estimated for the land use plan dummy variable, τ and ψ are vectors of parameters to be estimated corresponding to the GMA dummy variables, β and γ are vectors of other parameters to be estimated, and μ i ~ N ( 0 , σ μ 2 ) and ε i ~ N ( 0 , σ ε 2 ) are mean-zero normally distributed random error terms.
Although there are four types of GMAs, the study did not include any depleted GMAs because hardly any wildlife can be found for hunting purposes. Furthermore, in our specification, GMA categories secondary and specialized were collapsed into one category. This is so because there were very few specialized GMAs in our data. Thus, in the end vector g ended up with only two members, g1 (for prime GMAs) and g2 (for secondary and specialized GMAs).
Since the extent of crop damage and, hence, the effectiveness of a land use plan is likely to be greatest in GMAs with large wildlife populations, we also model this differential effect of land use plans. This is done by introducing in both Equations (1) and (2) interaction terms between the GMA effect and the effect of the land use plan:
Pr ( c i = 1 | x i ) = β / x i + τ / g i + δ P i + θ 1 ( g 1 i P ) i + θ 2 ( g 2 i P ) i + μ i
ln y i = γ / x i + ψ / g i + λ P i + π 1 ( g 1 i P ) i + π 2 ( g 2 i P ) i + ε i ,
where θ = { θ 1 , θ 2 } and π = { π 1 , π 2 } are vectors of parameters to be estimated for the interaction terms.
In this latter specification (Equations (3) and (4)), the effect of the land use plan can vary by wildlife numbers, represented here by the GMA dummy variables. Thus, the effect of land use planning on the probability of incurring crop damage could be derived from Equation (3) as:
Δ Pr ( c i = 1 | x i ) Δ 0 1 P i = { δ ^ + θ ^ 1 , if   g 1   =   1   and   g 2   =   0 δ ^ + θ ^ 2 , if   g 1   =   0   and   g 2   =   1 δ ^ if   g 1   =   0   and   g 2   =   0 .
Similarly, the effect of land use planning on the extent of crop damage can be derived from Equation (4) as:
Δ E ( ln y i | x i ) Δ 0 1 P i = { λ ^ + π ^ 1 , if   g 1   =   1   and   g 2   =   0 λ ^ + π ^ 2 , if   g 1   =   0   and   g 2   =   1 λ ^ if   g 1   =   0   and   g 2   =   0 .
All the models were tested for standard model specification problems such as heteroskedasticity and multicollinearity. Having detected heteroskedasticity at the 5 percent level, we use heteroskedasticity-consistent standard errors in all the estimations. We include in vector x all the variables postulated to affect crop damage [8]. Furthermore, we suspected number of village scouts to be endogenous because a higher probability of scouts is associated with a higher number of wildlife, leading to a higher probability of crop damage. However, the test for endogeneity, in our earlier paper using this data set showed that number of scouts was exogenous [8]. Table 1 summarizes these variables and their postulated relationships with crop damage.
Table 1 presents the members of vector x and proxies for ρ and the expected directions of their relationships with probability of crop damage. Several human capital variables are expected to be correlated with the likelihood of suffering and extent of wildlife-inflicted crop damage. The age of the household head, for example, was a proxy for experience. The more experienced the household head is, the more knowledgeable we expect them to be about wildlife and how to minimize human-wildlife conflict, including crop damage. However, younger heads may have the strength needed to thwart the actions of wildlife. Thus, we expect either sign on this variable. We also expect male-headed households to have greater ability to deal with wildlife, as activities such as wildlife scaring (and snaring) are typically in the male domain in these communities.
Other human capital variables expected to be negatively correlated with crop damage include education of the head and labor supply as proxied by household size. More educated people are expected to have greater ability to analyze situations and to develop effective strategies for dealing with problematic situations such as wildlife attack, whereas larger households have a greater capacity to chase away wildlife from their fields. We also believe that the effectiveness of human capital endowments can be further enhanced by the household’s wealth and physical capital endowments. Both consumer assets (such as television sets, radios, furniture, etc.) and productive assets (such as cars, trucks, farm equipment, etc.) are an indicator of wealth, and could proxy for enhanced ability to respond to wildlife. However, a household with more valuable productive assets would be well positioned to expand total cultivated area, perhaps encroaching upon wildlife habitat and increasing crop damage. Therefore, wildlife-inflicted crop damage can be enhanced by the size of the farm operation. The larger the size of the farm, the less control the household will have per unit area, and the greater the likelihood and extent of wildlife attack. We use the size of cultivated land area and value of harvest as proxies for the scale of operation.
The likelihood and extent of wildlife-inflicted crop damage is also expected to be inversely correlated by the level of human activity. The more remote a household is, for example, the greater the likelihood of incurring wildlife-inflicted crop damage [8]. The further a household is from the road, the higher the probability of crop damage. Infrastructure such as clinics and schools were also used to measure the effects of the concentration of human presence and activity. Households may also prefer working for paid employment as the presence of infrastructure offers a better source of livelihood in comparison to farming. As a result, this could reduce the likelihood of crop damage by wildlife.
Closely related to this are variables such as human and wildlife population densities, which inhibit and enhance crop damage, respectively. Because data on wildlife populations were not readily available and GMAs are defined based on wildlife populations, we use GMA classifications as proxies for wildlife populations. Prime GMAs have the largest populations of different kinds of wildlife. Thus, we expect greater crop damage in these areas compared to under-stocked GMAs [8]. Secondary and specialized GMAs have wildlife populations that are less than prime GMAs but more than under-stocked GMAs. This effect can, however, be moderated by presence of village scouts, although the scouts’ primary focus is to help conserve wildlife.

5. Results and Discussion

5.1. Crop Damage

Many different types of wildlife damage crops in the GMAs. However, as Osborn and Parker [10] show, elephants are the single most destructive species and most of the wildlife-inflicted crop damage takes place during the harvest months of May, June and July. The IGMAW survey data showed that crop damage was mostly caused by monkeys and elephants, with 31 and 20 percent of households reporting to have incurred crop damage from monkeys and elephants respectively.

5.2. Socioeconomic Characteristics of Households

Significance tests conducted using t-test showed that there were significant differences between households in GMAs and non-GMAs as can be seen in Table 2. Households in GMAs had lower average income levels, smaller household sizes, lower age of the household head and a lower average educational level compared with households in the non-GMAs. Households in GMAs also had fewer assets compared to households in non-GMAs. GMAs, as expected, are found in remote areas and are not densely populated compared to the non-GMAs.

5.3. Characteristics of Communities

Twenty-five (or 18.5 percent) of the 135 study communities had developed land use plans at the time of the survey. The t-test showed that characteristics differ in communities between those who did not have a land use plan, and those who have (Table 3). Communities that had a land use plan had older household heads, larger fields and were not remotely located compared to communities that did not have a land use plan. Communities with land use plans also had a higher population density as well as a higher presence of infrastructure compared to communities without land use plans. A higher proportion of communities with land use plans were found in prime GMAs while a higher proportion of communities without land use plans were found in secondary or specialized GMAs.

5.4. Two-Stage Model Results

The results of the two-stage model are shown in Table 4 where models 1 and 3 show the probability of crop damage while models 2 and 4 show the extent of damage. Further, the first two columns show the average partial effects (APEs) for the basic two-stage model without GMA land use plan interaction terms, while the third and fourth columns show the APEs for the two-stage model with interaction terms. When land use planning is not interacted with the type of GMA, the results suggest that the land use plan does not affect crop damage in any statistically significant way. However, when interacted with the GMA effect, land use planning can lead to significant reductions in the likelihood of incurring crop damage for those households that are in prime or secondary/specialized GMAs. Land use planning shows a greater impact in secondary/specialized GMAs compared to prime GMAs. This could be that communities in GMAs that have abundant wildlife may not see the point of organizing themselves to formulate a land use plan [26]. Land use planning, however, does not have any such significant effects on the extent of crop damage for households that have incurred crop damage.
The results from the basic model show that increasing cultivated land area by 1 hectare increases the probability of crop damage by 2.7 percent. This finding and the fact that the probability of crop damage is significantly greater suggest that unsurprisingly, a larger value of harvest and hence a larger farm, is more prone to crop damage. Additionally, increasing the value of harvest has a positive impact on the extent of crop damage. The results also suggest that households that are further away from the road are more likely to suffer from crop damage. An additional Km, on average, increases the probability of crop damage. This makes perfect sense as remote areas are more likely to be close to the national parks and to be further away from human activity.
Closely related to the remoteness variable is the presence of infrastructure, another proxy for concentration of human presence and activity. The results suggest, again consistent with expectations, that an additional physical infrastructure (such as a school, clinic, etc.) is associated with 1 percent reduction in the probability of incurring wildlife inflicted crop damage. The number of village scouts has a positive and significant effect on the probability of crop damage, showing that the presence of scouts is not advantageous to the communities, as they are only there for wildlife conservation. The presence of a prime GMA has a positive and significant effect on crop damage indicating that the presence of wildlife in the GMA increases the probability of farming households likely to suffer from crop damage.
The model with interaction terms in it shows some similar results to the basic model. The APEs on the probability of crop damage shows that increasing the size of the agricultural cropland by 1 hectare increases the probability of crop damage by 2.6 percent. The value of harvest variable shows a positive and significant effect on the probability and extent of crop damage. Increasing the distance from the main road increases the probability of crop damage whereas additional infrastructure decreases the probability of crop damage.
A household in a prime GMA has a higher probability of encountering crop damage (33.1 percent) compared to a household in a secondary/specialized GMA (5.7 percent). These results are consistent with the results found by Richardson et al. 2012 [8], and the relationship is supported by the findings of related studies of wildlife-inflicted crop damage [9,16,24]. This shows that if a GMA has a high population of wildlife, the probability of crop damage is increased in such GMAs. Interestingly, when scouts are present in both prime GMA and secondary/specialized GMA they have no statistically significant effect, but they have a statistically significant effect on the extent of crop damage. Village scouts in the GMA could be used to protect farming households’ fields from wildlife damage in addition to protecting wildlife [8]. The joint significance of the district dummy variables shows that being in a different district has different effects on probability of crop damage and on the extent of crop damage.

6. Conclusions

The main objective of this study was to estimate the impact of land use planning on wildlife inflicted crop damage in the GMAs. This objective was addressed using a two-stage econometric model to identify the extent to which farmers cultivating crops in GMAs are more likely to be affected by crop damage caused by wildlife.
The findings showed that cultivated area, distance to the nearest road, infrastructure, value of harvest, number of village scouts and the GMA effect are important factors affecting the probability of crop damage. These results are consistent with other studies of the drivers of wildlife-related crop damage [8,9,16,24]. The area cultivated, distance to the nearest main road, number of scouts, value of harvest, and living in a GMA are positively associated with crop damage. When the number of scouts was interacted with GMA effect it was found not to have a significant effect on the probability of crop damage but rather, had a significant negative effect on the extent of crop damage. Furthermore, the presence of a land use plan in the GMAs and infrastructure were negatively associated with crop damage. This result is a significant contribution of this study to the literature on human–wildlife conflict.
The findings revealed that a land- use plan has a significant effect in reducing the likelihood of crop damage caused by wildlife in the GMAs. These results highlight the importance of land use planning in preparing for future community needs, reducing human-wildlife conflict, and minimizing losses from crop damage. Therefore, the implementation of land use plans should continue in all GMAs to achieve these objectives. This will help the rural communities which co-exist with wildlife reduce the impact of wildlife-induced crop damage, thereby sustaining food security and rural development. The lack of policies to compensate rural community members when they suffer from crop damage makes land use planning even more of a valuable tool. In this study, wildlife population was not controlled for, instead GMA type was used in lieu of an aerial count of wildlife per GMA. Some communities might have a land use plan on paper but may not yet have implemented it. Further work hence needs to be carried out in this field to better evaluate the effectiveness of various types of land use plans. There is also a need to increase capacity and training sessions in land use planning and best practices. This is especially important as each land use plan is tailored to each user and community.

Author Contributions

M.S. led the writing of the manuscript and analysis of the data, and G.T. and R.B.R. contributed to the interpretation of the results. G.T. conceptualized the research design and led the collection of data. All authors contributed to the preparation of the manuscript.

Funding

This research received no external funding.

Acknowledgments

The IGMAW was implemented by the Central Statistical Office (CSO) with funding from the World Bank (WB). The authors are responsible for all errors and omissions.

Conflicts of Interest

The authors declare no conflicts of interest.

References

  1. Food and Agriculture Organisation (FAO). Guidelines for Land-Use Planning; FAO: Rome, Italy, 1993. [Google Scholar]
  2. Naab, F.Z.; Dinye, R.D.; Kasanga, R.K. Urbanisation and its impact on agricultural lands in growing cities in developing countries: A case study of Tamale, Ghana. Mod. Soc. Sci. J. 2013, 2, 256–287. [Google Scholar]
  3. Muleya, Z. The Strategic Planning Process for Preparing General Management Plans for Protected Areas; Zambia Wildlife Authority: Lusaka, Zambia, 2006; unpublished. [Google Scholar]
  4. Lamarque, F.; Anderson, J.; Fergusson, R.; Lagrange, M.; Osei-Owusu, Y.; Bakker, L. Human-Wildlife Conflict in Africa. Causes, Consequences and Management Strategies; Food and Agricultural Organization of the United Nations: Rome, Italy, 2009. [Google Scholar]
  5. Kameri-Mbote, P. Land Tenure, Land Use and Sustainability in Kenya: Towards Innovative Use of Property Rights in Wildlife Management; IELRC Working Paper 2005-4; International Environmental Law Research Centre: Geneva, Switzerland, 2005. [Google Scholar]
  6. Dixon, J.A.; Sherman, P.B. Economics of protected areas. Ambio 1991, 20, 68–74. [Google Scholar]
  7. Ferraro, P.J. The local costs of establishing protected areas in low-income nations: Ranomafana National Park, Madagascar. Ecol. Econ. 2002, 43, 261–275. [Google Scholar] [CrossRef]
  8. Richardson, R.B.; Fernandez, A.; Tschirley, D.; Tembo, G. Wildlife Conservation in Zambia: Impacts on Rural Household Welfare. World Dev. 2012, 40, 1068–1081. [Google Scholar] [CrossRef]
  9. De Boer, W.F.; Baquete, D.S. Natural resource use, crop damage and attitudes of rural people in the vicinity of the Maputo Elephant Reserve, Mozambique. Environ. Conserv. 1998, 25, 208–218. [Google Scholar] [CrossRef]
  10. Osborn, F.V.; Parker, G.E. Elephant/Human Conflict Around the Luangwa National Parks, Zambia; Consultancy Report for WWF/SARPO; Mid Zambezi Elephant Project: Harare, Zimbabwe, 2002. [Google Scholar]
  11. Newmark, W.D.; Manyanza, D.N.; Gamassa, D.M.; Sariko, H.I. The conflict between wildlife and local people living adjacent to protected areas in Tanzania: Human density as a predictor. Conserv. Biol. 1994, 8, 249–255. [Google Scholar] [CrossRef]
  12. Hill, C.M. Conflict of interest between people and baboons: Crop raiding in Uganda. Int. J. Primatol. 2000, 21, 299–315. [Google Scholar] [CrossRef]
  13. Linkie, M.; Dinata, Y.; Nofrianto, A.; Leader-Williams, N. Patterns and perceptions of wildlife crop raiding in and around Kerinci Seblat National Park, Sumatra. Anim. Conserv. 2006, 10, 127–135. [Google Scholar] [CrossRef]
  14. Jones, T.B. Human Wildlife Conflict Study, Namibian Case Study; World Wide Fund: Windhoek, Namibia, 2006. [Google Scholar]
  15. Shrestha, R. A Case Study on Human-Conflict in Nepal (with Particular Reference to Human-Elephant Conflict in Eastern and Western Terai Regions); World Wide Fund: Kathmandu, Nepal, 2007. [Google Scholar]
  16. Naughton-Treves, L. Predicting patterns of crop damage by wildlife around Kibale National Park, Uganda. Conserv. Biol. 1998, 12, 156–168. [Google Scholar] [CrossRef]
  17. Bajracharya, S.B.; Furley, P.A.; Newton, A.C. Impacts of community-based conservation on local communities in the Annapurna Conservation Area, Nepal. Biodivers. Conserv. 2006, 15, 2765–2786. [Google Scholar] [CrossRef]
  18. Weladji, R.B.; Tchamba, M.N. Conflict between people and protected areas within the Bénoué Wildlife Conservation area, North Cameroon. Oryx 2003, 37, 72–79. [Google Scholar] [CrossRef]
  19. Otuoma, J. The Effects of Wildlife-Livestock-Human Interactions on Habitat in the Meru Conservation Area, Kenya; LUCID Working Paper 39, Land Use Change Impacts and Dynamics; International Livestock Research Institute: Nairobi, Kenya, 2004. [Google Scholar]
  20. Muruthi, P. Human Wildlife Conflict: Lessons Learned from AWF’s African Heartlands; AWF Working Papers; African Wildlife Foundation: Nairobi, Kenya, 2005. [Google Scholar]
  21. Granados, A.; Weladji, R.B. Human–elephant conflict around Bénoué National Park, Cameroon: Influence on local attitudes and implications for conservation. Hum. Dimens. Wildl. Int. J. 2012, 17, 77–90. [Google Scholar] [CrossRef]
  22. O’Connell-Rodwell, C.E.; Rodwell, T.; Rice, M.; Hart, L.A. Living with the modern conservation paradigm: Can agricultural communities co-exist with elephants? A five-year case study in East Caprivi, Namibia. Biol. Conserv. 2000, 93, 381–391. [Google Scholar] [CrossRef]
  23. Taylor, R.D. A Review of Problem Elephant Policies and Management Options in Southern Africa; Human Elephant Task Force, IUCN; African Elephant Specialist Group: Nairobi, Kenya, 1999. [Google Scholar]
  24. Bandyopadhyay, S.; Tembo, G. Household consumption and natural resource management around national parks in Zambia. J. Nat. Resour. Policy Res. 2010, 2, 39–55. [Google Scholar] [CrossRef]
  25. Larson, D.; Pienaar, E.; Jarvis, L. Wildlife conservation, labor supply and time values in rural Botswana. Environ. Dev. Econ. 2016, 21, 135–157. [Google Scholar] [CrossRef]
  26. Ostrom, E. A general framework for analyzing sustainability of social-ecological systems. Science 2009, 325, 419–422. [Google Scholar] [CrossRef] [PubMed]
  27. DeMotts, R.; Hoon, P. Whose elephants? Conserving, compensating, and competing in northern Botswana. Soc. Nat. Resour. 2012, 25, 837–851. [Google Scholar] [CrossRef]
  28. Cragg, J. Some statistical models for limited dependent variables with application to the demand for durable goods. Econometrica 1971, 39, 829–844. [Google Scholar] [CrossRef]
Figure 1. Map depicting Game Management Areas in Zambia.
Environments 05 00110 g001
Table 1. Covariates postulated to determine crop damage.
VariableExpected Sign
Age of household head in yearsPositive/Negative
Sex of household head, 1 = maleNegative
Maximum education (in years)Negative
Household sizeNegative
Distance to the nearest main road in kilometers Positive
Total area cropped in hectaresPositive
Value of consumer assets in ZMKNegative
Value of productive assets in ZMKNegative/Positive
Infrastructure indexNegative
Population density per square kmNegative
Number of ScoutsNegative/Positive
Prime GMA, 1 = yes (gma1)Positive
Secondary/specialized GMA, 1 = yes (gma2)Positive
Value of harvest in ZMKPositive
Land use plan, 1 = yes (land use)Negative
Table 2. Socioeconomic characteristics of households in Game Management Areas (GMAs) and control areas.
VariableFull SampleGMAsNon-GMA Control AreasSig.
Number of sample households271715741143
Total household income (ZMK)4,235,7623,591,2535,123,301*
Household size5.285.085.57***
Age of household head (in years)42.464144.48***
Sex of household head (=1 if male)0.740.730.76**
Maximum education (in years)6.786.427.27***
Cropped area (hectares)0.920.930.92
Value of consumer assets (ZMK)401,588285,362561,641**
Value of productive assets (ZMK)618,036256,7291,115,584***
Distance to nearest main road (km)5.096.083.8***
Population density (per sq km)35.241.4126.97***
Infrastructure index3.623.643.59
Prime GMA0.170.3n.a.
Secondary/specialized GMA0.20.35n.a.
n.a. = not applicable; * 10% significance level, ** 5% significance level, *** 1% significance level.
Table 3. Socioeconomic characteristics of households in communities with and without land use plans.
Categorical Variable DescriptionCommunities without Land Use PlansCommunities with Land Use PlanSig.
Number of communities11025
Household size5.265.46
Age of household head (in years)42.2543.48*
Sex of household head (=1 if male)0.750.75
Maximum education (in years)5.335.54
Cropped area (hectares)0.881.11***
Value of consumer assets (Kwacha)15.6116.53
Value of productive assets (Kwacha)30.3130.39
Distance to nearest main road (km)5.382.94***
Population density (per sq. km)4.345.38***
Infrastructure index3.563.84**
Prime GMA0.120.39***
Secondary/Specialized GMA0.240.08***
* 10% significance level, ** 5% significance level, *** 1% significance level.
Table 4. Two-stage average partial effects for crop damage, 2005/2006 agricultural season.
VariablesBasic ModelWith Interactions
Stage 1Stage 2Stage 1Stage 2
Model 1Model 2Model 3Model 4
(1)(2)(3)(4)
Land use plan (dlandplan), 1 = yes−0.006731.40200.03241.0230
(0.0203)(1.0530)(0.0311)(1.2540)
Prime GMA (g1), 1 = yes0.2240 ***−0.20800.3310 ***0.0044
(0.0568)(1.1580)(0.0795)(1.6850)
Secondary/specialized GMA(g2), 1 = yes0.0393−0.58000.0566 *0.1440
(0.0260)(0.8300)(0.0301)(0.9630)
dlandplan*g1 −0.0478 *1.0580
(0.0279)(1.8600)
dlandplan*g2 −0.0874 ***−1.0830
(0.0228)(2.2050)
Age of household in years (hage)−8.19 × 10−50.0280−8.38 × 10−50.0295
(0.0005)(0.0190)(0.0005)(0.0186)
Sex of household head, 1 = male (hmale)−0.0150−0.2100−0.0140−0.3450
(0.0171)(0.8140)(0.0168)(0.8090)
Level of Education (hedu)0.00090.14300.00080.1420
(0.0022)(0.0915)(0.0022)(0.0915)
Household size (hhsize)−0.00420.1110−0.00450.1050
(0.0029)(0.1230)(0.0028)(0.1240)
Distance to nearest main road in km (Kroad)0.0015 ***−0.008890.0012 **−0.0048
(0.0005)(0.0180)(0.0005)(0.0175)
Cropped area in hectares (carea)0.0266 ***−0.13900.0263 ***−0.1370
(0.0053)(0.2290)(0.0053)(0.2240)
Value of consumer assets (vcasset2)−0.177012.3000−0.110012.2200
(0.5800)(22.8200)(0.5750)(22.4800)
Value of productive assets (vpasset2)−0.3930−22.4100−0.4010−19.3600
(0.4220)(17.4100)(0.4200)(18.0800)
Population density (Popdens)0.0002−0.00990.00040.0031
(0.0007)(0.01480)(0.0007)(0.0162)
Infrastructure index (infras2)−0.0102 ***−0.1580−0.0127 ***−0.1360
(0.0035)(0.1350)(0.0037)(0.1380)
Number of scouts (nscouts)0.0069 **0.11300.00450.7950**
(0.0030)(0.0706)(0.0070)(0.3580)
Value of harvest (harv2)0.3050 ***8.8390 ***0.3000 ***9.0150 ***
(0.0480)(2.3230)(0.0479)(2.3150)
Nscouts*g1 −0.0118−1.2550 **
(0.0117)(0.5080)
Nscouts*g2 0.0066−0.7110 *
(0.0079)(0.3690)
Number of Observations21853022185302
Goodness of Fit Chi2-square statistic246.23 *** 245.31 ***
Log pseudo likelihood−748.745−866.880−744.040−862.678
Cragg and Uhler’s R20.202 0.209
District dummy variable104.80 ***48.48 ***95.36 ***43.43 ***
Robust standard errors are presented in parentheses; * 10% significance level, ** 5% significance level, *** 1% significance level.

