Abstract
The balance of carbon dioxide emissions and other greenhouse gases in the life cycle of concrete is one of the important elements affecting the sustainable development of concrete technology. Modifications in the composition in the aim of minimization of so-called “carbon footprint” of concrete also affect the majority of its technical features, including primarily the mechanical properties and durability. The article presents a desirability function that would allow us to estimate the combined effect of the modification in terms of both CO2 emissions and some of the technical features of the concrete. As criterial features equivalent CO2 emission, compressive strength and susceptibility/resistance to concrete carbonation are selected. Selected features should be considered as an example for the presentation of the proposed methodology and represent the three pillars of concrete desirability in terms of sustainable development, i.e., the constructional usefulness, durability, and environmental performance.
1. Introduction
Concrete is one of the most commonly used building materials in the world. In the European Union, 215 million cubic meters of concrete were produced in 2015 [1]. The concept of sustainable concrete assumes its material and technological optimization, including technical, economic, and environmental indicators [2]. When comparing similar, optimized structures of steel, wood, and concrete, greenhouse gas emissions are the largest in case of concrete structures [3]. Among the mentioned materials, the CO2-equivalent emission of concrete per unit of mass is the highest, but it is only a few percent higher than the value for steel and a dozen for wood. In this context, the high consumption of concrete worldwide has caused researchers to attempt to reduce the so-called “emission” of concrete. The term “emission” of concrete referring to greenhouse gas emissions is an acronym, as concrete does not emit any carbon dioxide or other gases. “Emission” refers to the whole life cycle, but for concrete, this mainly includes the raw material extraction, component production, build-up phases, and represents the total greenhouse gas emissions expressed as CO2-equivalent emissions. High-energy and chemical processes are the main cause of high greenhouse gas emissions—in the case of concrete, it is cement production.
In case of cement, the main component, clinker, and high energy processes are responsible for about 45% of CO2 emissions. Kajaste et al. [4] calculated that carbon emission from both electricity and fossil fuels can equal from 304 to 490 kg CO2/t cement. The research also pointed out the importance of variability of factors influencing the result such as geographic location, production process, and data quality. Individual analysis should take into account these factors and knowingly operate on data.
The most of cement CO2 emissions, namely 510 to 712 kg CO2/t cement according to [4], is related to the chemical process of limestone calcination in high temperatures that generates pure chemical CO2 according to Equation (1). This emission mostly depends on raw material composition and in most cases is similar and amounts to 520 kg CO2/t cement.
CaCO3 => CaO + CO2,
In this context, it is worth paying attention to the process of carbonation of concrete. Under conditions of exposure to atmospheric CO2, it reacts with calcium hydroxide Ca(OH)2. The effect of this process on the balance of CO2 emissions during the life of the original concrete (i.e., in construction) is, however, negligible due to low range of this process into concrete and small surface of the concrete exposed to the air. Woyciechowski [5] demonstrated that this process is responsible for only 2.5% of CO2 emission in the case of a viaduct fragments. Kim et al. [6] accounted same absorption in case of precast concrete girder as 11.2% of CO2-equivalent emission of concrete. Some authors have shown that a major CO2 uptake will take place when the concrete structures are demolished [7]. The secondary life of the concrete structure is important to evaluate the carbon sequestration. The concrete can be crushed, and the non-carbonated concrete can carbonate during the post-use phases. After demolition and crushing, most of the concrete will, if subjected to air, carbonate within 10 years. Xi et al. [8] (2016) estimated that “a cumulative amount of 4.5 giga tones of carbon has been sequestered in carbonating cement materials from 1930 to 2013”. More about recarbonation is discussed elsewhere [9].
Hasanbeigi et al. [10] listed 18 emerging technologies for cement and concrete production that can reduce industry environmental impact, among which three are related to alternative cement products, four are related to alternative raw materials, eight are related to capturing CO2 from previously mentioned calcination process, and three are related to other aspects. Due to the fact that most Portland cement carbon emission comes from calcination, most new technologies aim to greatly reduce the CO2 generated in this process or to change limestone to a different material that does not generate carbon dioxide when calcinated. The cement manufacturing process has already been optimized, and only few technologies attempt to reduce energy use.
High-energy processes also apply to admixtures. European Federation of Concrete Admixture’s Environmental Declaration Superplasticizing Admixtures [11] stated that the CO2-equivalent emission of superplasticizers is about 2 kg CO2-eq kg/kg. The value itself may seem high, more than twice the emission of cement, but the amount of the admixtures in concrete mixing is usually not more than 2% of cement, which practically eliminates them from the considerations of greenhouse gas emissions in concrete. Stjunnesson [12] found that chemical admixtures accounts for about 0.6% of global warming potential. The extraction of other components, transport, and mix production have significantly less impact on the greenhouse gas emissions of concrete than cement. Louise K. Turner et al. [13] investigated CO2-equivalent emission in ordinary Portland concrete focusing on different factors such as components, batching, transportation, and placement, finding that almost 80% of concrete CO2 emission comes from cement. Sjunnesson [12] analyzed cradle to cradle life cycle analysis of concrete and its components that was similar to [13]. According to Sjunnesson [12] production of 1 tone aggregate produces 5.36 kg CO2, however the research she takes the data from, does not cover transportation to concrete production plant, which may be exceed the actual value. Louise K. Turner [13], on the other hand, performed an analysis including the transportation and found out that same factor equals 13.9 kg CO2 for fine aggregate equals and 40.8 kg CO2 for coarse aggregate. Marinkovic et al. [14] estimates the influence of aggregate to be rather small—a maximum of 5% of total concrete emissions. Although the differences between studies are relatively big, it is still much less than emissions of cement.
A common solution used to reduce the carbon footprint of concrete is to reduce the amount of clinker used in cement and replace it with mineral materials with a significantly lower emission factor [15]. It is important that the additive used has such characteristics that the resulting cement has the appropriate properties. Such additives are used both as substitutes for clinker and cement, in accordance with EN197-1 and EN 206. The two most common substitutes are fly ash and ground granulated blast-furnace slag (GGBS). Fly ash is currently widely used for various application in civil engineering [16,17,18,19,20]. Due to their waste origins, the CO2 emissions resulting from their use are almost zero. These additives also affect other characteristics of concrete.
Previous studies on emissions during construction stages found that geographic representativeness is one of the major source of uncertainty [21], as well as data quality and measurement assumptions at the origin production plants. Załęgowski et al. [22] shown the variety of concrete CO2-equivalent emissions depending on specificity of calculationssuch as cradle to gate, cradle to grave, or cradle to cradle. For the specific location discount rate, electricity and fuel prices may vary [23]. The main influence of uncertainty on the results is the variation of several impacts due to technological correlation among production plants (mostly energy mixes of manufacturing processes) [24].
Kim et al. [25] developed a method to assess CO2-equivalent emission on the basis of concrete compressive strength. Kim et al. [26] proposed a tool to assess concrete CO2-equivalent emission that complies with all previously mentioned life cycle analysis. Baek et al. [27] assessed Life Cycle CO2 emission of ordinary versus high-strength concrete with blast furnace slug. He concluded that replacing ordinary with high-strength concrete can strongly reduce CO2 emissions. Additionally, replacing cement with slug can also reduce emissions although not as much as concrete type. Cho et al. [28] performed Life Cycle Assessment of a residential building in South Korea with a similar conclusion as Baek. It should be noted that replacing ordinary concrete with a high-strength one usually results in cost increase—for example, due to higher usage of expensive plasticizers. On the other hand, Stengel et al. [29] analyzed the environmental impact of ultra-high performance concrete (UHPC) and found that it is up to 2.4-fold higher than those of ordinary concrete.
Yepes et al. [30] optimized a prestressed concrete beam in the means of cost and CO2 emission, separately. Similar analysis was performed by Yeo et al. [31].
Current state-of-the-art tends to asses and optimize only cost/benefit ratio of concrete [30,31,32,33,34]. Similarly, emission indicators can be used to create an “emission-benefit ratio”. The lifetime of a product or structure is either fixed or not included. However, practice in Poland shows that even though the building has assumed lifetime, it usually “ends” its life when the structural units are no longer capable of providing their function—usually due to their durability. In this way, fixing the lifetime of a product or not analyzing its durability may bring uncertainty to their LCA. Focusing attention only on one of these aspects is not desired according to [35] and is not consistent with assumptions of sustainable development [36]. Its definition, “assumes appropriately and consciously shaped relations between economic growth, environmental care (not only natural but also artificial—produced by man), and the quality of life (including human health).” [37] strongly guides one to take into considerations all concrete characteristics. A practical reflection of this approach is to rate a building according to Leadership in Energy and Environmental Design (LEED), which gives points, i.e., for reducing life-cycle impact of building or using products that are multi-attributably optimized. However, it is not always “greener” to use waste origin additives. Low-quality fly ash usage in concrete can significantly affect its durability, causing early destruction of concrete and necessity to repair.
Marikkovic [38] takes notice of including major factors—strength, serviceability and durability—when assessing LCA of concrete. Finkbeiner et al. [35] points out the importance of multi-way approach to LCA as different dimensions are defined and weighting those indicators. He also draws attention to the usual complexity of available LCA calculating programs and the difficulty it brings to the decision-maker. He states that in order to achieve a tangible effect on sustainable development, a valid and applicable tool is required.
2. Research Significance
The main goal of the analysis shown in this paper is to develop the concrete desirability function that provides complex knowledge on both technical and environmental performance of sustainable concrete. The function should complete the gap between LCA and the end-user by complexing all the analyzed characteristics into one number. The authors try to create a tool that combines different information from the literature and provides a broad view on the utility of so-called sustainable concrete.
In order to assess complex concrete desirability, the authors focus on a few key characteristics, among which durability is the most challenging to quantify. For this reason, the studies also include a formulation of a new carbonation resistance definition and its mathematical model. Other characteristics such as environmental impact have already been widely discussed in the current state-of-the-art.
The proposed tool for evaluating concrete utility is focused on users and their specific needs and can be used in practice, i.e., to assess concrete sustainability with regard to its financial, environmental, and technical impact. It is supposed to be usable for decision-makers and provide easily understandable information.
3. Materials and Methods
3.1. Concrete Utility Function Formulation
The authors identified four basic groups of features that should be included in the proposed approach to concrete utility analysis. These are mechanical properties related to structural function of concrete, features characterizing durability, characteristics related to CO2 emissions, and economic indicators. The authors attempted to formulate the utility function of concrete considering the four aspects mentioned, which required the definition of quantitative characteristics of each group. Quantification of concrete’s durability was especially difficult as it requires the expected, usually complex, set of exposure classes in which concrete will be used. In order to validate proposed approach, the utility function of concrete Equation (2) is formulated, which quantifies the desirability of concrete, taking into account compressive strength, carbonation resistance, CO2eq emissions, and concrete unit cost (all expressed in standardized variables).
where U is concrete desirability, wf28, wR, wE, wC are weights of individual characteristics, f28 is compressive strength tested after 28 days, Rcarb is durability as carbonation resistance, E is concrete CO2 equivalent emission factor, and C is unit cost per cubic meter of concrete.
U = wf28 × f28 + wR × Rcarb + wE × E + wC × C,
Actual variables are converted into standardized variables according to Equation (3) for inhibitors (f28, Rcarb) and Equation (4) for dampers (E, C):
where zstan is the standardized variable, zreal is the real variable, zmean is the population mean, and δz is the standard deviation of population.
zstan = (zreal − zmean)/(δz),
zstan = −(zreal − zmean)/(δz),
3.2. Utility Function Components
3.2.1. Compressive Strength
Compressive strength is a fundamental requirement for concrete—usually in the form of required strength class or, less likely, the value of the average or minimum strength. When comparing the results of different tests, it is important to compare the strengths tested on samples of the same shapes and sizes. Due to the different origins of the tested strength test results, compressive strengths of samples with dimensions other than cubic size of 15 cm can be approximated in accordance with Equations (5)–(7) given below [39]:
fck,cube,15×15 = fck,cyl,15×30 × 1.23,
fck,cube,15×15 = fck,cube,10×10 × 0.90,
fck,cube,15×15 = fck,cyl,10×20 × 1.19,
Compressive strength is analyzed after 28 days curing under laboratory conditions.
3.2.2. Greenhouse Gas Emission
Environmental impact assessment is limited to greenhouse gas emission (GHG) due to the fact that chemically clean CO2 is the main product of cement manufacturing. Taking into account other impact approaches would probably change the result to a small extent. However, the study by Sjennsson [12] shows that the impact of plasticizers would visibly increase.
The concept introduced to uniquely assess the amount of greenhouse gas emissions to the atmosphere in the life cycle of a substance is the so-called carbon footprint, which is measured by equivalent carbon dioxide emissions. The carbon footprint is defined by ISO 14067: 2013 as “the sum of emitted and consumed by the greenhouse gas product, expressed in CO2 equivalents, based on life cycle assessment” [40]. The concept of CO2-eq emission factor, the carbon footprint of a substance per unit of mass, is introduced. It is important to clearly define the boundaries of life cycle analysis when calculating the carbon footprint. The most commonly used approaches are “from cradle to gate” and “from cradle to grave” [41].
The concrete emission factor E from Equation (2) is calculated as the sum of carbon footprints of substances and activities associated with production of concrete raw materials according to Equation (8).
where we is the substance or activity emission factor, m is the unit of substance (such as cement, mineral additive (fly ash or GGBS), fine and coarse aggregate, chemical admixture), or activity per 1 m3 of concrete.
E = Σ(we × m) [kg CO2 emission/m3],
Emission factors for individual components and activities are taken from the literature taking into account the life cycle analysis “from cradle to gate”. Reference sources in this subject in Poland seems to be limited and therefore data from different country is used [13,42,43]. Emission factors are valid for Australia, but comparing them to [4,12], they fall into the average of other developed countries—for example, the clinker emission factor equals 838 kg CO2/t for Japan, Australia, and NZ and 847 and 897 kg CO2/t for Europe and the US according to [4]. According to [13], the impact of concrete production process, placing and transportation equals only about 6% and even less according to [12]. Its influence to desirability is very similar regardless of the composition of analyzed concrete mixes when one is comparing similar products in means of production process. As the main scope of this research is to create and analyze a tool, some generalizations had to be made, and therefore the impact of the production process, placing, and transportation is neglected. However, when using the tool, the user may include this data in his/her own work.
The function and its component is developed in order for users to use their own emission factors personalizing the tool.
3.2.3. Cost
The unit cost of concrete C from Equation (2) is calculated as the sum of products of unit cost of materials and their contents according to Equation (9).
where kj is unit cost of material and m is the content of component per 1 m3 of concrete.
C = Σ(kj × m) [pln/m3],
Unit costs of materials are collected from an online construction materials price list [44] or taken from the manufacturer (fly ash and ground granulated blast-furnace slag) [45].
Similarly to greenhouse gas emission, the function and its component is developed in order for users to use their own unit costs personalizing the tool.
3.2.4. Durability
Durability, defined as the ability to meet user requirements in specified conditions for a specified period of time, is a feature connected with the conditions in which the object is used. Concrete durability is determined by operational environment hazards, quantified as exposure classes according to EN 206:2014 described as corrosion risk due to carbonation, chlorides from sea water, chlorides other than seawater, frost, chemical aggression, and abrasion [46].
Including the durability factor in the utility function requires an arbitrary decision on the main durability hazard in specific analyzed situation. There are different parameters that dominate the service life of the concrete structure. For example, in marine environments, sulfate attacks or carbonation may be more effective than steel corrosion in deteriorating the structure because the bridge deck is placed far away from tidal and splash zones. For the case study, the domination and combination of other attacks must always be assessed and justified. In this research, the authors found that the frost damage of concrete and passivation of reinforcement due to loss of alkalinity caused by concrete’s carbonation are mentioned as the most common mechanisms limiting the durability of reinforced concrete under central European conditions. Users may, however, choose their own main durability hazard such as sulfate attack or marine environment. They should turn to the literature for a quantification of resistance to such hazards.
For the purpose of analysis outlined in this article, concrete resistance to carbonation (Rcarb) is chosen as a determinant of concrete durability. Standard PN-EN206:2014 determines the maximum water-cement index for this class equal to 0.5 and a minimum strength class as C25/30. The standard also sets the minimum cement content in concrete (300 kg/m3). Standard assumes concrete with such defined composition as resistant to carbonation in exposure to cyclic wet and dry conditions.
The general model of carbonation (Equation (10)) [47] can be transformed to Equation (11), which defines the time of durability of particular concrete.
where d is carbonation depth equal to the thickness of the cover [mm], kx is carbonation rate of given concrete [mm/year0.5], and tx is the time required for the carbonation front to reach a depth equal to the thickness of concrete cover that is the time of initiation of corrosion of reinforcement in the environment of analyzed concrete [year].
d = kx × tx0.5,
tx = d2/kx2,
If one assumes a situation where the user have to choose between two compositions of concrete, the carbonation depth would be constant, leading to time of durability, which according to durability definition is an actually durability, being only dependent on concrete’s carbonation rate. Studies, for example [48], show a greater correlation of carbonation rate to water-cement ratio rather than to cement content. Carbonation resistance is defined as the ratio of durability of the analyzed concrete to the durability of ordinary concrete meeting the requirements of the highest class of carbonation exposure—XC4, which is assumed to be carbonation resistant—Equation (12). Let the bottom index 0.5 refers to concrete with w/c = 0.5 and meeting other requirements of the XC4 exposure class and no index for the sample to be analyzed.
where Rcarb is carbonation resistance of analyzed concrete, t is time of durability of analyzed concrete and t0.5 is time of durability of carbonation resistant concrete (according to PN-EN206:2014).
Rcarb = t/t0.5,
Then, using the Equation (11) time of durability can be calculated for the concrete with w/c = 0.5, as t0.5 and time of durability of the analyzed sample as t.
t0.5 = d2/(k0.5)2,
t = d2/k2,
Using the previously mentioned indexes and equations,
where k/k0.5 is the coefficient of carbonation rate of the analyzed concrete in relation to carbonation rate of concrete with w/c = 0.5 and d is the concrete cover depth.
Rcarb = (d2/k2)/(d2/(k0.5)2),
Rcarb = (k0.5/k)2,
Equation (16), which describes the resistance to carbonation, allows to calculate it using carbonation rate coefficient k/k0.5. The carbonation rate k is widely described in literature. The defined Rcarb value is 1 for concrete with w/c = 0.5 and meeting other requirements of the XC4 exposure class and below 1 for less carbonate resistant concrete. Also, for concretes that are less susceptible to carbonation, Rcarb equals 1, even though the actual, calculated value is higher. A value of one means sufficient concrete carbonation resistance in the means of expected durability.
3.3. Carbonation Resistance Model
In order to allow to calculate carbonation resistance Rcarb on different databases, a model for carbonation coefficient, k/k0.5, is introduce, based on existing research on the subject of carbonation rate—k. The model is created separately for siliceous fly ash and ground granulated blast-furnace slag based on recent state-of-the-art. Both models are created in the computer program Statistica ver. 10.0.228.2 (TIPCO Software Inc., Palo Alto, CA, USA) using the least square method.
3.3.1. Research Database
The research materials used in this analysis are obtained from existing studies [49,50,51,52,53] containing the results of tests of Portland cement and the addition of silica fly ash or GGBS. Different levels of additions are implemented as cement replacement. The authors are aware that comparing the results of concrete tests from different sources, possibly with considerable material variability, increases the level of uncertainty in the course of the study and the conclusions that result. The authors also think that the proposed approach should be relatively versatile and useful for assessing various concretes. The database created for this study is primarily intended to verify the proposed tool and only secondly approximate the utility of specific concretes.
3.3.2. Carbonation Coefficient Model
In order to model the carbonation coefficient k/k0.5, carbonation rate—k research data were obtained from various sources—for the addition of siliceous fly ash ([49], Tables 3.3 and 4.10), ([50], Table 2) and for the addition of GGBS ([51], Figures 1, 5 and 6). The databases consist of cement, additive and water content in concrete as well as concrete carbonation rate—k. All the three datasets include a concrete without any additive, having a w/c = 0.5 and meeting other requirements of XC4 exposure class (reference concrete that is carbonation resistant).
3.3.3. Utility Analysis Database
In order to verify the analyzed utility tool databases consisting of laboratory concrete mixture proportions and compressive strengths were obtained from [42,43] for fly ash and [52,53] for GGBS addition. The additions are included in mixture as replacement of cement and therefore change its properties—they improve some and make other worse. The databases include ordinary concrete with pumpable consistency. High-strength concrete—compressive strength >50 MPa is not analyzed due to not common usage in Poland and more limited field of applications. Different additives were analyzed separately. Basing on concrete recipe, its cost—C, emission factor—E and carbonation resistance—Rcarb—were calculated.
4. Results
4.1. Carbonation Coefficient k/k0.5 Model
4.1.1. Fly Ash Additive
Studies [49,50] have shown that increase in the proportion of fly ash to cement in the binder results in a linear increase in the rate of carbonation k and thus the predicted decrease in concrete resistance to carbonation. At the same time, studies have shown that the increase in the water-binder ratio results in a linear increase in the k value. Based on data from mentioned studies, the authors proposed a model determining the carbonation coefficient k/k0.5 Equation (17), Equation (18) as a sum of products of two linear functions, representing fly ash content in the binder and w/b and the calculation method for Rcarb Equation (19).
where: w/b—mass ratio of water and binder (both cement and additive), f/b—percentage of fly ash in the binder, ai, bi, ci, di are coefficients. Coefficients ai, bi, ci and di are determined using the least squares method in Statistica for the best regression (Figure 1).
k/k0.5 = (ai × w/b + bi) × (ci × f/b + di),
k/k0.5 = (4.00 × w/b − 0.91) × (3.69 × f/b + 0.90),
Rcarb = 1/(k/k0.5)2, but Rcarb > 0 and Rcarb ≤ 1.0,
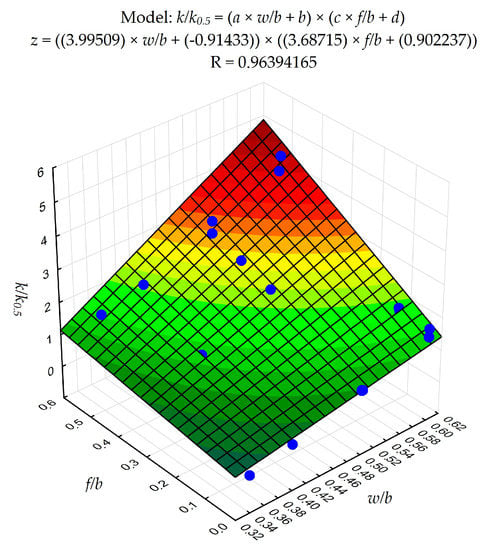
Figure 1.
Carbonation coefficients k/k0.5 model plotted against w/b and f/b with best regression for fly ash concrete.
The proposed model for carbonation coefficient k/k0.5 is characterized by high correlation coefficient value of 0.96. The model is equally dependent on w/b and fly ash content in binder. The model is accurate and can be used to calculate carbonation resistance in fly ash concrete.
4.1.2. GGBS Additive
Studies [5] indicate a linear increase in the carbonation coefficient along with an increase in the water-binder ratio. At the same time, studies [51] suggest a linear increase in carbonation coefficient along with an increase in slag content above 15%. Data from [51] served to create a carbonation coefficient k/k0.5 model using water/binder ratio and slag content in binder as a sum of products of two linear functions, representing GGBS content in the binder g/b and w/b Equation (20), Equation (21). The calculation method for Rcarb is the same as in Equation (19).
where w/b is the mass ratio of water and binder (both cement and additive), g/b is the percentage of GGBS in the binder, and ai, bi, ci, and di are coefficients. Coefficients ai, bi, ci, and di are determined using the least squares method in Statistica for the best regression (Figure 2).
k/k0.5 = (ai × w/b + bi) × (ci × g/b + di),
k/k0.5 = (3.36 × w/b − 1.00) × (1.42 × g/b + 1.28),
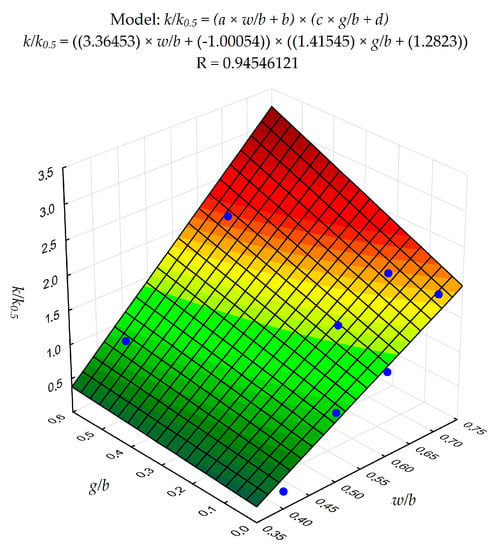
Figure 2.
Carbonation coefficients k/k0.5 model plotted against w/b and g/b with best regression for concrete with granulated blast-furnace slag (GGBS).
Correlation coefficient of proposed carbonation coefficient model equals 0.95. As expected, the carbonation coefficient strongly depends on w/b and less on slag content in the binder. Unlike fly ash additive, GGBS only mildly reduces carbonation resistance. The proposed model can be used to calculate carbonation resistance in concrete with GGBS.
4.2. Performance Analysis
In the analysis of desirability of concrete with additives, the authors adopt two cases of weighing of individual factors (Table 1).

Table 1.
Adopted cases of desirability criteria weights (signs as mentioned earlier).
In case 1, the authors assigned compressive strength, as the basic requirement for concrete, a weight of 0.4. As the second most important factor, the authors recognize the resistance to carbonation as a factor responsible for durability and gave it a weight of 0.3. Other features—cost and emission factor—are considered less important, not directly attributable to the utility of concrete, and are given a weight of 0.2 and 0.1 respectively.
In case 2, emission factor (weight 0.4) is adopted as the most important factor, leaving the sequence of the remaining factors unchanged from case 1. The choice of emission factor as the most important one is due to growing interest in environmental protection and sustainable development.
4.2.1. Concrete with Fly Ash
Graphically presented results (Figure 3a,b) indicate that if higher weights are taken for factors related to technical characteristics (strength and carbonation resistance), the concrete desirability increases with decreasing w/b (obviously), but practically does not depend on fly ash proportion in the binder—case 1 (Figure 3a). This means that the ratio of Rcarb and E both with C is well balanced by positive influence of fly ash (emission and cost reduction) and its adverse effect (carbonation resistance). If the dominating component is emission factor (case 2, Figure 3b), the increase in fly ash proportion in the binder increases utility (despite the reduction of carbonation resistance) to a similar extent as the reduction of the water-binder ratio.
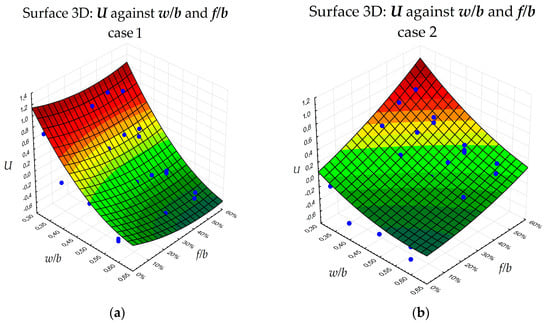
Figure 3.
Utility of concrete with siliceous fly ash in function of w/b and f/b: (a) weight case 1; (b) weight case 2.
4.2.2. Concrete with GGBS
Results of utility analysis of concrete with GGBS are presented graphically (Figure 4a,b). Conclusions are identical as in case of concrete with fly ash, however GGBS does not increase utility with extremely low w/b—around 0.3. This effect may happen because of relatively short time of curing for GGBS concrete, which is usually tested after 56 or 90 days due to the longer time of optimal hydration. While using the utility function, the user should pay attention to proper selection of curing time. On the other hand, under construction conditions, a short time of curing is necessary to obtain the desired formwork efficiency.
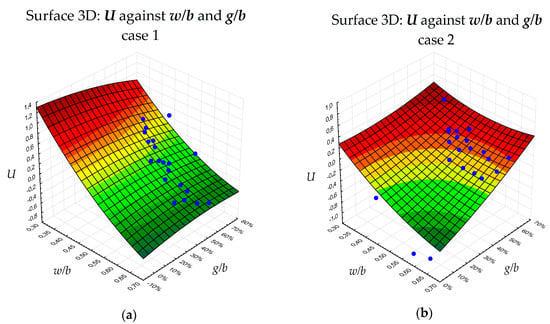
Figure 4.
Utility of concrete with GGBS in function of w/b and g/b: (a) weight case 1; (b) weight case 2.
5. Summary and Conclusions
Previous studies have shown advanced performance and cost optimization of sustainable concrete modelling. Such modelling is highly useful for concrete technologist, but at the same time, it is complicated and not intuitive. In order to start assessing concrete with regard to performance, cost, and sustainability, a tool to quickly measure concrete utility was proposed in this paper. The simplicity of the tool and four complex concrete characteristics respond to the needs indicated by other authors [35,38]. Previous analysis was conducted by measuring only two or three aspects (such as cost/benefit or ecological/benefit ratio) [24,30,31,32,33,34].
The analysis is an attempt to evaluate the multi-criteria impact of fly ash or GGBS addition in concrete on its performance, including the main technical aspects (compressive strength and carbonation durability), ecological (emission factor), and economic (cost). The proposed approach allows those factors to be considered in a way that is based on the user’s expectations by assigning appropriate weight factors. The proposed tool is universal and may be useful for assessing other modifications of concrete.
The analyzed population of concretes with fly ash or GGBS was used to obtain the model. The authors are aware that a database consisting of data from different sources may be fraught with errors. It has been shown that if higher weights are taken for factors related to technical characteristics, the usefulness increases with decreasing water to binder ratio and to a much lower extent on the proportion of fly ash or GGBS in the binder. The same relation has been reported [25,27,28,32,33] that high-performance concrete is more desired than ordinary concrete. If the dominating factor is the emission factor, increasing the ash or GGBS proportion in the binder as well as lowering the water:binder ratio increases utility. Similar impacts were reported in [15,26,27,28], pointing toward the robustness of the desirability function.
Although the authors presented two weight cases, users of the desirability function can enter their own weights. Implemented values have to be carefully selected, as improper ones can distort the result. Proposed weights of f28, Rcarb, E, and C implement various performance parameters of sustainable concrete. A review of the previous literature shows that such a complex approach, including technical, environmental, and economical characteristics of concrete, has not yet been implemented.
In order to formulate the viable model, verification of the wider group of data is required. Existing quantification of carbonation durability requires testing of carbonation rate “k” on every concrete sample. Models for concrete with fly ash or GGBS are both relatively accurate and are characterized by high correlation coefficients.
Acknowledgments
Part of the research leading to these results was supported by the funds from the Kosciuszko Foundation Fellowship obtained by Karol J. Kowalski.
Author Contributions
Rafal Latawiec and Karol J. Kowalski conceived and designed the experiments; Rafal Latawiec collected data; Rafal Latawiec, Piotr Woyciechowski, and Karol J. Kowalski analyzed the data; Rafal Latawiec, Piotr Woyciechowski, and Karol J. Kowalski wrote the paper.
Conflicts of Interest
The authors declare no conflict of interest. The founding sponsors had no role in the design of the study; in the collection, analyses, or interpretation of data; in the writing of the manuscript, and in the decision to publish the results.
References
- European Ready Mixed Concrete Organization (ERMCO). ERMCO Statistics 2015. Available online: www.ermco.eu/document/ermco-statistics-2015-final-pdf/ (accessed on 9 December 2017).
- Czarnecki, L.; Justnes, H. Sustainable durable concrete. Cem. Lime Concr. 2012, 6, 341–362. [Google Scholar]
- Maas, G.P. Comparison of Quay Wall Designs in Concrete, Steel, Wood and Composites with Regard to the Co-Emission and the Life Cycle Analysis. Master’s Thesis, Delft University of Technology, Delft, The Netherlands, 18 February 2011. [Google Scholar]
- Kajaste, R.; Hurme, M. Cement industry greenhouse gas emissions—Management options and abatement cost. J. Clean. Prod. 2016, 112, 4041–4052. [Google Scholar] [CrossRef]
- Czarnecki, L.; Woyciechowski, P. Model of concrete carbonation as limited process—Experimental investigations of fluidal ash concrete. In Brittle Matrix Composites; Brandt, A.M., Olek, J., Glinicki, M.A., Leung, C.K.Y., Eds.; Woodhead Publishing Ltd.: Cambridge, UK, 2009; Volume 9, pp. 183–194. [Google Scholar]
- Kim, T.; Chae, C. Evaluation analysis of the CO2 emission and absorption life cycle for precast concrete in Korea. Sustainability 2016, 8, 663. [Google Scholar] [CrossRef]
- Kashef-Haghighi, S.; Shao, Y.; Ghoshal, S. Mathematical modeling of CO2 uptake by concrete during accelerated carbonation curing. Cem. Concr. Res. 2015, 67, 1–10. [Google Scholar] [CrossRef]
- Xi, F.; Davis, S.; Ciais, P.; Crawford-Brown, D.; Guan, D.; Pade, C.; Shi, T.; Syddall, M.; Lv, J.; Ji, L.; et al. Substantial global carbon uptake by cement carbonation. Nat. Geosci. 2016, 9, 880–883. [Google Scholar] [CrossRef]
- García-Segura, T.; Yepes, V.; Alcalá, J. Life cycle greenhouse gas emissions of blended cement concrete including carbonation and durability. Int. J. Life Cycle Assess. 2014, 19, 3–12. [Google Scholar] [CrossRef]
- Hasanbeigi, A.; Price, L.; Lin, E. Emerging energy-efficiency and CO2 emission-reduction technologies for cement and concrete production: A technical review. Renew. Sustain. Energy Rev. 2012, 16, 6220–6238. [Google Scholar] [CrossRef]
- EFCA. EFCA Environmental Declaration Superplasticizing Admixtures—June 2002. 2002. Available online: https://www.google.com.sg/url?sa=t&rct=j&q=&esrc=s&source=web&cd=1&ved=0ahUKEwiwpIiH5qHZAhWKgI8KHeiYBe8QFgglMAA&url=https%3A%2F%2Fswe.sika.com%2Fdms%2Fgetdocument.get%2F60b7f6a6-92fc-36b7-ae01-45e0c48e395d%2FSuperplasticizerED.pdf&usg=AOvVaw2Cy3NFA2aJezks9IrtmWuI (accessed on 9 December 2017).
- Sjunnesson, J. Life Cycle Assessment of Concrete; Lund University: Lund, Sweden, 2005. [Google Scholar]
- Turner, L.K.; Collins, F.G. Carbon dioxide equivalent (CO2-e) emissions: A comparison between geopolymer and OPC cement concrete. Constr. Build. Mater. 2013, 43, 125–130. [Google Scholar] [CrossRef]
- Marinković, S.B.; Malešev, M.; Ignjatovic, I. Life cycle assessment (LCA) of concrete made using recycled concrete or natural aggregates. In Eco-Efficient Construction and Building Materials; Woodhead Publishing: Cambridge, UK, 2014; Volume 11, pp. 239–266. ISBN 978-0-85709-045-4. [Google Scholar]
- Mohammadi, J.; South, W. Life cycle assessment (LCA) of benchmark concrete products in Australia. Int. J. Life Cycle Assess. 2017, 22, 1588–1608. [Google Scholar] [CrossRef]
- Yang, Z.; Kowalski, K.J.; Olek, J.; Nantung, T. Effects of sand characteristics and fly ash contents on properties of flowable fill. ACI Mater. J. 2014, 111, 543–552. [Google Scholar] [CrossRef]
- Kowalski, K.J.; Yang, Z.; Olek, J.; Nantung, T. Development of specification for accelerated approval process of flowable fill mixtures. J. Mater. Civ. Eng. 2009, 21, 740–748. [Google Scholar] [CrossRef]
- Radlińska, A.; Yost, J.R.; Salera, M.J. Material properties of structurally viable alkali-activated fly ash concrete. J. Mater. Civ. Eng. 2013, 25, 1456–1464. [Google Scholar] [CrossRef]
- Dembovska, L.; Bajare, D.; Ducman, V.; Korat, L.; Bumanis, G. The use of different by-products in the production of lightweight alkali activated building materials. Constr. Build. Mater. 2017, 135, 315–322. [Google Scholar] [CrossRef]
- Yost, J.R.; Radlińska, A.; Ernst, S.; Salera, M. Structural behavior of alkali activated fly ash concrete. Part 1: Mixture design, material properties and sample fabrication. Mater. Struct. 2013, 46, 435–447. [Google Scholar] [CrossRef]
- Hong, J.; Shen, Q.G.; Peng, Y.; Feng, Y.; Mao, C. Uncertainty analysis for measuring greenhouse gas emissions in the building construction phase: A case study in China. J. Clean. Prod. 2016, 129, 183–195. [Google Scholar] [CrossRef]
- Załęgowski, K.; Jackiewicz-Rek, W.; Garbacz, A.; Courard, L. Carbon footprint of concrete (in Polish). Mater. Bud. 2013, 12, 34–36. [Google Scholar]
- Hasanbeigi, A.; Menke, C.; Therdyothin, A. Technical and cost assessment of energy efficiency improvement and greenhouse gas emission reduction potentials in Thai cement industry. Energy Effic. 2011, 4, 93–113. [Google Scholar] [CrossRef]
- Zastrow, P.; Molina-Moreno, F.; García-Segura, T.; Martí, J.V.; Yepes, V. Life cycle assessment of cost-optimized buttress earth-retaining walls: A parametric study. J. Clean. Prod. 2017, 140, 1037–1048. [Google Scholar] [CrossRef]
- Kim, T.; Chae, C.; Kim, G.; Jang, H. Analysis of CO2 emission characteristics of concrete used at construction sites. Sustainability 2016, 8, 348. [Google Scholar] [CrossRef]
- Kim, T.; Lee, S.; Chae, C.; Jang, H.; Lee, K. Development of the CO2 emission evaluation tool for the life cycle assessment of concrete. Sustainability 2017, 9, 2116. [Google Scholar] [CrossRef]
- Baek, C.; Tae, S.; Kim, R.; Shin, S. Life cycle CO2 assessment by block type changes of apartment housing. Sustainability 2016, 8, 752. [Google Scholar] [CrossRef]
- Cho, S.-H.; Chae, C.-U. A study on life cycle CO2 emissions of low-carbon building in South Korea. Sustainability 2016, 8, 579. [Google Scholar] [CrossRef]
- Stengel, T.; Schießl, P. Life cycle assessment (LCA) of ultra high performance concrete (UHPC) structures. In Eco-Efficient Construction and Building Materials; Woodhead Publishing: Cambridge, UK, 2014; Volume 22, pp. 528–564. ISBN 978-0-85709-045-4. [Google Scholar]
- Yepes, V.; Martí, J.V.; García-Segura, T. Cost and CO2 emission optimization of precast–prestressed concrete U-beam road bridges by a hybrid glowworm swarm algorithm. Autom. Constr. 2015, 49, 123–134. [Google Scholar] [CrossRef]
- Yeo, D.; Potra, F.A. Sustainable design of reinforced concrete structures through CO2 emission optimization. J. Struct. Eng. 2015, 141, B4014002. [Google Scholar] [CrossRef]
- Baykasoğlu, A.; Öztaş, A.; Özbay, E. Prediction and multi-objective optimization of high-strength concrete parameters via soft computing approaches. Expert Syst. Appl. 2009, 36, 6145–6155. [Google Scholar] [CrossRef]
- Ozbay, E.; Oztas, A.; Baykasoglu, A.; Ozbebek, H. Investigating mix proportions of high strength self compacting concrete by using Taguchi method. Constr. Build. Mater. 2009, 23, 694–702. [Google Scholar] [CrossRef]
- Kim, H.T. Assessment of construction cost saving by concrete mixing the activator material. Sustainability 2016, 8, 403. [Google Scholar] [CrossRef]
- Finkbeiner, M.; Schau, E.M.; Lehman, A.; Traverso, M. Towards life cycle sustainability assessment. Sustainability 2010, 2, 3309–3322. [Google Scholar] [CrossRef]
- Barecka, M.H.; Zbicinski, I.; Heim, D. Environmental, energy and economic aspects in a zero-emission façade system design. Manag. Environ. Qual. Int. J. 2016, 27, 708–721. [Google Scholar] [CrossRef]
- Keeble, B.R. The Brundtland Report: ‘Our common future’. Med. War 1988, 4, 17–25. [Google Scholar] [CrossRef]
- Marinković, S. On the selection of the functional unit in LCA of structural concrete. Int. J. Life Cycle Assess. 2017, 22, 1634–1636. [Google Scholar] [CrossRef]
- Drobiec, Ł.; Jasiński, R.; Piekarczyk, A. Diagnostic of Reinforced Concrete Structures, Methodology, Field and Laboratory Tests of Concrete and Steel (in Polish); Wydawnictwo Naukowe PWN: Warsaw, Poland, 2010; ISBN 978-830-116-103-3. [Google Scholar]
- International Organization for Standardization (ISO). ISO 14067:2013, Carbon Footprints of Products—Requirements and Guidelines for Quantification and Communication; ISO: Geneva, Switzerland, 2013. [Google Scholar]
- Martínez-Rocamora, A.; Solís-Guzmán, J.; Marrero, M. LCA databases focused on construction materials: A review. Renew. Sustain. Energy Rev. 2016, 58, 565–573. [Google Scholar] [CrossRef]
- Rouwette, R. LCA of Geopolymer Concrete (E-Crete); start2see Pty Ltd.: Melbourne, Australia, 2012. [Google Scholar]
- Higgins, D. Sustainable concrete: How can additions contribute? In Annual Technical Symposium; The Institute of Concrete Technology: Surrey, UK, 2006. [Google Scholar]
- Material Costs. Available online: http://www.Cennik-budowlany.Pl (accessed on 24 May 2015).
- Latawiec, R. Lafarge Poland. Internal Construction Company Data/Poland. 2017; Unpublished data. [Google Scholar]
- PN-EN 206:2014-04. Concrete—Part 1: Specification, Performance, Production and Conformity. 2014. Available online: https://sklep.pkn.pl/pn-en-206-2014-04p.html (accessed on 27 December 2017). (In Polish).
- Woyciechowski, P. Influence of mineral additives on concrete carbonation. In Brittle Matrix Composites 10; Brandt, A.M., Olek, J., Glinicki, M.A., Leung, C.K.Y., Eds.; Woodhead Publishing Ltd.: Cambridge, UK, 2012; pp. 115–124. [Google Scholar]
- Czarnecki, L.; Emmons, P.H. Repair and Protection of Concrete Structures (in Polish); Polski Cement: Kraków, Poland, 2002. [Google Scholar]
- Burden, D. The Durability of Concrete Containing High Levels of Fly Ash. Master’s Thesis, University of New Brunswick, Fredericton and Saint John, NB, Canada, 3 January 2006. [Google Scholar]
- Khunthongkeaw, J.; Tangtermsirikul, S.; Leelawat, T. A study on carbonation depth prediction for fly ash concrete. Constr. Build. Mater. 2006, 20, 744–753. [Google Scholar] [CrossRef]
- Collepardi, M.; Collepardi, S.; Olagot, J.O.; Simonelli, F. The influence of slag and fly ash on the carbonation of concrete. In Proceedings of the ACI SP-221-29 Eighth CANMET/ACI International Conference on Fly Ash, Silica Fume, Slag, and Natural Pozzolans in Concrete, Las Vegas, NV, USA, 23–29 May 2004; pp. 23–29. [Google Scholar]
- Malhotra, V.M. Mechanical properties and freezing and thawing durability of concrete incorporating a ground granulated blast-furnace slag. Can. J. Civ. Eng. 1989, 16, 140–156. [Google Scholar] [CrossRef]
- Oner, A.; Akyuz, S. An experimental study on optimum usage of GGBS for the compressive strength of concrete. Cem. Concr. Compos. 2007, 29, 505–514. [Google Scholar] [CrossRef]
© 2018 by the authors. Licensee MDPI, Basel, Switzerland. This article is an open access article distributed under the terms and conditions of the Creative Commons Attribution (CC BY) license (http://creativecommons.org/licenses/by/4.0/).