Article

Freshwater Diatoms as Indicators of Combined Long-Term Mining and Urban Stressors in Junction Creek (Ontario, Canada)

1
Centre Eau Terre Environnement, Institut national de la recherche scientifique, 490 rue de la Couronne, Québec, QC G1K 9A9, Canada
2
Irstea, UR EABX, 50 avenue de Verdun, 33612 Cestas cedex, France
*
Author to whom correspondence should be addressed.
Environments 2018, 5(2), 30; https://doi.org/10.3390/environments5020030
Submission received: 28 December 2017 / Revised: 7 February 2018 / Accepted: 9 February 2018 / Published: 21 February 2018
(This article belongs to the Special Issue Environmental Toxicology of Trace Metals)

Abstract

:
Sudbury (Ontario, Canada) has a long mining history that has left the region with a distinctive legacy of environmental impacts. Several actions have been undertaken since the 1970s to rehabilitate this deteriorated environment, in both terrestrial and aquatic ecosystems. Despite a marked increase in environmental health, we show that the Junction Creek system remains under multiple stressors from present and past mining operations, and from urban-related pressures such as municipal wastewater treatment plants, golf courses and stormwater runoff. Water samples have elevated metal concentrations, with values reaching up to 1 mg·L−1 Ni, 40 μg·L−1 Zn, and 0.5 μg·L−1 Cd. The responses of diatoms to stressors were observed at the assemblage level (metal tolerant species, nutrient-loving species), and at the individual level through the presence of teratologies (abnormal diatom frustules). The cumulative criterion unit (CCU) approach was used as a proxy for metal toxicity to aquatic life and suggested elevated potential for toxicity at certain sites. Diatom teratologies were significantly less frequent at sites with CCU values <1, suggesting “background” metal concentrations as compared to sites with higher CCU values. The highest percentages of teratologies were observed at sites presenting multiple types of environmental pressures.

1. Introduction

The region of Sudbury (400 km north of Toronto, Ontario, Canada) and its surroundings is well-known for its legacy of intense mining that resulted in vast ecological damage due to acidification and metal contamination. Among the seriously impacted aquatic ecosystems in close vicinity to the Sudbury mining activities is the Junction Creek system. This river and its tributaries were once the recipients of several untreated industrial and municipal effluents, as well as a sink for atmospheric deposition. The health of Junction Creek was impacted by the contamination and degradation in its watershed, and showed highly impaired biological integrity [1]. Still nowadays, despite pollution control and rehabilitation actions having been undertaken, aquatic ecosystems in the region suggest slow recovery [2,3,4,5,6]. Mining activities are still present in the region, although under significantly more restrictive pollution control and regulation, and intensification of urban development represents a supplementary environmental threat.
The Junction Creek system has been well studied in the past to assess its ecological degradation in response to mining activities, and its recovery following improved management of atmospheric deposition and wastewaters. However, to our knowledge, most studies focused on water chemistry, invertebrates and fish, leaving a gap in information on biofilms. Composed of algae, fungi, bacteria and protozoans embedded in a polysaccharide matrix, biofilms are a complex aggregation of microorganisms and constitute the basis of most lotic ecosystem food webs. Biofilm integrity is, therefore, essential in keeping a healthy biological status at the ecosystem scale, as it is a key entry point for contaminants into the trophic chain. For example, biofilms accumulate metals that are then susceptible to reach higher organisms through their diet [7], causing multiple deleterious effects on reproduction, behavior, fatty acid composition, survival, etc. (e.g., [8,9]). Intracellular metal concentrations in biofilms are proportional to free metal concentrations in the water, offering an interesting proxy to estimate bioavailable metals in the water column [10,11]. Diatoms (unicellular algae), often the dominant constituent of stream biofilms, are sensitive to changes in water chemistry and respond quickly to environmental fluctuations by changes in the structure of their assemblages (e.g., increase in pollution-tolerant species) [12]. Due to their sensitivity to fluctuations in water quality, their ubiquity, ease of sampling, and low analytical costs, this algal group is widely used as indicators of biological integrity and numerous diatom-based indices have been developed for routine assessment of overall ecosystem health (e.g., [12,13,14]). Diatoms have also been used to specifically reflect metal contamination, and metal-tolerant species are promising indicators of contamination (see Morin et al. [15] and references therein). Moreover, deformities in diatom frustules (silica shells) are used as a biomarker in response to environmental perturbations such as contamination by metals and organic compounds (e.g., [16,17,18]).
The purpose of this study was to combine chemical and biological monitoring for assessing health and ecological integrity of aquatic ecosystems in the Sudbury region, including Junction Creek and its tributaries, with focus on metal contamination. More specifically, the objectives of the study were (i) to evaluate overall stream biological integrity based on diatom assemblages, (ii) to assess changes in diatom assemblage composition with increasing metal contamination, and (iii) to investigate the presence of diatom deformities (teratologies) in response to metal contamination. The selected sites were also subjected to other environmental pressures such as nutrient loads that may act as additional stressors affecting the response of diatom assemblages, thus offering interesting conditions for multi-stress assessment. This particular study area is therefore an interesting example where environmental pressures such as urban activities may exacerbate stresses from past and present mining activities and thus affecting system recovery. This has been previously observed where a greater number of cumulative environmental stressors resulted in more significant impacts on diatom assemblages [19], although some antagonistically acting stressors have been evidenced (e.g., metals versus nutrients [20,21]). The present study provides groundwork for assessing stream biological integrity based on diatom descriptors, and brings valuable information to be used in further monitoring of the Junction Creek system recovery and health. Mining activities in Canada are expected to increase, especially in relatively pristine northern regions (e.g., the Quebec Plan Nord, the Ontario Ring of Fire, and the Northwest Territories Mining Initiative). Despite the fact that mining companies are subjected to comply with stricter environmental regulations under the Canadian Mining Act (operating since 1995) to ensure site rehabilitation after mine closure, ecosystems in proximity to mining operations are still at risk of physical, chemical and biological alteration. Monitoring past and present effects of mining on nearby ecosystems and assessing losses in ecological integrity and services offer strong support to further reduce emissions from industrial activities and to stimulate research on best management practices.

2. Materials and Methods

2.1. A Brief History of Mining Around Sudbury and the Resulting Ecological Damages

Sudbury has a long mining history, with its first smelter having been built at Copper Cliff in 1888. This region has one of the most productive nickel and copper mining operations in the world, with other metals such as zinc, cobalt, precious metals and platinum-group elements also currently mined and processed in the area. While mining companies are nowadays relatively more eco-aware, environmental preoccupations were not on the agenda before the 1980s. Open-air roasting (processing step) occurred, releasing sulfur dioxide. Atmospheric emissions were estimated at over 100 million of tons of SO2 and thousands of tons of metal particles [22,23]. Along with forest fires and clear-cut logging (large amounts of wood were necessary for roasting), this industrial process led to the destruction of nearly 20,000 ha of land and to about 80,000 ha of semi-barren landscape [23]. Outdoor roasting was common to the end of the 1920s when it was banned by the Ontario Government, following which three smelting plants were built (Copper Cliff, Coniston and Falconbridge). Smelter emissions in the Sudbury area were one of the world’s largest point sources of SO2 emissions during the 1960s, accompanied by thousands of tons of emitted metal particles [24]. Metal contamination has been documented since the 1960s in the Junction Creek area and its surroundings [1].
Technological development and legislative control have led to a 90% reduction in SO2 and particulate matter emissions between 1967 and the 1990s [23,25]. A stack rising 380 m above the Canadian Shield floor was built in 1972 (Inco Superstack), spreading smelting fumes to a much larger area. Several rehabilitation actions were taken, such as liming and grassing of the barren areas, and replanting millions of trees. Life was also slowly reintroduced to the surrounding lakes and streams, as algae, zooplankton, zoobenthos and fish showed signs of recovery [26]. Since the 1970s, the health and integrity of the affected area markedly improved, and the region is now on a path to recovery. Colossal efforts were undertaken to rehabilitate and revive the area, with particular attention given to Junction Creek (e.g., abatement of mining and municipal untreated effluents, shoreline stabilization, tree-plantings) and have drastically improved the overall health of this region. However, anthropogenic inputs such as mining effluents, treated municipal wastewater, urban runoff, and air-born particles still pose a threat to the integrity of Junction Creek and nearby waterbodies. In addition, this system suffers from over 100 years of mining-related contamination now accumulated in sediments, as observed in the lakes along its course. For example, Kelly Lake (2.4 km2) is a water body well-known for its contamination in copper, nickel, palladium, iridium, and platinum [27]. In addition to being metal-contaminated, Kelly Lake sediments are loaded with phosphorus, as Junction Creek used to be a point-source of raw sewage effluents [27]. A large creosote plant, in operation from 1921 to 1960, also contributed to the contamination of Kelly Lake sediments by polycyclic aromatic hydrocarbons (PAH) as waste materials sometimes leaked into Junction Creek [27].
About 7000 lakes were acid-damaged to the point of biological impairment by mining activities in the Sudbury area [28], and although many now show signs of recovery from acidification [24,29], metal contamination and other persistent ecological damages still impair their integrity. Biological recovery has been observed in fish, zooplankton, phytoplankton and zoobenthos, but remained at an early stage in many lakes lying in close proximity to Sudbury in studies conducted in the late 1990s and early 2000s (see review in Keller et al. [24], and references therein). On the other hand, analysis of long-term monitoring data (1988–2002) from 17 acidified lakes located about 200 km south-east of Sudbury suggests that benthic macroinvertebrate communities have recovered from acidification due to long-range transport of air pollutants [30]. Despite rehabilitation actions and improved physico-chemical properties, Junction Creek shows similar responses to what was observed in surrounding lakes where signs of biological perturbations are still present. For example, a study on macroinvertebrate assemblages from 2000 to 2008 suggests slow recovery in Junction Creek (Frood Branch) after diversion of acid mine drainage in 2000, when many large sensitive invertebrates were still lacking [2]. Although metal contamination has drastically been reduced in the region, Weber et al. (2008) also showed biological impacts with increasing metal concentrations (Cd, Cu, Rb, Se, and Sr) in fathead minnow and creek chub along a downstream gradient in Junction Creek.

2.2. Study Area

The study was conducted in streams and creeks of the Greater Sudbury area and its surroundings, characterized by Canadian Shield bedrock geology. This boreal region has a relatively flat topography, and a humid continental climate with long cold/snowy winters (six-months of snow cover) and warm/hot summers. At the time of sampling (September 2016), air temperature was warm (~20 °C) and water levels in the watershed were low, as recommended for diatom sampling [31].
A total of 19 sites were selected for this study, with nine sites positioned along an upstream/downstream gradient in Junction Creek (sites JC1–JC9; Figure 1). The Junction Creek system, which is 54 km in length, is a tributary of the Vermilion River, itself discharging into the Spanish River (tributary of Lake Huron). This watercourse flows through the City of Greater Sudbury, has five main tributaries (Nolin Creek, Copper Cliff Creek, Frood Branch Creek, Maley Branch Creek and Garson Branch Creek), and encompasses several lakes. In addition to potential contamination from mining effluents and atmospheric deposition, Junction Creek and its tributaries also suffer from other anthropogenic activities such as discharge from the Sudbury municipal wastewater treatment facilities (entering Junction Creek 200 m below the Copper Cliff Creek confluence), urban runoff, and golf courses. JC1 is located in the upper portion of Junction Creek, in the Garson community (now part of the Greater Sudbury area) and receives water from Garson Branch Creek carrying treated effluents from Garson mine. Junction Creek then flows through Greater Sudbury (JC2 to JC6) and receives waters from tributaries along the way. A sampling site was positioned on Frood Branch Creek (FBC), which reaches Junction Creek between JC4 and after JC5. Frood Branch Creek has a history of important acid mine drainage from the Frood/Stobie (oldest mine complex in Sudbury) mine tailings, but diversion construction in 2000 and reclamation action taken at the site greatly improved water quality [32]. While mining activities ceased at Frood mine in 2012, Stobie was still operating at the time of the present study (2016). Two sites were positioned on each branch of Nolin Creek (NC1 and NC2), and a third site was positioned where the branches merge (NC3) and discharge into Junction Creek between JC5 and JC6. The NC1 branch collects treated mining effluent from Nolin mine, while NC2 does not receive direct point-source effluents but may still be impacted by diffuse contamination. JC7 was sampled before Junction Creek enters Kelly Lake and is impacted by inflowing waters from Copper Cliff Creek (CCC) draining tailings and is receiving treated water effluents from Copper Cliff mine and smelter as well as effluents from a sewage treatment plant. A sampling site was positioned downstream of Kelly Lake outflow (JC8). The last site on the Junction Creek gradient (JC9) was positioned just after Mud Lake.
A reference site was selected on Maley Branch Creek (MBC), which extends well north and reaches Junction Creek before JC3. This site does not experience direct mine effluents, although it is still at risk of atmospheric deposition from mining activities and nutrient input from urban development and a nearby golf course. A reference site was also sampled on Veuve River (VR), near Markstay (about 40 km from Sudbury). It should be noted that here, the term “reference” suggests that the sites are minimally affected by mining activities, but they may still be experiencing certain anthropogenic pressures. Three other sites were selected on Coniston Creek (CC1–CC3), a tributary of Whatapitei River. Although the Coniston smelter closed in 1972, the slag pile has been left largely un-remediated and may contribute to the contamination of nearby aquatic ecosystems [33]. In addition, one of the sources of the creek is a wetland near a mining property in Falconbridge (where large slag piles are still present [33]). These sites may also be influenced by past and present atmospheric depositions from the Sudbury area (about 10 km away). These last three sites were therefore selected as least-impacted sites, i.e., outside of intense Sudbury activities but still at risk of mining and urban contamination to a certain extent.

2.3. Water and Biofilm Collection

Sampling was carried-out within three consecutive dry days and avoiding rain events prior to sampling with the purpose of collecting biofilms and water samples under low flow conditions. Samples for water chemistry analyses were collected in triplicates, and inadvertent sample contamination due to handling was verified by on-site preparation of field blanks using ultra-pure water. Material used for samples destined for the analysis of cations and dissolved organic carbon (DOC) was previously soaked for 24 h in nitric acid 10% (v/v), and rinsed eight times with ultrapure water. Material used for samples for anion concentration analyses was previously rinsed eight times with ultra-pure water. Water collected for anions, cations, and dissolved organic carbon (DOC) was collected in 20 ml polypropylene Nalgene bottles using syringes and polysulfonate filters (0.45 μm; VWR International). Samples collected for cations analyses were acidified to 2.6% nitric acid (v/v) (trace metal grade; Fisher). Water collected for total phosphorus (TP) was acidified to 0.2% sulfuric acid (v/v). Biofilms were collected from the top surface of 5–10 rocks (composite samples) using a new toothbrush at each site. Water and biofilm samples were stored in the dark at 4°C until they were processed. Conductivity, temperature and pH were measured on-site with portable instruments (Sevengo SG3, Mettler Toledo; Denver Instrument UP-10).

2.4. Water Chemistry and Diatom Assemblage Analyses

Anions (F, Cl, SO42−, NO3) were analysed by ion chromatography (Dionex AutoIon; System DX300), TP was analyzed by persulfate digestion and manual colorimetry (SM 4500-PB), and DOC was analyzed using a total organic carbon analyzer (TOC-500A; Shimadzu). Cations (Na+, Mg2+, Al3+, K+, Ca2+, Mn2+, Fe3+, Ni2+, Cu2+, Cd2+, Pb2+, Zn2+) were analyzed by inductively coupled plasma–atomic emission spectrometry (ICP-AES; Varian Vista AX CCD). Copper, cadmium, zinc and lead were also analyzed by inductively coupled plasma–mass spectrometry (ICP-MS; Thermo instrument model X7). Values lower than field blank values were excluded from subsequent analyses. Detection limits are presented in Table 1.
Lyophilized biofilms were digested to remove organic matter and to clean diatom frustules from cell content. Biofilm subsamples were placed in 800 μL of 100% (v/v) nitric acid for 48 h, and 200 μL of hydrogen peroxide 30% (v/v) were added for another 48 h. Following complete digestion of organic material, samples were rinsed several times to remove nitric acid. Microscope slides were prepared for cleaned diatom observation using Naphrax® as the mounting medium (refractive index: 1.74; Brunel microscopes Ltd., Wiltshire, UK). Diatom assemblages were observed under a Reichert-Jung Polyvar microscope equipped with differential interference contrast (magnification 1250×). A minimum of 400 diatom valves were identified on each slide and diatom assemblages were expressed as relative abundances of the species assemblage. Taxonomic identification mainly followed Lavoie et al. [34]. Diatom frustule deformations were noted and classified as (i) irregular valve shape, (ii) irregular raphe, (iii) irregular striae, (iv) mixed [35].
The Eastern Canadian Diatom Index (IDEC; Indice Diatomées de l’Est du Canada [12,36]) was used to evaluate general biological integrity of the sampling sites. The IDEC was specifically developed to estimate water quality in Quebec and Ontario streams in agricultural and urban areas, and mainly informs on trophic status (nutrients), salinity, pH and organic matter loads [12,36]. An IDEC value was calculated for each diatom assemblage using the IDEC-neutral, which is the recommended sub-index to use based on the characteristics of the studied watersheds (geology, surficial deposits [12,36,37]). IDEC scores range between 0 and 100, with low values indicating poor biological integrity. The IDEC provides an overall water quality evaluation, and was not developed for metal contamination assessment. The abundance of abnormal diatom valves (% teratologies) was used as a complementary proxy of diatom-specific response to metals, as well as the presence of diatom species known as tolerant to metal contamination. A canonical correspondence analysis (CCA) was performed using Canoco 4.5 [38] to explore the diatom assemblage-water chemistry relationships and to visualize site distribution. Only the taxa with an abundance of at least 1% in at least one sample were included in the CCA. Diatom data were square root transformed and rare taxa were down weighted prior to running the CCA. Indicator species analysis, an approach used to determine indicator species characterizing groups of sites (based on the species relative abundance and its relative frequency of occurrence in each group), was conducted with the method of Dufrêne and Legendre [39] using PC-ORD version 6 [40].

2.5. Toxicity Criteria and CCU Calculation

Cumulative criterion unit (CCU) [41] was calculated at each site as the sum of the ratios between metal concentrations in a sample and their toxicity criterion values (CCU = Σi(mi/ci), mi = total recoverable metal concentration, ci = criterion value for the ith metal). The metals included in the CCU calculation were Al, Cu, Cd, Ni, Pb, and Zn. Toxicity criteria were based on the Canadian water quality guidelines for the protection of aquatic life established by the Canadian Council of Ministers of the Environment [42]. The criteria were adjusted for water hardness to account for the competitive effect of major cations like magnesium and calcium for binding sites on cell membranes, which reduces metal toxicity (e.g., [10,11]). Hardness was calculated at each site based on aqueous concentrations of Ca and Mg (in mg/L) using the equation: hardness (mg equivalent CaCO3/L) = ([Ca] × 2.497) + ([Mg] × 4.118) following Standard method for the examination of water and wastewater 2340B—Hardness by calculation). Calculated hardness values and criteria for metal toxicity at each site are shown in Table 1. The criteria used in the present study differ from the US EPA guidelines [43]. However, the values are generally in the same order of magnitude and therefore comparable. Only the criterion for aluminum was based on the US EPA recent guidelines because it accounts for pH, DOC, and hardness [43], rather than pH only. Four categories of CCU were used following the thresholds proposed for biofilms [44], and later modified for diatoms [15]: geochemical background (B) = CCUs below 1.0; low metal category (L) = CCUs between 1.0 and 2.0; intermediate metal category (M) = CCUs between 2.0 and 7.0; high metal category (H) = CCUs above 7.0.

3. Results and Discussion

3.1. General Water Chemistry

Water chemistry data showed strong variability between sites for several parameters (Table 1). This is attributed mostly to anthropogenic activities, as the study area does not vary markedly in terms of geological characteristics or vegetation. Hardness values varied from 37.6 ± 0.2 mg CaCO3/L at VR to 1620 ± 8 mg CaCO3/L at CCC, where elevated values may in part reflect lime addition. For example, the sharp increase in hardness between JC6 and JC7 (256 ± 1 to 1018 ± 8 mg CaCO3/L) clearly illustrates the effect of lime addition coming from the Copper Cliff Creek input, and JC1 hardness value of 1010 ± 13 mg CaCO3/L reflects mining activities from the Garson mine. Observed values for natural hardness in the region are around 50 mg/L, or below [45]. A comparable value was obtained at our site VR considered as a reference (relative to mining pressure). The hardness value of 177 mg/L obtained at our other reference site (MBC) is comparable to the value of 122 mg/L observed by Davidson [46], but other studies reported lower values for this creek (23–59 mg CaCO3/L) [32,47]. The sites from Coniston Creek (CC1–CC3) have rather elevated hardness considering the fact that these sites do not receive direct lime-containing effluents from operating mines. However, large piles of tailings left on decommissioned sites in Falconbridge and Coniston may be leaching some contaminants, including Mg+ and Ca+, into Coniston Creek and other nearby aquatic ecosystems.
Except for CCC and NC1 (with pH of 5.7 and 6.2, respectively), all sites had pH values above 6.5, reaching up to 8 at JC6. TP concentrations were relatively elevated along the Junction Creek gradient starting at JC2, with a particularly high value at JC9 (137 ± 1 μg P/L). High levels of phosphorus in the lower Junction Creek sites suggest nutrient inputs from the Sudbury wastewater treatment plant effluents discharging a few kilometers upstream of Kelly Lake. In addition, untreated sewage is still occasionally bypassed during heavy rainfall events [48]. Site CC3 on Coniston Creek also showed relatively elevated phosphorus, probably due to its location downstream of the Coniston municipal sewage treatment plant and a golf course. Sites MBC and VR, although selected as reference relative to metal contamination, showed TP concentrations suggesting some nutrient inputs, which is not surprising considering that they are both influenced, to different extents, by urban activities. Specifically, the MBC sampling site is located in a dense residential development with a golf course immediately upstream. VR is in the small municipality of Markstay and there seems to be very minimal human activity in the upstream portion of the watershed except for two farmlands and a golf course. However, Markstay is on the list of water and wastewater projects that were approved under the Canada-Ontario Clean Water and Wastewater Fund agreement [49] for improving wastewater infrastructures (anticipated starting date set for some time in 2017), which suggests that sewage water may not have been managed properly at the time of sampling. Aside from the two sites considered as references and JC4, NO3 concentrations were elevated at all sites, especially along Junction Creek (at JC7 to JC9, as well as at JC1). These elevated values may result from actual and past blasting activities in the mining areas (ammonium nitrate-based explosives) and/or may come from municipal wastewater effluents as previously mentioned. Sulfate concentrations also fluctuated markedly between sites, with a low value of 5.0 ± 0 mg/L at VR and a peak value of 1923 ± 7 mg/L at CCC. The highest SO4 values along the Junction Creek gradient were observed at JC1 and JC7, located downstream of tributaries receiving mining effluents (Garson Branch Creek and Copper Cliff Creek).

3.2. Metal Concentrations and CCU

The sites on Nolin Creek showed the highest concentrations for all metals except for Al. CCME water quality criteria were exceeded for Ni and Cu (Table 1, in bold). For example, Cu concentration at NC2 (38 ± 3 μg/L) was 11× higher than the CCME criterion. A press release in a local newspaper in the summer of 2015 reported the first sightings of fish in Nolin Creek since at least the early 1990s [50]. This is a sign that although metals are still present, the system is recovering. Nickel concentration (788 ± 3 μg/L) at FBC was more than 3× the criterion, while Cu did not exceed the CCME guideline at this site. Cu and Ni values in Frood Branch Creek were respectively 1170 μg/L and 4220 μg/L in 1999 [1], while values had drastically dropped by 2004 (respectively 54.3 and 224.8 μg/L) [32], following diversion work to stop mining from entering the watercourse. Interestingly, our values from 2016 indicate that Ni increased compared to the reported value from 2004, while Cu markedly decreased (5.72 ± 0.17 μg/L). Although Cu concentration at the reference site VR was not elevated, the water quality criterion was exceeded by a factor of almost 2×, likely due to the low water hardness at this site. Cadmium concentration only exceeded the water quality criterion at site NC2.
CCU values ranged between <1 and 20 (Table 1). The highest CCU values were obtained for the Nolin Creek sites (NC1-NC2-NC3) and Frood Branch Creek (FBC). CCUs along Junction Creek were relatively stable and low, with values generally <1, except at JC6 and JC7 where they were slightly >1. Interestingly, the VR reference site showed a CCU value of 2.5, which is mostly attributed to the low hardness value influencing the criterion for Cu, as previously mentioned. As a general trend, the sites that were selected as references or least-impacted relative to metal contamination (MBC, VR, CC1, CC2, CC3, and upper portion of Junction Creek) represented “background” concentrations, except for VR and CC3. Copper Cliff Creek also obtained a low CCU score, which is surprising considering the mining activities in close proximity. Nickel and copper generally exceeded the CCME water quality criteria and consequently contributed the most to the CCU values.

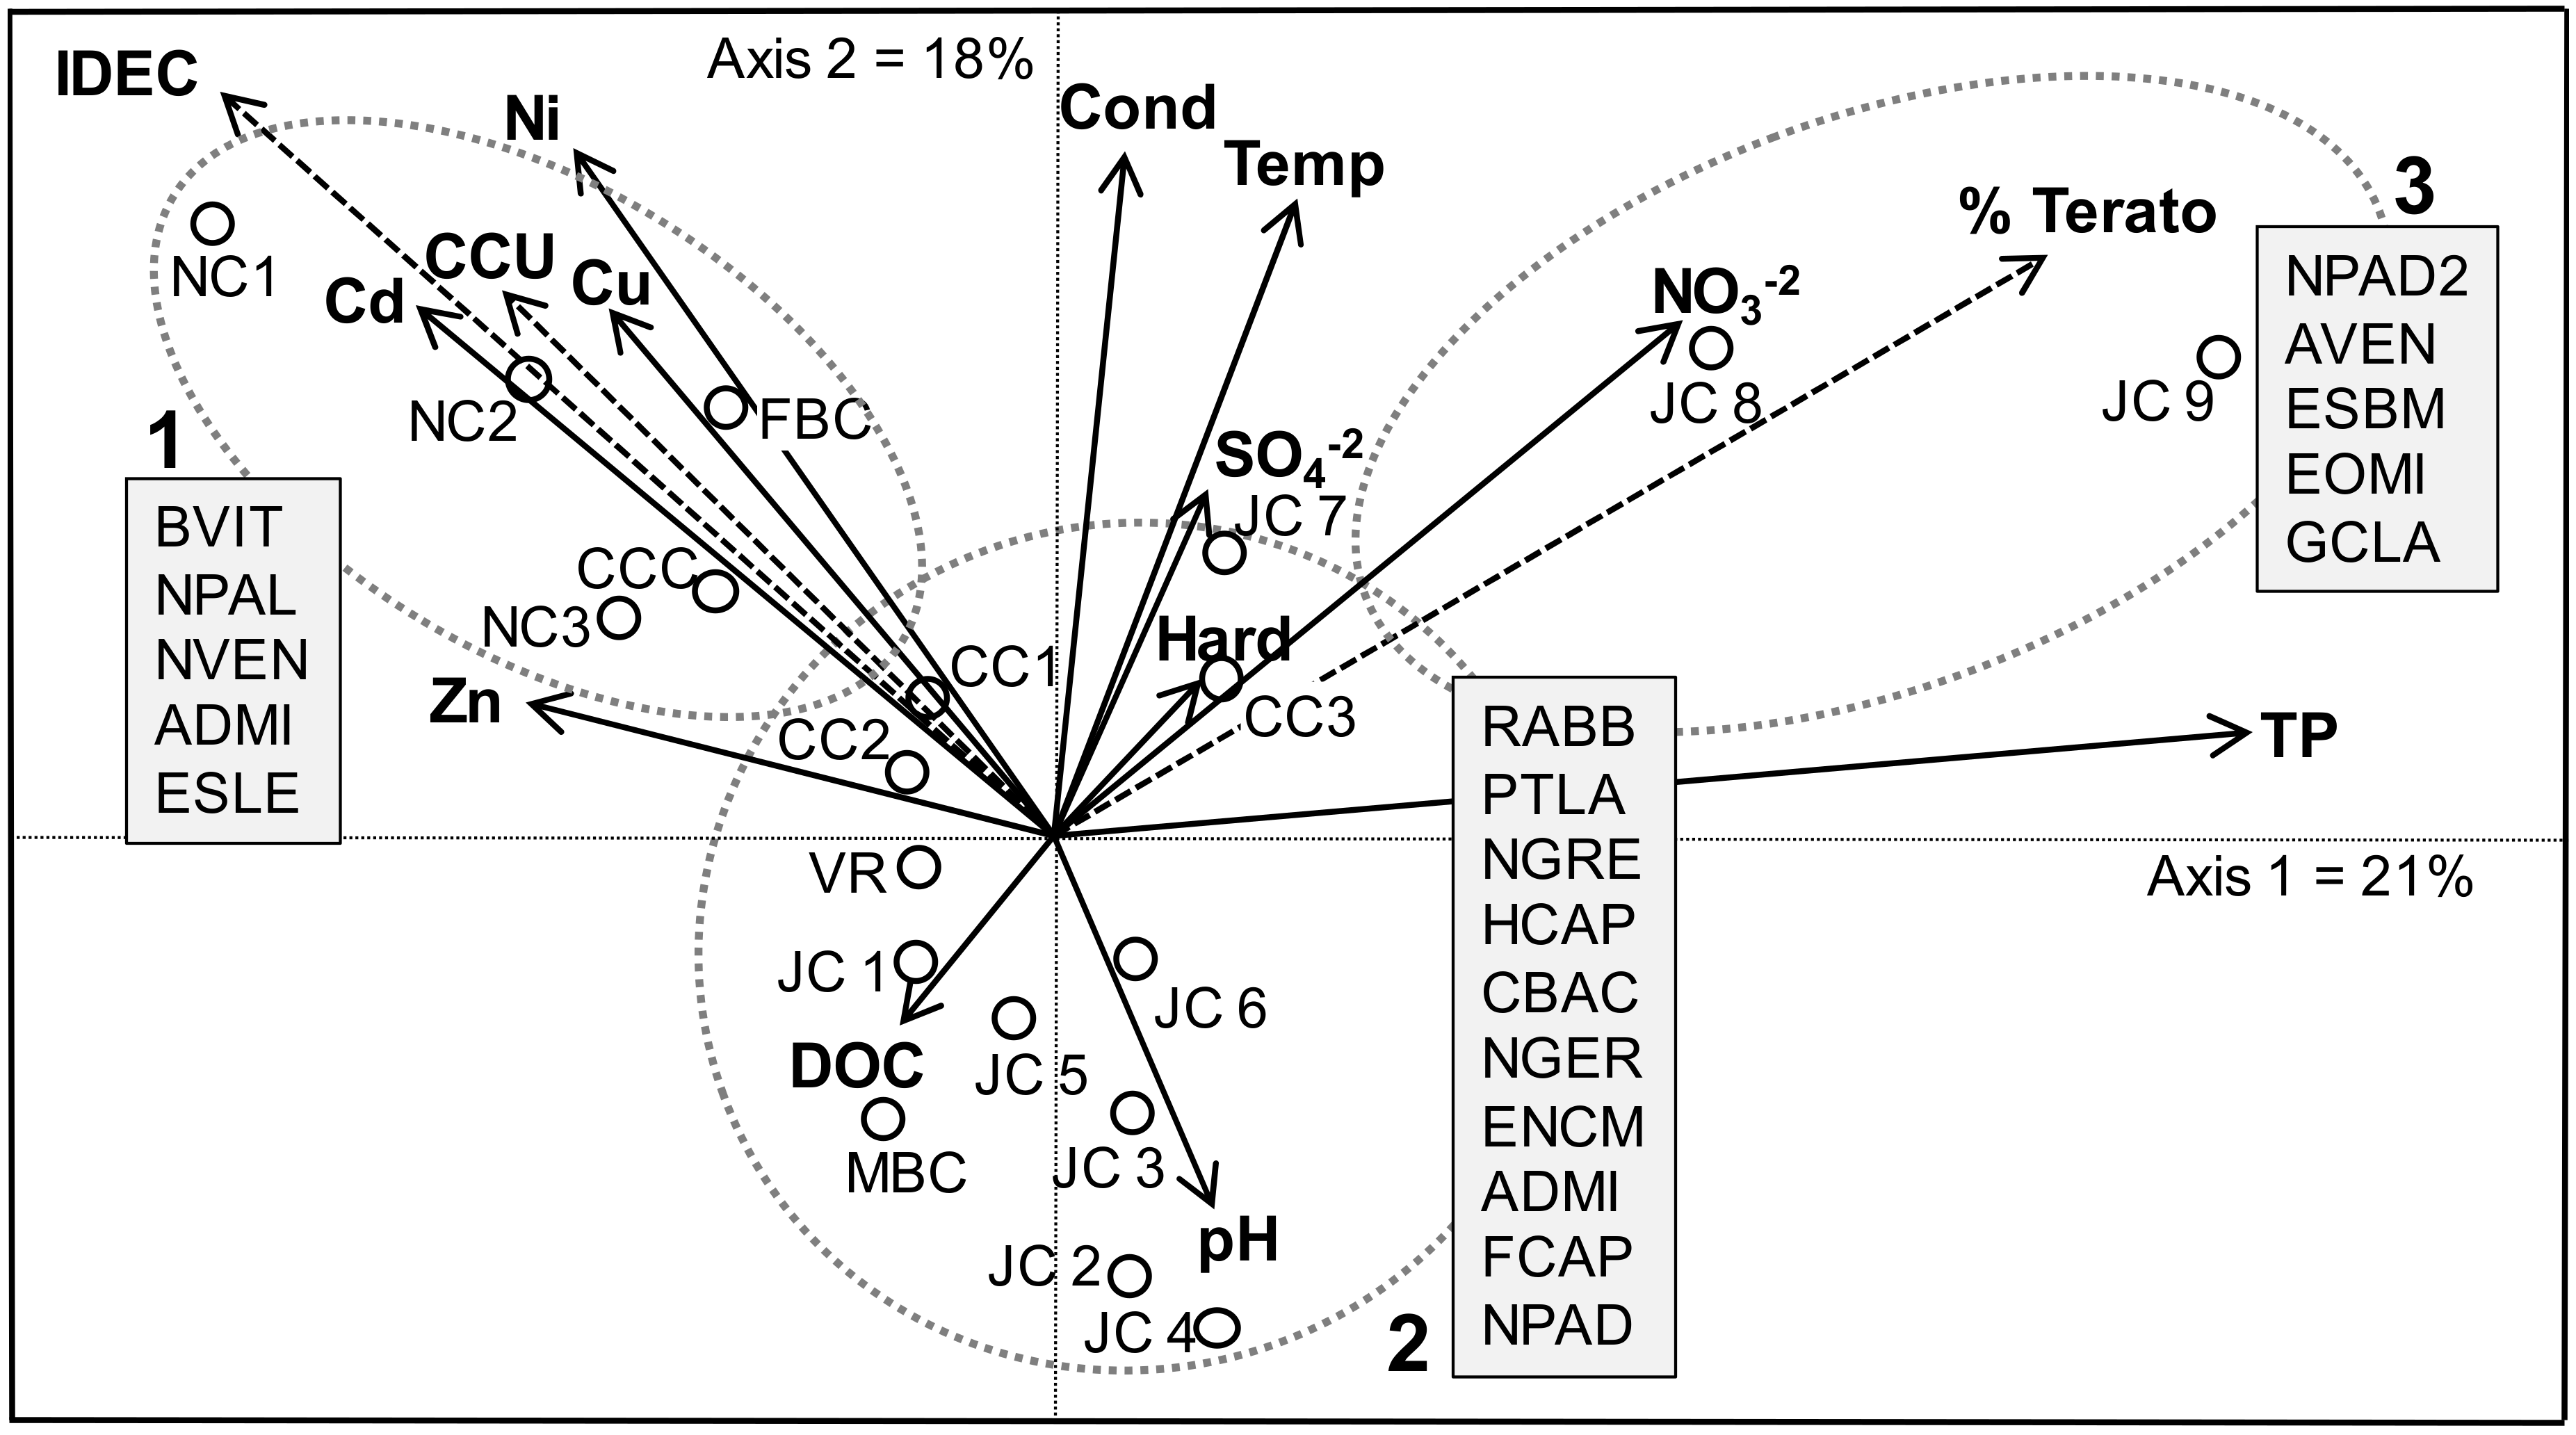
3.3. Relationships between Environmental Factors and Biological Indicators

3.3.1. Biotypology, IDEC Scores and Metal-Tolerant Taxa

The relative abundances of the dominant diatom species (more than 5% in at least one sample) observed in each of the 19 assemblages are presented as Supplementary Material. While some diatom taxa such as Achnanthidium minutissimum and Nitzschia palea aff. debilis were abundant at many sites, other taxa were restricted to only certain sites. Diatom-based monitoring using the IDEC revealed that several sites were severely impaired, with very low index values and poor biological status (Table 1). A CCA was performed including diatom and chemistry data, with IDEC scores, % teratologies and CCU as passive variables. Site distribution on the ordination suggests three main groups characterized by particular diatom assemblages and reflecting distinct environmental conditions. The taxa dominating in each group (labeled groups 1, 2 and 3) are presented on the CCA (Figure 2). In addition, significant indicator species for each group are presented in Table 2. The environmental variables included in the CCA (excluding the passive variables) explained 39% of the variance in diatom species distribution (first two axes). Group 1, on the left-hand panel, was characterized by sites receiving treated mining effluents, with elevated metal concentrations and higher CCU values. On the lower panel, sites identified as Group 2 are reference or least-disturbed sites, and correspond to background conditions of the area (in terms of metals). Finally Group 3 (right-hand panel) discriminates the sites with the highest nutrient loads.
Group 1, including NC1, NC2, NC3, CCC and FBC, was dominated by A. minutissimum complex, Brachysira vitrea, Nitzschia microcephala, Nitzschia palea, Encyonema silesiacum, and Navicula veneta. Group 1 sites were characterized by elevated metal concentrations, and their above-mentioned dominant diatom taxa are often reported in metal-contaminated sites [11,15,51,52,53,54,55,56]. While these assemblages suggest metal contamination, they are also positioned at the lower end of the nutrient enrichment gradient on the CCA (and clustered at the higher end of the IDEC gradient), which suggests excellent water quality in terms of nutrient and ion enrichment. FBC, NC1, NC2 and NC3 were categorized as reference status (class A). Indeed, while nitrates are relatively elevated, phosphorus at those sites is low, which partly explains the good biological integrity (high IDEC scores despite metal contamination) generally observed for the sites in group 1. One should be careful with the interpretation in this situation because the IDEC scores most likely reflect the strong dominance of A. minutissimum and B. vitrea, together making up for 60–90% of the assemblages at these sites. While these species are indeed good indicators of lower nutrient concentrations [57,58,59], they are also known to be tolerant of metal contamination (see above references). However, other dominant taxa in this group can tolerate higher nutrient levels (e.g., Nitzschia palea, Navicula veneta, Encyonema silesiacum) which explains lower IDEC scores at CCC.
Group 2 diatom assemblages had many species in common, and IDEC scores obtained mainly reflect the marked differences in the relative abundance of the A. minutissimum complex that fluctuated between <10% and >60% between sites. This taxon was also very abundant in diatom assemblages from group 1. It must however be noted that group 2 was dominated by a long and narrow form of A. minutissimum, while group 1 was dominated by a small and round form of A. minutissimum. These two forms of A. minutissimum may be different varieties of the species within the A. minutissimum complex, or morphological variants of the species as a response to environmental variables (e.g., [60]). The IDEC scores obtained for the group 2 sites varied from 6 (class D) to 83 (class A), but assemblages generally indicated poor biological integrity (classes C and D). Indeed, except for the A. minutissimum and Fragilaria capucina complexes, most species characterizing group 2 are indicators of low biological status based on the database used to develop the IDEC. The lowest index values (biological integrity class D) were observed at sites JC2, JC3, and JC4. Sites JC5, JC6, JC7, CC3, MCB and VR fell into class “C”, also indicating degraded environments. The sites CC1, CC2 were categorized as slightly impaired, with an IDEC class B, while only JC1 in this group suggested reference status (class A). The IDEC informs on overall biological health, but mainly reflects eutrophication. It is, therefore, not surprising to observe low IDEC values at sites located downstream of small municipalities or in the Greater Sudbury area where nutrient levels are higher (IDEC scores correlated with TP; r = −0.6, p ≤ 0.05). Most species from group 2 are indicators of baseline or low metal concentrations (low CCU), as suggested by Morin et al. [15], although certain taxa from the A. minutissimum and F. capucina complexes were frequently observed in metal-contaminated conditions. However, the presence of metal-tolerant taxa does not necessarily suggest contamination, especially in the case of the two above-mentioned taxa, which are ubiquitous.
Amphora veneta and Eolimna subminuscula dominated the assemblages at sites JC8 and JC9 (group 3) and were rare or absent at other sites, which explains that these sites clustered apart from the other sites on the CCA. A. veneta was reported as an indicator of moderate to low biological status [57,58], which is in agreement with the higher phosphorus concentrations observed and poor ecological integrity (class C and D) based on IDEC scores. E. subminuscula is also reported as a nutrient-tolerant species [57,61,62]. The other taxa characterizing group 3, such as small species identified here as belonging to the Eolimna minima complex and Nitzschia palea aff. debilis form 2 are indicators of nutrient-rich environments as well [36,57,59]. Gomphonema clavatum (sensu Krammer and Lange-Bertalot [63]) was also abundant at site JC9 (8%), but this species is usually not typical of high nutrients concentrations [63]. The low IDEC values observed for group 3 sites reflect the presence of nutrient-tolerant taxa. Interestingly, the dominant taxa from group 3 have also been reported in water bodies affected by mining activities [10,15,54], and references therein], although metal concentrations at sites JC8 and JC9 were not particularly elevated, being designated as CCU class L.

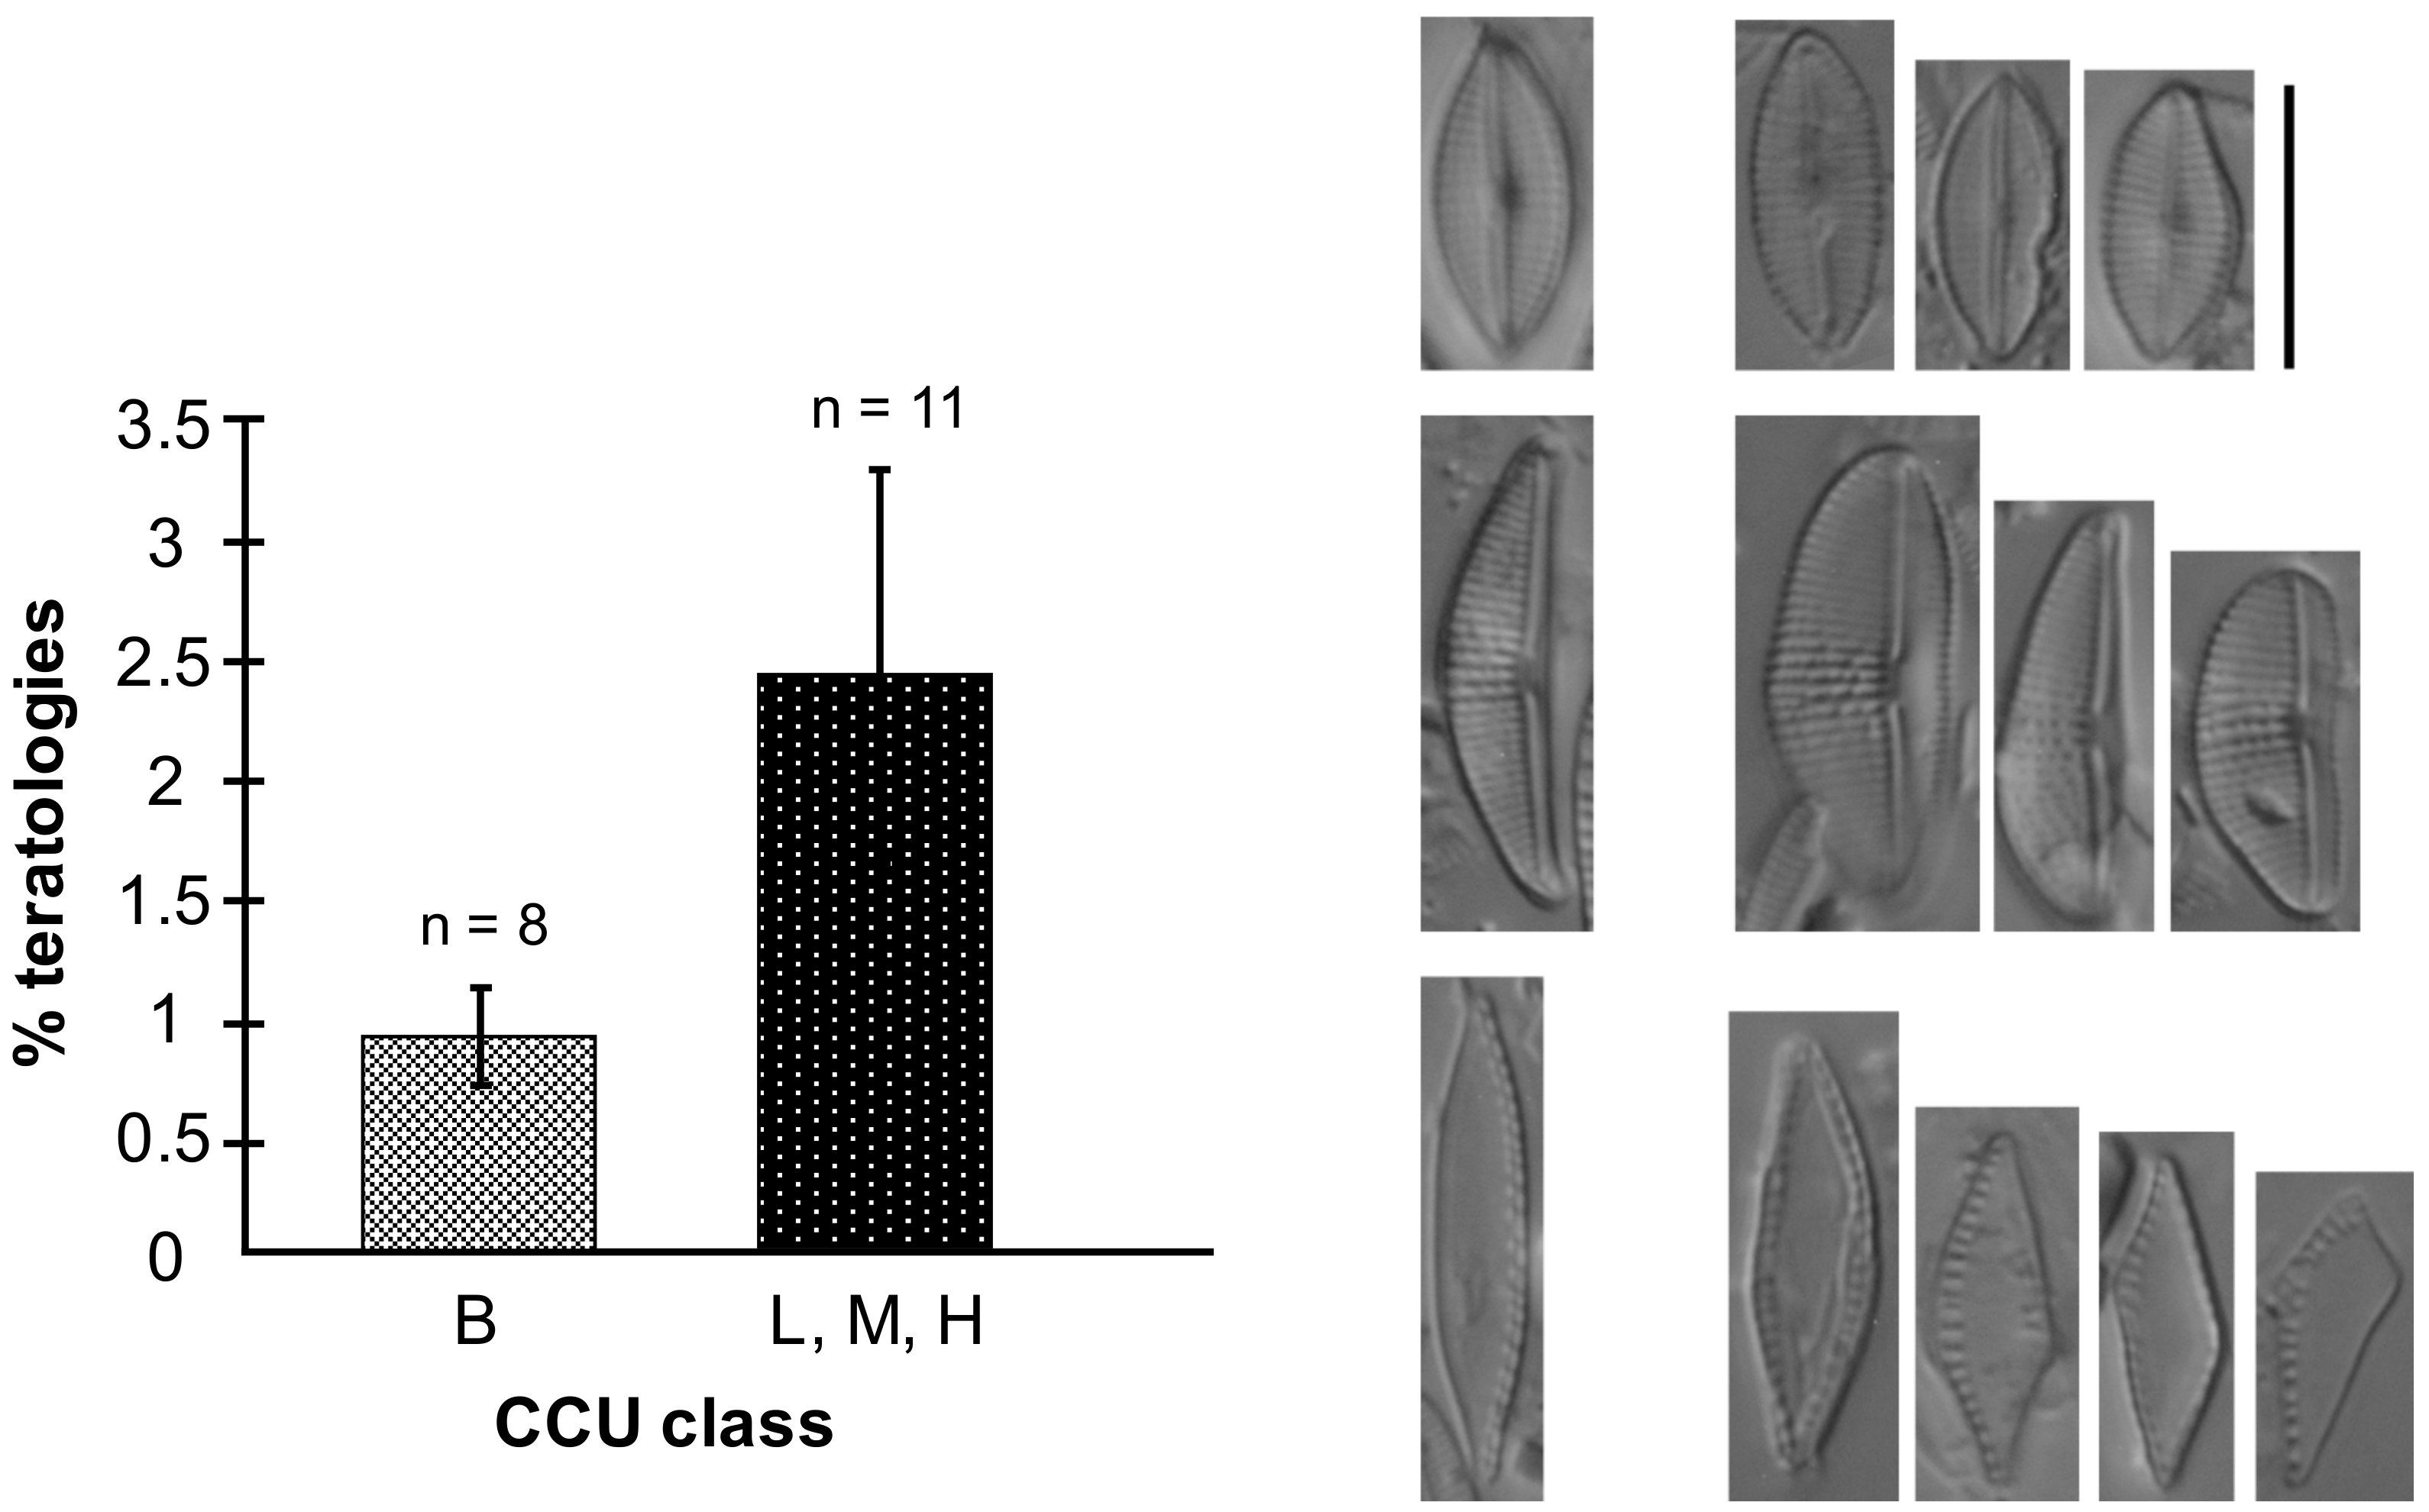
3.3.2. Diatom Teratologies as a Response to Stress

Very low proportions of deformed valves were observed at the reference or least-disturbed sites (CC1, CC2, CC3, MBC, VR), with values ranging from 0 to 0.7% (Table 1). As suggested by Morin et al. [64] and Arini et al. [65], deformity frequencies between 0.5 and 1% are considered as naturally occurring. With abnormal valve frequencies of 1–1.2%, it is difficult to confirm a specific response to metal contamination at sites JC1, JC2, JC4, JC5, JC6, JC7, NC1, and NC2, as these values are close to the estimated natural background. JC3, FBC and CCC showed low frequencies of teratologies, with values around 1.5%. These values are more likely to reflect metal contamination, although this is risky to confirm without replicated analyses accounting for inter-sample variability. Sites JC8, JC9 and NC3 revealed higher proportions of deformed diatom valves, with values reaching up to 8.7% at JC9. Deformities in such high numbers are very likely due to the presence of metals (or to unmeasured organic compounds or mixture of contaminants), and despite the absence of replication are expected to reflect a ‘’true’’ response of the diatom assemblages. It is difficult to explain the high deformity frequency observed at JC8 and JC9 as metal contamination does not seem severe (based on a single water sample collected). However, it is possible that multiple stressors exerted pressure on the assemblage, leading to an increased sensitivity of the diatom cells. Differentially-acting stressors may have cumulative (synergistic or additive) deleterious effects on the individuals: either stressor may target certain cellular functions (e.g., detoxification), while the other stressor would reduce another metabolic pathway involved in frustule formation, with the effect of reducing the overall capacity of the cell to cope with the combined stressors and produce normal cells [15]. For example, the former creosote plant located along Junction Creek upstream of Kelly Lake contaminated the system with PAH. There is no data available on PAH concentrations for the present study, but Jaagumagi and Bédard [1] reported up to 4.54 μg/g in sediments in 1999 just above Kelly Lake. It is possible that diatom deformities at these particular sites are a response to organic contamination, as observed in other studies [66,67,68], or that metals and organic compounds have additive or synergistic effects leading to a stronger stress on diatoms. Sites JC8 and JC9 were also the sites showing the highest phosphorus concentrations, suggesting that eutrophication may act as an additional environmental stress as observed in a study combining metal and nutrient load effects on diatoms [19]. Another possible explanation for the high number of teratologies is the proneness of the present species to deformation as discussed in Lavoie et al. [17].
No correlation was observed between the % teratologies and metal concentrations or CCU values, but there was a significant difference in deformation frequency between sites categorized as CCU class B compared with the sites categorized as CCU classes L, M and H together (t = 1.82; n = 19 p = 0.048; Figure 3). This situation has been encountered in other studies (see discussion in Lavoie et al. [17]), where deformities were observed in higher proportions in contaminated sites compared to reference sites while a relationship between % teratologies and a gradient in metal contamination was lacking. The difficulty in directly relating % teratologies and abundance of metal-tolerant taxa with metal concentrations is due to multiple factors such as the variability in water chemistry, metal bioavailability, and species proneness to deformities [17]. Although correlations between % deformities and metal concentrations are sometimes unclear, the presence of teratologies is a red flag for environmental stress, suggesting that additional water quality measurements may be needed to highlight contamination from other sources and types than those initially analyzed. From a biomonitoring perspective, including the % deformities in a multi-metric index could broaden the range of anthropogenic impacts detected by current diatom indices and allow identification of the main pressures under multi-stress scenarios [69].
As a general trend, abnormal valve shape was the most frequent type of teratology encountered, although striae/fibulae aberrations were common at JC4, NC1 and NC2, and abnormal sternum/raphe were often observed at JC6 and JC7. Lavoie et al. [17] discuss the possible interest in considering the type of deformation in monitoring, where the nature and timing of environmental stressors may have an influence on the response. However, in this study, no trend or relationship was observed beyond the above-mentioned observation.

4. Conclusions

This study on water chemistry and diatom assemblages revealed that Junction Creek and its tributaries are under multiple stressors, both from present and past mining operations in the region, but also from urban development and related activities. Diatom assemblages reflected the contrasted environmental conditions in the area and the different types of pressures (metals and/or nutrients and/or salinity and/or PAH). As a general summary of water quality in the study area, it seems that the three Nolin Creek sites are the most contaminated by metals and are the main contributors to the metal loads in the lower portion of Junction Creek. As expected, these sites are dominated by metal-tolerant diatoms. Sites JC7-JC8-JC9 along the Junction Creek gradient seem to be the most nutrient-enriched based on phosphorus concentrations and on the presence of nutrient-loving taxa, reflecting past and present urban activities. The level of abnormal diatoms in the samples from sites JC8 and JC9 undoubtedly reflects a response to one or multiple stressors, and suggests that the lower portion of the watercourse needs to be further investigated.
Considerable efforts have been deployed to rehabilitate the Junction Creek watershed and to decrease SO2 emissions and airborne particles, leading to marked improvements in the chemical, physical and biological integrity of the system and surrounding water bodies. However, despite an obvious increase in water quality, the Junction Creek system is still relatively impaired. The extent of recovery differs among organisms, and the confounding effects of multiple anthropogenic activities renders difficult the task of “measuring” the success of rehabilitation actions. As Junction Creek and the nearby aquatic ecosystems are slowly recovering from their past industry-related pressures, water managers must now deal with rapid urban and residential development and their associated problems. Climate change will also be an important variable to consider in future monitoring of aquatic ecosystems in Sudbury and its surroundings. According to information from the Greater Sudbury Climate Change Consortium [70], it is estimated that Ontario will warm an average of 2 to 5 ºC within the next 75 to 100 years, with more frequent and severe extreme events such as floods and droughts. In the Greater Sudbury region, climate change is projected to result in an increase of 2 ℃ in summer and 1 ℃ in winter for the 2010–2039 period. These climate-related changes will certainly interact with environmental pressures and affect recovery processes and trajectories. Diatom-based monitoring is a reliable, sensitive and cost-effective approach for assessing aquatic ecosystem health; changes in diatom assemblage structure are quickly observed as a response to changing environmental conditions. As warming-induced effects on diatom communities were previously shown to interplay with metal stress [71], long term monitoring of the area’s recovery is recommended. The present study lays the foundation for future diatom-based monitoring in the region, and will serve as a point in time reference for assessing further recovery (or potential degradation as a result of climate change) of the Junction Creek system.

Supplementary Materials

The following are available online at https://www.mdpi.com/2076-3298/5/2/30/s1, Table S1: Relative abundances of the dominant taxa (at least 5% in a least one sample) observed in the 19 samples.

Acknowledgments

The authors would like to thank Louise-Emmanuelle Paris for her precious help during sampling. Emilie Saulnier-Talbot edited this manuscript and provided helpful suggestions. Financial support from the Fonds de recherche du Québec–Nature et technologies is gratefully acknowledged. C. Fortin is supported by the Canada Research Chair Program.

Author Contributions

Each author made substantial contributions to this paper. Isabelle Lavoie was responsible for diatom analyses, interpretation of data and redaction of the paper. Claude Fortin and Vincent Laderriere designed the study. Vincent Laderriere conducted field sampling and chemical analyses. Soizic Morin and Claude Fortin assisted in the writing and revision of the paper and contributed to data interpretation. All authors approved the submitted version and version substantially edited by journal staff that involves the author’s contribution to the study, and agree to be personally accountable for the author’s own contributions and for ensuring that questions related to the accuracy or integrity of any part of the work, even ones in which the author was not personally involved, are appropriately investigated, resolved, and documented in the literature.

Conflicts of Interest

The authors declare no conflict of interest. The founding sponsors had no role in the design of the study; in the collection, analyses, or interpretation of data; in the writing of the manuscript, and in the decision to publish the results.

References

  1. Jaagumagi, R.; Bédard, D. Junction Creek System (Sudbury) Environmental Monitoring Study, September 1999; Ontario Ministry of the Environment Northern Region, Sudbury District Office: Sudbury, ON, Canada, 2002; p. 90. [Google Scholar]
  2. Gunn, J.; Sarrazin-Delay, C.; Wesolek, B.; Stasko, A.; Szkokan-Emilson, E. Delayed recovery of benthic macroinvertebrate communities in Junction Creek, Sudbury, Ontario, after the diversion of acid mine drainage. Hum. Ecol. Risk Assess. 2010, 16, 901–912. [Google Scholar] [CrossRef]
  3. Weber, L.P.; Dubé, M.G.; Rickwood, C.J.; Driedger, K.; Portt, C.; Brereton, C.; Janz, D.M. Effects of multiple effluents on resident fish from Junction Creek, Sudbury, Ontario. Ecotoxicol. Environ. Saf. 2008, 70, 433–445. [Google Scholar] [CrossRef] [PubMed]
  4. Keller, W.; Yan, N.D.; Somers, K.M.; Heneberry, J.H. Crustacean zooplankton communities in lakes recovering from acidification. Can. J. Fish. Aquat. Sci. 2002, 59, 726–735. [Google Scholar] [CrossRef]
  5. Yan, N.D.; Girard, R.; Heneberry, J.H.; Keller, W.B.; Gunn, J.M.; Dillon, P.J. Recovery of copepod, but not cladoceran, zooplankton from severe and chronic effects of multiple stressors. Ecol. Lett. 2004, 7, 452–460. [Google Scholar] [CrossRef]
  6. Yan, N.D.; Keller, W.; Somers, K.M.; Pawson, T.W.; Girard, R.E. Recovery of crustacean zooplankton communities from acid and metal contamination: Comparing manipulated and reference lakes. Can. J. Fish. Aquat. Sci. 1996, 53, 1301–1327. [Google Scholar] [CrossRef]
  7. Scheibener, S.A.; Rivera, N.A.; Hesterberg, D.; Duckworth, O.W.; Buchwalter, D.B. Periphyton uptake and trophic transfer of coal fly-ash-derived trace elements. Environ. Toxicol. Chem. 2017, 36, 2991–2996. [Google Scholar] [CrossRef] [PubMed]
  8. Fadhlaoui, M.; Pierron, F.; Couture, P. Temperature and metal exposure affect membrane fatty acid composition and transcription of desaturases and elongases in fathead minnow muscle and brain. Ecotoxicol. Environ. Saf. 2018, 148, 632–643. [Google Scholar] [CrossRef] [PubMed]
  9. Scott, G.R.; Sloman, K.A. The effects of environmental pollutants on complex fish behaviour: Integrating behavioural and physiological indicators of toxicity. Aquat. Toxicol. 2004, 68, 369–392. [Google Scholar] [CrossRef] [PubMed]
  10. Lavoie, I.; Lavoie, M.; Fortin, C. A mine of information: Benthic algal communities as biomonitors of metal contamination from abandoned tailings. Sci. Total Environ. 2012, 425, 231–241. [Google Scholar] [CrossRef] [PubMed]
  11. Leguay, S.; Lavoie, I.; Levy, J.L.; Fortin, C. Using biofilms for monitoring metal contamination in lotic ecosystems: The protective effects of hardness and pH on metal bioaccumulation. Environ. Toxicol. Chem. 2016, 35, 1489–1501. [Google Scholar] [CrossRef] [PubMed]
  12. Lavoie, I.; Campeau, S.; Zugic-Drakulic, N.; Winter, J.G.; Fortin, C. Using diatoms to monitor stream biological integrity in Eastern Canada: An overview of 10 years of index development and ongoing challenges. Sci. Total Environ. 2014, 475, 187–200. [Google Scholar] [CrossRef] [PubMed]
  13. Kelly, M.G.; Whitton, B.A. The Trophic Diatom Index: A new index for monitoring eutrophication in rivers. J. Appl. Phycol. 1995, 7, 433–444. [Google Scholar] [CrossRef]
  14. Prygiel, J.; Coste, M.; Bukowska, J. Review of the major diatom-based techniques for the quality assessment of rivers—State of the art in Europe. In Use of Algae for Monitoring Rivers III; Prygiel, J., Whitton, B.A., Bukowska, J., Eds.; Agence de l’Eau Artois Picardie: Douai, France, 1999; pp. 224–238. [Google Scholar]
  15. Morin, S.; Cordonier, A.; Lavoie, I.; Arini, A.; Blanco, S.; Duong, T.T.; Tornés, E.; Bonet, B.; Corcoll, N.; Faggiano, L.; et al. Consistency in diatom response to metal-contaminated environments. In Handbook of Environmental Chemistry; Guasch, H., Ginebreda, A., Geiszinger, A., Eds.; Springer: Heidelberg, Germany, 2012; Volume 19, pp. 117–146. [Google Scholar]
  16. Debenest, T.; Silvestre, J.; Coste, M.; Delmas, F.; Pinelli, E. Herbicide effects on freshwater benthic diatoms: Induction of nucleus alterations and silica cell wall abnormalities. Aquat. Toxicol. 2008, 88, 88–94. [Google Scholar] [CrossRef] [PubMed] [Green Version]
  17. Lavoie, I.; Hamilton, P.B.; Morin, S.; Kim Tiam, S.; Kahlert, M.; Gonçalves, S.; Falasco, E.; Fortin, C.; Gontero, B.; Heudre, D.; et al. Diatom teratologies as biomarkers of contamination: Are all deformities ecologically meaningful? Ecol. Indic. 2017, 82, 539–550. [Google Scholar] [CrossRef]
  18. Morin, S.; Corcoll, N.; Bonet, B.; Tlili, A.; Guasch, H. Diatom responses to zinc contamination along a Mediterranean river. Plant Ecol. Evol. 2014, 147, 325–332. [Google Scholar] [CrossRef]
  19. Morin, S.; Bonet, B.; Corcoll, N.; Guasch, H.; Bottin, M.; Coste, M. Cumulative stressors trigger increased vulnerability of diatom communities to additional disturbances. Microb. Ecol. 2015, 70, 585–595. [Google Scholar] [CrossRef] [PubMed]
  20. Guasch, H.; Navarro, E.; Serra, A.; Sabater, S. Phosphate limitation influences the sensitivity to copper in periphytic algae. Freshw. Biol. 2004, 49, 463–473. [Google Scholar] [CrossRef]
  21. Tlili, A.; Bérard, A.; Roulier, J.-L.; Volat, B.; Montuelle, B. PO43− dependence of the tolerance of autotrophic and heterotrophic biofilm communities to copper and diuron. Aquat. Toxicol. 2010, 98, 165–177. [Google Scholar] [CrossRef] [PubMed]
  22. Nriagu, J.O.; Wong, H.K.T.; Lawson, G.; Daniel, P. Saturation of ecosystems with toxic metals in Sudbury basin, Ontario, Canada. Sci. Total Environ. 1998, 223, 99–117. [Google Scholar] [CrossRef]
  23. Gunn, J.; Keller, W.; Negusanti, J.; Potvin, R.; Beckett, P.; Winterhalder, K. Ecosystem recovery after emission reductions: Sudbury, Canada. Water Air Soil Pollut. 1995, 85, 1783–1788. [Google Scholar] [CrossRef]
  24. Keller, W.; Yan, N.D.; Gunn, J.M.; Heneberry, J. Recovery of acidified lakes: Lessons from Sudbury, Ontario, Canada. In Acid Rain—Deposition to Recovery; Brimblecombe, P., Hara, H., Houle, D., Novak, M., Eds.; Springer: Dordrecht, The Netherlands, 2007; pp. 317–322. [Google Scholar]
  25. Potvin, R.R.; Negusanti, J.J. Declining industrial emissions, improving air quality, and reduced damage to vegetation. In Restoration and Recovery of an Industrial Region: Progress in Restoring the Smelter-Damaged Landscape near Sudbury, Canada; Gunn, J.M., Ed.; Springer: New York, NY, USA, 1995; pp. 51–65. [Google Scholar]
  26. Keller, W.; Gunn, J.M.; Yan, N.D. Evidence of biological recovery in acid-stressed lakes near Sudbury, Canada. Environ. Pollut. 1992, 78, 79–85. [Google Scholar] [CrossRef]
  27. Pearson, D.A.B.; Gunn, J.M.; Keller, W. The past, present and future of Sudbury’s Lakes. In The Physical Environment of the City of Greater Sudbury; Rousell, D.H., Jansons, K.J., Eds.; Special volume 6, Ontario Geological Survey: Sudbury, ON, Canada, 2002; pp. 195–215. [Google Scholar]
  28. Neary, B.P.; Dillion, P.J.; Munro, J.R.; Clark, B.J. The Acidification of Ontario Lakes: An Assessment of Their Sensitivity and Current Status with Respect to Biological Damage; Technical Report; Ontario Ministry of Environment: Dorset, ON, Canada, 1990; p. 170. [Google Scholar]
  29. Keller, W. Limnology in northeastern Ontario: From acidification to multiple stressors. Can. J. Fish. Aquat. Sci. 2009, 66, 1189–1198. [Google Scholar] [CrossRef]
  30. Lento, J.; Dillon, P.J.; Somers, K.M.; Reid, R.A. Changes in littoral benthic macroinvertebrate communities in relation to water chemistry in 17 Precambrian Shield lakes. Can. J. Fish. Aquat. Sci. 2008, 65, 906–918. [Google Scholar] [CrossRef]
  31. Association Française de Normalisation (AFNOR). Water Quality—Sampling, Treatment and Analysis of Benthic Diatoms from Streams and Canals (Standard NF T90-354); AFNOR: La Plaine Saint-Denis, France, 2016; p. 119. [Google Scholar]
  32. Lemieux, E.S.; Gunn, J.M.; Sheardown, J. Fish Community Assessment of Junction Creek 2004; Coop Freshwater Unit, Junction Creek Stewardship Committee: Sudbury, ON, Canada, 2004; p. 68. [Google Scholar]
  33. Souter, L.E.; Watmough, S.A. Geochemistry and toxicity of a large slag pile and its drainage complex in Sudbury, Ontario. Sci. Total Environ. 2017, 15, 461–470. [Google Scholar] [CrossRef] [PubMed]
  34. Lavoie, I.; Hamilton, P.B.; Campeau, S.; Grenier, M.; Dillon, P.J. Guide d’Identification des Diatomées des Rivières de l’Est du Canada; Presses de l’Université du Québec: Quebec City, QC, Canada, 2008. [Google Scholar]
  35. Falasco, E.; Bona, F.; Badino, G.; Hoffmann, L.; Ector, L. Diatom teratological forms and environmental alterations: A review. Hydrobiologia 2009, 623, 1–35. [Google Scholar] [CrossRef]
  36. Lavoie, I.; Campeau, S.; Grenier, M.; Dillon, P.J. A diatom-based index for the biological assessment of eastern Canadian rivers: An application of correspondence analysis (CA). Can. J. Fish. Aquat. Sci. 2006, 63, 1793–1811. [Google Scholar] [CrossRef]
  37. Grenier, M.; Campeau, S.; Lavoie, I.; Park, Y.S.; Lek, S. Diatom reference communities in Quebec (Canada) streams based on Kohonen self-organizing maps and multivariate analyses. Can. J. Fish. Aquat. Sci. 2006, 63, 2087–2106. [Google Scholar] [CrossRef]
  38. Ter Braak, C.J.F.; Smilauer, P. CANOCO Reference Manual and CanoDraw for Windows User’s Guide: Software for Canonical Community Ordination (Version 4.5); Biometris: Wageningen, The Netherlands, 2002. [Google Scholar]
  39. Dufrêne, M.; Legendre, P. Species assemblages and indicator species: The need for a flexible asymmetrical approach. Ecol. Monogr. 1997, 67, 345–366. [Google Scholar] [CrossRef]
  40. McCune, B.; Mefford, M.J. Multivariate Analysis of Ecological Data, Version 4.01; MJM Software: Gleneden Beach, OR, USA, 1999; p. 237. [Google Scholar]
  41. Clements, W.H.; Carlisle, D.M.; Lazorchak, J.M.; Johnson, P.C. Heavy metals structure benthic communities in Colorado mountain streams. Ecol. Appl. 2000, 10, 626–638. [Google Scholar] [CrossRef]
  42. Canadian Council of Ministers of the Environment (CCME). Canadian Environmental Quality Guidelines; CCME: Winnipeg, MB, Canada, 1999. [Google Scholar]
  43. US EPA. Draft Aquatic Life Criteria for Aluminum in Freshwater. Available online: https://www.epa.gov/wqc/2017-draft-aquatic-life-criteria-aluminum-freshwater-documents (accessed on 21 November 2017).
  44. Guasch, H.; Leira, M.; Montuelle, B.; Geiszinger, A.; Roulier, J.-L.; Tornés, E.; Serra, A. Use of multivariate analyses to investigate the contribution of metal pollution to diatom species composition: Search for the most appropriate cases and explanatory variables. Hydrobiologia 2009, 627, 143–158. [Google Scholar] [CrossRef]
  45. Rozon-Ramilo, L.D.; Dubé, M.G.; Rickwood, C.J.; Niyogi, S. Examining the effects of metal mining mixtures on fathead minnow (Pimephales promelas) using field-based multi-trophic artificial streams. Ecotoxicol. Environ. Saf. 2011, 74, 1536–1547. [Google Scholar] [CrossRef] [PubMed]
  46. Davidson, J. Applying the Reference Condition Approach to Monitor Invertebrates in Streams of the Sudbury Mining Area. Master’s Thesis, Laurentian University, Sudbury, ON, Canada, December 2002. [Google Scholar]
  47. Driedger, K.L.F. Effects of Metal Mine and Municipal Wastewater on Growth and Energy Stores in Juvenile Fishes. Master’s Thesis, University of Saskatchewan, Saskatoon, SK, Canada, October 2009. [Google Scholar]
  48. Conservation Sudbury. Vermillion River Watershed. Surface Water Quality Report on Current Conditions; Conservation Sudbury: Sudbury, ON, Canada, 2017; p. 43. [Google Scholar]
  49. CWWF. Canada-Ontario Clean Water and Wastewater Fund. Available online: https://www.canada.ca/en/office-infrastructure/news/2017/05/backgrounder_canadaandontarioannouncefundingforcleanwaterandwast2.html?=undefined&wbdisable=true (accessed on 28 November 2017).
  50. The Sudbury Star. Available online: http://www.thesudburystar.com/2015/08/05/fish-return-to-sudburys-nolin-creek (accessed on 12 November 2017).
  51. Cattaneo, A.; Couillard, Y.; Wunsam, S.; Courcelles, M. Diatom taxonomic and morphological changes as indicators of metal pollution and recovery in Lac Dufault (Québec, Canada). J. Paleolimnol. 2004, 32, 163–175. [Google Scholar] [CrossRef]
  52. Cattaneo, A.; Couillard, Y.; Wunsam, S.; Fortin, C. Littoral diatoms as indicators of recent water and sediment contamination by metals in lakes. J. Environ. Monit. 2011, 13, 572–582. [Google Scholar] [CrossRef] [PubMed]
  53. Duong, T.T.; Morin, S.; Herlory, O.; Feurtet-Mazel, A.; Coste, M.; Boudou, A. Seasonal effects of cadmium accumulation in periphytic diatom communities of freshwater biofilms. Aquat. Toxicol. 2008, 90, 19–28. [Google Scholar] [CrossRef] [PubMed]
  54. Luís, A.T.; Teixeira, P.; Almeida, S.F.P.; Ector, L.; Matos, J.X.; Ferreira da Silva, E.A. Impact of acid mine drainage (AMD) on water quality, stream sediments and periphytic diatom communities in the surrounding streams of Aljustrel mining area (Portugal). Water Air Soil Pollut. 2009, 200, 147–167. [Google Scholar] [CrossRef]
  55. Martin, G.; Fernandez, M.D.L.R. Diatoms as indicators of water quality and ecological status: Sampling, analysis and some ecological remarks, Ecological Water Quality. In Water Treatment and Reuse; Voudouris, K., Ed.; InTech: London, UK, 2012; pp. 183–204. [Google Scholar]
  56. Morin, S.; Vivas-Nogues, M.; Duong, T.T.; Boudou, A.; Coste, M.; Delmas, F. Dynamics of benthic diatom colonization in a cadmium/zinc-polluted river (Riou-Mort, France). Fundam. Appl. Limnol. Arch. Hydrobiol. 2007, 168, 179–187. [Google Scholar] [CrossRef]
  57. Coste, M.; Boutry, S.; Tison-Rosebery, J.; Delmas, F. Improvements of the Biological Diatom Index (BDI): Description and efficiency of the new version (BDI-2006). Ecol. Indic. 2009, 9, 621–650. [Google Scholar] [CrossRef]
  58. Kelly, M.; Urbanic, G.; Acs, E.; Bennion, H.; Bertrin, V.; Burgess, A.; Denys, L.; Gottschalk, S.; Kahlert, M.; Karjalainen, S.; et al. Comparing aspirations: Intercalibration of ecological status concepts across European lakes for littoral diatoms. Hydrobiologia 2014, 734, 125–141. [Google Scholar] [CrossRef] [Green Version]
  59. Van Dam, H.; Mertens, A.; Sinkeldam, J. A coded checklist and ecological indicator values of freshwater diatoms from The Netherlands. Neth. J. Aquat. Ecol. 1994, 28, 117–133. [Google Scholar]
  60. Trobajo Pujadas, R. Ecological Analysis of Periphytic Diatoms in Mediterranean Coastal Wetlands (Empordà Wetlands, NE Spain); Koeltz Scientific Books: Koenigstein, Germany, 2007. [Google Scholar]
  61. Della Bella, V.; Puccinelli, C.; Marcheggiani, S.; Mancini, L. Benthic diatom communities and their relationship to water chemistry in wetlands of central Italy. Int. J. Limnol. 2007, 43, 89–99. [Google Scholar] [CrossRef]
  62. Rimet, F. Diatoms: An Ecoregional Indicator of Nutrients, Organic Matter and Micropollutants Pollution. Ph.D. Thesis, Université de Grenoble, France, 2012. [Google Scholar]
  63. Krammer, K.; Lange-Bertalot, H. Bacillariophyceae 4. Teil: Achnanthaceae. Kritische Ergänzungen zu Navicula (Lineolatae) und Gomphonema. : , 1991; Volume Band 2/4. G. Fischer Verlag.: Stuttgart, Germany, 1999; Volume Band 2/4. [Google Scholar]
  64. Morin, S.; Duong, T.T.; Dabrin, A.; Coynel, A.; Herlory, O.; Baudrimont, M.; Delmas, F.; Durrieu, G.; Schäfer, J.; Winterton, P.; et al. Long-term survey of heavy metal pollution, biofilm contamination and diatom community structure in the Riou-Mort watershed, South West France. Environ. Pollut. 2008, 151, 532–542. [Google Scholar] [CrossRef] [PubMed]
  65. Arini, A.; Feurtet-Mazel, A.; Maury-Brachet, R.; Pokrovsky, O.; Coste, M.; Delmas, F. Recovery potential of periphytic biofilms translocated in artificial streams after industrial contamination (Cd and Zn). Ecotoxicology 2012, 21, 1403–1414. [Google Scholar] [CrossRef] [PubMed]
  66. Bayona, Y.; Roucaute, M.; Cailleaud, K.; Lagadic, L.; Bassères, A.; Caquet, T. Structural and biological trait responses of diatom assemblages to organic chemicals in outdoor flow-through mesocosms. Environ. Pollut. 2014, 192, 186–195. [Google Scholar] [CrossRef] [PubMed]
  67. Lainé, M.; Morin, S.; Tison-Rosebery, J. A multicompartment approach—Diatoms, macrophytes, benthic macroinvertebrates and fish—To assess the impact of toxic industrial releases on a small French river. PLoS ONE 2014, 9, e102358. [Google Scholar] [CrossRef] [PubMed]
  68. Rimet, F.; Ector, L.; Dohet, A.; Cauchie, H.M. Impacts of fluoranthene on diatom assemblages and frustule morphology in indoor microcosms. Vie et Milieu 2004, 54, 145–156. [Google Scholar]
  69. Larras, F.; Coulaud, R.; Gautreau, E.; Billoir, E.; Rosebery, J.; Usseglio-Polatera, P. Assessing anthropogenic pressures on streams: A random forest approach based on benthic diatom communities. Sci. Total Environ. 2017, 586, 1101–1112. [Google Scholar] [CrossRef] [PubMed]
  70. Greater Sudbury Climate Change Consortium. Available online: http://www.sudburyclimateaction.ca/en/ (accessed on 19 October 2017).
  71. Morin, S.; Lambert, A.S.; Planes Rodriguez, E.; Dabrin, A.; Coquery, M.; Pesce, S. Changes in copper toxicity towards diatom communities with experimental warming. J. Hazard. Mater. 2017, 334, 223–232. [Google Scholar] [CrossRef] [PubMed]
Figure 1. Sampling sites in the Greater Sudbury area, Ontario, Canada. The shaded zone (light gray) represents the city of Grand Sudbury. WWTP = wastewater treatment plant.
Environments 05 00030 g001
Figure 2. Canonical correspondence analysis showing diatom assemblage distribution in relation to environmental variables. IDEC scores, CCU values and % teratologies were added a posteriori, as passive variables. Brachysira vitrea (BVIT); Nitzschia palea (NPAL); Navicula veneta (NVEN); Achnanthidium minutissimum complex (ADMI); Encyonema silesiacum (ELSE); Rhoicosphenia abbreviata (RABB); Planothidium lanceolatum (PTLA); Navicula gregaria (NGRE); Hippodonta capitata (HCAP); Caloneis bacillum (CBAC); Navicula germainii (NGER); Encyonopsis microcephala (ENCM); Fragilaria capucina (FCAP); Nitzschia palea var. debilis (NPAD); Nitzschia palea aff. debilis form 2 (NPAD2); Amphora veneta (AVEN); Eolimna subminuscula (ESBM); Eolimna minima (EOMI); Gomphonema clavatum (GCLA). Group 1: sites receiving treated mining effluents, with elevated metal concentrations and higher CCU values. Group 2: reference or least-disturbed sites corresponding to background conditions of the area (in terms of metals). Group 3: sites with the highest nutrient loads.
Environments 05 00030 g002
Figure 3. Mean % teratologies (±SE) for sites with background metal contamination versus low, moderate and high toxicity based on CCU values (left panel). Examples of normal (left) and abnormal (right) specimens observed at JC 8 and JC 9, scale bar = 10 μm (right panel).
Environments 05 00030 g003
Table 1. Physico-chemical characteristics (mean ± SD when available), metal toxicity index (cumulative criterion unit (CCU)) and biological descriptors for the 19 sampling sites.
Sampling SitesMBCVRCC1CC2CC3JC 1JC 2JC 3JC 4JC 5JC 6JC 7JC 8JC 9FBCNC 1NC 2NC 3CCC
Temperature (°C)13.614.314.416.016.716.614.413.413.214.014.917.816.915.515.613.412.115.617.7
Conductivity (mS/cm)0.5010.09631.121.131.08NANANA1.33NA1.513.512.561.621.351.431.241.464.70
pH7.56.66.56.56.77.27.77.27.37.18.07.87.07.07.76.27.47.95.7
Hardness (mg/L)177 ± 037.6 ± 0.2331 ± 2338 ± 2320 ± 11010 ± 13602 ± 1506 ± 1430 ± 2303 ± 1256 ± 11018 ± 8637 ± 2536 ± 2260 ± 0336 ± 1154 ± 1218 ± 01620 ± 8
DOC (mg/L)5.34 ± 0.0015.8 ± 0.34.06 ± 0.004.04 ± 0.074.20 ± 0.001.68 ± 0.033.46 ± 0.073.78 ± 0.006.28 ± 0.025.78 ± 0.074.49 ± 0.002.21 ± 0.004.13 ± 0.003.54 ± 0.005.49 ± 0.071.84 ± 0.043.96 ± 0.125.26 ± 0.005.28 ± 0.14
Mg (mg/L) 14.3 ± 0.13.30 ± 0.0112.5 ± 0.112.7 ± 0.112.4 ± 0.031.9 ± 0.123.4 ± 0.120.7 ± 0.018.9 ± 0.115.6 ± 0.014.2 ± 0.126.9 ± 0.220.2 ± 0.017.8 ± 0.126.5 ± 0.012.8 ± 0.013.4 ± 0.112.8 ± 0.039.3 ± 0.5
Ca (mg/L)47.3 ± 0.19.64 ± 0.06112 ± 1115 ± 1108 ± 0352 ± 6202 ± 0169 ± 0141 ± 195.5 ± 0.579.0 ± 0.2364 ± 3222 ± 1185 ± 160.4 ± 0.1113 ± 039.4 ± 0.366.5 ± 0.0584 ± 4
SO4 (mg/L)34.0 ± 0.05.00 ± 0.00241 ± 2245 ± 1230 ± 1942 ± 4453 ± 3363 ± 3166 ± 1194 ± 1254 ± 21202 ± 33701 ± 3561 ± 3194 ± 1268 ± 4137 ± 1172 ± 21923 ± 7
NO3 (mg/L)0.94 ± 0.060.78 ± 0.007.64 ± 0.586.24 ± 0.585.0 ± 1.619.7 ± 0.37.63 ± 0.155.98 ± 0.060.95 ± 0.033.20 ± 0.007.23 ± 0.5828.6 ± 2.120.6 ± 1.216.4 ± 0.43.20 ± 0.006.6 ± 1.23.7 ± 1.15.30 ± 0.583.20 ± 0.00
TP (μg/L)22.6 ± 0.429.9 ± 1.19.00 ± 0.208.87 ± 0.1238.5 ± 0.412.7 ± 0.547.3 ± 0.446.1 ± 0.741.5 ± 1.329.1 ± 0.736.0 ± 0.848.1 ± 2.270.2 ± 3.0137 ± 115.7 ± 0.311.5 ± 0.99.63 ± 0.0616.9 ± 0.16.57 ± 0.15
Al (μg/L)13.1 ± 0.841 ± 1619.6 ± 6.116.3 ± 3.814.6 ± 0.315.1 ± 1.714.0 ± 1.516.5 ± 0.116.1 ± 0.415.0 ± 1.018.1 ± 2.515.9 ± 1.215.5 ± 1.313.5 ± 1.410.9 ± 0.513.0 ± 3.114.2 ± 1.515.5 ± 0.517.9 ± 2.5
Ni (μg/L)18.1 ± 0.27.22 ± 0.2225.1 ± 0.125.7 ± 0.0197 ± 1226 ± 1199 ± 1152 ± 0113 ± 041.9 ± 0.489.6 ± 0.4290 ± 1211 ± 1185 ± 0788 ± 31037 ± 3804 ± 6689 ± 232.9 ± 1.0
Cu (μg/L)1.72 ± 0.051.97 ± 0.072.47 ± 0.042.72 ± 0.065.4 ± 2.13.11 ± 0.062.09 ± 0.022.33 ± 0.063.48 ± 0.042.62 ± 0.097.40 ± 0.245.91 ± 0.104.32 ± 0.113.90 ± 0.055.72 ± 0.1710.2 ± 0.238.0 ± 2.719.3 ± 1.45.96 ± 0.18
Zn (μg/L)NA1.8 ± 3.0NANA1.6 ± 2.73.3 ± 0.57.43 ± 0.036.2 ± 1.06.1 ± 2.01.5 ± 1.15.06 ± 0.495.79 ± 0.13NANA2.02 ± 0.0823.8 ± 0.223.2 ± 0.111.4 ± 0.60.38 ± 0.08
Cd (μg/L)0.029 ± 0.0000.006 ± 0.0010.039 ± 0.0020.038 ± 0.0020.041 ± 0.0020.101 ± 0.0010.050 ± 0.0030.045 ± 0.0030.047 ± 0.0010.016 ± 0.0010.043 ± 0.0020.161 ± 0.0010.025 ± 0.0040.021 ± 0.0010.080 ± 0.0030.298 ± 0.0020.476 ± 0.0090.278 ± 0.0080.096 ± 0.002
Pb (μg/L)0.016 ± 0.0020.20 ± 0.060.006 ± 0.0010.005 ± 0.0000.007 ± 0.0040.155 ± 0.0020.041 ± 0.0020.042 ± 0.0030.036 ± 0.0020.012 ± 0.0030.04 ± 0.020.038 ± 0.0010.042 ± 0.0010.011 ± 0.0020.006 ± 0.002NANANA0.012 ± 0.002
CCU0.7 (B)2.6 (M)0.6 (B)0.6 (B)1.8 (L)0.7 (B)0.9 (B)0.8 (B)1 (L)0.7 (B)2.1 (M)1.1 (L)1 (L)1 (L)5.3 (M)6.7 (M)19.9 (H)9.4 (M)0.4 (B)
% teratologies0.70.00.00.20.51.01.01.71.21.01.01.26.18.71.51.21.04.51.5
IDEC score/Class 24/C42/C64/B62/B31/C83/A6/D14/D1/D26/C27/C36/C6/D21/C85/A100/A100/A78/A43/C
In bold: Exceed water quality criteria by a factor of 1.5× or more. B = baseline, L = Low, M=Moderate, and H=High refer to the toxicity category based on CCU values. Biological integrity classes related to IDEC scores; A = reference, B = good-moderate, C = moderate-poor, D = very poor. NA: not available. Detection limits: Cu = 0.009 µg/L; Zn = 0.03 µg/L; Cd = 0.005 µg/L; Pb = 0.004 µg/L; Al = 0.4 µg/L; Mn = 0.17 µg/L; Fe = 0.9 µg/L; Na = 1.9 µg/L; Mg = 4.9 µg/L; K = 1.7 µg/L; Ni = 0.7 µg/L; Ca = 1.1 µg/L; SO4 = 0.022 mg/L; NO3 = 0.016 mg/L; Cl = 0.03 mg/L; F = 0.011 mg/L; DO = 0.05 mg/L; TP = 0.8 μg/L. MBC: Maley Branch Creek; VR: Veuve River; CC: Coniston Creek; JC: Junction Creek; FBC: Frood Branch Creek; NC: Nolin Creek; CCC: Copper Cliff Creek.
Table 2. Significant indicator species for each of the three groups based on the method from Dufrêne and Legendre [39]. Indicator values range from 0 to 100 (excellent indicator). SD = standard deviation.
SpeciesGroup on the CCAIndicator ValueMeanSDp-Value
Brachysira vitrea (BVIT)196.454.314.700.002
Navicula gregaria (NGRE)275.041.015.770.05
Nitzschia palea var. debilis (NPAD)270.842.812.430.02
Eolimna minima (EOMI)370.144.912.250.043
Eolimna subminuscula (ESBM)399.925.514.350.004
Nitzschia palea aff. debilis form 2 (NPAD2)399.725.114.220.004
Amphora veneta (AVEN)399.729.014.570.003
CCA: canonical correspondence analysis.

