Study of the Water Quality of a Tropical Reservoir
by
 ,
,
Alberto Quevedo-Castro
1, 
Jesús L. Lopez
1,
Jesús Gabriel Rangel-Peraza
1,
Erick Bandala
2 and 
Yaneth Bustos-Terrones
3,*
1
Division of Postgraduate Studies and Research, Technological Institute of Culiacán, Juan de Dios Bátiz 310, Col. Guadalupe, CP. 80220 Culiacán, Mexico
2
Division of Hydrologic Sciences, Desert Research Institute, 755 Flamingo Road, Las Vegas, NV 89119-7363, USA
3
CONACYT-Division of Postgraduate Studies and Research, Technological Institute of Culiacán, Juan de Dios Bátiz 310, Col. Guadalupe, CP. 80220 Culiacán, Mexico
*
Author to whom correspondence should be addressed.
Environments 2019, 6(1), 7; https://doi.org/10.3390/environments6010007
Submission received: 30 November 2018
/
Revised: 24 December 2018
/
Accepted: 7 January 2019
/
Published: 10 January 2019
Abstract
:A study of the water quality of the Adolfo López Mateos Reservoir (ALMD) was developed through different indicators from a spatial and seasonal perspective. Variables related to the general characteristics of water quality, trophic level, and ecological risk were assessed through the National Sanitation Foundation–Brown Water Quality Index (WQINSF–BROWN), the Carlson Trophic State Index (TSICARLSON) and the Håkanson Ecological Risk Index (RIHÅKANSON). Using data from physical, chemical, and biological parameters obtained from four sampling points in the ALMD, the water quality was assessed in each model used. The results indicated that the reservoir presents a water quality classified as “medium” (WQINSF–BROWN = 70), where significant variations in the concentrations of some parameters are observed. The reservoir showed a general trophic state (TSIGENERAL-AVERAGE = 43.04) classified as “mesotrophic”. The ecological risk analysis achieved the best classification of the methodology, discarding contamination by heavy metals in surface waters. This type of applied methodology will help in decision-making tools in the dam, and can be applied in other dams in the region.
1. Introduction
Water resources are dynamically influenced by several factors such as human, agricultural, and industrial activities. For this reason, waterbodies show poor water quality [1]. The assessment of water quality is obtained through the study of physical, chemical, and biological components, which are related to natural phenomena, human effects, and their possible uses. The reservoirs play a fundamental role from the ecological point of view. Therefore, poor water quality puts at risk the sustainability and survival of ecosystems and their species [2,3].
Contamination of waterbodies is commonly affected due to an increase in contaminant concentrations as a consequence of agrochemical abuse, upstream mining leachates, the use of herbicides in anti-narcotics campaigns, domestic waste, and discharge of wastewaters, as well as the presence of species of aquatic lily produced by eutrophication in reservoirs [4,5]. Contaminants entering a water body naturally or anthropogenically are retained in sediments and deposited at the bottom of these aquatic ecosystems, causing toxic effects on aquatic systems. These deposits are of a great scientific value since they retain a historical record of the type of pollution that has taken place in the surrounding areas. Besides, when the sediments interact with the surface water currents, they move the retained contaminants and alter the general dynamics of the water mass [6]. Thus, variations in pH, salinity, and the properties of the redox potential can cause the mobilization and resuspension of chemical particles accumulated in the sediments, magnifying even its toxic effect, such as the case of heavy metals. Heavy metals are largely derived from anthropogenic sources, such as domestic, agricultural, and industrial waste, and constitute a danger to aquatic biota and human beings, as well representing an environmental deterioration factor [7].
The monitoring and evaluation of water quality involve an analysis of various parameters that evidence the degree of alteration of natural variations of a waterbody. These variations are analyzed through indicators that quantify water quality for a given use from a holistic perspective [8,9]. However, the efforts made in the literature only show applications from a specific perspective for each indicator, considering only partial diagnoses of water quality that can be affected by various sources of pollution such as eutrophication or contamination by heavy metals. Different mathematical tools are proposed in order to integrate indicators that show a broader diagnosis through the application of multiparameter indicators in tropical water bodies. One of them is the Water Quality Index (WQI), which represents a numerical classification involved in the decision making of water resources to diagnose the spatial and temporal variation of contaminants and facilitating the treatment and analysis of a large amount of data [10,11]. The most commonly method used for the computation of the WQI is the one proposed by Brown and the National Sanitation Foundation (NSF) [12,13,14,15].
Another tool is the Trophic State Index (TSI), which is used to define the trophic status of a waterbody. The Carlson TSI considers the annual average values of transparency by using the depth of Secchi disk, surface concentrations of total phosphorus, and chlorophyll-α [16,17,18]. Finally, the Ecological Risk Index (RIHÅKANSON), developed by Håkanson [19], is used to calculate the toxicity coefficient of various metallic elements [20,21,22,23]. The integration of metric tools in the evaluation of the water quality allows for extending the assessment of water quality of aquatic ecosystems from several perspectives [24].
Multiparametric studies in water bodies show a broader picture than works that only consider water quality parameters analyzed in insolation. Due to the scarce information in the implementation of various indices in tropical waterbodies, this work aims to undertake a comprehensive study of water quality by implementing the WQI, TSI, and ERI indexes, considering physical, chemical, and biological parameters with respect to eutrophication and ecological risk for the Adolfo López Mateos Reservoir (ALMD).
2. Materials and Methods
2.1. Study Area
The Adolfo López Mateos Reservoir (ALMD) is located in the state of Sinaloa to the north of Mexico (25°5′25′′ North Latitude and 107°23′00′′ West Longitude). The ALMD is one of the most important tropical reservoirs in the region and contributes to the water supply for the production of agricultural foods, being the region with the largest export in the country. This reservoir is the largest in surface extension (11.354 Ha) and has a conservation capacity of 3.087 Mm3. Therefore, this reservoir is essential for irrigating the most important agricultural valley in Mexico [25]. The modification of the environment by the construction of hydraulic systems for the control of avenues, logging and accelerated deforestation, construction of roads, and dismantling and diversion of currents can change the water quality of the reservoir [26].
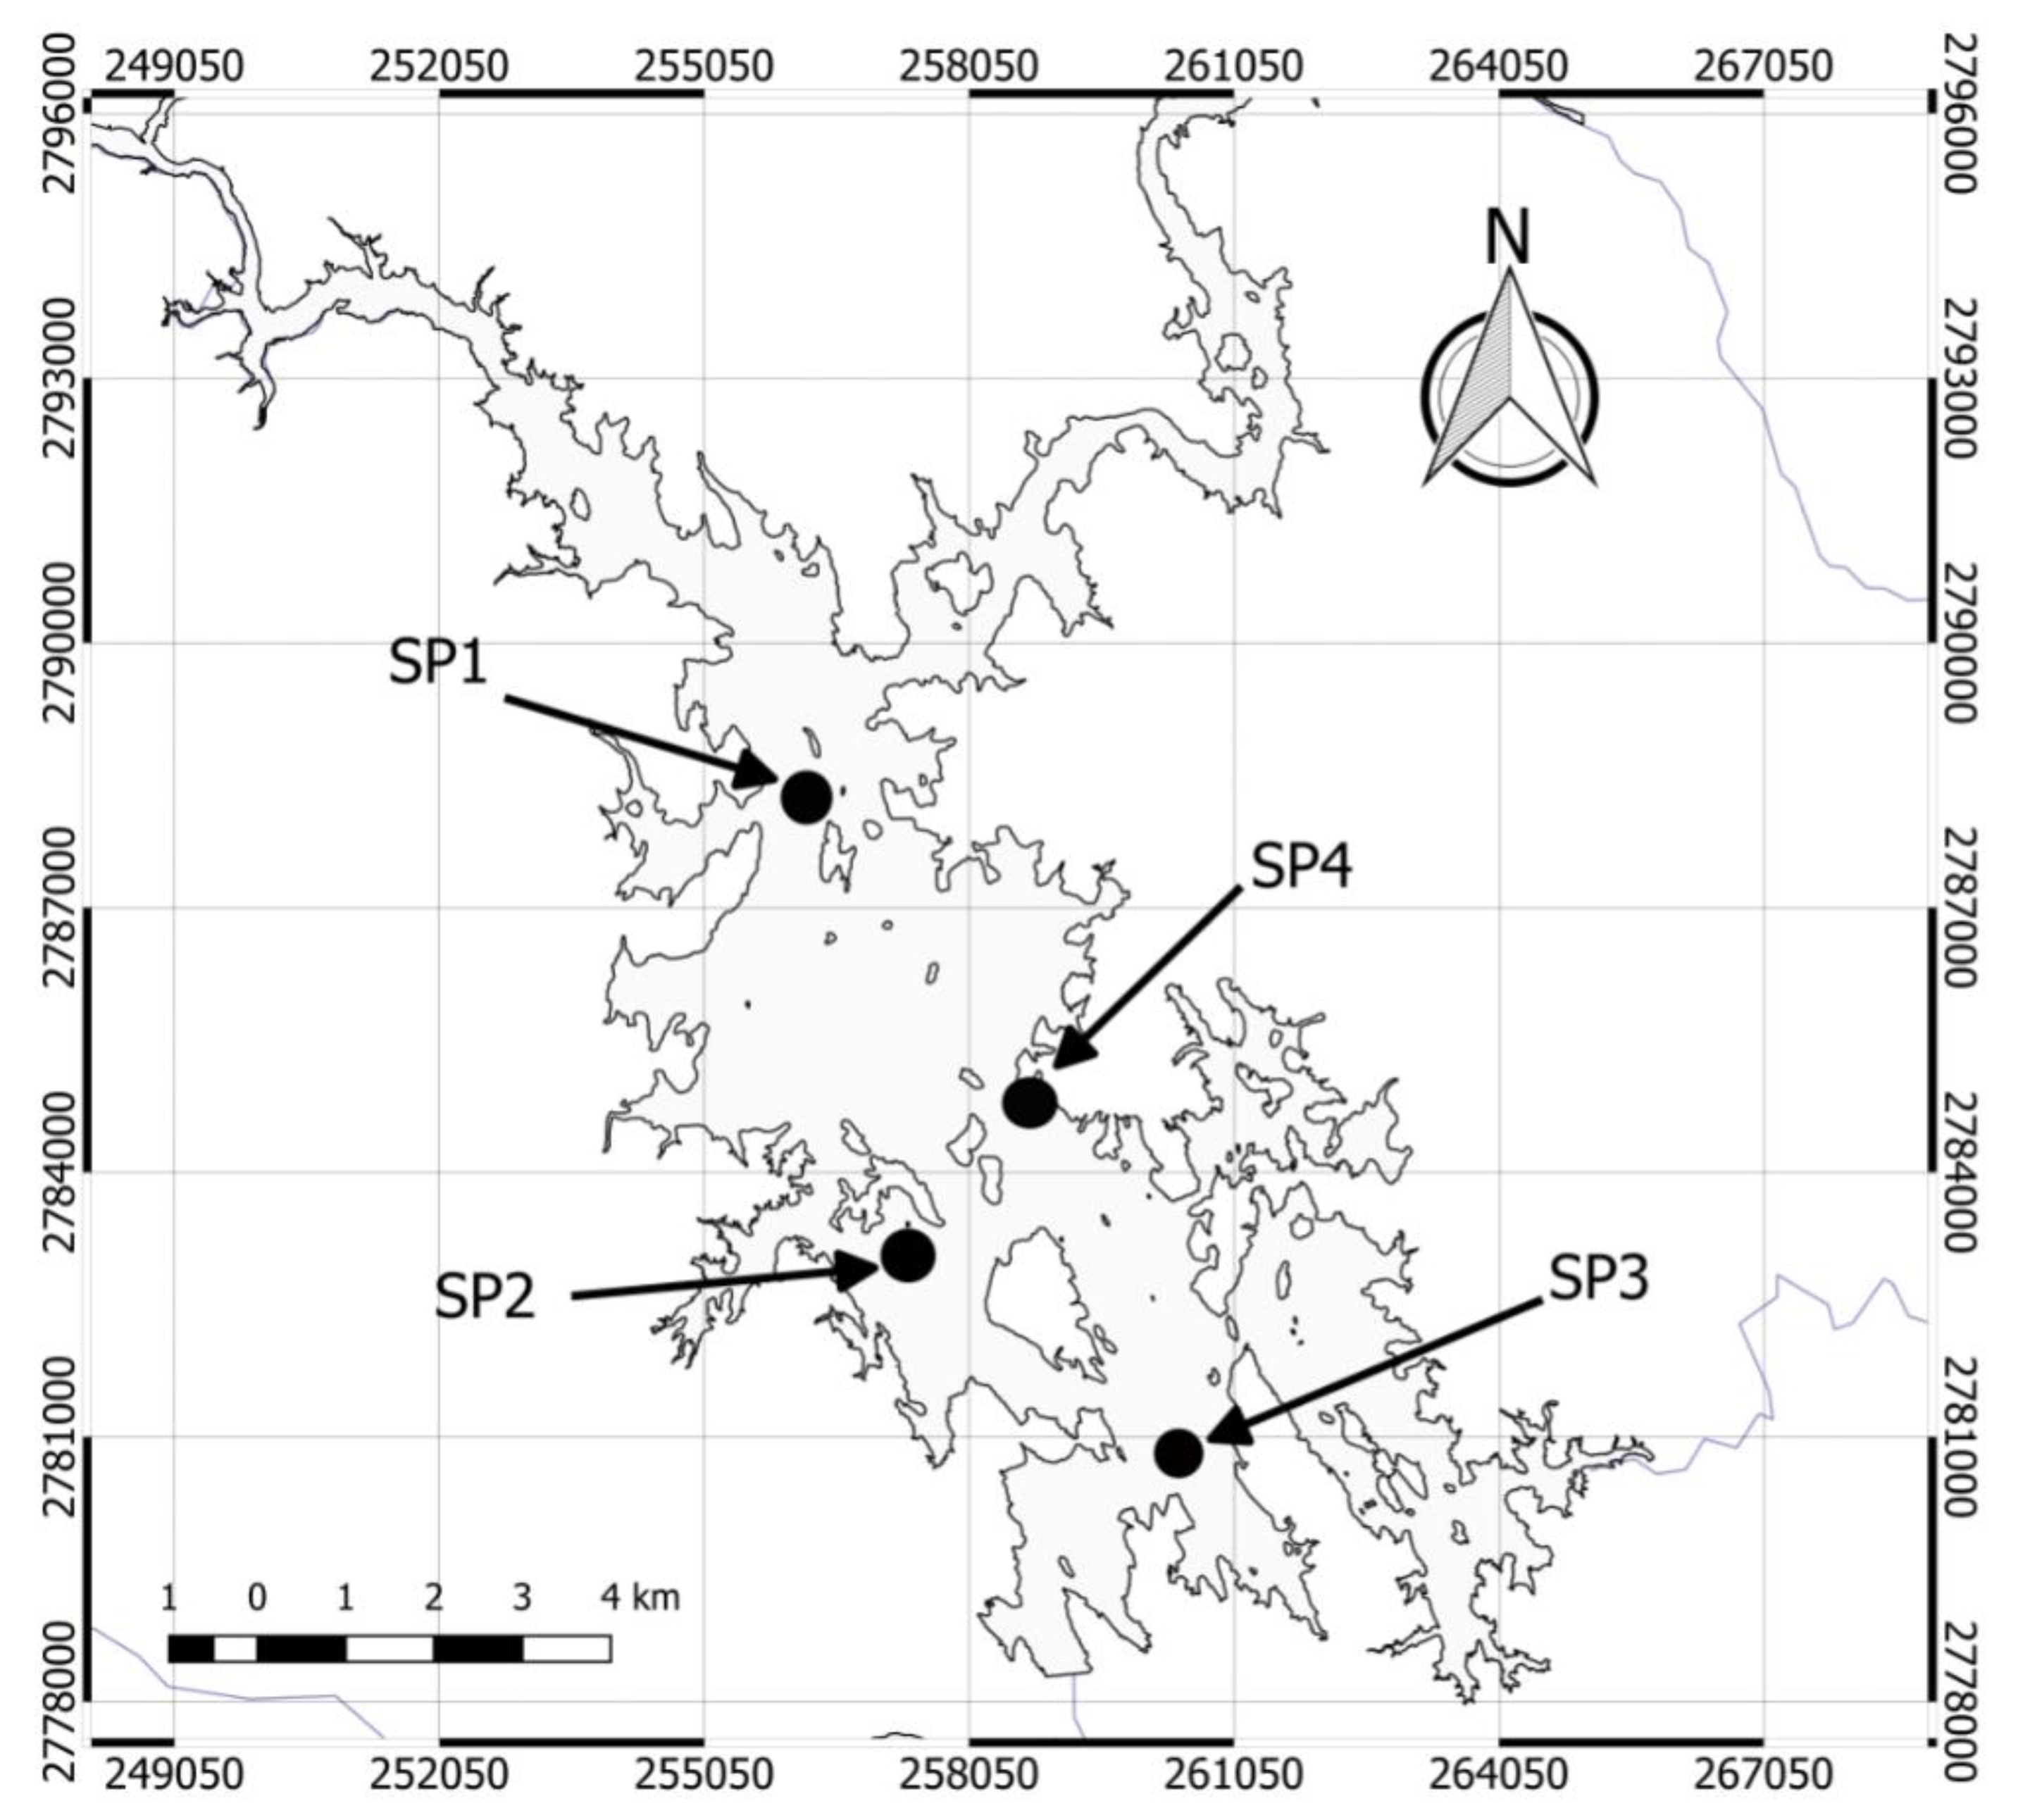
This work was carried out using data provided by the National Water Commission of Mexico (a government agency which is the watershed operator). This information was obtained every six months in the ALMD through the National Monitoring Network. For this work, the physicochemical and biological data consisting of the period of 2012–2017 were used. The monitoring was conducted biannually at four sampling points of the ALMD (Figure 1). The sampling, transportation, and preservation of samples were carried out in accordance with standard methods. The samples were analyzed in an accredited laboratory by the Mexican Accreditation Entity, based on international standard methods for water analysis [27].
2.2. Water Quality Index
To simplify the interpretation of the physicochemical and biological parameters of the ALMD, the National Sanitation Foundation–Brown Water Quality Index (WQINSF–BROWN) was used [28]. The WQINSF–BROWN showed the water quality state of the reservoir by using the averages of the concentrations obtained from nine parameters of water quality for seven years (2012–2017) at four sampling points (SP1–SP4). A linear mathematical model (Equation (1)) was used in order to calculate the WQINSF–BROWN. This model involves the use of nine water quality parameters: fecal coliforms (FC), biochemical oxygen demand (BOD5), nitrates (NO3), phosphates (PO4−), hydrogen potential (pH), dissolved oxygen (DO), total dissolved solids (TDS), temperature (Tem), and turbidity (Tur). Weights (wi) were assigned for each parameter and the quality distributions (Subi) were used based on the established by the aforementioned methodology.
where wi is the relative weight assigned to each parameter weighted between 0–1. The sum of the 9 weights must be equal to 1 (Table 1). The value Subi represents the score obtained as a function of water quality parameter. This value depends on the probability distribution for each parameter. The mean value of each water quality parameter represents a score between 0 and 100. The higher the score is, the better the quality of water. The index result was classified according to the scale proposed by the National Sanitation Foundation (NSF) (Excellent = 91–100; Good = 71–90; Fair = 51–70; Marginal = 26–50; Poor = 0–25) [28].
2.3. Trophic State Index
The criteria for evaluating eutrophication in a waterbody consider the analysis of nutrient concentrations and the amount of chlorophyll a (Chla) and total phosphorus (TP), as well as the transparency (Tra) with Secchi Disk [29,30]. The classification of trophic state is based on the nutrient that represents a primary production limitation. In most of the cases, the limiting nutrient is phosphorus in waterbodies, in particular in those located in tropical regions [11,31,32,33]. The evaluation of eutrophication in the ALMD was carried out using the Carlson Trophic State Index [34] (TSICARLSON). The scale of the TSICARLSON varies between 0 and 100, where TSICARLSON 0–29 = oligotrophic, TSICARLSON 30–59 = mesotrophic, TSICARLSON 60–89 = eutrophic, and TSICARLSON 90–100 = hypertrophic. The TSICARLSON is obtained by calculating the mathematical equations established in Equations (2) to (5) using the mean values of the parameters that compose the index and the transparency (TSITra) determined by measuring the Secchi Disk depth, while chlorophyll concentration (TSIChla) and total phosphorus (TSITP) were determined out using standard methodologies [27]. Ln is the calculation of the natural logarithm.
2.4. Ecological Risk Index
The pollution produced by high levels of heavy metals in water bodies has been a major concern for the scientific community because of the impact of toxicity levels on aquatic ecosystem ecology [35,36]. The content of harmful metals in the water increases significantly due to the discharge of industrial waste, the combustion of fossil fuels, domestic wastewater, water transport, and agricultural irrigation [37]. Ecological risk assessment is the process used to verify how the environment is affected as a result of exposure to one or more environmental stressors such as chemicals, land change, disease, invasive species, and climate change [38]. When an aquatic ecosystem is exposed to contaminants, waterbodies should be analyzed including various aspects, including physical, chemical, and biological parameters, and the amount of metals influenced by some hydrological factors such as dispersion, advection, and dilution or by some geochemical processes such as adsorption–desorption, precipitation, and diffusion [39]. In this study, the Ecological Risk Index (ERI) was used as a fast and practical tool for environmental risk assessment in ALMD. This methodology is proposed by Håkanson [19] and suggests the classification of contamination in a waterbody and the identification of the toxic substances in order to take actions for the control and mitigation of this contamination [40,41,42]. The Ecological Risk Index is based on the Equations (6) and (7):
where RIHÅKANSON is the ERI presented by the waterbody, is the factor of the potential ecological risk, and is the toxic response factor of a given substance (i = mg/L). The ERI is defined as the sum of all the risk factors (). On the other hand, it is also necessary to calculate the degree of pollution (Cd) by obtaining the factor of pollution of each metal (. This factor is obtained by the ratio between the mean concentration of the metal ( and the reference concentration given by the standard preindustrial impact ( (Table 2).
For the calculation of each value, the equations of the toxic-response of the methodology were considered (HG = 40 × 5/BPI, Cd = 30 × √ 5/√ BPI, As = 10, Pb = Cu = 5 and Cr = 2 × √ 5/√ BPI, where BPI is the intermediate bioproduction index (BPI = 5). Each was obtained by dividing the mean concentration of the heavy metals (, where the reference values given by the methodology ( were: Hg (mercury) = 0.25, Cd (cadmium) = 1.0, As (arsenic) = 15, Pb (lead) = 70, and Cr (chromium) = 90).
3. Results and Discussion
3.1. Selection of Parameters
The ALMD is under the supervision of the national militia to safeguard the integrity of the reservoir with the support of CONAGUA, which is the operator responsible for the control of facilities and the monitoring of the water quality parameters. The water quality data were analyzed from a temporal and spatial perspective studying the behavior of the parameters for the determination of each index. By integrating components that define the health of reservoirs using multiparameter measurements from various perspectives, a better diagnosis is obtained in the extension of the water quality assessment. Unlike recent classical non-multiparameter studies that only evaluate the WQI, TSI, and ERI from a specific point of view [43,44,45], the proposed multiparametric study opens the gap by considering a panorama that deepens the understanding of those natural intrinsic processes or anthropogenic that impact on the quality of reservoir water over time from a global context. Due to the nulls efforts to integrate multiparameter parameter analysis tools, a series of physical, chemical, and biological parameters (Table 3) were used for the computation of WQINSF–BROWN. Aspects related to the eutrophication of the reservoir were addressed in TSICARLSON and the toxicity of some heavy metals was assessed through the ecological risk analysis (RIHÅKANSON). A Pearson correlation analysis was also carried out to identify the degree of correlation between variables with respect to the water quality of the ALMD. The bold numbers represent the variables that had a more significant correlation (p < 0.05) (Table 4).
3.2. Water Quality Index
To calculate the WQINSF–BROWN, each subscript (Subi) of the nine parameters that compose the methodology [28] was calculated through the probability distributions that express the water quality related to the concentration means obtained each year (Table 5) and for each sampling point (SP) (Table 6). The value obtained from probability distribution (Subi) was multiplied by the weight (Wi). WQIValue (Subi * Wi) was calculated for each parameter and these values were added (∑WQIValue) to calculate the WQINSF–BROWN (Table 7).
The mean spatial (SP1-SP4) and temporal (2012–2017) variations of the WQINSF–BROWN classify the water quality of ALMD as “medium” (WQINSF–BROWN = 70) (Table 7). The superficial reservoirs that have a “medium” classification for water quality present a moderate increase in the concentration of pollutants [46]. In the temporal variation, fluctuations of the WQINSF–BROWN of 59–81% are observed during the 6-year period of study. This significant variation is due to the significant increase in the mean values of CF (2127 CFU/100 mL), Tur (22.18 NTU), and DO (5.07 mg/L). The best water quality was observed in 2016, with a WQINSF–BROWN of 81 (CF = 127 CFU/100 mL, Tur = 3.34 NTU, and DO = 9.63 mg/L) (Table 3). The presence of high warm temperatures significantly influences the decrease in the score for the subi, both in the lower condition found (2013; Tem = 31.28 °C) as the highest one (2016; Tem = 30.7 °C) (Table 3). From a temporal point of view, a significant variation was observed in this study (2016 WQINSF–BROWN = 81; 2017 WQINSF–BROWN = 67), which is attributed to the increase in the concentrations of FC (992 CFU/100 mL) and BOD5 (3.46 mg/L) (Table 3). In the years 2012 (WQINSF–BROWN = 64), 2013 (WQINSF–BROWN = 59), and 2017 (WQINSF–BROWN = 67), the water quality of the ALMD was classified as “medium”, while in 2014 (WQINSF–BROWN = 74), 2015 (WQINSF–BROWN = 73), and 2016 (WQINSF–BROWN = 81), this reservoir showed a “good” water quality (Table 7). NO3− showed a variation of 0.01–0.24 mg/L and PO4− of 0.01–0.04 mg/L (Table 3). The parameters with the highest value of subi during the period of study were pH and Tur, with a mean value of 89.94% and 88.85%, respectively. On the other hand, the lower mean percentages were attributed to Tem (10.35%), BOD5 (49.18%), FC (60.86%) and TDS (67.18%) (Table 5).
Water quality index values (WQINSF–BROWN) ranged from 70 to 71 (Table 7) in the four sampling points. A slight increase in the concentrations of FC was observed in the four sampling points (Table 3). The reservoir showed a homogeneous distribution of contaminants in the 4 sampling points for BOD5 parameters (3.25–3.63 mg/L) and TDS (111–119 mg/L). Warm temperatures were also observed in the AMLD, ranging from 29.79 to 30.05 °C (Table 3). Due to the homogeneous behavior of water quality parameters from a spatial point of view, the water quality was maintained as “medium” classification according to Brown et al. [28]. On the other hand, due to the decrease of Tur (2.54 NTU) and TDS (111 mg/L), and the increase of OD concentration (7.54 mg/L) (Table 3), the reservoir was classified as “Good” in SP3 (Table 7). Turbidity and TDS are related to the dissolved solids and particulate matter. Therefore, a reduction of these parameters increases the penetration of sunlight that originates the photosynthetic processes and the balance of primary productivity, improving the health conditions in the oxygenation of the reservoir [47]. The reservoirs classified in the category “Good” represent suitable conditions for the proper functioning of the ecosystem and the trophic chain [48]. The variables with the highest score in the spatial evaluation are attributed to NO3− and PO4. Values of 100% were found for the subi of each sampling point. This situation could be related to the low levels of these nutrients found in the AMLD.
In the AMLD, the main pollutants distributed along the water body correspond to particulate matter originated by organic material and toxic inorganics coming from natural or anthropogenic activities [49]. These type of contaminants that are scattered evenly in the four sampling points and with significant variations in the temporal evaluation are regulated by the diffusion–advection processes [50]. In this way, the spatial and temporal analysis show that the parameters with the most significant changes in the index are due to the variation of the concentration of FC, BOD5, Tur, TDS, and Tem. On the other hand, the parameters that showed the highest scores in the subi obtained were NO3− and PO4−, with concentrations less than 0.24 mg/L and 0.04 mg/L, respectively (Table 3).
3.3. Trophic State Index
The mean concentrations of Chla and TP, and the Tra values were used to obtain the TSICARLSON (Table 8) by using the Equations (2)–(5) [51]. According to these equations, the trophic level of ALMD is “mesotrophic” (30 < TSICARLSON < 60). Spatial (TSISPATIAL-AVERAGE = 43.94) and temporal (TSITEMPORAL-AVERAGE = 42.14) values are consistent with this classification. A spatial analysis showed that TSICARLSON does not present significant variation between the four sampling points analyzed. These values oscillated between 43.10 and 44.37, with a difference of 1.27%. Chla is a key biochemical component in the cellular process of biomass production through the consumption of nutrients (nitrogen and phosphorus) responsible for the photosynthesis process [52,53]. The variation of Chla was from 6.07 to 11.3 mg/m3, with a significant increase of 46% in this concentration between samples points SP3 and SP4. The values of Tra varied between from 1.51 to 1.71 m (Table 3). A positive Pearson correlation was observed between Chla and PO4, (Table 4). Despite the high variation of Chla, low concentrations of TP (0.09–0.11 mg/L) and NO3− (0.04–0.07 mg/L) were observed (Table 3). This situation limited the overproduction of biomass from the reservoir, which explains the slight variation observed for the spatial Trophic Status Index: SP4 (43.10) < SP2 (43.92) < SP3 (44.36) < SP1 (44.37). The trophic status of AMLD at each sampling point is mainly attributed to TSITra (53) > TSIChla (51.22) > TSITP (27.59).
On the other hand, the temporal variation showed that the year with the highest incidence in the index occurred in 2013 (TSICARLSON = 55.27), with a difference of 18.86% compared with the highest score; 2012 (TSICARLSON = 36.41). The lowest values of TSIChla (59.01), TSITra (66.48), and TSITP (40.31) were obtained in 2013, while the optimal values are attributed to 2012 (TSIChla = 39.53), 2015 (TSITra = 45.23), and 2017 (TSITP = 14.54). PT showed significant correlation (p < 0.05) with FC (0.5241), NO3− (0.89), pH (−0.3966), PO4− (0.3395), and Tur (0.7583), while Tra was significantly correlated with PT (−0.3557), FC (−0.4641), BOD5 (0.3272), NO3− (−0.3848), PO4− (0.3133), and Tur (−0.4621) (Table 4). TP is often correlated with Tra and therefore, a doubling in the TP concentration is attributed to a reduction of half the depth of Secchi Disk. A similar behavior is observed for Chla [34]. Thus, the increase in concentrations of some pollutants related to nitrogenous and phosphorous compounds, as well as biodegradable particulate matter and bacteria, increase the turbidity in the water [54]. The increase of turbidity prevents biochemical processes of natural self-purification, which needs the solar light [49]. The main contaminants that indirectly influence the trophic status of the ALMD are due to diffuse sources attributed to productive activities generated in the region as livestock (FC = 2127 CFU/100 mL), biodegradable and non-biodegradable particulate material product of soil erosion and vegetation deforestation (BOD5 = 6.02 mg/L), as well as the use of fertilizers in agriculture (NO3− = 0.24 mg/L) that cause the turbidity in the water of the ALMD (Tur = 22.1 NTU) (Table 3). A highly positive significant correlation between FC and Tur (0.826) and a medium correlation between FC and NO3− were found in this study. This last correlation could be explained as following: these bacteria are thermotolerant fecal coliform organisms and are responsible for performing biochemical metabolism to degrade organic matter and produce the nitrogen by releasing NO3− in water [55]. The coliform density in the ALMD during 2012 (206 CFU/100 mL) and 2013 (2127 CFU/100 mL) increased the presence of NO3− from 0.01 to 0.24 mg/L from 2012 to 2013 (Table 3).
3.4. Ecological Risk Index
The degree of pollution (Cd) of a substance is determined by calculating the pollution factor (Cif) for each heavy metal analyzed (Table 9). Subsequently, the potential ecological risk factor (Eri) was calculated to quantitatively express the temporal and spatial response of the ALMD by means of the Håkanson Ecological Risk Index (RIHAKANSON) (Table 10).
Each pollution factor (Cif) was multiplied by the toxic response (Tri) (Equations (6) and (7)) (Table 10). The average of the data concentrations show that: Hg (0.00019 mg/L) < Cd (0.0002 mg/L) < Pb (0.0015 mg/L) < Cr (0.0017 mg/L) < As (0.0020 mg/L) (Table 3). Temporal and spatial evaluation also showed that Hg was the heavy metal with the highest importance in the Ecological Risk Index (Hg = 0.0044 > Cd = 0.0012 > Cr = Pb = 0.0001 > As = 0.00086). Cr and Pb represent a major toxic (Tri) response between the heavy metals analyzed, their concentration in ALMD was low.
The result of Eri shows that there is a greater potential risk factor in 2013 than the ones observed in others years (2013 = 0.0881 > 2015 = 0.0390 > 2017 = 0.0245 > 2012 = 2016 = 0.0230). From a spatial point of view, the SP4 site presents a slightly lower value (0.0316) followed by SP1 (0.0326) < SP2 (0.0338) < SP3 (0.0550). However, the ecological risk potential of each substance was found below the “Low” classification (Eri < 40) in both evaluations (temporal and spatial assessment). The general Ecological Risk Potential Index (RIGENERAL) of the ALMD was 0.3742. The results obtained for heavy metals in ALMD reservoir are very low, and therefore the results have the lower category in the classification “low” (RI < 150). This classification represents very low threat for ALMD due to pollution caused by heavy metals.
4. Conclusions
In this study, the application of ecological indexes was carried out for obtaining a diagnosis in an integrated way about the water quality, trophic status, and the ecological risk for heavy metal pollution of the ALMD, a tropical reservoir with great agricultural importance in Mexico. This assessment was carried out from a spatial and temporal point of view that can be applied in other dams of the region, even in dams of other countries that present characteristics similar to those of the study area. The implementation of the indexes identified the most significant parameters, based on their importance for each model used. This type of applied methodology related to multiparametric integrative analysis helps as a global decision making tool, unlike non-multiparameter studies that only consider a part of the components that define water quality in reservoirs. According to the results, it was found that the ALMD reservoir presents a WQINSF–BROWN = 70, classifying the water quality of the reservoir as “medium”. This reservoir is affected mainly by the organic biodegradable material (BOD5), diffuse fecal contamination (FC), and dissolved particulate matter (TDS), which cause variations in water turbidity (Tur). The trophic state of ALMD reservoir is located in the category of “mesotrophic”, with a TSIGENERAL-AVERAGE = 43.04. The parameter that most affected the score of the TSI index was transparency, followed by chlorophyll-a and finally phosphorus as a limiting nutrient. Because the reservoir showed low concentrations of AS, Cd, Cr, Hg, and Pb, the ALMD did not present a potential ecological risk. Heavy metal concentrations found in the reservoir do not represent a negative effect or endanger the health of the reservoir. However, studies are also needed on the heavy metals accumulated in the sediments in order to discard the ecological risk in a broader way. Finally, based on the results obtained in this study, it was concluded that the water of the ALMD is suitable for agricultural use.
Author Contributions
Investigation, A.Q.-C. and Y.B.-T.; Supervision, E.B.; Writing—Original draft, J.L.L.; Writing—Review & Editing, J.G.R.-P.
Funding
This research received no external funding.
Acknowledgments
This work was supported by CONACYT project (Cátedras CONACYT 2014 Ref. 2572). Authors would like to thank CONAGUA for the collaboration.
Conflicts of Interest
The authors declare no conflict of interest.
References
- Ashinyani, N.; Suryanarayana, T.M. Assement of groundwater quality using GWQI method—A case study of Nadiad Taluka, Gujarat, India. In Proceedings of the Hydro 2015 International, 20th International Conference on Hydraulics, Water Resources and River Engineering, Hydro, Roorkee, India, 17–19 December 2015. [Google Scholar]
- Yu, S.; Xu, Z.; Wu, W.; Zuo, D. Effect of land use types on stream water quality under seasonalvariation and topographic characteristics in the Wei River basin, China. Ecol. Indic. 2016, 60, 202–212. [Google Scholar] [CrossRef]
- Vidhya, V.; John, M.; Mario, S. Does river restoration affect diurnal and seasonal changes to surface water quality? A study along the Thur River, Switzerland. Sci. Total Environ. 2015, 532, 91–102. [Google Scholar]
- Metcalfe, C.D.; Metcalfe, T.L.; Beddows, P.A.; Bouchot, G.G.; Li, H.; Van Lavieren, H. Contaminants in the coastal karst aquifer system along the Caribbean coast of the Yucatan peninsula, Mexico. Environ. Pollut. 2011, 159, 991–997. [Google Scholar] [CrossRef] [PubMed]
- Grill, G.; Ouellet Dallaire, C.; Fluet Chouinard, E.; Sindorf, N.; Lehner, B. Development of new indicators to evaluate river fragmentation and flow regulation at large scales: A case study for the Mekong river basin. Ecol. Indic. 2014, 45, 148–159. [Google Scholar] [CrossRef]
- Dimas, A.; Hinojosa, A.; Oller, P. Prefacio. In Boletín de la Sociedad Geológica Mexicana, Abril; Sociedad Geológica Mexican: Distrito Federa, Mexico, 2011; Volume 63, pp. i–ii. [Google Scholar]
- Cuthbertson, A.; Newkirk, C.; Llardo, J.; Loveridge, S.; Skidmore, M. Angry, Scared, and Unsure: Mental Health Consequences of Contaminated Water in Flint. J. Urban Health 2016, 93, 899–908. [Google Scholar] [CrossRef]
- Guillén, V.; Teck, H.; Kohlmann, B.; Yeomans, J. Microorganismos como bioindicadores de la Calidad del Agua. Tierra Trop. Sostenibilidad Ambiente y Sociedad 2012, 8, 65–93. [Google Scholar]
- Wu, Z.; Zhang, D.; Cai, Y.; Wang, X.; Zhang, L.; Chen, Y. Water quality assessment based on the water quality index method in Lake Poyang: The largest freshwater lake in China. Sci. Rep. 2017, 7, 17999. [Google Scholar] [CrossRef] [Green Version]
- Sharma, S.; Chhipa, R. Evaluation and Optimization of Water Quality Index for Ground Water Sourse of North West Jaipur and Agglomerates. Int. J. Chem. Sci. 2012, 10, 2297–2305. [Google Scholar]
- Li, W.; Gao, L.; Shi, Y.; Wang, Y.; Liu, J.; Cai, Y. Spatial distribution, temporal variation and risks of parabens and their chlorinated derivatives in urban surface water in Beijing, China. Sci. Total Environ. 2016, 539, 262–270. [Google Scholar] [CrossRef] [Green Version]
- Misaghi, F.; Delgosha, F.; Razzaghmanesh, M.; Myers, B. Introducing a water quality index for assessing water for irrigation purposes: A case study of the ghezel ozan river. Sci. Total Environ. 2017, 589, 107–116. [Google Scholar] [CrossRef]
- Bhadra, A.K.; Sahu, B.; Rout, S.P. Evaluation of the water quality index in river brahmani, odisha in the light of national sanitation foundation (NSF) standards. Asian J. Res. Chem. 2014, 7, 586–592. [Google Scholar]
- Simões, F.; Moreira, A.B.; Bisinoti, M.C.; Gimenez, S.M.; Yabe, M.J. Water quality index as a simple indicator of aquaculture effects on aquatic bodies. Ecol. Indic. 2008, 8, 476–484. [Google Scholar] [CrossRef]
- Behar, R.; Zúñiga de Cardozo, M.; Rojas, O. Análisis y Valoración del Índice de Calidad de Agua (ICA) de la NSF: Caso Ríos Cali y Meléndez. Ingeniería y Competitividad 1997, 1, 17–27. [Google Scholar]
- Liu, W.; Zhao, E.; Kuo, Y.; Jang, C. Identifying the relationships between trophic states and their driving factors in the Shihmen reservoir, Taiwan. Limnologica 2017, 64, 38–45. [Google Scholar] [CrossRef]
- De Freitas, P.; Reis Sousa, M.; Porfírio, A.F.; Almeida, B.S.; Furtado, R.; Santaella, S.T. Preliminary analysis on the use of trophic state indexes in a brazilian semiarid reservoir. Biol. Sci. 2015, 37, 309–318. [Google Scholar]
- Cañedo-Argüelles, M.; Rieradevall, M.; Farrés-Corell, R.; Newton, A. Annual characterisation of four mediterranean coastal lagoons subjected to intense human activity. Estuar. Coast. Shelf Sci. 2012, 114, 59–69. [Google Scholar] [CrossRef]
- Håkanson, L. An ecological risk index for aquatic pollution control. A sedimentological approach. Water Res. 1979, 14, 975–1001. [Google Scholar] [CrossRef]
- Wang, N.; Wang, A.; Kong, L.; He, M. Calculation and application of sb toxicity coefficient for potential ecological risk assessment. Sci. Total Environ. 2018, 610–611, 167–174. [Google Scholar] [CrossRef] [PubMed]
- Zhang, W.; Jin, X.; Liu, D.; Lang, C.; Shan, B. Temporal and spatial variation of nitrogen and phosphorus and eutrophication assessment for a typical arid river—Fuyang river in northern China. J. Environ. Sci. 2017, 55, 41–48. [Google Scholar] [CrossRef] [PubMed]
- Zhang, Y.; Yongqiang, Z.; Kun, S.; Qin, B.; Yao, X.; Zhang, Y. Optical properties and composition changes in chromophoric dissolved organic matter along trophic gradients: Implications for monitoring and assessing lake eutrophication. Water Res. 2018, 131, 255–263. [Google Scholar] [CrossRef]
- Liu, Y.; Wang, M.; Wang, Q.; Zhuang, W.; Yuan, Y.; Yuan, Y.; Jiao, K.; Chen, Q. Calculation of Thallium’s toxicity coefficient in the potential ecological risk index: A case study. Chemosphere 2018, 194, 562–569. [Google Scholar] [CrossRef] [PubMed]
- Zhang, L.; Liu, J. Relationships between ecological risk indices for metals and benthic communities metrics in a macrophyte-dominated lake. Ecol. Indic. 2014, 40, 162–174. [Google Scholar] [CrossRef]
- Comisión Nacional del Agua (CONAGUA). Estadísticas del agua en México. Secretaria de Medio Ambiente y Recursos Naturales (SEMARNAT), México; Comisión Nacional del Agua (CONAGUA): Mexico City, Mexico, 2016.
- CONABIO. Cuenca Alta de los Ríos Culiacán y Humaya. Available online: http://www.conabio.gob.mx/conocimiento/regionalizacion/doctos/rhp_020.html (accessed on 15 March 2017).
- APHA. Standard Methods for the Examination of Water and Wastewater; APHA: Washington, DC, USA, 1992. [Google Scholar]
- Brown, R.M.; Mcclelland, N.; Deininger, R.A.; Tozer, R. A Water Quality Index—Do We Dare. In Proceedings of the National Symposium on Data and Instrumentation for Water Quality Management, Conference of State Sanitary Engineers and Wisconsin University, Madison, WI, USA, 21–23 July 1970; pp. 364–383. [Google Scholar]
- Khan, F.A.; Ansari, A. Eutrophication: An ecological vision. Bot. Rev. 2005, 71, 449–482. [Google Scholar] [CrossRef]
- López, M.; Madroñero, S. Estado trófico de un lago tropical de alta montaña: Caso laguna de La Cocha. Ciencia e Ingeniería Neogranadina 2015, 25, 21–42. [Google Scholar] [CrossRef]
- Wurzburger, N.; Wright, S.J. Fine-root responses to fertilization reveal multiple nutrient limitation in a lowland tropical forest. Ecology 2015, 96, 2137–2146. [Google Scholar] [CrossRef] [PubMed] [Green Version]
- Maavara, T.; Parsons, C.T.; Ridenour, C.; Stojanovic, S.; Dürr, H.H.; Powley, H.R.; Cappellen, P.V. Global phosphorus retention by river damming. Proc. Natl. Acad. Sci. USA 2015, 112, 15603–15608. [Google Scholar] [CrossRef] [PubMed]
- Munyati, C. A spatial analysis of eutrophication in dam reservoir water on the Molopo River at Mafikeng, South Africa. Sustain. Water Qual. Ecol. 2015, 6, 31–39. [Google Scholar] [CrossRef]
- Carlson, R.E. A trophic state index for lakes. Limnol. Oceanogr. 1974, 23, 361–369. [Google Scholar]
- Akin, B.S.; Kırmızıgül, O. Heavy metal contamination in surface sediments of Gökçekaya dam lake, Eskişehir, Turkey. Environ. Earth Sci. 2017, 76, 402. [Google Scholar] [CrossRef]
- López, E.; Barceló, I.; Solís, H.; Laure, A.; Avila, P.; Martínez-Delgadillo, S. Calculation of the Ecological Risk Index in the José Antonio Alzate Dam, State of Mexico, Mexico. Biol. Trace Elem. Res. 2009, 135, 121–135. [Google Scholar] [CrossRef]
- Kutlu, B. Dissemination of heavy-metal contamination in surface sediments of the uzunçayır dam lake, tunceli, Turkey. Hum. Ecol. Risk Assess. 2018, 24, 2182–2194. [Google Scholar] [CrossRef]
- Kükrer, S.; Erginal, A.E.; Şeker, S.; Karabıyıkoğlu, M. Distribution and environmental risk evaluation of heavy metal in core sediments from lake çıldır (NE Turkey). Environ. Monit. Assess. 2015, 187, 453. [Google Scholar] [CrossRef] [PubMed]
- USEPA. United States Environmental Protection Agency Understanding Variation in Partitioncoefficient, Kd, Values. Volume I: The Kd Model, Methods of Measurement, and Application of Chemical Reaction Codes; EPA: Washington, DC, USA, 1999.
- Cheng, Y.; Li, Y.; Ji, F.; Wang, Y. Global sensitivity analysis of a water quality model in the three gorges reservoir. Water. 2018, 10, 153. [Google Scholar] [CrossRef]
- Mahato, M.K.; Singh, G.; Singh, P.K.; Singh, A.K.; Tiwari, A.K. Assessment of mine water quality using heavy metal pollution index in a coal mining area of Damodar river basin, India. Bull. Environ. Contam. Toxicol. 2017, 99, 54–61. [Google Scholar] [CrossRef] [PubMed]
- Akköz, C. The determination of some pollution parameters, water quality and heavy metal concentrations of Aci lake (Karapinar/Konya, Turkey). Transylv. Rev. Syst. Ecol. Res. 2017, 19, 1–18. [Google Scholar] [CrossRef]
- Wu, Z.; Wang, X.; Chen, Y.; Cai, Y.; Deng, J. Assessing river water quality using water quality index in lake taihu basin, China. Sci. Total Env. 2018, 612, 914–922. [Google Scholar] [CrossRef] [PubMed]
- Bao, K.; Liu, J.; You, X.; Shi, X.; Meng, B. A new comprehensive ecological risk index for risk assessment on luanhe river, china. Environ. Geochem. Hlth. 2018, 40, 1965–1978. [Google Scholar] [CrossRef]
- Dereli, H.; Dinçtürk, E. Population structure and some growth properties of Gibel carp (Carassius Gibelio) in a mesotrophic lake. Not. Sci. Biol. 2016, 8, 286–291. [Google Scholar] [CrossRef]
- Ewaid, S.H.; Abed, S.A. Water Quality Index for Al-Gharraf River, Southern Iraq. Egypt. J. Aquat. Res. 2017, 43, 117–122. [Google Scholar] [CrossRef]
- Jazzar, S.; Berrejeb, N.; Messaoud, C.; Marzouki, M.N.; Smaali, I. Growth parameters, photosynthetic performance, and biochemical characterization of newly isolated green microalgae in response to culture condition variations. Appl. Biochem. Biotechnol. 2016, 179, 1290–1308. [Google Scholar] [CrossRef]
- Carbajal-Hernández, J.J.; Sánchez-Fernández, L.P.; Villa-Vargas, L.A.; Carrasco-Ochoa, J.A.; Martínez-Trinidad, J.F. Water quality assessment in shrimp culture using an analytical hierarchical process. Ecol. Indic. 2013, 29, 148–158. [Google Scholar] [CrossRef]
- Chapman, D. Water Quality Assessments. A Guide to the Use of Biota, Sediments and Water in Environmental Monitoring, 2nd ed.; Chapman and Hall: London, UK, 1996. [Google Scholar]
- Thongtha, K.; Kasemsuwan, J. Numerical simulations of water quality measurement model in an opened-closed reservoir with contaminant removal mechanism. Int. J. Differ. Equ. 2018, 2018, 1343541. [Google Scholar] [CrossRef]
- Moreno, A.; Ramírez, J.J. Variación temporal de la condición trófica del lago Parque Norte, Medellín (Antioquia), Colombia. Actual. Biol. 2010, 32, 75–87. [Google Scholar]
- Santos, S.A.; dos Santos, T.R.; Furtado, M.S.; Henry, R.; Ferragut, C. Periphyton nutrient content, biomass and algal community on artificial substrate: Response to experimental nutrient enrichment and the effect of its interruption in a tropical reservoir. Limnology 2018, 19, 209–218. [Google Scholar] [CrossRef]
- Reimers, J.R.; Cai, Z.; Kobayashi, R.; Rätsep, M.; Freiberg, A.; Krausz, E. Formation of water-chlorophyll clusters in dilute samples of chlorophyll-a in ether at low temperature. Phys. Chem. Chem. Phys. Pccp. 2014, 16, 2323–2330. [Google Scholar] [CrossRef] [PubMed]
- Bachmann, R.W.; Hoyer, M.V.; Croteau, A.C.; Canfield, D.E., Jr. Factors related to secchi depths and their stability over time as determined from a probability sample of US lakes. Environ. Monit. Assess. 2017, 189, 206. [Google Scholar] [CrossRef]
- Rodriguez, S.; Gauna, L.; Martinez, G.; Acevedo, H.; Romero, C. Nitrate and Bacterial Contamination in Water. Tierra Latinoam. 2012, 30, 2018120335. [Google Scholar]
Figure 1.
Sampling points of the Adolfo López Mateos Reservoir (ALMD).


Table 1.
Water quality variables used in the National Sanitation Foundation–Brown Water Quality Index (WQINSF–BROWN) calculation.
Table 1.
Water quality variables used in the National Sanitation Foundation–Brown Water Quality Index (WQINSF–BROWN) calculation.
| Parameter | Units | Weight (wi) |
|---|---|---|
| FC | * CFU/100 mL | 0.15 |
| pH | pH units | 0.12 |
| BOD5 | mg/L | 0.1 |
| NO3− | mg/L | 0.1 |
| PO4− | mg/L | 0.1 |
| Tem | °C | 0.1 |
| Tur | ** NTU | 0.08 |
| TDS | mg/L | 0.08 |
| DO | mg/L | 0.17 |
FC: fecal coliforms; BOD5: biochemical oxygen demand; NO3: nitrates; PO4−: phosphates; pH: hydrogen potential; DO: dissolved oxygen; TDS: total dissolved solids; Tem: temperature; Tur: turbidity. * Colony forming unit (CFU), ** Nephelometric Turbidity Unit (NTU).
Table 2.
Rating scale for Eri and the Håkanson Ecological Risk Index (RIHAKANSON).
| Eri | Potential Ecological Risk for Substance |
| <39 | Low |
| 40–79 | Moderate |
| 80–159 | Considerable |
| 160–319 | High |
| >320 | Very high |
| RIHAKANSON | Ecological Risk for Lake/Basin |
| <149 | Low |
| 150–299 | Moderate |
| 300–599 | Considerable |
| >600 | Very high |
Table 3.
Parameters of water quality used in the ecological risk assessment (ERA).
| Ecological Indexes | Parameter | Units | Temporal Variation Average | Spatial Variation Average | Mean | Max Value | Min Value | Standard Deviation | ||||||||
|---|---|---|---|---|---|---|---|---|---|---|---|---|---|---|---|---|
| 2012 | 2013 | 2014 | 2015 | 2016 | 2017 | SP1 | SP2 | SP3 | SP4 | |||||||
| WQINSF–BROWN | FC | CFU/100 mL | 206 | 2127 | 221 | 598 | 127 | 992 | 729 | 661 | 851 | 759 | 834 | 5794 | 1 | 1275.5 |
| pH | pH units | 7.58 | 7.37 | 7.76 | 7.71 | 8.26 | 9.25 | 8.05 | 7.98 | 8.07 | 8.01 | 7.91 | 9.5 | 7.07 | 0.62 | |
| BOD5 | mg/L | 6.02 | 2.66 | 5.38 | 3.03 | 2.0 | 3.46 | 3.63 | 3.64 | 3.53 | 3.43 | 3.45 | 9.7 | 2 | 2.3 | |
| NO3− | mg/L | 0.01 | 0.24 | 0.04 | 0.02 | 0.01 | 0.02 | 0.07 | 0.07 | 0.04 | 0.07 | 0.06 | 0.59 | 0.001 | 0.15 | |
| PO4− | mg/L | 0.04 | 0.03 | 0.02 | 0.03 | 0.01 | 0.02 | 0.03 | 0.03 | 0.02 | 0.02 | 0.02 | 0.09 | 0.001 | 0.02 | |
| Tem | °C | 32.4 | 31.2 | 29.1 | 28.8 | 30.7 | 29.2 | 29.9 | 30.1 | 29.8 | 30.1 | 29.69 | 33.8 | 24.5 | 2.73 | |
| Tur | NTU | 2.1 | 22.1 | 1.8 | 1.6 | 2.2 | 3.3 | 6.5 | 8.9 | 2.5 | 5.4 | 6.31 | 74 | 0.88 | 13.10 | |
| TDS | mg/L | 119 | 117 | 147 | 97 | 109 | 101 | 119 | 116 | 111 | 115 | 115 | 156 | 82 | 21.45 | |
| DO | mg/L | 3.65 | 5.07 | 7.28 | 6.77 | 9.63 | 9.90 | 7.50 | 7.20 | 7.54 | 7.22 | 7.3 | 12.1 | 2.93 | 2.62 | |
| TSICARLSON | Chla | mg/m3 | 2.4 | 18.1 | 4.03 | 12.7 | 4.2 | 3.5 | 8.5 | 7.62 | 11.3 | 6.07 | 9.2 | 37.3 | 0.05 | 9.5 |
| Tra | m | 2.4 | 0.63 | 1.8 | 2.7 | 1.12 | 1.39 | 1.51 | 1.65 | 1.71 | 1.62 | 1.6 | 3.4 | 0.4 | 0.86 | |
| TP | mg/L | 0.07 | 0.25 | 0.06 | 0.08 | 0.10 | 0.04 | 0.10 | 0.11 | 0.09 | 0.11 | 0.11 | 0.52 | 0.02 | 0.12 | |
| RIHÅKANSON | As | mg/L | 0.0014 | 0.0028 | 0.0023 | 0.0014 | 0.0014 | 0.0036 | 0.0014 | 0.0032 | 0.0014 | 0.0022 | 0.0020 | 0.0127 | 0.0014 | 0.0024 |
| Cd | mg/L | 0.0002 | 0.0002 | 0.0002 | 0.0002 | 0.0002 | 0.0002 | 0.0002 | 0.0002 | 0.0002 | 0.0002 | 0.0002 | 0.0002 | 0.0002 | 1.37 × 10⁻¹⁹ | |
| Cr | mg/L | 0.0003 | 0.0067 | 0.0003 | 0.0003 | 0.0011 | 0.0003 | 0.0014 | 0.00153 | 0.00181 | 0.0022 | 0.0017 | 0.0154 | 0.0003 | 0.0037 | |
| Hg | mg/L | 0.0001 | 0.0005 | 0.0001 | 0.0002 | 0.0001 | 0.0001 | 0.00016 | 0.00016 | 0.0003 | 0.00015 | 0.00019 | 0.0013 | 0.0001 | 0.00025 | |
| Pb | mg/L | 0.0015 | 0.0015 | 0.0015 | 0.0015 | 0.0015 | 0.0015 | 0.0015 | 0.0015 | 0.0015 | 0.0015 | 0.0015 | 0.0015 | 0.0015 | 8.78 × 10⁻¹⁹ | |
Table 4.
Pearson correlation matrix for water quality parameters.
| Parameter | Chla | Tra | TP | FC | BOD5 | NO3− | pH | TDS | DO | PO4− | Tur |
|---|---|---|---|---|---|---|---|---|---|---|---|
| Tra | −0.0714 | ||||||||||
| TP | 0.1035 | −0.3557 | |||||||||
| FC | 0.1865 | −0.4641 | 0.5241 | ||||||||
| BOD5 | −0.0096 | 0.3272 | −0.1678 | −0.1757 | |||||||
| NO3− | 0.1508 | −0.3848 | 0.89 | 0.6818 | −0.0806 | ||||||
| pH | −0.1622 | −0.2232 | −0.3966 | 0.0392 | −0.213 | −0.3271 | |||||
| TDS | −0.2484 | −0.0968 | −0.031 | −0.1798 | 0.2839 | 0.0908 | −0.3352 | ||||
| DO | −0.2632 | −0.1937 | −0.174 | −0.1482 | −0.1767 | −0.2293 | 0.7597 | −0.3385 | |||
| PO4− | 0.3632 | 0.3133 | 0.3395 | 0.1128 | 0.2151 | 0.4045 | −0.2635 | 0.0561 | −0.3643 | ||
| Tur | 0.1846 | −0.4621 | 0.7583 | 0.826 | −0.0798 | 0.8493 | −0.2597 | 0.0237 | −0.2985 | 0.2702 | |
| Tem | −0.1783 | −0.2145 | 0.1391 | −0.0985 | −0.3134 | 0.0526 | −0.3628 | 0.4309 | −0.4706 | −0.0406 | 0.0617 |
Table 5.
Determination of ICAvalue (Subi * Wi) by year.
| Year | Sub | Parameters | ||||||||
|---|---|---|---|---|---|---|---|---|---|---|
| FC | pH | BOD5 | NO3− | PO4− | Tem | Tur | TDS | DO | ||
| 2012 | Sub2012 | 83.89 | 100 | 30.12 | 100 | 100 | 10 | 94.48 | 65.47 | 17.42 |
| Sub2012 * wi | 12.58 | 12 | 3.01 | 10 | 10 | 1 | 7.56 | 5.24 | 2.96 | |
| 2013 | Sub2013 | 12.49 | 100 | 58.85 | 100 | 100 | 10 | 62.21 | 66.24 | 45.34 |
| Sub2013 * wi | 1.87 | 12 | 5.89 | 10 | 10 | 1 | 4.98 | 5.30 | 7.71 | |
| 2014 | Sub2014 | 82.65 | 100 | 34.22 | 100 | 100 | 10 | 96.8 | 56.65 | 77.56 |
| Sub2014 * wi | 12.40 | 12 | 3.42 | 10 | 10 | 1 | 7.74 | 4.53 | 13.19 | |
| 2015 | Sub2015 | 56.90 | 100 | 54.67 | 100 | 100 | 12.14 | 99.22 | 73.68 | 71.34 |
| Sub2015 * wi | 8.54 | 12 | 5.47 | 10 | 10 | 1.21 | 7.94 | 5.89 | 12.13 | |
| 2016 | Sub2016 | 90.78 | 87.38 | 67.12 | 100 | 100 | 10 | 93.26 | 69.08 | 96.81 |
| Sub2016 * wi | 13.62 | 10.49 | 6.71 | 10 | 10 | 1 | 7.46 | 5.53 | 16.46 | |
| 2017 | Sub2017 | 38.5 | 52.28 | 50.14 | 100 | 100 | 10 | 87.15 | 71.99 | 98.04 |
| Sub2017 * wi | 5.78 | 6.27 | 5.01 | 10 | 10 | 1 | 6.97 | 5.76 | 16.67 | |
Table 6.
Determination of WQIvalue (Subi * Wi) by sampling point (SP).
| SP | Parameters | |||||||||
|---|---|---|---|---|---|---|---|---|---|---|
| FC | pH | BOD5 | NO3− | PO4− | Tem | Tur | TDS | DO | ||
| SP1 | SubSP1 | 49.97 | 97.44 | 48.50 | 100.00 | 100.00 | 10.00 | 77.31 | 65.79 | 80.02 |
| SubSP1 * wi | 7.50 | 11.69 | 4.85 | 10.00 | 10.00 | 1.00 | 6.19 | 5.26 | 13.6 | |
| SP2 | SubSP2 | 53.42 | 100.00 | 48.50 | 100.00 | 100.00 | 10.00 | 73.11 | 66.81 | 76.64 |
| SubSP2 * wi | 8.01 | 12.00 | 4.85 | 10.00 | 10.00 | 1.00 | 5.85 | 5.35 | 13.03 | |
| SP3 | SubSP3 | 44.26 | 96.43 | 49.48 | 100.00 | 100.00 | 10.00 | 91.49 | 68.46 | 80.46 |
| SubSP3 * wi | 6.64 | 11.57 | 4.95 | 10.00 | 10.00 | 1.00 | 7.32 | 5.48 | 13.68 | |
| SP4 | SubSP4 | 48.51 | 100 | 52.32 | 100.00 | 100.00 | 10.00 | 78.77 | 67.12 | 76.05 |
| SubSP4 * wi | 7.28 | 12.00 | 5.23 | 10.00 | 10.00 | 1.00 | 6.30 | 5.37 | 12.93 | |
Table 7.
Temporal and spatial Trophic State Index (TSI) of the Adolfo López Mateos Reservoir (ALMD).
Table 7.
Temporal and spatial Trophic State Index (TSI) of the Adolfo López Mateos Reservoir (ALMD).
| Parameters | Temporal Variation | Spatial Variation | ||||||||
|---|---|---|---|---|---|---|---|---|---|---|
| 2012 | 2013 | 2014 | 2015 | 2016 | 2017 | SP1 | SP2 | SP3 | SP4 | |
| TSIChla | 39.53 | 59.01 | 44.27 | 55.60 | 44.69 | 42.93 | 51.65 | 50.53 | 54.44 | 48.29 |
| TSITra | 47.31 | 66.48 | 51.53 | 45.23 | 58.30 | 55.24 | 54.02 | 52.73 | 52.26 | 53.00 |
| TSITP | 22.38 | 40.31 | 19.68 | 24.53 | 26.88 | 14.54 | 27.46 | 28.52 | 26.37 | 28.01 |
| TSICARLSON | 36.41 | 55.27 | 38.50 | 41.79 | 43.29 | 37.57 | 44.37 | 43.92 | 44.36 | 43.10 |
| TSISPATIAL-AVERAGE | 43.94 | |||||||||
| TSITEMPORAL-AVERAGE | 42.14 | |||||||||
| TSIGENERAL-AVERAGE | 43.04 | |||||||||
Table 8.
Temporal and spatial evaluation of National Sanitation Foundation–Brown Water Quality Index (WQINSF–BROWN) in the ALMD.
Table 8.
Temporal and spatial evaluation of National Sanitation Foundation–Brown Water Quality Index (WQINSF–BROWN) in the ALMD.
| Parameters | Temporal Variation | Spatial Variation | ||||||||
|---|---|---|---|---|---|---|---|---|---|---|
| 2012 | 2013 | 2014 | 2015 | 2016 | 2017 | SP1 | SP2 | SP3 | SP4 | |
| FC | 12.58 | 1.87 | 12.40 | 8.54 | 13.62 | 5.78 | 7.50 | 8.01 | 6.64 | 7.28 |
| pH | 12 | 12 | 12 | 12 | 10.49 | 6.27 | 11.69 | 12 | 11.57 | 12 |
| BOD5 | 3.01 | 5.89 | 3.42 | 5.47 | 6.71 | 5.01 | 4.85 | 4.85 | 4.95 | 5.23 |
| NO3− | 10 | 10 | 10 | 10 | 10 | 10 | 10 | 10 | 10 | 10 |
| PO4− | 10 | 10 | 10 | 10 | 10 | 10 | 10 | 10 | 10 | 10 |
| Tem | 1 | 1 | 1 | 1.21 | 1 | 1 | 1 | 1 | 1 | 1 |
| Tur | 7.56 | 4.98 | 7.74 | 7.94 | 7.46 | 6.97 | 6.19 | 5.85 | 7.32 | 6.3 |
| TDS | 5.24 | 5.3 | 4.53 | 5.89 | 5.53 | 5.76 | 5.26 | 5.35 | 5.48 | 5.37 |
| DO | 2.96 | 7.71 | 13.19 | 12.13 | 16.46 | 16.67 | 13.60 | 13.03 | 13.68 | 12.93 |
| WQINSF–BROWN | 64 | 59 | 74 | 73 | 81 | 67 | 70 | 70 | 71 | 70 |
| WQISPATIAL-AVERAGE | 70 | |||||||||
| WQITEMPORAL-AVERAGE | 70 | |||||||||
| WQIGENERAL-AVERAGE | 70 | |||||||||
Table 9.
Determination of the Ecological Risk Index (ERI) in the ALMD.
| Parameter | Tri | Degree of Contamination (Cd) | ||
|---|---|---|---|---|
| Temporal (2012–2017) | Spatial (SP1-SP4) | General | ||
| As | 15 | 0.00086 | 0.00054 | 0.00140 |
| Cd | 1 | 0.0012 | 0.0008 | 0.0020 |
| Cr | 90 | 0.0001 | 0.00007 | 0.00017 |
| Hg | 0.25 | 0.0044 | 0.0030 | 0.0074 |
| Pb | 70 | 0.00012 | 0.00008 | 0.00021 |
Table 10.
Determination of Håkanson Ecological Risk Index (RIHAKANSON) in the ALMD.
| Parameter (Tri * Cif) | Temporal Variation | Spatial Variation | ||||||||
|---|---|---|---|---|---|---|---|---|---|---|
| 2012 | 2013 | 2014 | 2015 | 2016 | 2017 | SP1 | SP2 | SP3 | SP4 | |
| As | 0.0009 | 0.0018 | 0.0015 | 0.0009 | 0.0009 | 0.0024 | 0.0009 | 0.0021 | 0.0009 | 0.0014 |
| Cd | 0.0060 | 0.0060 | 0.0060 | 0.0060 | 0.0060 | 0.0060 | 0.0060 | 0.0060 | 0.0060 | 0.0060 |
| Cr | 0.000007 | 0.00014 | 0.000007 | 0.000007 | 0.00002 | 0.000007 | 0.00003 | 0.00001 | 0.00004 | 0.00005 |
| Hg | 0.016 | 0.08 | 0.016 | 0.032 | 0.016 | 0.016 | 0.0256 | 0.0256 | 0.048 | 0.024 |
| Pb | 0.0001 | 0.0001 | 0.0001 | 0.0001 | 0.0001 | 0.0001 | 0.0001 | 0.0001 | 0.0001 | 0.0001 |
| ∑Eri | 0.0230 | 0.0881 | 0.0236 | 0.0390 | 0.0230 | 0.0245 | 0.0326 | 0.0338 | 0.0550 | 0.0316 |
| RISPATIAL | 0.1530 | |||||||||
| RITEMPORAL | 0.2212 | |||||||||
| RIGENERAL | 0.3742 | |||||||||
© 2019 by the authors. Licensee MDPI, Basel, Switzerland. This article is an open access article distributed under the terms and conditions of the Creative Commons Attribution (CC BY) license (http://creativecommons.org/licenses/by/4.0/).
Share and Cite
MDPI and ACS Style
Quevedo-Castro, A.; Lopez, J.L.; Rangel-Peraza, J.G.; Bandala, E.; Bustos-Terrones, Y. Study of the Water Quality of a Tropical Reservoir. Environments 2019, 6, 7. https://doi.org/10.3390/environments6010007
AMA Style
Quevedo-Castro A, Lopez JL, Rangel-Peraza JG, Bandala E, Bustos-Terrones Y. Study of the Water Quality of a Tropical Reservoir. Environments. 2019; 6(1):7. https://doi.org/10.3390/environments6010007
Chicago/Turabian StyleQuevedo-Castro, Alberto, Jesús L. Lopez, Jesús Gabriel Rangel-Peraza, Erick Bandala, and Yaneth Bustos-Terrones. 2019. "Study of the Water Quality of a Tropical Reservoir" Environments 6, no. 1: 7. https://doi.org/10.3390/environments6010007
Note that from the first issue of 2016, this journal uses article numbers instead of page numbers. See further details here.