Article

Stabilisation of Ozone in Water for Microbial Disinfection

1
School of Computing, Engineering & Physical Sciences, University of the West of Scotland, Paisley PA1 2BE, UK
2
ACS Clothing, 6 Dovecote Road, Centralpark ML1 4GP, UK
3
School of Health & Life Sciences, University of the West of Scotland, Paisley PA1 2BE, UK
*
Author to whom correspondence should be addressed.
Environments 2022, 9(4), 45; https://doi.org/10.3390/environments9040045
Submission received: 26 February 2022 / Revised: 20 March 2022 / Accepted: 29 March 2022 / Published: 1 April 2022
(This article belongs to the Topic Sustainable Environmental Technologies)

Abstract

:
In current times of increasing global decontamination concerns, sustainable and environmentally-friendly technologies that possess rapid and effective disinfection capabilities are necessary for public health and safety. In this study, we evaluate the potential of ozone-based technology to reveal its immense potential in disinfection applications. Ozonated water generated by an electrolytic method was utilised to quantify ozone retention as a function of mineralogical composition for microbial decontamination. The impacts of temperature and detergent concentration on ozone concentration are critically analysed, as well as ozone’s decomposition and stain removal characteristics. In addition, fabric swatches inoculated with known concentrations of environmental microbes (Escherichia coli, Staphylococcus aureus, Candida albicans, and Aspergillus fumigatus) are washed with ozonated water to ascertain the impact of wash duration on bacterial removal efficiency. The results show significant improvement in the stability and retention potential of ozone in mineral water at low temperature and in the presence of a detergent. The experiments demonstrate first-order decomposition kinetics of ozone in aqueous formulations. The disinfection potency of ozone is also substantiated by a significant removal of microbiota on the fabric utilised (up to 7 log reduction for the bacteria analysed), thus making it effective for sterilisation applications. This also reduces the need for toxic chemicals or chemicals with toxic by-products (e.g., chlorine) for large-scale decontamination operations in various industries.

1. Introduction

Most industrial deployments of ozone are often connected to its antimicrobial properties and its ability to degenerate organic compounds via oxidation. Its rapid reactivity and non-selectivity to different classes of microorganisms are particularly advantageous for a diverse range of applications [1,2,3,4,5,6,7]. Compared to ozone, which does not form any long-term toxic byproducts, the use of chlorine (a widely used disinfectant) is associated with the production of carcinogenic byproducts, including trihalomethanes and haloacetic acids [8]. Furthermore, while ozone directly oxidises the constituents (such as proteins and amino acids) in cell walls and membranes of spores, chlorine is thought to initially diffuse into their cell protoplasm, through the cell wall before inactivating the enzymes [9,10,11], thus implying that a lower concentration and shorter contact time is required for their inactivation with ozone, compared to chlorine. This is mainly desirable in large-scale applications, where rapid processing and worker safety are primary concerns. The use of ozone in garment processing (particularly laundry systems) has received considerable attention over the past decade, given its potential for energy savings compared to conventional thermal laundry systems. Ozonated water production for laundry purposes is mainly generated by injecting ozone gas into water at a controlled pressure, followed by mechanical mixing/atomisation of the gas to ensure homogeneity. This is particularly important because of ozone’s low solubility in water—the solubility of ozone in aqueous solutions is 14 mmol/L at 20 °C and it is documented to be more soluble in hydrophobic organic solvents [12,13].
Rice et al. [14] describe four main techniques of applying this method of ozonated water generation in different laundry establishments. Ozonated water may also be produced by direct electrolysis, for instance, via a polymer electrolyte membrane. This process involves the electrolytic decomposition of water at the anode of the cell to produce ozone, which is then mixed with water [13]. Compared to the injection method, which requires separate ozone-generating and mixing equipment, the electrolysis method is more compact, as shown in Figure 1. Several studies which apply a variety of ozone generation methods have examined the inactivation kinetics of bacteria in ozone; dissolved molecular ozone has been found to be primarily responsible for bacterial inactivation [15,16,17]. The kinetics of decolourisation of reactive-dyed fabrics and the treatment of dyed textile effluents has also been extensively studied [18,19]. In addition, the cytocompatibility and biocidal action of ozonized water (at 4 °C and pH of 5) was recently demonstrated in the work of dos Santos et al. [20].
Despite the many documented successful applications of ozone washing mentioned in Rice et al. [14], Körlü [7], Neral [21], and the above-cited studies, a wholistic textile-related study that collectively explores the influence of water mineralogy on ozone retention, ozone’s thermal degradation kinetics, its stain-dependent (synthetic/solvent-based and natural) removal efficiency, and bacterial inactivation properties is scarce. No significant collective analysis of these parameters using fabric substrates has been carried out in the literature. In this paper, we address these gaps by providing insights into these key attributes. To achieve this, we apply the electrolytic method for ozonated water generation and quantify the ozone retention and disinfection characteristics under different processing conditions, necessary for improved large-scale laundry operations. Furthermore, it remains unclear if the use of ozonated water with a detergent in the washing phase of laundry operations provides additional benefit compared to its usage during the rinsing phase alone. The analysis of ozone stabilisation as a function of detergent concentrations presented in this work allows recommendations to be made in this regard. In addition, the disinfection efficiency of an ozonated wash is comparatively analysed with an ordinary wash using water only.

2. Materials and Methods

Figure 2 illustrates the setup for the experiments performed herein. An Electrolysis Oxygen Radical Generator (EORG™—Novus Clean Tech Ltd., Inverurie, UK) was employed for the generation of ozone using available oxygen molecules in water. The ozonated aqueous solutions were gently but continuously stirred during the ozone generation and decomposition phases to ensure mixture homogeneity. Rotation and temperature control were achieved using a magnetic stirrer equipped with a temperature probe and a controller; this allowed the specification of the desired temperature setpoint. Given ozone’s partial solubility in water, the tests were carried out in a fume cupboard to limit ozone exposure. The Palintest® procedure (subsequently described in Section 2.2) was utilised over others for ozone concentration measurements.

2.1. Ozone Concentration Measurement (Palintest®)

Palintest is a colorimetric ozone measurement method that depends on the intensity of colours produced by the Palintest reagent (N,N-diethyl-p-phenylenediamine, DPD No. 4 tablet) when using Palintest photometers. The test procedure quantifies the amount of coloured light (530 nm wavelength) absorbed by a sample in reference to an untreated sample (blank) and displays the corresponding ozone concentration using calibration data programmed into the instrument. The water samples tested were correspondingly used as the blank during measurements. The Palintest instrument applied in this study has a measuring range of 0.01–3 ppm and utilises a wavelength of 530 nm for ozone concentration measurement. Thus, where higher concentrations beyond the measuring limit were expected, 1 in 10 dilutions was performed, and the actual concentration was reconstituted using the dilution factor. When working with the detergent and mineral water mixtures in this study, the dilution was carried out using pure mineral water (i.e., 1 mL of ozonated detergent–mineral water mixture in 9 mL of mineral water). Palintest measurements (within the measuring range of the instrument) performed on samples without dilution, with 1 in 2 and with 1 in 10 dilutions, all gave similar readings within an error range of 3%.
It is worth mentioning that ozone concentration measurement is challenging. The reaction of organic compounds with ozone carbonyl groups may produce carboxylic acids, carbonyl groups, and peroxides; these, together with free chlorine or bromine in water, may interfere with ozone concentration measurements. Most of these effects can be mitigated using glycine tablets as carried out in this work [22]. Foam formation is also particularly challenging when aqueous solutions containing detergents are ozonated. These interferences usually exist, irrespective of the measurement technique employed. Firstly, bubbles formed when detergents are present tend to scatter UV light, and byproducts of ozonation may absorb UV radiation in the same region as ozone [10]. Titrimetric methods show significant sensitivity to pH, buffer concentration, and temperature; moreover, the fast decomposition rate of ozone also makes it difficult for near-real-time measurements to be obtained for kinetic studies.
Although electrometric methods are suitable for continuous data collection using ozone-specific electrodes, they suffer from relatively slow response time, pronounced sensitivity to stirring, and the need for frequent calibration. Furthermore, foam formation may affect the sensitivity of membrane electrodes. Other measurement techniques that utilise thermal conductivity, gas-phase titration, and isothermal pressure changes are not commonly used [7]. The indigo method, which utilises sulfonated indigo compounds, is also a common ozone-measuring technique but is usually adversely affected by the age and purity of the indigo-based compounds as well as the presence of the Mn+2 ion, which is capable of destabilising indigo trisulfonate [7,23]. Thus, the Palintest procedure (a widely applied and readily available ozone measurement procedure) sufficed for the measurements performed in this study. However, to further mitigate the effect of possible interferences, three independent runs were carried out for each measurement presented (with standard deviations reported throughout); gentle stirring and low detergent concentrations were also employed to minimise micelle formation. The wide density difference between any foam layer formed and the main liquid phase caused a clear separation, thus allowing for foam-free sample collection in the determination of ozone concentration during the Palintest procedure. All glassware and plasticware were sterilised before use to mitigate interferences in ozone concentration measurements from impurities (via intractable changes in ozone demand).

2.2. Water Characterisation

As it was desired to examine the ozone retention capabilities of different water samples, with varying mineralogical and ionic compositions, inductive coupled plasma (ICP) (Perkin Elmer (Waltham, MA, USA) Avio500 ICP-OES) was employed for the determination of metal compositions of the water samples, whereas Dionex ICS-1100 ion chromatography (Thermo Scientific, Waltham, MA, USA) was utilised for anion concentration measurements. The pH and conductivity of the water samples before ozonation were also measured and recorded using meters equipped with probes. These measurements were taken for all water samples utilised, including those containing a known mass of the applied detergent.
A commercial powder-based “Daz” detergent formulation (5–15% anionic surfactants, <5% non-ionic surfactants, phosphonates, polycarboxylates, zeolites, enzymes, optical brighteners, perfumes, citronellol, hexyl cinnamal, limonene) was applied in this study. Rather than a pure surfactant, this readily available detergent formulation was of particular interest to the authors, because of its applicability and prevalence in commercial laundry establishments in the UK. By applying a commercial detergent formulation, the adaptability of the obtained results in this work to industrial settings is demonstrated.

2.3. Preparation of Microorganisms

The preparation process of the bacteria (Escherichia coli NTCC1290, Staphylococcus aureus ATCC25923) applied in this study began by transferring a representative colony into 10 mL of Luria broth (Sigma Aldrich, St. Louis, MO, USA), and incubating in a shaker at 37 °C and 150 rpm for 24 h. A total of 1 mL of the bacteria suspension was subsequently transferred into a 1.5 mL microcentrifuge tube and centrifuged for 5 min at 10,000 rpm. This was followed by the washing of the harvested cells with ozone demand-free phosphate buffer saline (PBS) solution and the adjustment of the suspensions’ absorbance (at 570 nm) to an optical density (OD) of 0.2 (±0.02).
The preparation of the fungal inoculum (Candida albicans and Aspergillus fumigatus) involved growing them on ISP2 agar plates (International Streptomyces Project-2 Medium) for 48 h. A 1 cm × 1 cm section of the agar piece of each fungal culture was inoculated into 100 mL of ISP2 broth to prepare seed cultures of each species by shaking them for 48 h. This was followed by an adjustment of the optical density of the two-day-old seed cultures to an optical density of 0.2 (±0.02). Required volumes of the 0.2 OD bacterial and fungal suspensions were applied onto the sterilized fabric swatches aseptically, which were subsequently ozonated.

2.4. Disinfection

Square-shaped fabric swatches (6.5 cm by 6.5 cm) were first sterilised in 70 % (v/v) ethanol, autoclaved, and then air-dried. Using an Eppendorf pipette, the swatches were inoculated at their centres, on a sterile non-absorbent surface with 80 μL of prepared E. coli bacterial suspension (at an optical density of 0.2 at 570 nm, which is approximately 109 CFU/mL). A total of 80 μL of the suspension applied was sufficient for full coverage of the swatches’ surface area. Using sterile forceps, the inoculated swatches were transferred into 100 mL of ozonated water, and washed for varying durations, using the magnetic stirring system shown in Figure 2. After washing, the swatches were transferred onto a sterile surface, and dipslides (Dip-Slides, Glenrothes, UK) were placed onto the fabric surface with gentle pressure applied for 10 s. The slides were subsequently incubated at 37 °C for 24 and 48 h (bacteria and fungus, respectively). To also evaluate residual bacteria in the water used for washing, the agar regions of the slides were immersed in it for 10 s, after which they were also incubated. The slides contain a red spot dye—2,3,5-triphenyltetrazolium chloride (TTC), which allows the enumeration of microbial colonies in solid structure media [24]. The Colour Thresholder and Image Region Analyser toolboxes of MATLAB (R2020b) were applied to process the images of the dipslides and for the enumeration of the number of bacteria colonies. Section 3 shows pictures of the slides, tested on contaminated swatches before and after ozonated washing. The number of CFUs per cm2 of the dipslide agar area (5 cm by 2 cm → 10 cm2) was calculated according to Equation (1), where the corrected pick-up rate (CPUR) = 2. This correction factor is applied because approximately 50% of bacteria is picked up by the slide from a surface [25].
CFUs / cm 2 = Number   of   colonies   ×   CPUR Agar   area
The Miles and Misra method was also employed for the enumeration of bacteria count in the water after washing the fabric swatches. A sequential 1:10 dilution of bacterial suspension in water was made in 6 places. A total of 20 µL of each diluent was dropped in 3 places on sterile nutrient agar plates. The plates were allowed to dry for about 10 min, after which they were incubated at 37 °C overnight. An average of counts obtained from the three droplets was taken and expressed as Log10CFU/mL.

3. Results and Discussion

3.1. Impact of Water Composition on Ozone Retention

Different water samples were explored for their ozone-retention capabilities in this study. Tap water collected from ACS Clothing, a garment processing company in Motherwell, Scotland, was utilised in this study and is referred to as ACS water. Mineral water supplied by AquAid water coolers (Glasgow, UK) was also applied for generating ozonated water. Ultra-high-quality/purity (UHQ) and distilled water were also used. Table 1 shows the measured metallic and anionic distributions of ACS and mineral water, respectively. As expected, mineral water shows significantly higher ionic concentrations compared to ACS water, with calcium being the most dominant metal ion present.
This concentration distribution translates to the pH and conductivity values (Table 2), which yielded a better understanding of the water’s ozone retention capability. As observed in Table 2, the addition of salts and detergents inevitably increases the pH and conductivity of the solution. This presents some desirable effects in terms of ozone retention, as shown in Figure 3. Acero and von Gunten [26] and Eriksson [10] have reported bicarbonates to have both inhibition and promoting characteristics on ozone decomposition. According to Acero and von Gunten [26], carbonate radicals formed from the reaction of carbonates and OH radicals serve as chain carriers for increased ozone decomposition, whereas Eriksson [10] pointed out that, in the presence of other ions in solution, carbonate ions may prevent an increase in alkalinity, thus retarding ozone decomposition. Thus, it was of particular interest to investigate the existence of possible concentration thresholds (for our application) beyond which either of these positive or negative effects is observed. According to Table 1, sodium is the second-highest metal ion present in ACS water and was the most desirable metal to focus on as far as the metallic concentration and conductivity improvements are concerned. Carbonates of sodium also represent one of the most widely applied and studied compounds in terms of their interactions with water.
The relatively low toxicity of sodium bicarbonate compared to potassium carbonate and solubility relative to carbonates of calcium and magnesium also made it the preferred candidate for further exploration [27,28]. As observed in Figure 3, the application of 0.1 g of sodium bicarbonate improves the ozone concentration in solution by more than 200% (0.10 to 0.32 ppm). However, increasing the amount of Na2CO3 dissolved did not correspondingly increase the ozone concentration in the solution. It can be observed that the dissolution of 2 g of Na2CO3 (964.4 mg/L of Na) has an adverse effect (63% reduction) on ACS water, despite the 36% increase observed with 0.1 g Na2CO3 solution (48.2 mg/L of Na). The enhancement of ozone concentration via the addition of carbonate compounds may be attributed to its scavenging effect (its consumption of OH radicals, responsible for ozone decomposition to yield products that do not further react with ozone in solution) [29]. The results also demonstrate the existence of a critical ionic concentration, beyond which a negative impact on ozone retention ensues.
Compared to mineral water (the best performing sample), water samples void of ions (distilled and UHQ) do not facilitate ozone generation and retention. The lowest ozone concentrations were observed in the distilled and UHQ water samples. This is inevitably due to the decreased potential for electrolytic decomposition of water into adsorbed OH* and H* radicals required for ozone production [30]. For significant amounts of ozone to form in pure water, prolonged ozonation periods or a very large electric potential (>1.511 V) is required to initiate the autoionization of water. We also hypothesize that an increased concentration of the sodium carbonate salts (>>0.1 g/900 mL) in solution yields a high concentration of sodium ions, which may cause increased displacement of the ozone molecules in solution; the effect of this displacement increases with the presence of other ions in solution (UHQ vs. ACS water—Figure 3). Despite the ozone concentration increments (0.1 g/900 mL), it is worth mentioning that retention and stability of ozone may be negatively affected by weak alkalinity (pH 8–11) [10,31], which some of the water samples with Na2CO3 display (Table 2). Greenwood and Earnshaw [32] stated that this effect may be reversed in strongly alkaline solutions, via the formation of ozonide. Nonetheless, the results presented herein demonstrate that an added dimension to this complex relationship exists—that of water conductivity.

3.2. Effect of Detergent Concentration on Ozone Retention

Figure 4 shows the impact of the applied detergent on the obtained ozone concentration. Compared to pure mineral water, it can be observed that ozone concentration increases significantly with the addition of the detergent (up to three times its original value when 0.75 g of detergent is used). A possible reason for this increased concentration with detergent usage is the formation of micellar enclosures, and nanobubbles that trap ozone molecules (given their co-hydrophobicity) during ozonation. Furthermore, IR spectroscopy results from Bulanin et al. [33,34] and Ward et al. [12] have shown that ozone in aqueous solutions adsorbs onto the surface of zeolites (which are present in the detergent applied herein), thus stabilizing ozone concentration. Eriksson [10] studied the decomposition of ozone in aqueous solutions containing 0.1mM Dodecyl-β-d-Maltoside, DDM (a neutral/non-ionic surfactant) and observed nearly double the ozone concentration in comparison to a pure aqueous ozone solution after 18 min of decomposition. Sodium dodecyl sulphate, SDS (an anionic surfactant), and dodecyl tri-methyl ammonium acetate, DAA (a cationic surfactant), were also tested, with similar results obtained.
To confirm the absence of any colour interference by the DPD No. 4 tablets (used in our measurements) on the detergent solution, the tablets were dissolved in 10 mL of the detergent–mineral water mixtures (without ozone), as shown in Figure 4. No colour change was observed. Despite the presence of enzymes in the detergent, the 11 min ozonation time was sufficient to neutralise these organic compounds while allowing further ozone production and retention. As we demonstrate in subsequent sections of this paper, a duration of 5 min yielded 100% removal of E. coli in water.

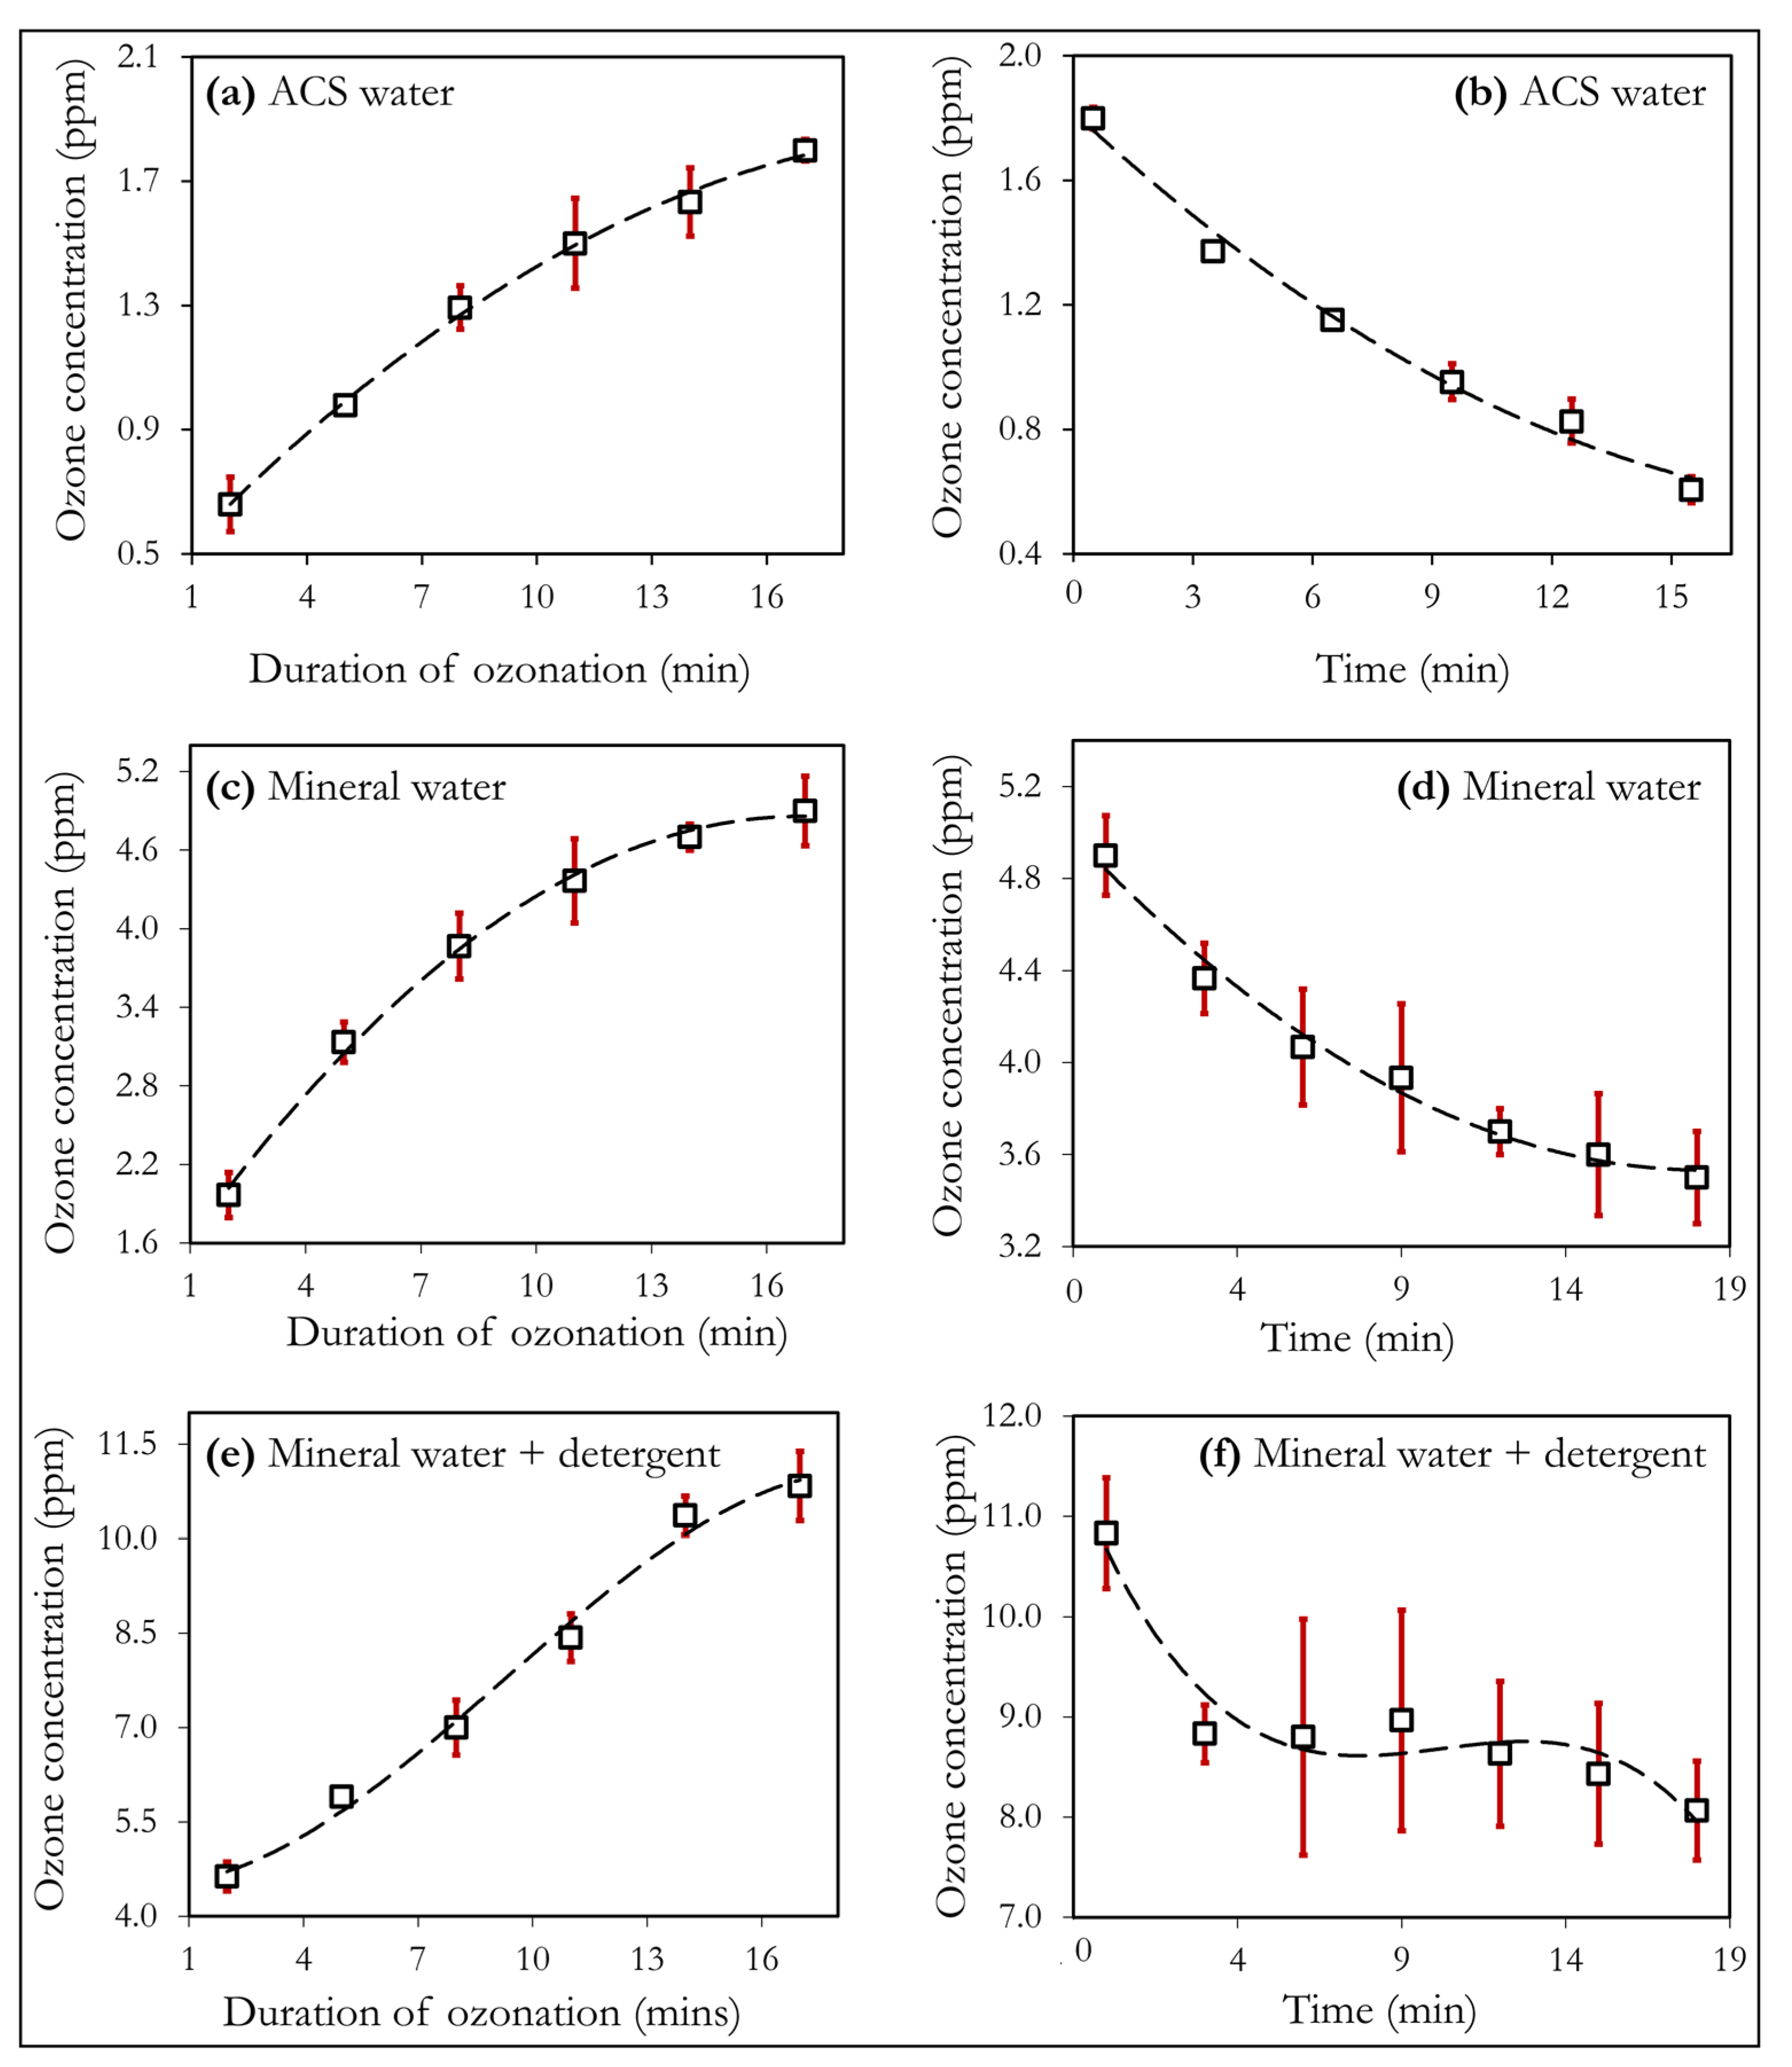
3.3. Kinetics of Ozone Generation and Decomposition in Different Water Types

The generation rates of ozone are shown in Figure 5a,c,e for ACS water, mineral water, and the detergent–mineral water mixture, respectively. Compared to ACS water, which showed potential to harbour more ozone with time (a steadily rising profile), the generation profiles of mineral water and the detergent–water mixture seemed to be approaching a saturation point. While it is important to retain produced ozone and increase the contact time, the time taken to attain the desired ozone concentration (in the interest of adequate disinfection) cannot be overlooked.
Thus, conventional 10 min washing or rinsing cycles may be insufficient to yield the desired disinfection levels when ordinary tap water (with low mineral content) is used, especially if the gas is bubbled through water rather than electrolytically produced. This also necessitates the modification of the water’s properties, for example, through the addition of salts, alkyl compounds, or acetic acid, which are capable of boosting ozone retention. Detergent concentrations (>>critical micelle concentration—CMC) utilised in commercial laundry processing industries are significantly higher than those explored in this work; this may adversely affect ozone’s availability in solution for disinfection via over-entrapment of the produced ozone or significantly increased biological material (enzymes) from the detergent, which reduce the available ozone in solution for disinfection; non-biological detergents may be utilised to mitigate the inactivation effects of ozone on the enzymes. Thus, there is a need to investigate the specific critical concentrations of required additives (e.g., detergents and carbonate salts) for the rapid boosting of ozone’s concentration, improving its stability and availability, using the water samples of interest. This is an important consideration when planning large-scale microbial decontamination processes.
Two popular decomposition mechanisms of aqueous ozone have been proposed by Hoigné–Staehelin–Bader (HSB) and Gordon–Tomiyasu–Fukutomi (GTF) [29,31,35]. Despite the differences in their reaction steps, they propose that the presence of OH* radicals initiates the reaction, subsequently forming superoxide (O2) and hydroxyl (HO) ions through a series of steps. These are the main ozone-consumption radicals, with rates of reaction between 1.6 × 10⁹ and 4.2 × 10⁹ M−1 s−1, according to the HSB and GTF mechanisms. Thus, the removal of these ions retards the decomposition rate. In addition, the lower the concentration of the main initiators—the OH radical, the slower the decomposition reaction, thus suggesting that alkaline solutions facilitate ozone decomposition. However, as demonstrated in Heidt and Landi [36] and Greenwood and Earnshaw [32], strongly alkaline solutions show the opposite behaviour.
The rates of ozone decomposition shown in Figure 5b,d,f are generally observed to be more rapid in the first 4 min, after which the rate reduces. Based on the HSB and GTF decomposition mechanisms, the faster decline in the first 4 min may be attributable to the presence of OH radicals, given the weak alkalinity of the solution (Table 2). As demonstrated in the work of Eriksson [10], this rapid drop in the first few minutes is not present due to the acidity of the aqueous solutions employed (pH = 5). Figure 5f illustrates that the decomposition profile is followed by an abrupt rise in ozone concentration in the 9th minute. Compounds containing alkyl groups (into which the surfactants in the detergents fall) are known inhibitors of ozone decomposition (radical scavengers). They do so via the consumption of HO radicals, which are primarily responsible for rapid ozone decomposition [29]. Some of these compounds are also capable of reforming ozone in solution and, thus, are good ozone stabilisers [10]. This is the likely reason for the profile observed in Figure 5f—the radical scavenging effect of detergent’s alkyl compounds. Furthermore, the generated foam (via the action of the detergent) forms a dense thick top layer, leaving a clearer solution beneath. This layer may have also contributed to the entrapment of ozone in solution, thus reducing its removal rate.
The ozone decomposition profiles of ACS and mineral water both strongly follow first-order kinetics, as shown in Figure 6a,b, with mineral water showing a significantly longer half-life compared to ACS water. This indicates the increased ozone retention, brought about by an increase in water’s mineral content. With the detergent–mineral water mixture (Figure 6c), the coefficient of correlation (the R2 value) is affected by the presence of surfactants and possible ozone regeneration; the longer half-life can be attributed to the stabilising effects of the detergent on ozone concentration, and the thick foam layer on top of the solution. The presence of nanobubbles in solution also has a stabilising effect.

3.4. Effect of Temperature on Ozone Retention

Since mineral water was most effective in ozone retention, it was used to analyse the effect of temperature. As observed in Figure 7, decreasing the temperature of the solution aids the production of ozone in mineral water. A possible explanation for ozone’s decomposition resistance at low temperatures is the resonance stability that the molecule possesses [37]. Furthermore, its reactivity increases significantly at high temperatures, causing a reduction in its stability. Thus, the benefits of ozonated washing (in terms of improved stability) are better experienced at low temperatures. The electrical costs involved with the large-scale production and maintenance of ozone at a desired concentration may increase if the process temperature is unfavourably high. Besides ozone’s disinfection capabilities, one of the main incentives for its adoption in the textile processing industry is the reduced energy cost expended in raising the temperature of large volumes of water by approximately 30–40 °C during conventional washing cycles; high-temperature washes are conventionally applied to destroy bacteria in garments. Low-temperature wash cycles can be performed for cleaning purposes only, while ozone may be applied separately in the rinsing phase for garment disinfection. Additionally, ozone may be utilised in the low-temperature wash cycle along with a detergent for improved benefits (higher concentrations and better stability).

3.5. Stain Removal Efficacy of Ozonated Washing

To evaluate the stain removal efficiency of ozone, two stain types were investigated; firstly, a mixture of blue food colouring (containing glycerine, water, spirulina concentrate, and citric acid), sunflower oil, and turmeric powder (BCSOT) was applied to a fabric swatch. The second stain utilised was a solvent-based, red-coloured temporary board marker ink (RTBM). The fabric swatches were stained and stored for a duration of 48 h to allow sufficient bonding to the fabric fibres. Figure 8 shows the stained swatch areas before washing was carried out, and the extent of stain removal after washing and drying the fabric.
As observed with the BCSOT stain (Figure 8a), there are three layers; the outer/bigger blue food colouring, followed by the oil stain, and then the central core yellow stain caused by the turmeric powder. Washing with water alone removes most of the food colouring but does not break down the oil stain marked by the dotted line. With the detergent only, ozone only, and ozone + detergent scenarios (Figure 8b–e), the food colouring is completely removed. The oil stain, however, proved more difficult for the ozone only wash, compared to the detergent only and ozone + detergent wash. This is evidently attributable to the action of the surfactants in the detergent. More importantly, the core yellow turmeric stain on the fabric proved difficult for all wash types, except with the ozone + detergent wash, where a bleaching effect can be faintly seen qualitatively (Figure 8e) and more evidently (Figure 8k). The RTBM stain on the other hand also proved tough for ozone, and the detergent only scenario was the best-performing (83.4% removal), as shown in Figure 8l. The increased colour removal percentages of the BSCOT scenarios in comparison to the RTBM (Figure 8k,l) are attributable to the disappearance of the blue colouring stain in virtually all wash scenarios. These results demonstrate the combined potential of ozone and a detergent to enhance stain removal on fabric swatches; however, this efficiency is stain-composition-dependent.

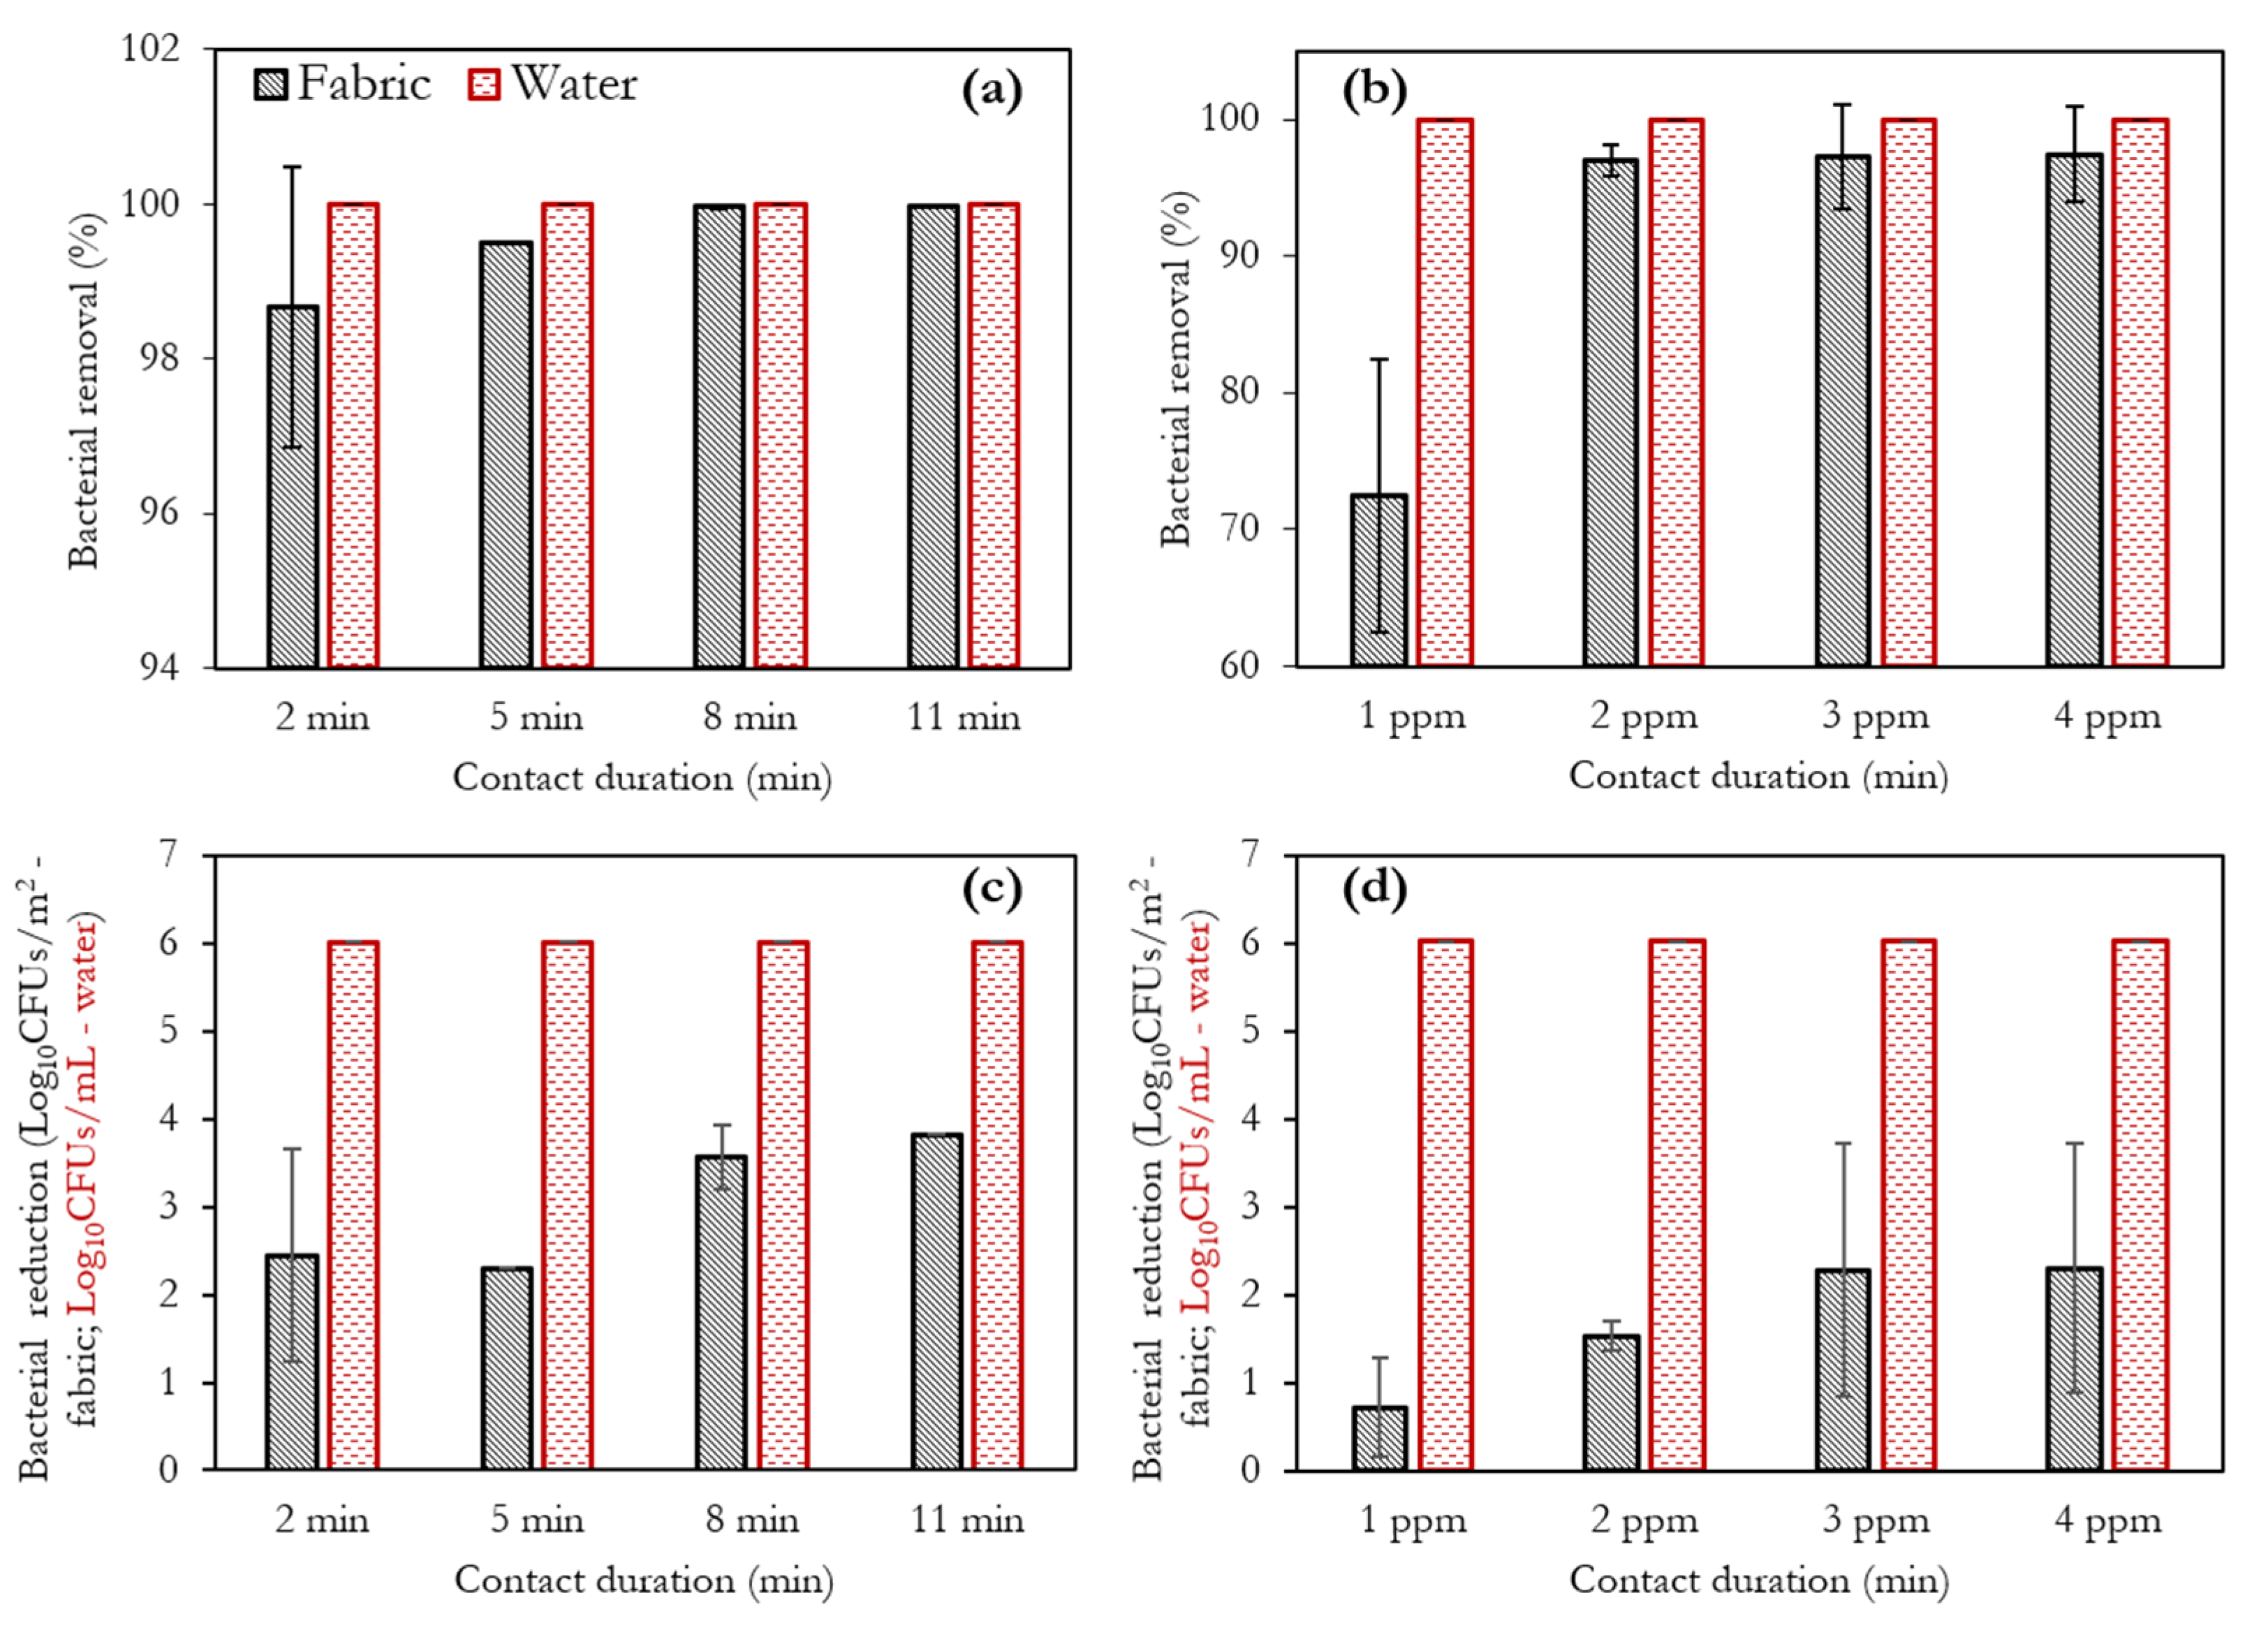
3.6. Analysis of Bacteria Concentration

To evaluate the attainable disinfection level with ozone, it was important to first evaluate the performance of the dipslides used in this study. The fabric samples to be disinfected were originally inoculated with different volumes of bacterial suspension (109 CFUs/mL of E. coli), as shown in Figure 9, and the dipslides were applied to obtain the bacterial count. The bacteria population recovered from the swatch via the dipslides was found to increase with increasing inoculum volumes of the same concentration. A similar observation was made when the respective volumes of bacterial suspension (10, 25, 40, 65, 80, and 100 µL), were individually dissolved in 100 mL of sterile distilled water. For E. coli, it can be observed that the contamination levels observed upon applying 100 mL of the suspension are similar (Figure 9d). This observation was similar for all organisms utilised in this work.
By applying the dipslides into the contaminated microbial solutions, the number of CFUs/mL of solution was also obtained. Besides the application of the dipslides, the Miles and Misra method [38] was also employed to enumerate the residual bacteria in the water used in washing the fabric, and both methods yielded consistent results. To enumerate the fungal removal/reduction efficiency of ozone, the dipslides were also applied; however, rather than counting the number of formed colonies, the area fraction of the contaminated slide was evaluated using MATLAB (R2020b). For the disinfection results presented next, the fabric swatches were inoculated with 100 µL of the respective organisms. This volume was sufficient to cover the entire swatch (6.5 cm by 6.5 cm), which was, in turn, able to accommodate the full area of the dipslide (5 cm by 2 cm), via three separate applications. This high microbial concentration was tested to prove the disinfection efficiency of ozone in very harsh aqueous conditions.
Before washing with ozonated water, the contaminated fabric swatches (inoculated with 100 mL of microbial suspension) were washed in ordinary mineral water, and the dipslides were used to test for the residual bacteria in the water and on the fabric swatch. Upon testing the fabric swatch, there was no apparent reduction in the contamination level of the swatch after washing with ordinary water, relative to the contamination level before the wash. This was observed for all organisms tested. Upon applying the dipslide in the water (after taking out the swatch), a significant microbial recovery was observed (similar to that of the fabric swatch) for all organisms except S. aureus. A 1 log reduction was observed in water relative to the fabric swatch, with S. aureus. Hence, more bacterial colonies were recovered from the fabric (the originally contaminated substrate) than the water into which the substrate was placed. This observation may be attributed to the mass transfer peculiarities of S. aureus (binding more to the fabric material than migrating into solution).

3.7. Disinfection Efficiency of Ozonated Water

To study the disinfection efficiency of ozonated water, two key factors were analysed—the contact duration of the fabric swatch in ozonated water at a fixed ozone concentration, and the ozone concentration utilised at a fixed contact time. Figure 10, Figure 11, Figure 12 and Figure 13 illustrate the influence of these factors for E. coli, S. aureus, C. albicans, and A. fumigatus, respectively. Furthermore, the impact of ozone on the contaminated fabric and water (after the wash) were individually analysed. This analysis provided insights into the transfer and survival of microbes from the fabric substrate into water (in which it was washed).
Based on the results presented in Figure 10a,c, complete inactivation of all E. coli cells is obtained by washing with 3 ppm of ozonated water for 5 min, both in water and on the fabric surface. This is a strong indication of the rapid reactivity of ozone, for disinfection and sterilisation of contaminated substrates. As expected, ozonating for 8 min and 11 min produced the same results as that obtained with 5 min—there was no bacterial recovery, as evidenced by a sterile dipslide. Upon analysing the disinfection results using the Miles and Misra method, no colonies were observed with ozonated water. A contact duration of 2 min at 3 ppm (Figure 10a,c) was insufficient to yield complete bacterial removal. As expected, increased contact duration enabled better disinfection of the fabric swatches by ozone (this can be more clearly observed in the log reduction plot of Figure 10c).
Upon analysing the effect of ozone concentration with a 2 min exposure duration (Figure 10b,d), it can be observed that significant improvements in the disinfection efficiency are observed after 3 ppm, as ozone concentrations of 1, 2, and 3 ppm yield similar disinfection efficiencies. It is expected that higher dissolved ozone concentrations will yield even better performance, particularly if ozone retention is enhanced via the optimal addition of salts and surfactants, as demonstrated in Figure 3 and Figure 5. Contrary to the mentioned survival of microbes transferred from the fabric into solution in Section 3.6, when ordinary water was used, the generation of ozone eliminated this occurrence. Irrespective of the treatment condition (Figure 10a–d), E. coli inactivation in water was 100%, yielding approximately a 7 log reduction in solution, in each case.
The observed behaviour of S. aureus on interacting with ozone under the same conditions as shown in Figure 10 is shown in Figure 11. Contrary to the 5 min duration required for the total inactivation of E. coli (Figure 10a,c), 8 min was required in the case of S. aureus (Figure 11a,c); however, a contact duration of 2 min eliminated more S. aureus cells than E. coli cells (Figure 10c and Figure 11c).
To enable a better comparison of ozone’s performance on the Gram-negative (E. coli) and Gram-positive bacteria (S. aureus) utilised in this study, the mean log reduction across all test conditions (on the fabric swatch) can be computed, i.e., mean values from Figure 10b,d compared to those from Figure 11b,d. Computing the mean yields 3.9 and 4.3 for E. coli and S. aureus, respectively, indicating a more significant antimicrobial action of ozone on S. aureus than E. coli. As observed with E. coli (Figure 10), the water samples after the wash were all free of S. aureus, irrespective of the treatment condition (Figure 11).
The performance of ozonated water was also tested on the fungal species C. albicans. As generally observed in Figure 12, this organism proved significantly more difficult for ozone to inhibit than the bacteria tested in this study. A 100% removal efficiency in water could only be achieved at 11 min of ozone contact at 3 ppm (Figure 12a), compared to the complete removal observed (in water) at all conditions for E. coli and S. aureus (Figure 10 and Figure 11).
As observed in Figure 13, A. fumigatus proved the most difficult for ozonated water at the concentrations and exposure durations tested. The survival and growth of this organism in a wide range of environmental conditions make it a famously challenging pathogen to inactivate. At best, the suppression of its growth was observed, rather than the complete inhibition observed with bacteria. Again, as earlier pointed out, higher concentrations and longer exposure times will have a significant impact; the half-life of ozone in mineral water obtained herein is also an important factor to consider, as far as long exposure durations are required. The 11 min maximum utilised in this study would not have resulted in a significant decline in ozone concentration during washing (half-life in mineral water is 39 min—Figure 6b). Unlike the bacterial species, the log reductions for the fungi utilised herein are not reported because the percentage reductions clearly show the trend in fungal growth suppression as a function of the treatment conditions applied.
For textiles with heavy fungal contamination, ozonation in air may be utilised for rapid disinfection at higher ozonation concentrations. Compared to water, ozone concentrations as high as 20 ppm (in air) may be easily attained in a couple of minutes via UV radiation, with complete removal of A. fumigatus in as little as 4 min readily achieved [39]. Follow-on research from this work will involve a detailed comparison of ozonation efficiency in air versus water. It is also worth mentioning that the bacterial log reductions (in solution) obtained in this study are in line with those of the European Standard BS EN16616 values (≥7 log reduction) and the EPA (≥6 log reduction under 10 min for hard surfaces) [40,41]; however, this work has not considered all bacteria types required by these standard test procedures. Future work should constitute a replication of these findings for more organisms and, importantly, a comparative assessment of the fungicidal effects of ozonated water, a surfactant solution, and a mixture of ozonated water and a surfactant (utilising A. fumigatus and C. albicans).

4. Conclusions

In this study, a parametric assessment of ozone concentration, generation and decomposition kinetics, stain removal, and attainable disinfection level was performed, with demonstrable applications for controlled decontamination in the textile processing industry (as a case study).
The results show that low concentrations of detergent and salts (mono- and divalent) promote ozone stability within water. Ozone decomposition in water follows first-order kinetics with a ~10 min half-life in ordinary tap water (ACS water) and ~39 min in the mineral water used herein. Interestingly, this approximately corresponds to a 3–4 times higher retention and is comparable to the relative ionic concentration of Na ions. Thus, increased mineral content favours ozone retention; however, this occurs until a critical point, beyond which the outcome is reversed. This can be attributed to potential salting-out effects or water structure-breaking influence of ions, hence promoting ozone decomposition as shown, with the addition of sodium bicarbonate. Further analysis is required for a robust determination of this critical point for different salts.
The presented results show that the resistance of the tested organisms to ozonated water is in the order A. fumigatus > C. albicans > E. coli > S. aureus. A 7 log reduction in E. coli bacteria (100% removal) was observed in water after ozone treatment at 3 ppm for only 5 min. In comparison, C. albicans required a higher level of ozone treatment, with complete removal in water at 3 ppm observed after 11 min. Microbial inactivation in water was generally higher than that achieved on the fabric swatch. This demonstrates ozone’s efficacy in mitigating the transfer and survival of microbes from a substrate immersed in water.
The results of the presented study demonstrate the potential of aqueous ozone treatment for large-scale industrial applications. Furthermore, the benefits of using ozone for bleaching and textile decontamination purposes also include the reduction in detergent usage, which mitigates negative environmental impact of the resultant wastewater. The number of necessary changes when retrofitting existing industrial textile processing systems to accommodate ozone are minimal, thus creating an incentive for its adaptation and continued application.

Author Contributions

Conceptualisation, E.I.E., A.M., M.C., A.B., W.M. and M.Y.; methodology, E.I.E., N.A., K.R., M.E.R., W.M. and M.Y.; software and data processing, E.I.E.; writing original draft, E.I.E.; writing review draft, E.I.E., A.M., M.C., A.B., N.A., K.R., W.M., M.E.R. and M.Y.; project lead and principal investigator, M.Y. All authors have read and agreed to the published version of the manuscript.

Funding

This research was funded by Innovate UK and ACS Clothing (KTP 12079).

Institutional Review Board Statement

Not applicable.

Informed Consent Statement

Not applicable.

Data Availability Statement

Data are contained within the article.

Acknowledgments

The authors gratefully acknowledge the financial support of Innovate UK (KTP 12079), as well as ACS Clothing and the University of the West of Scotland, for providing the required equipment used in the experiments. The authors also acknowledge the technical and experimental support of Charles McGuiness and Claire Easdon.

Conflicts of Interest

The authors declare that they have no known competing financial interests or personal relationships that could have appeared to influence the work reported in this paper.

Abbreviations

CFU Colony-forming units
CPUR Corrected pick-up rate
DAA Dodecyl tri-methyl ammonium acetate
DDMDodecyl-β-d-maltoside
DPD N,N-diethyl-p-phenylenediamine
BCSOT Blue colouring, sunflower oil, and turmeric powder
GTF Gordon–Tomiyasu–Fukutomi
HSB Hoigné–Staehelin–Bader
ICP Inductive coupled plasma
IR Infrared spectroscopy
SDS Sodium dodecyl sulphate
RTBMRed temporary board marker
TTC 2,3,5-triphenyltetrazolium chloride
UHQ Ultra-high quality

References

  1. Guzel-Seydim, Z.B.; Greene, A.K.; Seydim, A.C. Use of ozone in the food industry. LWT 2004, 37, 453–460. [Google Scholar] [CrossRef]
  2. Summerfelt, S.T.; Sharrer, M.J.; Tsukuda, S.M.; Gearheart, M. Process requirements for achieving full-flow disinfection of recirculating water using ozonation and UV irradiation. Aquac. Eng. 2009, 40, 17–27. [Google Scholar] [CrossRef] [Green Version]
  3. Lee, Y.; von Gunten, U. Advances in predicting organic contaminant abatement during ozonation of municipal wastewater effluent: Reaction kinetics, transformation products, and changes of biological effects. Environ. Sci. Water Res. Technol. 2016, 2, 421–442. [Google Scholar] [CrossRef]
  4. Dong, S.; Li, J.; Kim, M.-H.; Park, S.-J.; Eden, J.G.; Guest, J.S.; Nguyen, T.H. Human health trade-offs in the disinfection of wastewater for landscape irrigation: Microplasma ozonation vs. chlorination. Environ. Sci. Water Res. Technol. 2016, 3, 106–118. [Google Scholar] [CrossRef] [Green Version]
  5. Malik, S.N.; Ghosh, P.C.; Vaidya, A.N.; Mudliar, S.N. Hybrid ozonation process for industrial wastewater treatment: Principles and applications: A review. J. Water Process Eng. 2020, 35, 101193. [Google Scholar] [CrossRef]
  6. Morrison, C.; Atkinson, A.; Zamyadi, A.; Kibuye, F.; McKie, M.; Hogard, S.; Mollica, P.; Jasim, S.; Wert, E.C. Critical Review and Research Needs of Ozone Applications Related to Virus Inactivation: Potential Implications for SARS-CoV-2. Ozone Sci. Eng. 2021, 43, 2–20. [Google Scholar] [CrossRef]
  7. Körlü, A. Use of Ozone in the Textile Industry. In Textile Industry and Environment; IntechOpen: London, UK, 2019. [Google Scholar]
  8. Martinelli, M.; Giovannangeli, F.; Rotunno, S.; Trombetta, C.; Montomoli, E. Water and air ozone treatment as an alternative sanitizing technology. J. Prev. Med. Hyg. 2017, 58, E48–E52. [Google Scholar] [CrossRef] [Green Version]
  9. Kim, J.-G.; Yousef, A.E.; Dave, S. Application of Ozone for Enhancing the Microbiological Safety and Quality of Foods: A Review. J. Food Prot. 1999, 62, 1071–1087. [Google Scholar] [CrossRef]
  10. Eriksson, M. Ozone Chemistry in Aqueous Solution: Ozone Decomposition and Stabilization. Doctoral Dissertation, Department of Chemistry, Royal Institute of Technology Stockholm, Stockholm, Sweden, 2005. [Google Scholar]
  11. Rosenblum, J.; Ge, C.; Bohrerova, Z.; Yousef, A.; Lee, J. Ozonation as a clean technology for fresh produce industry and environment: Sanitizer efficiency and wastewater quality. J. Appl. Microbiol. 2012, 113, 837–845. [Google Scholar] [CrossRef]
  12. Ward, D.B.; Tizaoui, C.; Slater, M.J. Ozone-Loaded Solvents for use in Water Treatment. Ozone Sci. Eng. 2003, 25, 485–495. [Google Scholar] [CrossRef]
  13. Okada, F.; Nay, K. Electrolysis for Ozone Water Production; Electrolysis: London, UK, 2012. [Google Scholar]
  14. Rice, R.G.; Debrum, M.; Cardis, D.; Tapp, C. The Ozone Laundry Handbook: A Comprehensive Guide for the Proper Application of Ozone in the Commercial Laundry Industry. Ozone Sci. Eng. 2009, 31, 339–347. [Google Scholar] [CrossRef]
  15. Finch, G.R.; Smith, D.W.; Stiles, M.E. Dose—Response of Escherichia coli in ozone demand-free phosphate buffer. Water Res. 1988, 22, 1563–1570. [Google Scholar] [CrossRef]
  16. Hunt, N.K.; Mariñas, B.J. Kinetics of Escherichia coli inactivation with ozone. Water Res. 1997, 31, 1355–1362. [Google Scholar] [CrossRef]
  17. Magbanua, B.S.; Savant, G.; Truax, D.D. Combined Ozone and Ultraviolet Inactivation of Escherichia coli. J. Environ. Sci. Health Part A 2006, 41, 1043–1055. [Google Scholar] [CrossRef]
  18. Sevimli, M.F.; Sarikaya, H.Z. Ozone treatment of textile effluents and dyes: Effect of applied ozone dose, pH and dye concentration. J. Chem. Technol. Biotechnol. 2002, 77, 842–850. [Google Scholar] [CrossRef]
  19. Powar, A.S.; Perwuelz, A.; Behary, N.; Hoang, L.; Aussenac, T. Application of Ozone Treatment for the Decolorization of the Reactive-Dyed Fabrics in a Pilot-Scale Process—Optimization through Response Surface Methodology. Sustainability 2020, 12, 471. [Google Scholar] [CrossRef] [Green Version]
  20. Santos, L.; Silva, E.; Oliveira, F.; Rodrigues, L.; Neves, P.; Meira, C.; Moreira, G.; Lobato, G.; Nascimento, C.; Gerhardt, M.; et al. Ozonized Water in Microbial Control: Analysis of the Stability, In Vitro Biocidal Potential, and Cytotoxicity. Biology 2021, 10, 525. [Google Scholar] [CrossRef]
  21. Neral, B. Quality of the household ozone laundering. Ind. Textila 2018, 69, 304–309. [Google Scholar]
  22. Palintest Ozone Meter User Manual. 2020. Available online: https://palintest.fr/application/files/7915/1845/7366/Ozone_meter_instructions.pdf (accessed on 12 May 2021).
  23. Bader, H.; Hoigné, J. Determination of ozone in water by the indigo method. Water Res. 1981, 15, 449–456. [Google Scholar] [CrossRef]
  24. Beloti, V.; Barros, M.A.; De Freitas, J.C.; Nero, L.A.; De Souza, J.A.; Santana, E.H.; Franco, B.D. Frequency of 2,3,5-triphenyltetrazolium chloride (TTC) non-reducing bacteria in pasteurized milk. Rev. Microbiol. 1999, 30, 137–140. [Google Scholar] [CrossRef]
  25. Dip-Slides UK (2021) Dip-Slides UK (2021) BT2 Dipslide|Nutrient with TTC|High Quality. Available online: https://dip-slides.com/microbiological-dipslides/9-ttc-nutrient-ttc-nutrient-dipslides-box-of-10.html (accessed on 2 September 2021).
  26. Acero, J.L.; Von Gunten, U. Influence of Carbonate on the Ozone/Hydrogen Peroxide Based Advanced Oxidation Process for Drinking Water Treatment. Ozone Sci. Eng. 2000, 22, 305–328. [Google Scholar] [CrossRef]
  27. ThermoFisher Scientific Safety Data Sheet: Sodium Carbonate. Revision No. 11. Revision Date 22/12/2020. 2020. Available online: https://thermofishervn.com/images/products/MSDS/10861.pdf (accessed on 2 September 2021).
  28. ThermoFisher Scientific, Safety Data Sheet: Potassium Carbonate Anhydrous. Revision No. 11. Revision Date 01/01/2021. 2021. Available online: https://www.fishersci.co.uk/chemicalProductData_uk/wercs?itemCode=10647612&lang=EN (accessed on 2 September 2021).
  29. Langlais, B.; Reckhow, D.A.; Brink, D.R. Ozone in Water Treatment: Application and Engineering; Lewis Publishers: New York, NY, USA, 1991; p. 558. [Google Scholar]
  30. Wang, Y.-H.; Chen, Q.-Y. Anodic Materials for Electrocatalytic Ozone Generation. Int. J. Electrochem. 2013, 2013, 128248. [Google Scholar] [CrossRef]
  31. Tomiyasu, H.; Fukutomi, H.; Gordon, G. Kinetics and mechanism of ozone decomposition in basic aqueous solution. Inorg. Chem. 1985, 24, 2962–2966. [Google Scholar] [CrossRef]
  32. Greenwood, N.N.; Earnshaw, A. Chemistry of the Elements; Elsevier: Amsterdam, The Netherlands, 2012; ISBN 0080501095. [Google Scholar]
  33. Bulanin, K.; Bulanin, M.; Tsyganenko, A. Infrared spectra of 18O-enriched ozones in liquid oxygen solution. Chem. Phys. 1996, 203, 127–136. [Google Scholar] [CrossRef]
  34. Bulanin, K.M.; Alexeev, A.V.; Bystrov, D.S.; Lavalley, J.C.; Tsyganenko, A.A. IR Study of Ozone Adsorption on SiO2. J. Phys. Chem. 1994, 98, 5100–5103. [Google Scholar] [CrossRef]
  35. Staehelin, J.; Buehler, R.E.; Hoigne, J. ChemInform Abstract: Ozone decomposition in water studied by pulse radiolysis. 2. hydroxyl and hydrogen tetroxide (HO4) as chain intermediates. J. Phys. Chem. 1984, 88, 5999–6004. [Google Scholar] [CrossRef]
  36. Heidt, L.J.; Landi, V.R. Ozone and Ozonide Production and Stabilization in Water. J. Chem. Phys. 1964, 41, 176–178. [Google Scholar] [CrossRef]
  37. Batakliev, T.; Georgiev, V.; Anachkov, M.; Rakovsky, S.; Zaikov, G.E. Ozone decomposition. Interdiscip. Toxicol. 2014, 7, 47. [Google Scholar] [CrossRef] [Green Version]
  38. Miles, A.A.; Misra, S.S.; Irwin, J.O. The estimation of the bactericidal power of the blood. Epidemiol. Infect. 1938, 38, 732–749. [Google Scholar] [CrossRef] [Green Version]
  39. Epelle, E.I.; Macfarlane, A.; Cusack, M.; Burns, A.; Thissera, B.; Mackay, W.; Rateb, M.E.; Yaseen, M. Bacterial and fungal disinfection via ozonation in air. J. Microbiol. Methods 2022, 194, 106431. [Google Scholar] [CrossRef]
  40. US EPA Guidelines, OCSPP 810.2200: Disinfectants for Use on Hard Surfaces—Efficacy Data Recommendations. Available online: https://www.regulations.gov/document?D=EPA-HQ-OPPT-2009-0150-0021 (accessed on 2 September 2021).
  41. BS EN 16616:2015-10 Chemical Disinfectants and Antiseptics—Chemical-Thermal Textile Disinfection—Test Method and Requirements. 2015. Available online: https://shop.bsigroup.com/products/chemical-disinfectants-and-antiseptics-chemical-thermal-textile-disinfection-test-method-and-requirements-phase-2-step-2/standard (accessed on 12 May 2021).
Figure 1. Two methods of producing ozonated water using a gas phase ozoniser with water (a) and water electrolysis (b) (adapted with permission from Okada and Naya [13]).
Environments 09 00045 g001
Figure 2. Experimental setup for (a) lab-scale ozonated washing of fabric substrates, showing (b) the Palintest kit employed for ozone concentration measurements.
Environments 09 00045 g002
Figure 3. Ozone retention of different water samples, showing the influence of Na2CO3 concentration on ozone concentration. Experimental conditions: 900 mL of water ozonated for 11 min at 18 °C, where σ is the conductivity.
Environments 09 00045 g003
Figure 4. (a) The effect of detergent concentration on ozone concentration in water. Experimental conditions: 900 mL of mineral water ozonated for 11 min at 18 °C. Panels (be) show that no colour change is observed on dissolving the Palintest (DPD No. 4 tablets) in the water–detergent mixtures. Error bars represent the standard deviation of three separate runs.
Environments 09 00045 g004
Figure 5. Ozone generation and decomposition curves using (a,b) ACS water; (c,d) mineral water; and (e,f) mineral water + detergent. Experimental conditions: 900 mL of water ozonated at 18 °C; where a detergent was applied, 0.25 g was utilised. Error bars represent the standard deviation of three separate runs. The lines through the mean points are drawn to help the reader follow the profile of the data.
Environments 09 00045 g005
Figure 6. Firstorder kinetics of ozone decomposition in (a) ACS water with a half-life of 10 min (b), mineral water with a halflife of 39 min, and (c) mineral water and detergent with a halflife of 58 min. Experimental conditions: 900 mL of water ozonated at 18 °C.
Environments 09 00045 g006
Figure 7. Effect of temperature on ozone concentration. Experimental conditions: 900 mL of mineral water ozonated at 18 °C for 11 min. The decomposition rate, on increasing temperature, is approximately 0.06 ppm/°C. Error bars represent the standard deviation of three separate runs.
Environments 09 00045 g007
Figure 8. Processed images of stained fabric regions pre- and post-ozonation. Experimental conditions: washing with 900 mL of mineral water for 11 min; where ozone was used, ozonation at 18 °C for 11 min was performed. The colour intensity analysis on the tested fabric swatches was carried out using MATLAB’s (R2020b) image processing toolbox (the Colour Thresholder). BCSOT represents a mixture of blue food colouring, sunflower oil, and turmeric powder; whereas, RTBM represents solvent-based, red-coloured temporary board marker ink.
Environments 09 00045 g008
Figure 9. (a) Enumeration of bacterial concentration on the dipslides on surfaces and in solution (adapted with permission from [25]); number of CFUs on the dipslide—applicable to E. coli and S. aureus; contaminated regions of the dipslide for (b) C. albicans and (c) A. fumigatus, determined via area fraction analysis. (d) Obtained concentrations of E. coli at different volumes of utilised bacterial suspensions: 10 µL, 25 µL, 40 µL, 65 µL, and 80 µL. Dipslides were immersed into respective mixtures of the known volume of bacteria suspension and 100 mL of sterile distilled water, and also applied directly onto contaminated swatches with the respective suspension volumes.
Environments 09 00045 g009
Figure 10. Effect of (a) contact duration at 3 ppm and (b) ozone concentration at 2 min exposure duration on E. coli removal efficiency after ozonated water treatment. Panels (a,b) illustrate the percentage removal, whereas (c,d) illustrate the log reductions for the displayed conditions.
Environments 09 00045 g010
Figure 11. Effect of (a) contact duration at 3 ppm and (b) ozone concentration at 2 min exposure duration on S. aureus removal efficiency after ozonated water treatment. Panels (a,b) illustrate the percentage removal, whereas (c,d) illustrate the log reductions for the displayed conditions.
Environments 09 00045 g011
Figure 12. Effect of (a) contact duration at 3 ppm and (b) ozone concentration at 2 min exposure duration on C. albicans removal efficiency after ozonated water treatment.
Environments 09 00045 g012
Figure 13. Effect of (a) contact duration at 3 ppm and (b) ozone concentration at 2 min exposure duration on A. fumigatus removal efficiency after ozonated water treatment. The larger error bars associated with these measurements may be attributed to the non-uniform growth pattern of this fungus in liquid suspensions, which inherently affects the microbial load used for inoculation.
Environments 09 00045 g013
Table 1. Ionic composition of water samples as obtained via ICP analysis.
Water TypeCa
(mg/L)
K
(mg/L)
Mg
(mg/L)
Na
(mg/L)
Cl
(mg/L)
SO42−
(mg/L)
NO3
(mg/L)
ACS water6.8010.4150.7544.8276.4411.240.00
Mineral water46.9450.96917.14112.46617.2320.6613.95
Table 2. The pH and conductivity measurements of water samples.
Water Type/CompositionpHConductivity, σ (mS)
ACS water7.160.10
Mineral water8.070.46
Distilled water7.130.00
UHQ water7.300.00
0.25 g detergent in 900 mL mineral water8.900.78
0.50 g detergent in 900 mL mineral water9.161.13
0.75 g detergent in 900 mL mineral water9.371.39
0.1 g Na2CO3 in 900 mL mineral water9.560.59
2.0 g Na2CO3 in 900 mL mineral water10.894.14
0.1 g Na2CO3 in 900 mL UHQ water10.710.37
2.0 g Na2CO3 in 900 mL UHQ water11.273.95
0.1 g Na2CO3 in 900 mL ACS water10.540.34
2.0 g Na2CO3 in 900 mL ACS water11.274.01
Publisher’s Note: MDPI stays neutral with regard to jurisdictional claims in published maps and institutional affiliations.

