1. Introduction
Public and nonprofit organizations, entwined in the delivery of public goods and services [
1,
2], are in the midst of challenging economic times. In these circumstances, sound collaborative leadership may help bridge budget and program service delivery shortfalls. In this paper, we examine the administrative dynamics of mutual reliance between two prominent public and nonprofit organizations: public schools and parent-teacher groups (PTGs).
Throughout American history, nonprofit organizations, such as parent-teacher associations and organizations (PTAs and PTOs, respectively, which we collectively refer to as PTGs) and school foundations, have long played important roles in local public education systems—advocating for educational policies and encouraging community participation in local education [
3,
4]. Nevertheless, in strenuous economic times, PTGs may experience greater pressure to shift their attention from traditional civic engagement and advocacy roles to filling gaps in budget shortfalls through increased fundraising efforts.
Although these financial contributions can help the beneficiary schools to weather difficult economic times, providing financial support to government institutions can have some negative impacts on the nonprofits involved. For example, PTGs may experience mission drift and potential mission conflicts [
4]. Because PTGs are volunteer-led organizations, they may lack the administrative capacity to develop and administer increased revenue, a phenomenon noted in other grassroots organization movements [
5].
Our research question is how parent-teacher groups (PTGs) manage and change their activities to balance their own missions with pressures to support schools facing budget shortfalls. We are particularly interested in (1) how economic pressures might influence and change the independent leadership roles of PTGs (and how they interact with and support schools) and (2) how PTG missions and school characteristics influence PTG activities. We analyze these questions using exploratory data from a survey of leaders of parent-teacher groups in North Carolina. Before discussing our survey findings, we introduce a framework for thinking about the activities of PTGs.
2. Theoretical Model of Nonprofits: Government Relationships
Government and nonprofit organizations often work side by side to develop and support public services and facilities. Ordinary citizens have historically contributed to public efforts, such as maintaining roads and building community-meeting centers. The most affluent philanthropists, such as Andrew Carnegie and James Smithson, have actually built and established new structures of government service delivery, such as public libraries and research institutions [
6].
Today, Americans are still actively engaged in both volunteering and contributing to the provision of public goods and services. Individuals often come together in nonprofit organizations, such as Friends of the Library, Friends of the Park, and even booster clubs and foundations to support specific government activities. New millennium models of governance implicitly and explicitly emphasize active citizen participation in the design and delivery of services across a broad range of activities [
7].
Active engagement notwithstanding, citizen participation is not purely cooperative. Many have opposed government programs and policy, seeking to influence public opinion and change public policy. Advocacy efforts have ranged from the early Temperance and Abolition movements to contemporary movements around abortion rights, the environment, guns and gay rights. Populist local leaders have empowered community organizations to not only be active partners in the delivery of public services, but to simultaneously advocate for community issues [
8]. For example, Stephen Goldsmith, former mayor of Indianapolis, is quoted as saying, “My greatest hope is that someday soon, people from those neighborhoods will march on City Hall and demand things of us, not sit back waiting for us to take the lead.” [
8] (p. 4).
In recent years, there has been increased effort to understand and theoretically categorize the diversity of relationships between government and nonprofit organizations [
9]. Such models emphasize the relationships and connections between sectors [
10]. For example, the model of Gidron
et al. [
11] focuses on the social welfare system, emphasizing the degree of discretion in service delivery. Coston’s [
12] model defines eight possible relationships between nonprofits and national government, based on several dimensions: government’s resistance of institutional pluralism, the relative balance of power in the relationship and the degree of formality of the relationship. Both of these models present complex maps of various dimensions of relationships, and their focus is specifically limited to specific arenas of action—federal and social welfare. Najam [
9] posits a model built upon “strategic institutional interests” of each sector, recognizing both the adversarial and shared service delivery models of inter-sectoral relationships. Nonprofit/government relationships can be distinguished by the degree to which their goals (what they want to achieve) and means (how they achieve those goals) are similar. In these models, means may refer to both the method of service delivery or resources used to produce services. Conceptually, Najam’s model contemplates a two-by-two matrix with four categories of relationships: cooperation (similar goals and means), complementary (similar goals and different means), confrontation (different goals and means) and co-option (different goals and similar means).
Young [
13] proposes a simpler, broader model with three alternative views of government/nonprofit relationships: (1) in supplementary relationships, nonprofits operate independently of government; (2) in complementary relationships, nonprofits operate in partnership; and (3) adversarial relationships involve mutual accountability. Najam’s [
9] and Young’s [
13] models are admittedly similar; both scholars posit that cooperative relationships occur when nonprofit and government organizations have similar goals and means, often resulting in government contracting out to nonprofits to provide similar services or working in a collaborative fashion to achieve the same ends. However, for the purposes of this paper, we prefer Young’s model. We conceptualize public school/PTG relationships as a function of social and economic factors rather than viewing PTGs like Najam does, as policy entrepreneurs [
14] (p. 150).
3. Balancing the Roles and Activities of Parent Teacher Groups
One of the most active arenas for citizen participation in local governance is public education. Through parent teacher groups, citizens provide public schools with not only a ready body of volunteers and ardent advocates, but also a dedicated team of willing fundraisers. For example, a 2008 poll of 1220 American adults found that 59% of respondents “personally have done something in the last year to support public schools” [
15]. In North Carolina, where we drew our sample, the Corporation for National and Community Service estimates that, approximately 23% of volunteering done in North Carolina was done for educational institutions [
16].
PTGs clearly illustrate the diverse roles nonprofits play in public governance. What eventually came to be known as the PTA was founded in 1897 as part of the women’s club movement when 2000 people—mothers, fathers, teachers, laborers and legislators—joined together to “eliminate threats that endangered children” [
17]. The PTA’s commitment to promote child welfare was accomplished by extensive fundraising and volunteering that often not only provided the extras that public schools needed, such as sports uniforms, but in many cases, particularly in very poor communities, provided the basics of a public school education, including the construction of public school buildings [
3,
4]. For example, Leloudis’s [
18] study of North Carolina’s Women’s Association for the Betterment of Public Schools found that the association raised the revenues to build an average of one school per day between 1902 and 1910.
PTGs continue to play an active role in fundraising for public schools, particularly during the Great Recession. For example, in response to budget cuts in New York City, one principal remarked, “We’re really looking at the community to pick up some of the slack, and the community is coming forward;” at Public School 86 in Brooklyn, a local church provided free backpacks filled with supplies to students, and in other schools, PTA funds were used to hire school aides [
19].
Beyond fundraising, PTGs are involved in advocacy and community engagement. The historical mission of the national PTA is to be “a powerful voice for all children, a relevant resource for families and communities, and a strong advocate for the education and well-being of every child” [
17]. The PTA quickly became a nationwide movement that fought for the creation of kindergarten classes, child labor laws, a public health service, hot lunch programs, a juvenile justice system and mandatory immunization. Early PTGs and their associated women’s clubs took on such controversial political issues as elite and centralized control of the school system and such social practices as playgrounds and school lunches [
4,
20]. From a critical perspective, Reece [
20] maintains that these groups were not only battling for a say in local school affairs, but were advocating for the much larger economic and political issues of gender and social equality—access to the labor market, just wages and opposition to capitalist control of public education. From this perspective, a key tool in the battle for control over public education was the efforts to ensure local control of school boards and community participation in school decision-making [
20].
PTGs have also pursued a third role: seeking to engage parents in their children’s education. Today, the national PTA’s mission addresses this in its stated goal to “make every child’s potential a reality by engaging and empowering families and communities to advocate for all children” [
21].
“Recognizing that school success is dependent upon the active involvement of parents, PTAs have long sought to promote strong alliances between parents and schools [
22,
23]. Early efforts by the PTA to promote effective parenting techniques expanded into efforts to mandate parental involvement on advisory boards and in the development of student education plans [
22]. The current “community school movement”, which seeks to bring parents and other community residents into the schools, rests on the belief that parental engagement leads to improved student and community outcomes [
24]. For example, in the 1990s, the national PTA, focusing its attention on drug prevention and HIV/AIDS education, convened a national summit on parental involvement [
25]. PTGs have also played crucial roles in engaging immigrant parents in the education of their children [
26].
By focusing on the more “mundane” acts of parental involvement and philanthropy [
4], most PTGs have balanced their multiple roles. However, at times, a PTG’s multiple governance functions have clashed [
4]. With the recent fiscal downturn, these tensions may escalate [
27]. PTGs currently face pressure to engage in fundraising to support not only the extras associated with quality education, but to increasingly provide the essentials, such as staff positions and building maintenance. These pressures conceivably alter how a PTG balances its other roles.
Recognizing that the nature of government and nonprofit relationships is dynamic, anecdotal evidence suggests that private support of public education may be changing significantly. For example, parents in many schools have sought to raise private resources, both dollars and time, to support public schools [
28], raising concerns that PTGs may move from focusing on education advocacy or parent/community engagement to funding of public education services.
To better understand the nature of these shifts, it is useful to think about these historical roles of PTGs in the context of Young’s model of government and nonprofit relations. In applying Young’s model, we see parental support of schools through either fundraising or volunteering as complementary activities. We conceptualize PTGs’ efforts to engage parents and community members in education as supplementary activities. Finally, advocacy at the district, state or national level comprises adversarial activities. In the balance of this paper we explore the potentially changing relationships between PTGs and schools in a time of economic crisis.
4. Data and Methodology
Data for our paper come from an Internet survey of 82 parents/teacher groups (PTGs) in North Carolina. Based on FY2008 North Carolina Department of Public Instruction (DPI) financial reports, we identified 1375 elementary schools across the state. We searched for websites for each of these schools, to identify contact information for PTGs. From these searches, we were able to identify email addresses for 310 parent teacher organizations. An email with a link to an online survey was sent to each of these email addresses. Nineteen of these emails bounced due to being undeliverable, leaving us with 291 valid email addresses, representing roughly 21% of the elementary schools in North Carolina. After two follow-up emails, 105 respondents (36%) began to complete the survey, with 82 respondents completing the survey with minimal missing of information, giving us a final response rate of 29%.
While our response rate is within acceptable standards for organizational level research, our respondents are not representative of PTGs across the state. Indeed, based on the financial reports for the schools associated with these PTGs, there appears to be a digital divide. Given the resources that go into supporting a web presence for both elementary schools and associated PTGs, we find significant differences between schools for which we identified PTG email addresses and those for which we did not. PTGs with identifiable email addresses are associated with schools that are larger ($3.7 M versus $3.1 M average annual expenditures), wealthier (43% of students versus 62% on free/reduced lunch plans) and whiter (57% versus 52% white students).
Notwithstanding these discrepancies, we do not find statistically significant differences between respondents and non-respondents in our sample. The socio-economic profiles of the elementary schools associated with PTGs that responded to the survey are not significantly different from those that did not respond. Ultimately, we are dealing with a selection bias rather than a response bias. To that end, our findings from this research are generalizable to North Carolina PTGs with some web presence, rather than to the entire population of North Carolina PTGs. Furthermore, regarding selection bias, to the extent that we find differences between PTG respondents that are associated with socio-economic characteristics of schools, we intuit that these differences would be even more significant if the smaller and poorer PTGs (and their corresponding schools) were surveyed.
We use descriptive statistics to explore PTGs’ roles/activities. We classified each PTG by its mix of activities in Young’s framework. The activity variables are based on five survey questions, whether the PTG engaged in: (1) fundraising to provide financial resources for the school; (2) soliciting volunteers for school activities/programs; (3) advocacy at the school district level for a particular education policy or issue; (4) advocacy at the state or national level for a particular education policy or issue; and (5) educating the community on district-, local- or state-level education issues.
If the respondents indicated that they performed Activities 1 or 2, they were coded as being in the complementary category. Questions 3 and 4 were associated with the adversarial category. Finally, respondents indicating that they educate the community (Question 5) were coded as being in the supplementary category. These three strategies are not mutually exclusive, so we further coded the PTGs’ responses to reflect all eight possible combinations of strategies: complementary only, supplementary only, adversarial only, complementary and supplementary, supplementary and adversarial, complementary and adversarial, all three strategies and none of the three strategies. We did this for the three time periods represented by the data (1) before the 2008–2009 school year, (2) during the 2008–2009 school year and (3) planned for the 2009–2010 school year.
5. Results
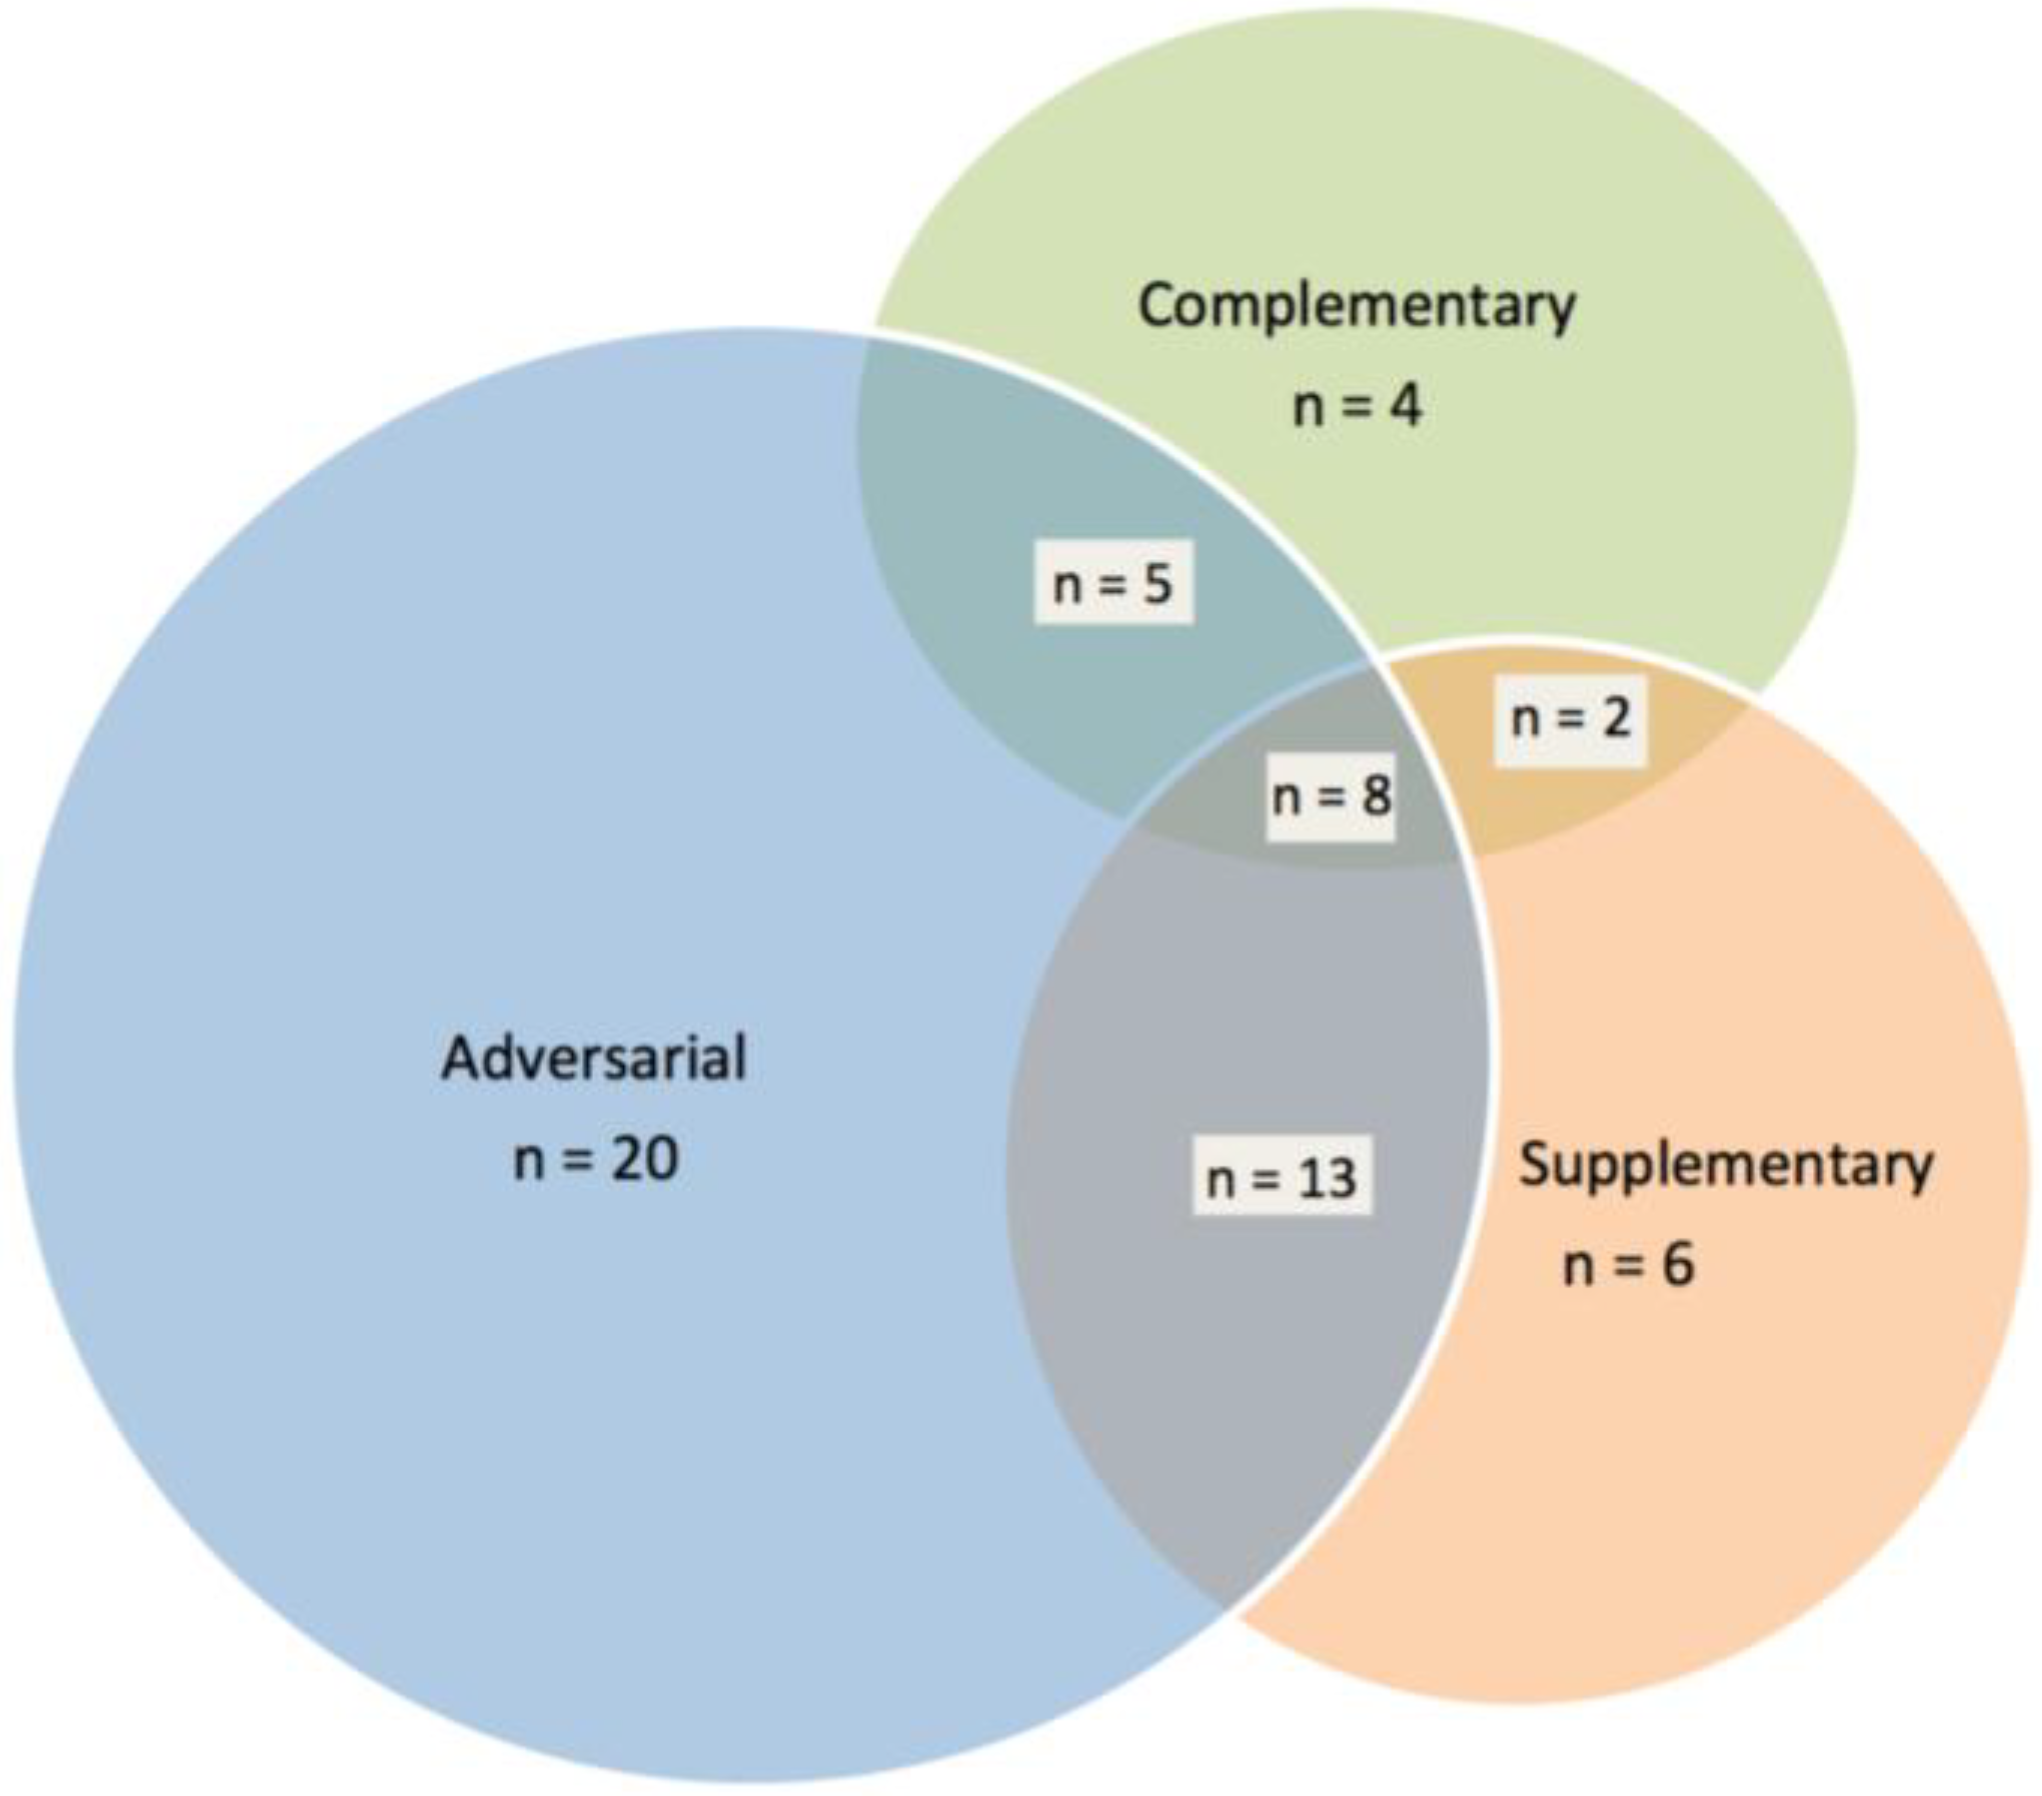
Figure 1,
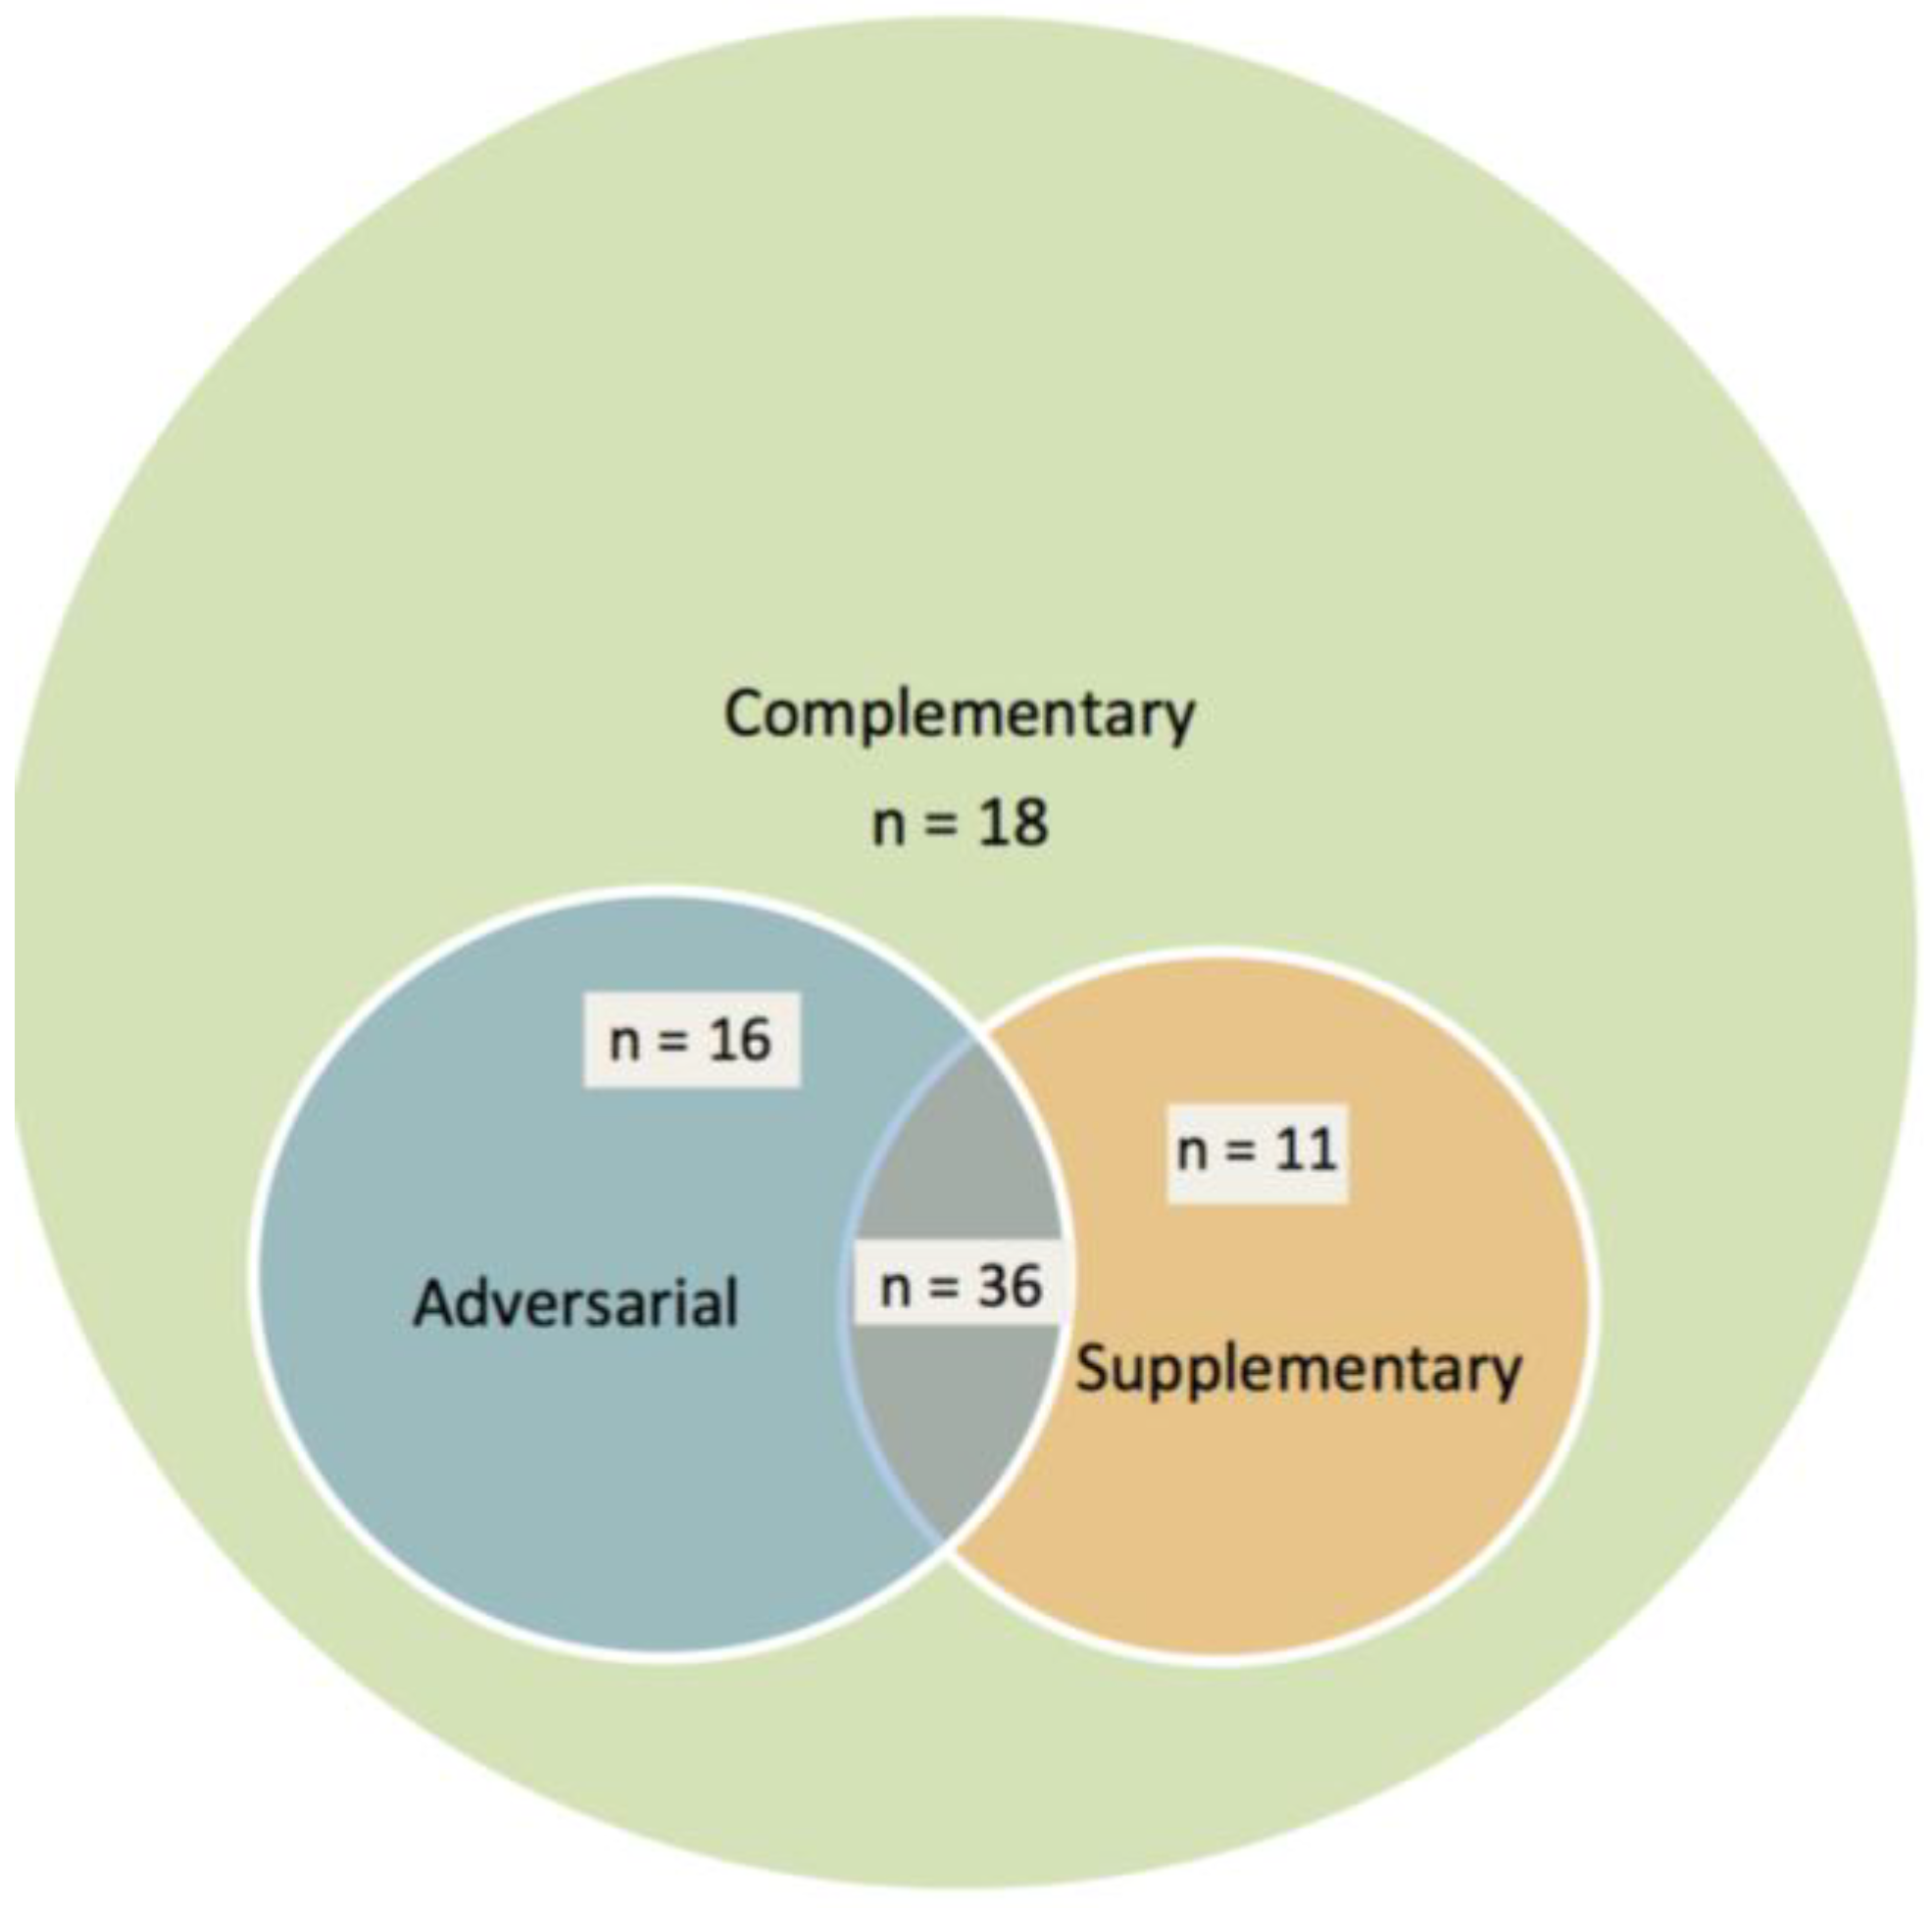
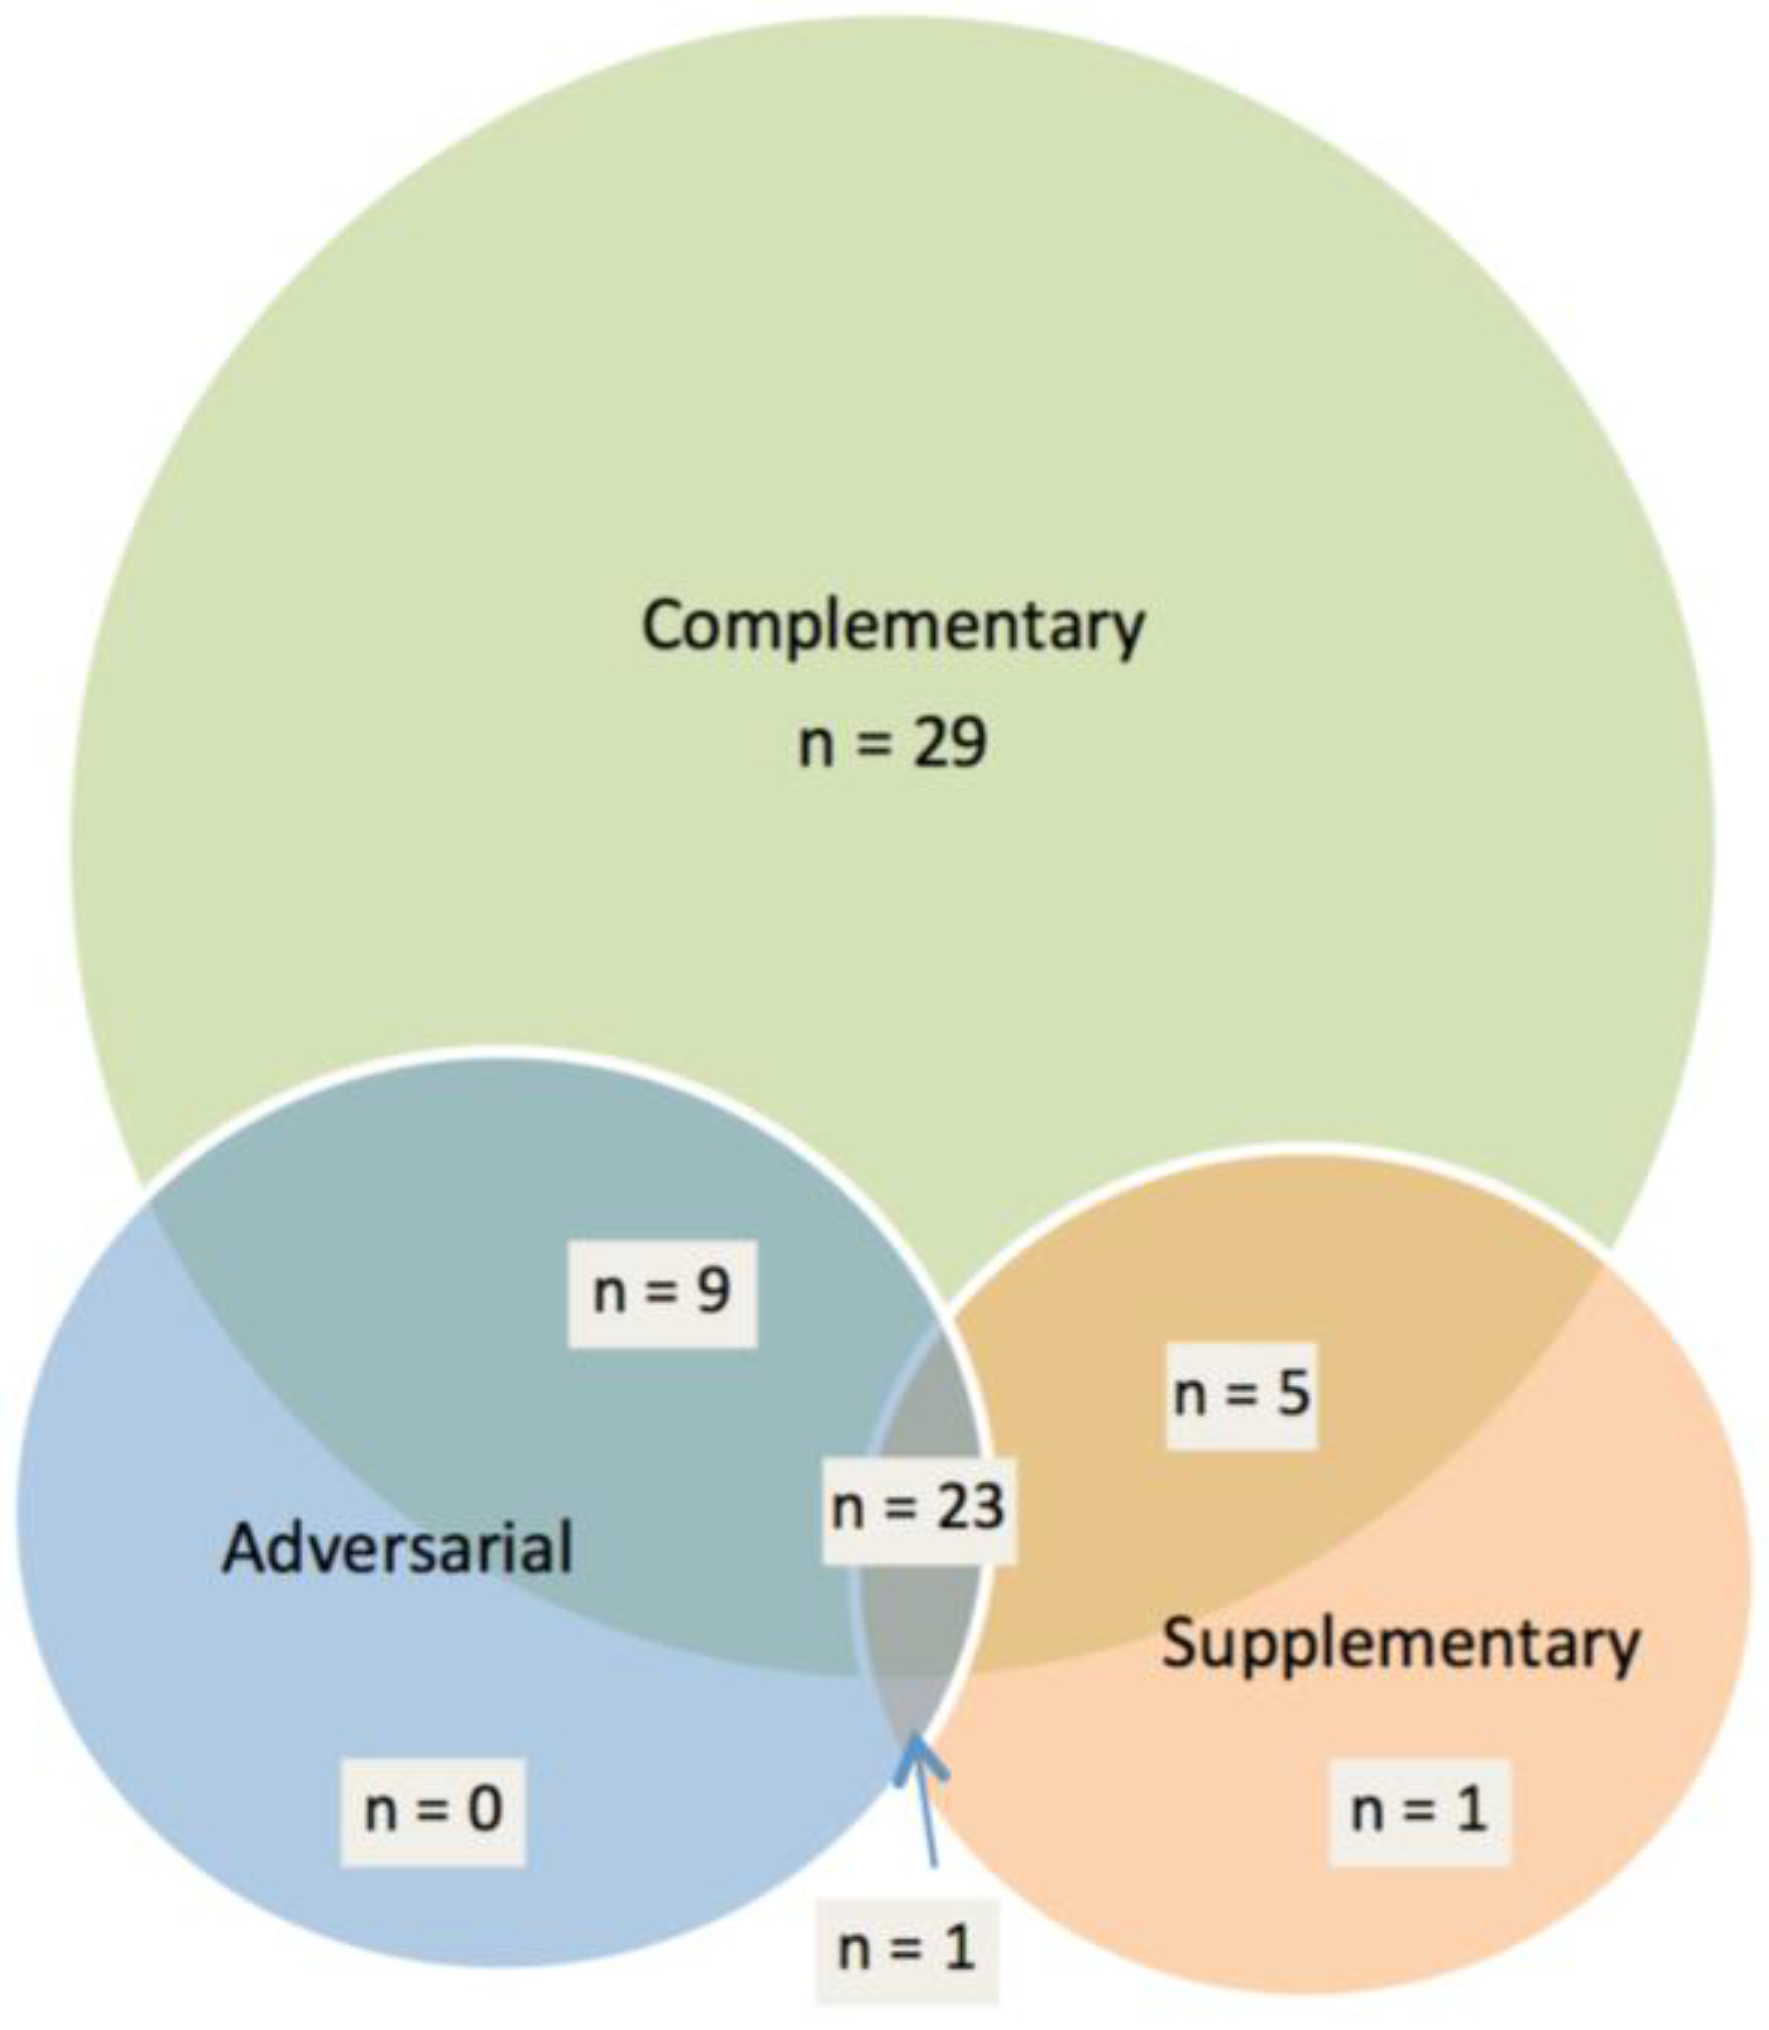
Figure 2 and
Figure 3 show the mix of total PTG activities, employing Venn diagrams to capture the three time periods in the study.
Figure 1.
Mix of activities engaged in, by type, prior to 2008–2009.
Figure 1.
Mix of activities engaged in, by type, prior to 2008–2009.
Figure 2.
Mix of activities engaged in, by type, in the 2008–2009 school year.
Figure 2.
Mix of activities engaged in, by type, in the 2008–2009 school year.
Figure 3.
Mix of activities to be planned, by type, in 2009–2010.
Figure 3.
Mix of activities to be planned, by type, in 2009–2010.
These descriptive figures offer evidence that PTGs’ strategies are dynamic and may be shaped by the economic climate. For example, PTGs are relying less on adversarial activities and increasingly on complementary activities. We investigate this more thoroughly in the following section.
5.1. Movement between Activity Mixes
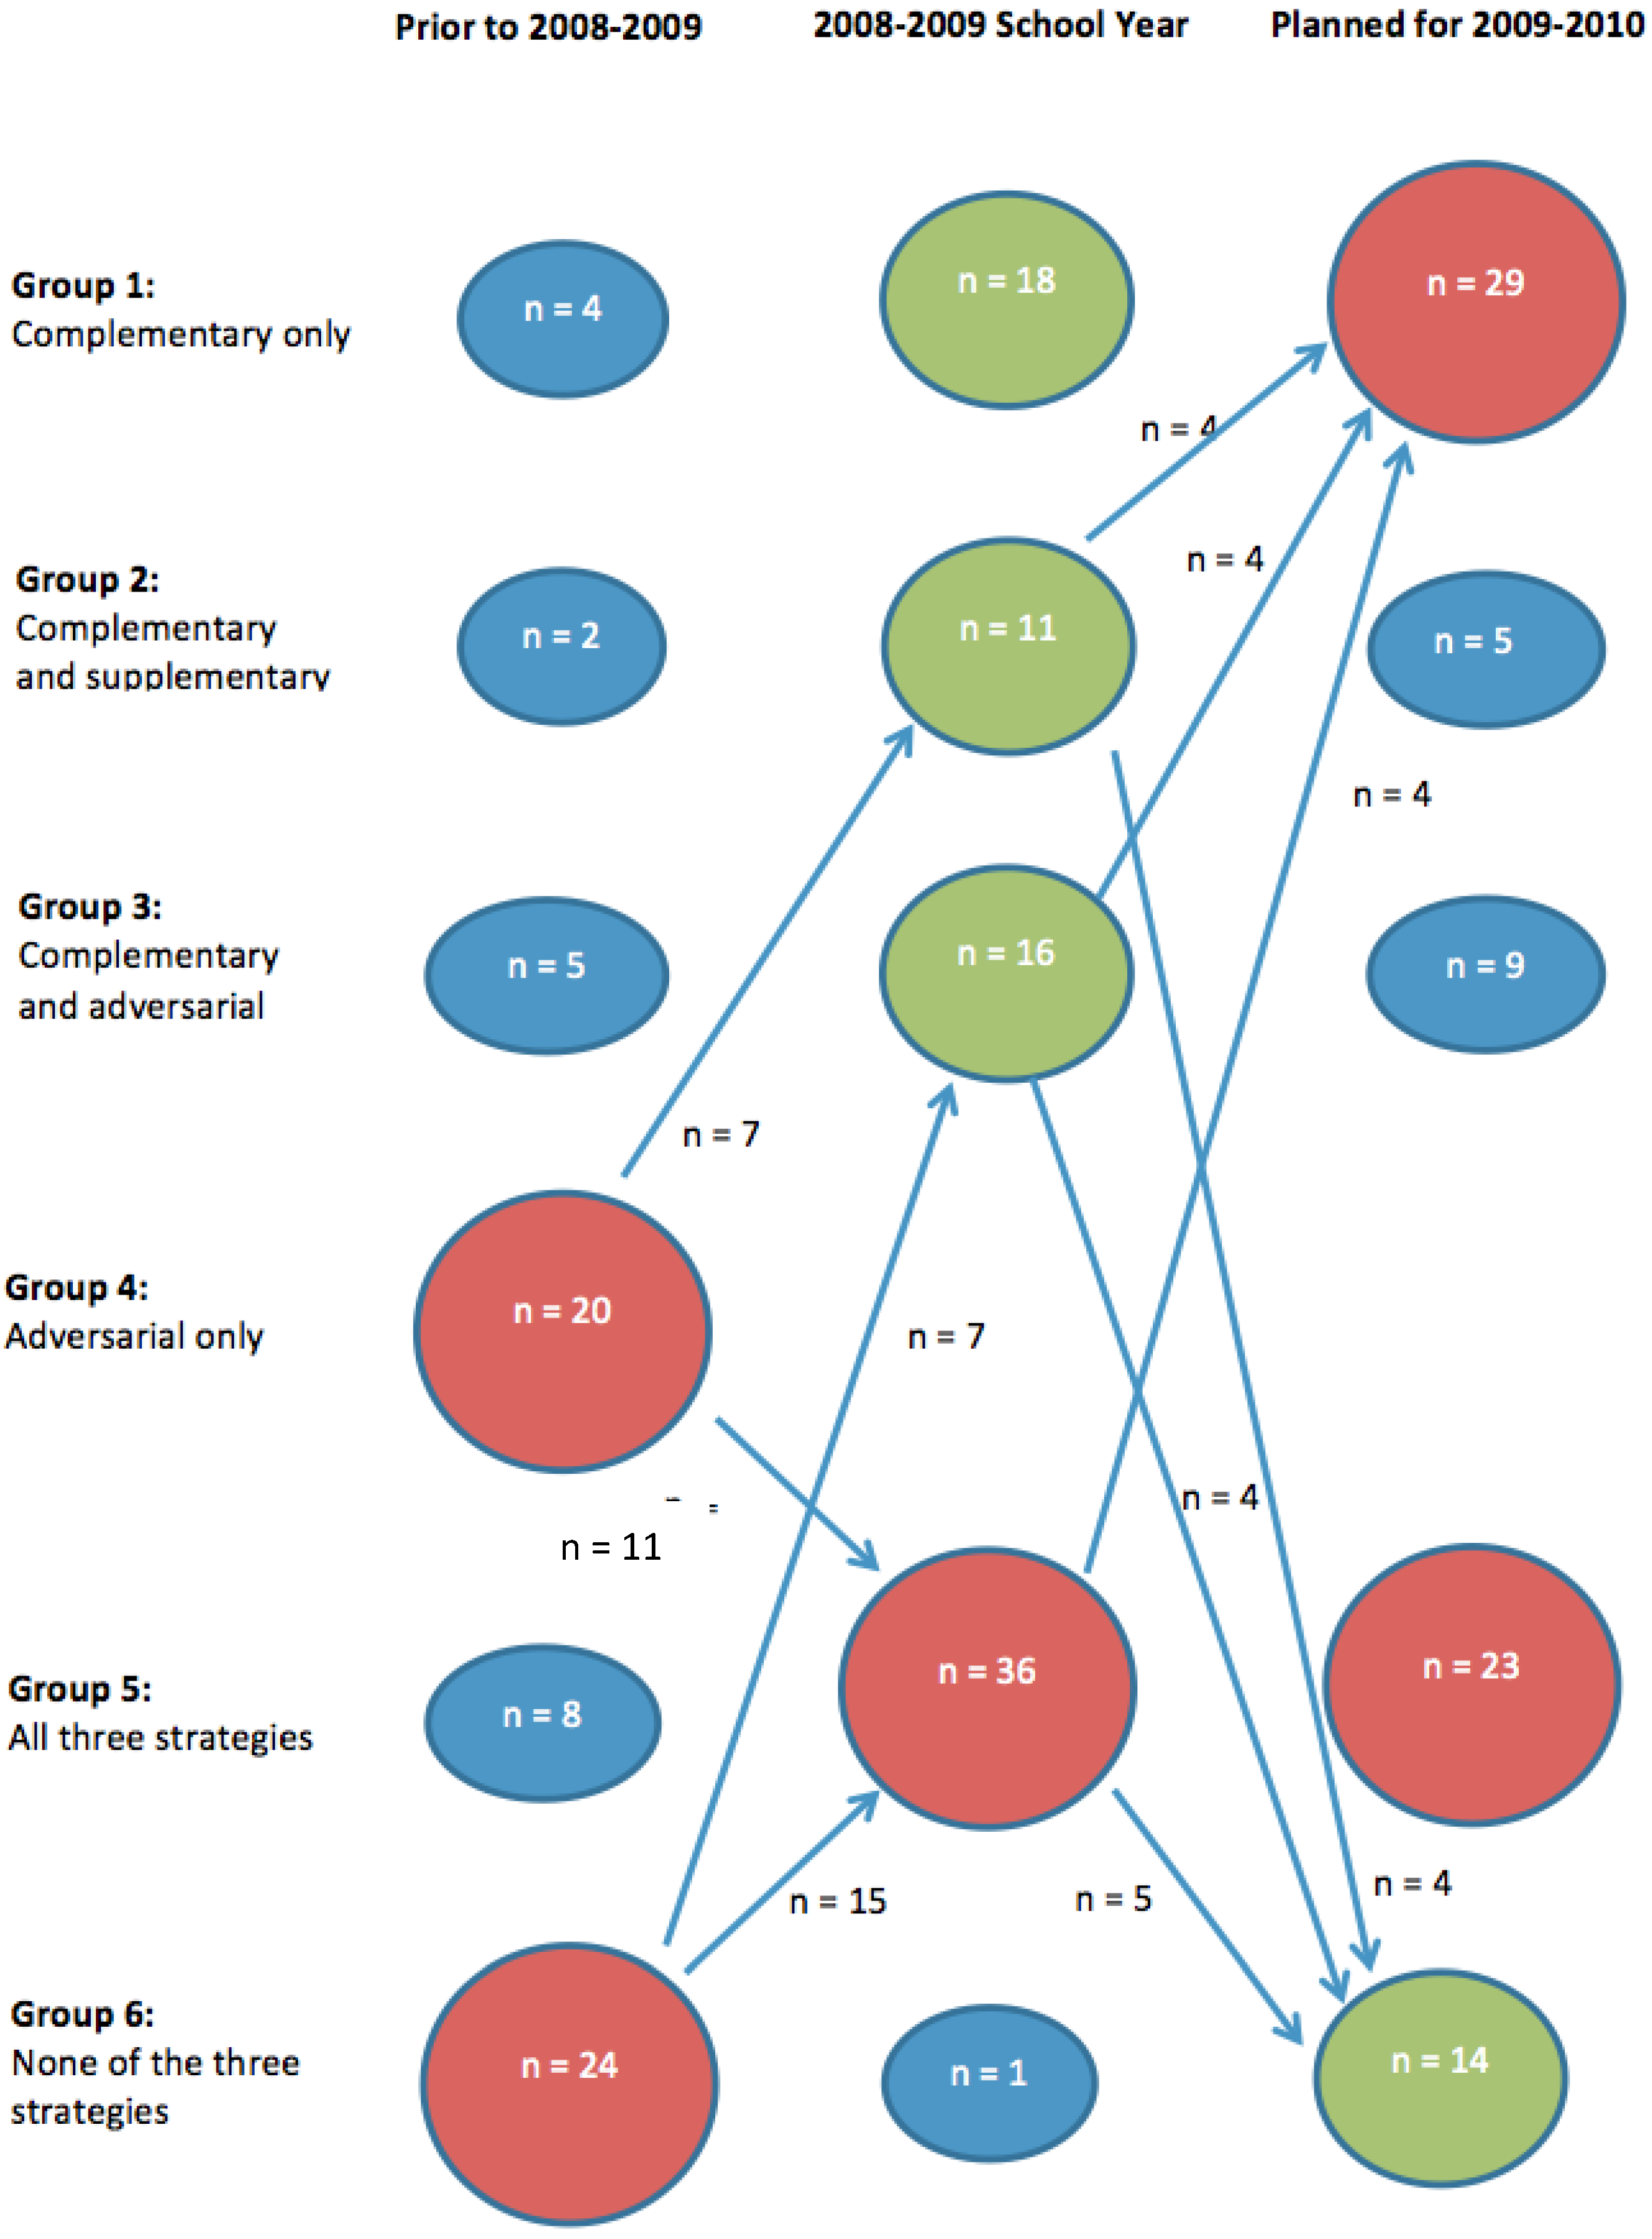
Figure 4 shows a diagram of the movement between six major activity mixes over the three time periods. Two activity mixes—supplementary only and supplementary/adversarial—are not shown to simplify the analysis and because the group sizes were so small. From the time period prior to 2008–2009 to the 2008–2009 school year, eleven organizations with a strictly adversarial approach changed to a mix of all three activities. Another seven adversarial organizations moved to a complementary and supplementary combined activity. During that same shift in time period, fifteen organizations that did not report any of these three activities changed to using all three activities, and another seven organizations switched to complementary and adversarial activities.
Figure 4.
Changes in parent-teacher groups (PTGs) activities, past, present and planned.
Figure 4.
Changes in parent-teacher groups (PTGs) activities, past, present and planned.
From the 2008–2009 school year to the planned activities for 2009–2010, organizations tended to emphasize complementary activities only. Twelve organizations joined this group, including four organizations changing from a complementary/supplementary mix, four changing from a complementary and adversarial mix and four organizations that had been employing all three activities. The other major shift was toward employing none of the three activities, including movement of thirteen organizations: four from the complementary/supplementary group, four from the complementary and adversarial group and five PTGs that had been using all three activities. This could potentially represent the fact that the PTG group leaders were uncertain of the activities they would be using during the next school year.
Taken together, this suggests that going into the 2008–2009 school year, PTGs preferred a mix of activities, especially complementary activities. The movement from the 2008–2009 school year to the 2009–2010 school year was more bifurcated—PTGs tended to either prefer complementary activities or a combination of the three activities. PTGs generally de-emphasized adversarial activities, or advocacy, during this time, at least as an exclusive activity.
5.2. Activities and School Characteristics
Using the eight groups of activities, we also explored differences in the characteristics of the schools associated with the PTG. These characteristics included percent free and reduced lunch (see
Table 1), the number of students in the school (see
Table 2) and the amount the PTG spent in the previous, present (i.e., year of the study) and planned (following) year (see
Table 3).
Table 1.
Percent of students receiving free or reduced lunch by PTG activities and time period.
Table 1.
Percent of students receiving free or reduced lunch by PTG activities and time period.
| | Prior to 2008–2009 | 2008–2009 | 2009–2010 |
|---|
| PTG Activities | N | Mean | SD | n | Mean | SD | n | Mean | SD |
|---|
| Complementary Only | - | - | - | 18 | 53% | 21 | 29 | 52% | 19 |
| Supplementary Only | 6 | 66% | 12 | - | - | - | - | - | - |
| Adversarial Only | 20 | 43% | 20 | - | - | - | - | - | - |
| Complementary and Supplementary | - | - | - | 11 | 41% | 21 | 5 | 49% | 20 |
| Supplementary and Adversarial | 13 | 44% | 22 | - | - | - | - | - | - |
| Complementary and Adversarial | 5 | 50% | 16 | 16 | 47% | 16 | 9 | 50% | 13 |
| All Three | 8 | 52% | 09 | 36 | 41% | 19 | 23 | 34% | 17 |
| None | 24 | 38% | 20 | - | - | - | 14 | 41% | 20 |
Table 2.
Mean number of students by PTG activities and time period.
Table 2.
Mean number of students by PTG activities and time period.
| | Prior to 2008–2009 | 2008–2009 | 2009–2010 |
|---|
| PTG Activities | N | Mean | SD | n | Mean | SD | n | Mean | SD |
|---|
| Complementary Only | - | - | - | 18 | 597 | 153.0 | 29 | 566 | 157.8 |
| Supplementary Only | 6 | 491 | 77.2 | - | - | - | - | - | - |
| Adversarial Only | 20 | 571 | 202.6 | - | - | - | - | - | - |
| Complementary and Supplementary | - | - | - | 11 | 516 | 142.3 | 5 | 587 | 82.4 |
| Supplementary and Adversarial | 13 | 634 | 197.9 | - | - | - | - | - | - |
| Complementary and Adversarial | 5 | 580 | 232.7 | 16 | 505 | 157.6 | 9 | 544 | 155.5 |
| All Three | 8 | 500 | 151.1 | 36 | 598 | 210.0 | 23 | 605 | 239.6 |
| None | 24 | 575 | 191.0 | - | - | - | 14 | 530 | 170.0 |
Table 3.
Mean amount spent PTG spent on school by PTG activities and time period.
Table 3.
Mean amount spent PTG spent on school by PTG activities and time period.
| | Prior to 2008–2009 | 2008–2009 | 2009–2010 |
|---|
| PTG Activities | N | Mean | SD | n | Mean | SD | n | Mean | SD |
|---|
| Complementary Only | - | - | - | 18 | $14,250 | $11,785 | 29 | $20,345 | $26,368 |
| Supplementary Only | 6 | $7917 | $8685 | - | - | - | - | - | - |
| Adversarial Only | 20 | $20,527 | $18,798 | - | - | - | - | - | - |
| Complementary and Supplementary | - | - | - | 11 | $15,094 | $12,323 | 5 | $11,406 | $8224 |
| Supplementary and Adversarial | 13 | $32,077 | $35,654 | - | - | - | - | - | - |
| Complementary and Adversarial | 5 | $17,800 | $16,284 | 16 | $24,813 | $33,355 | 9 | $18,667 | $15,199 |
| All Three | 8 | $18,648 | $15,308 | 36 | $26,986 | $24,053 | 23 | $34,086 | $25,980 |
| None | 24 | $26,075 | $26,180 | - | - | - | 14 | $16,786 | $14,613 |
In the time period prior to 2008–2009, PTGs using supplementary activities tended to be associated with poorer schools (66% needing free and reduced lunch), as shown in
Table 1; while PTGs using adversarial or supplementary/adversarial activities had fewer students on free and reduced lunch (43% and 44%, respectively). In 2008–2009, the range of the percent of students on free or reduced lunch narrowed. PTGs using all three activities or the complementary/supplementary activities averaged 41% of students on free or reduced lunch. The eighteen organizations using only complementary activities were associated with schools with an average of 53% of students on free or reduced lunch. For 2009–2010, PTGs planning to use all three activities were associated with schools averaging only 34% of students on free or reduced lunch. PTGs using only complementary activities were partnering with schools with an average of 52% of students on free or reduced lunch. This suggests a relationship between the student population’s resources and PTG activities. PTGs serving schools with poorer students seem to favor supplementary and complementary activities.
Table 2 shows the mean number of students at the schools associated with PTGs employing various activity mixes. In the time period prior to the 2008–2009 school year, PTGs using supplementary activities were associated with schools averaging 491 students. PTGs with supplementary and adversarial activities were associated with schools averaging 634 students. In the subsequent time period, however, the number of students varies much less across the different activity groups. In 2008–2009, the average number of students ranges from 505 (complementary and adversarial PTGs) to 598 (all three activities). Then, in 2009–2010, the average number of students ranges from 530 (none of the three activities) to 605 (all three activities). This could indicate that PTGs associated with larger schools employ more activities overall.
Finally,
Table 3 depicts the amount PTGs reported spending on the school by activity groups. Prior to 2008–2009, PTGs employing only supplementary activities spent, on average, $7917 in supporting their schools. By contrast, PTGs with supplementary and adversarial activities spent an average of $32,077 on their schools. In 2008–2009, schools using only complementary activities spent an average of $14,250 on their schools compared to an average of $25,986 spent by PTGs employing all three activities. Those PTGs planning to use complementary and supplementary activities in 2009–2010 spent an average of $11,406. PTGs planning to use all three activities in the next year spent an average of $34,086 on their schools. All in all, PTGs using more activities, including adversarial activities, spent more on average on their associated schools.
5.3. Activity Groups and Mission Match
We also looked at stated mission components for the PTGs within the eight different activity groups for the three different time periods (see
Table 4 for descriptive statistics of missions). Analyzing self-reported missions, we created four dummy variables to capture the elements of each PTG’s mission. To code missions, we examined the umbrella PTA group’s mission statement to develop our categories, then reviewed self-reported mission statements from the PTGs in the sample and coded whether those items were in the PTG’s mission. We found four distinct mission foci: (1) resources (gathering resources for the school); (2) engagement (enhancing involvement, participation and communication); (3) advocacy (influencing policy); and (4) other (promoting education in other ways).
Table 5 shows the PTG mission elements by time period and activity group.
Table 4.
PTG mission elements.
Table 4.
PTG mission elements.
| Mission | N | Percent |
|---|
| Resources | 41 | 50% |
| Engagement | 45 | 55% |
| Advocacy | 16 | 20% |
| Other | 8 | 10% |
Table 4 shows the percentage of organizations in each group that were coded as having that element in their mission. For instance, 50% of PTGs using only complementary activities prior to the 2008–2009 school year time period had a resources component to their mission. Remember, the activity groups in each time period are based on the PTG’s activities during that time period, so
Table 5 shows how well those activities match up with the organizational missions. The data imply that these PTGs are not closely aligning their activities with their missions. We will use advocacy as an example. Advocacy fits under adversarial in our framework. In
Table 5, we see that for the 2008–2009 school year, two groups (complementary and adversarial, all three activities) use adversarial activities to some extent. However, a very small proportion of the organizations falling into these clusters had advocacy as a stated part of their mission (6% and 36%, respectively). Most of these organizations are engaging in an activity that is not within their stated mission. Organizations are also not engaging in some activities that are part of their stated mission. For instance, prior to 2008–2009, 60% of the PTGS had an engagement component to their mission, but they only engaged in adversarial activities. We can reasonably conclude that many of these PTGs are experiencing mission drift, because their activities do not strongly match their missions.
Table 5.
Percent PTG mission elements by PTG activities and time period.
Table 5.
Percent PTG mission elements by PTG activities and time period.
| | Prior to 2008–2009 | 2008–2009 | Planned for 2009–2010 |
|---|
| PTG Activities | Resources | Engagement | Advocacy | Other | Resources | Engagement | Advocacy | Other | Resources | Engagement | Advocacy | Other |
|---|
| Complementary Only | - | - | - | - | 50% | 39% | 0 | 17% | 41% | 52% | 3% | 14% |
| (n= 18) | (n= 18) | (n= 18) | (n= 18) | (n= 29) | (n= 29) | (n= 29) | (n = 29) |
| Supplementary Only | 50% | 67% | 0% | 0% | - | - | - | - | - | - | - | - |
| (n = 6) | (n = 6) | (n = 6) | (n = 6) |
| Adversarial Only | 40% | 60% | 30% | 10% | - | - | - | - | - | - | - | - |
| (n = 20) | (n = 20) | (n = 20) | (n = 20) |
| Complementary and Supplementary | - | - | - | - | 55% | 55% | 18% | 18% | 80% | 40% | 45% | 0 |
| (n = 11) | (n = 11) | (n = 11) | (n = 11) | (n = 5) | (n = 5) | (n = 5) | (n = 5) |
| Supplementary and Adversarial | 46% | 38% | 15% | 15% | - | - | - | - | - | - | - | - |
| (n = 13) | (n = 13) | (n = 13) | (n = 13) |
| Complementary and Adversarial | 60% | 0 | 20% | 40% | 63% | 56% | 6% | 6% | 89% | 44% | 0% | 11% |
| (n = 5) | (n = 5) | (n = 5) | (n = 5) | (n=16) | (n = 16) | (n = 16) | (n = 16) | (n = 16) | (n = 9) | (n = 9) | (n = 9) |
| All Three | 63% | 75% | 13% | 0% | 44% | 61% | 36% | 6% | 52% | 65% | 43% | 4% |
| (n = 8) | (n = 8) | (n = 8) | (n = 8) | (n = 36) | (n = 36) | (n = 36) | (n = 36) | (n = 23) | (n = 23) | (n = 23) | (n = 23) |
| None | 54% | 58% | 25% | 8% | - | - | - | - | 36% | 57% | 29% | 7% |
| (n = 24) | (n = 24) | (n = 24) | (n = 24) | (n = 14) | (n = 14) | (n = 14) | (n = 14) |
6. Discussion
Our analyses indicate that PTGs are changing their activity mix, possibly in response to the recent economic downturn and possibly as part of a larger trend. While 20 of the PTGs reported they were only undertaking adversarial activities prior to the 2008–2009 school year (and prior to the economic crisis), there are no PTGs that fit that same profile in the 2008–2009 school year or that anticipate fitting that profile in the 2009–2010 school year. While adversarial activities have not disappeared, indeed, 52 PTGs report undertaking such an activity during the 2008–2009 school year compared to 46 overall prior to 2008–2009; they now seem subordinated to supplementing classroom activities. Of the 20 organizations that pursued only adversarial activities prior to 2008–2009, 11 of these PTGs undertook all three types of activities during the 2008–2009 school year, while seven performed complementary and supplementary activities only. The economic downturn may have exacerbated this diminution of advocacy; in the next school year (2009–2010), only 32 PTGs indicated that they plan to undertake this type of activity.
We find further evidence of PTGs that increasingly focus on activities of supplementing the classroom mission (i.e., undertaking supplementary activities) when we examine open-ended responses for activities they plan to do in the upcoming year in response to financial challenges. Many PTGs indicate their primary strategy will be to be more thrifty and selective about how they spend their dollars (24 organizations), including shifting spending away from extras to items more directly related to classroom instruction. One PTG president said, “Money will be earmarked more for the classrooms and supplies before some of the more ‘fun’ projects in order for the teachers to continue to have everything they need”.
Another president indicated, “We are setting aside funding that would normally be used for school improvements for the children, such as playground equipment and library books, knowing this money will probably have to be used for classroom instructional needs.” PTGs also indicated that they were trying to be more innovative in their fundraising strategies, such as seeking grants, having more fundraisers and generating new ideas for fundraisers.
PTG complementary strategies in the upcoming year also focus on increasing parent involvement through volunteering and attendance at meetings (11 organizations). One PTA said, “We are going to start a 3-for-free program, encouraging parents to spend time at school. We are going to start a ‘helping hands’ program to facilitate help from parents who are typically at work during the day.” Another PTG indicated, “We are trying new ways of raising funds for the school that do not require people to ‘spend’ money.” Additionally, a third PTG president said simply, “We are asking for additional parent volunteers.”
Recent articles in North Carolina newspapers about PTG activities and roles support what we found in our survey. PTGs in general are also heavily involved in forming relationships with other organizations, especially local businesses and churches, often serving as a liaison between other community groups, businesses and the school. For instance, a letter of thank you from a PTG parent in the Anson Record (a local newspaper) expressed gratitude for support from local businesses; “Thank you to all our community business donors who helped to make our annual PTA taco luncheon/fundraiser a success. Chris Sanford of IGA, Richard Melton of Papa Joes
TM, Wal-Mart, Mauneys
TM, Brian Thomas and Coca-Cola, The Hub, The Wadesboro Church of God, Wendy’s
TM Restaurant, and numerous of parents and students of the Anson County Early College School, who worked without pay and only a small thanks” [
29]. Another newspaper article talked about a PTG in Durham, NC, that partnered with a local business to plant an edible garden for the school’s students [
30].
One thing that is very telling about this research is the lack of a match between organizational mission and their activities. This study has shown that PTGs are altering their mix of activities, and these alterations may be in response to economic pressures. However, the missions of these organizations are not changing, and the changes in their activities seem to be creating mission drift in these nonprofit organizations. This can create further challenges for these organizations in the future, especially if the economic crisis is prolonged.
7. Conclusions and Next Steps
We began this paper by asking how nonprofit parent-teacher groups manage and change their activities to balance their missions with economic pressures to support schools facing budget shortfalls. The answer appears to be that PTGs’ leadership in their traditional roles is at risk. PTGs are facing accelerated mission drift as a result of the recent economic downturn. We extend Young’s framework to better understand the role that leadership plays. Most strikingly, for those PTGs that lead with advocacy as part of their mission (
n = 16), 40% did not indicate adversarial activities prior to the 2008–2009 school year, 13% do not report such activities in the 2008–2009 school year and several (38%) do not plan on undertaking such activities in the 2009–2010 school year. That only one-fifth of PTGs report this traditional, even foundational, activity as part of their mission raises questions about the extent to which (nonprofit) PTGs’ efforts are increasingly focusing on filling in for declines in government funding. During an economic downturn, PTGs may narrow their range of activities away from broader, longer-term public policy issues towards a narrower focus on classroom activities. This shift may allow PTGs to support core school operations, namely classroom instruction, in the short term. In essence, this may be a threat rigidity response [
31]. We also recognize the possibility of alternative causal mechanisms besides and beyond the economic crisis. Significant changes in state and federal policies during the period of study (though we are unaware of such) could be equally potent drivers of shifts in organizational activity.
The current research is partially limited by its generalizability to schools with some web presence. However, even among this population, we see evidence of widely-observed organizational phenomena (e.g., threat rigidity and mission drift). Going forward, we plan to explore this phenomenon by applying a framework we developed to understand how nonprofits manage mission and activity conflicts to this context. Using our survey data to identify interesting cases, we plan to develop in-depth case studies of how PTGs develop rules to manage their multiple, and potentially competing, activities.
We conclude that the partnership between some of the most prevalent nonprofits, parent teacher groups and government is changing as a result of external, economic forces. The influence of the economic downturn may fundamentally change the way these nonprofit organizations lead and function in society. This study serves both as a benchmark against which we can assess future nonprofit-public organizational relational shifts, as well as a notice that nonprofit-public partnerships appear to be fluid, diverse and subject to external pressures.


