Abstract
Many providers in adventure travel promote organised hiking and trekking tours. Such guided tours shall be engaging for the tourists and evoke positive attitudes towards enjoying nature. We present the Trekking Engagement Profile as a tool to evaluate engagement factors of such guided tours, based on engagement research performed in a different domain, namely evaluating engagement in museums and science centres. This tool shall strengthen the guides’ soft skills and enable them to increase engagement during an ongoing arrangement. For instance, the Trekking Engagement Profile can be applied when tourists indicate that the quality of a guided tour is not entirely to their liking. We show the viability of using the Trekking Engagement Profile in a small study with guides and participants of trekking tours offered by the Norwegian Trekking Association. Further, we offer guidance and charts to promote its practical use.
1. Introduction
Hiking and trekking in nature are for many a great leisure time and experience with a variety of skills to be mastered. Outdoor travel organisations offer organised guided trekking arrangements with a standard setup including board and lodging. As skills and expectations of tourists may vary, a standardised setup might not satisfy all trekkers, and adjustments to the setup may be necessary. In practice, such adjustments might be done on-site during a guided tour. We are looking into factors that might strengthen the tourists’ engagement, in the sense of growing their emotional involvement and commitment.
The Norwegian Trekking Association (Den Norske Turistforening, DNT) is Norway’s largest organisation for outdoor activities. For over 150 years, the DNT has promoted trekking and worked to improve conditions for all who enjoy the country’s broad range of outdoor activities. Over five hundred cabins across the country, over 20,000 km of marked foot trails and 7000 km of ski tracks, marked with stakes, are maintained by volunteers. The association has offered guided tours since 1932. These tours usually include overnight accommodation, food and companionship with other tourists as a package offer.
Guided tours last usually from some hours to some weeks and are designed for diverse target groups, such as adults, youth, children, seniors, singles or groups defined by age. Some tours have a specific theme while others are generic trekking tours following a specified itinerary. One or more skilled guides, who accompany the tourists and moderate the tour, lead guided tours. They are also responsible for logistics, assuring the tourists’ safety and solving all kinds of challenges that might occur underway. The guides shall also convey an appreciation of nature to the tourists. Note that DNT uses voluntary guides that have undergone a certification programme.
Trekking tour operators commonly assess user satisfaction using questionnaires that record feedback from participants. Common questions include how much the tourists enjoyed a trip, whether they would recommend the experience to others or whether they would like to participate in a similar trip again. However, such an assessment does not give evidence of factors that have an impact on satisfaction.
In the following, we posit that user satisfaction relates to the tourists’ engagement during guided trekking tours. Further, we argue that a modified version of the Engagement Profile (Leister et al. 2016), denoted as the Trekking Engagement Profile, is a suitable tool to characterise engagement in guided hiking and trekking. We intend to use the Trekking Engagement Profile as a tool for guides, to evaluate engagement factors and to consider adjustments to potentially increase engagement.
Our contribution is to apply the concept of the Engagement Profile to a wide range of hiking and tracking arrangements. After presenting related work (Section 2), we present the Engagement Profile and modify it to characterise factors of engagement for guided trekking tours (Section 3). In Section 4, we present how the Trekking Engagement Profile can be used as a tool to evaluate guided tours and report from a study performed with tourist participants and guides to show the viability of the Trekking Engagement Profile. We discuss our findings (Section 5), before concluding (Section 6).
2. Background, Related Work and Approach
The United Nations World Tourism Organization (2014) describes adventure tourism as being a resilient and sustainable form of tourism, attracting high-value customers and supporting local economies. They describe a framework in which adventure tourism can thrive for the good of tourists, organisers, the local population, the environment, cultural understanding and so forth.
2.1. Background and Related Work
To assess travel and leisure experiences, metrics from marketing research are frequently used. Hosany and Gilbert (2010) gave a comprehensive overview of relevant literature that includes the role of emotions for the assessment of travel experiences. They pointed out that the role of emotions in generic marketing and in the travel industry differ. A considerable body of research deals with assessing the attractiveness of travel destinations, where an assessment is usually performed pre- or post-experience rather than during the experience. Unlike factors such as accommodation or food, it is not viable to modify the characteristics of a travel destination on a short term in case of dissatisfaction among tourists. Further, the result of an assessment does not tell us what to modify.
In contrast, travel experiences that are not bound to specific destinations can be modified while ongoing. Guided hiking and trekking tours, as described here, consist of a variety of tangible and intangible components that have an impact on the tourists’ experience and satisfaction. Such factors in tourism have been identified by several authors (Beerli and Martín 2004; Rajesh 2013) for travel destinations. For generic trekking tours that are not bound to specific destinations, we posit that the following factors are the most important: (a) the organisation of the guided trekking tour; (b) the quality of the infrastructure (lodging, food, paths, transport); (c) the attractiveness of the concrete itinerary (sights, attractions, area, difficulty, season); (d) environmental conditions (weather, temperature, drought, moisture, flood) during the arrangement; (e) information given to the tourists prior and during the guided tour; (f) the skills and knowledge of the guides; and (g) skills, context, expectations and attitudes of the single participant. It is obvious that infrastructure, the attractiveness of the area and weather conditions can usually not be influenced by an organiser. Additionally, skills, context, attitudes and behaviour of the single tourist are normally beyond the control of the organiser.
The United Nations World Tourism Organization (2014, p. 64) wrote about adventure guiding standards: “Guides are perhaps a tour operator’s most important resource. They are on the front lines with guests during a trip and bear responsibility not only for guest safety but also guest learning and enjoyment.” They also noted that “a successful, responsible and safe adventure tourism operation requires a more expansive set of skills and processes than the purely technical, such as managing diverse groups of people or entertaining guests of different ages” (ibid.).
Therefore, the guides’ education to increase their skills and knowledge (Houge 2010) is of great importance. The guides need to exercise leadership, which can be defined as to achieve goals through organising activities in a group of people (Store Norske Leksikon n.d.). Guides’ leadership skills include hard skills (first aid, navigation, how to operate things, knowledge, physical abilities) and soft skills (communication, empathy, decisiveness, time management, flexibility). The classification into hard skills and soft skills is disputed (Shooter et al. 2009). A third category has been proposed under several names (such as conceptual, operational, meta-skills) and classification into technical skills, interpersonal skills and judgement and decision-making has been proposed (ibid.). We note that the distinction between hard skills and soft skills is sufficient for the frame of our work.
Priest and Gass (2005) presented a comprehensive guide on how to exercise leadership in outdoor arrangements, covering a variety of aspects. Martin et al. (2017) defined the following three goals for outdoor leadership as (1) to ensure the safety of the tourists, (2) to ensure protection and preservation of the natural environment, and (3) to enhance the quality of the outdoor experiences for tourists.
There is some tool support for tour guides such as navigation aids (maps, charts, electronic devices), route planning tools, risk assessment charts, packing lists, instructions for mountain medicine, checklists for safety-related issues (avalanche, river crossing, glaciers, climbing), emergency checklists, and leaflets for conveying nature (geology, botany, fauna). However, there is still a lack of tools that support soft skills, including how to increase tourists’ engagement, experience and satisfaction.
Mediating a subject to participants of guided tours has similarities to informal learning arenas, such as informal learning in science centres and museums (Leister et al. 2016). In such arenas, participation is voluntary and tourists cannot be forced to learn or experience more if they do not want to. Hofstein and Rosenfeld (1996) distinguished between formal and informal learning; informal learning is characterised by attributes like voluntary, unstructured, unsequenced, non-assessed, open-ended, learner-led, non-curriculum-based, many unintended outcomes, less directly measurable outcomes, social intercourse and so on. In informal learning arenas, the learning outcome relates to engagement: being engaged promises better learning outcome and increased willingness to learn.
Mårtensson and Roxå (2016) presented a variety of definitions for engagement, such as the one by Reeve et al. (2004): “Engagement refers to the behavioural intensity and emotional quality of a person’s active involvement during a task.” Lemke et al. (2015) defined engagement as the“affective involvement in and commitment to an activity, goal, practice, group or community that enhances the quality and quantity of participation despite obstacles, setbacks, or frustrations; distinguished from enjoyment.”
The Engagement Profile (Leister et al. 2016) was developed as a structured way of quantifying the characteristics in exhibits along eight dimensions, each of which is given a value between 0 and 5 according to the descriptions in a table. Its dimensions represent the degrees of competition (C), narrative elements (N), interaction (I), physical activity (P), visitor (user) control (U), social aspects (S), achievements awareness (A), and exploration possibilities (E). The Engagement Profile was used as a tool in the design process to create and evaluate exhibits (Leister et al. 2017). A modification of the Engagement Profile has been developed to characterise a robotic teaching assistant (Cooney and Leister 2019). Our goal was to adapt the Engagement Profile, so it can be used as a tool for guided tours.
As common in the travel industry, we use in the charts the term pax for the participants of such trekking tours, although they have a more active role than bus or railroad passengers for which this term originally was created.
2.2. Research Objective and Approach
The research objective in our work has been to identify the engagement elements of guided trekking tours. Our intention was to modify the Engagement Profile developed for the evaluation of exhibits and develop a tool for guides, as well as a survey instrument. We have hypothesised that a modified Engagement Profile can be used to characterise engagement elements of guided trekking tours.
We have used an explorative approach and adapted the original Engagement Profile to its new domain, resulting in a draft of the Trekking Engagement Profile. This profile has been used informally while guiding tours and we have applied adjustments where necessary, resulting in its final version (Leister 2017).
To show the suitability of the Trekking Engagement Profile, we have conducted a pilot consisting of surveys and analyses with a limited number of tourists. To facilitate the survey instrument, we have developed the questionnaires for the evaluation step. The purpose of this pilot has been to uncover any unexpected findings. As we could not identify such issues, we have explored the Trekking Engagement Profile qualitatively and in comparison with similar studies using the Engagement Profile for exhibits.
3. Characterising Factors for Engagement
The Trekking Engagement Profile has been developed as a modification of the Engagement Profile. The number of dimensions has been kept unaltered but the table entries describing the eight dimensions have been adjusted. Using the Trekking Engagement Profile implies that external influences are not taken into account. External factors that cannot be influenced, such as the environment, weather, temperature or landscape need to be considered separately, as well as properties that belong to the context, such as social factors, institutional factors or recent incidents personally or globally (Leister et al. 2016, p. 55).
Note that the Trekking Engagement Profile has not been designed to characterise tourists but the arrangement of guided tours. However, instances of a Trekking Engagement Profile chart can be developed to describe preferences of specific target groups, such as school classes, age-destined groups, visitors from abroad, families or people with specific hobbies and interests.
3.1. Modifying the Engagement Profile to Guided Trekking Tours
To be suitable for guided trekking tours, we have modified the criteria for grading the eight dimensions by replacing exhibit-specific properties with characteristics that fit typical trekking tours in a broad sense. The detailed description for all 48 entries can be found in Table 1. Further, Figure 1 shows the related graphical chart where the entries are presented in its short form. Some remarks about the single dimensions are in order.

Table 1.
Explanation of the values used in the Trekking Engagement Profile, from participant’s viewpoint (not: guides’ viewpoint). The letters in the left column represent competition (C), narrative elements (N), interaction (I), physical activity (P), visitor (user) control (U), social aspects (S), achievements awareness (A), and exploration possibilities (E), respectively.
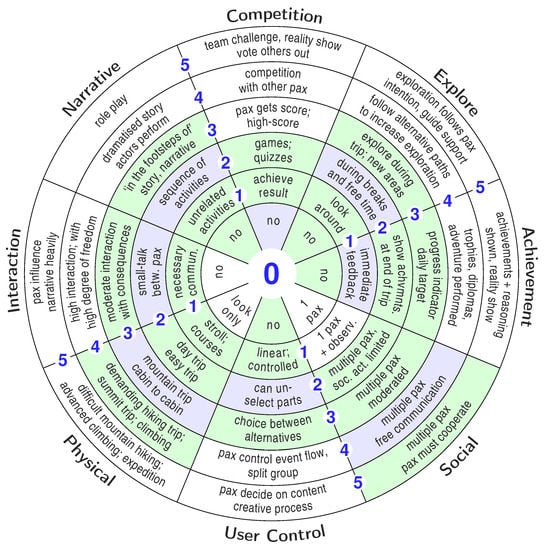
Figure 1.
Trekking Engagement Profile with annotation of the fields. In addition, the characteristics of typical guided trekking tours are visualised with green colour; blue fields represent the values for a typical guided trekking tour from cabin to cabin.
- Competition:
- There is a wide span, usually ranging from no competition element (e.g., senior walk in nearby woods), via arranging games, quizzes and competitions during the tour (this is quite common for arrangements with children or trips that last several days). On the extreme side, the range covers game and reality show concepts where tourists compete amongst each other, including the elimination of a losing participant from the arrangement.
- Narrative:
- Although most of the guided trekking tours consist of a linear succession of events according to a programme or plan, there are concepts that offer scenographic settings with a story; for example, an arrangement in the footsteps of a historical person or visiting an area where historical events took place. One could even go a step further and offer guided trekking tours involving role play, where each tourist is given a specific role.
- Interaction:
- Interaction with the guides and other tourists can range from necessary interaction, via conversations between tourists, to discussions about the specific content of an arrangement. Such discussions can, for instance, result in alternative itineraries, additional activities, or changes in timing. In concepts with very high interaction, tourists interact with each other to design the content of an arrangement.
- Physical:
- This dimension relates to how physically demanding a trekking tour is. We observed that for the physical factor there are relationships to the diverse hiking scales, such as the grading of the DNT (Norwegian Trekking Association 2017), the Swiss Alpine Club (SAC) trekking scale (Swiss Alpine Club n.d.), the Yosemite Decimal System (YDS), and others (Wikipedia n.d.). As a note, the lowest value describing “observation only” was included for completeness. One could consider watching episodes of the slow-television genre (Ljøen 2018), popularised by the Norwegian Broadcasting Corporation (NRK) during the last decennial.
- User Control:
- User control can range from no control (participation only), via selecting activities or adding content, to making considerable changes to its content. Note that a high degree of user control can have an impact on the safety, as unforeseen risks can occur in activities that are not planned beforehand. Therefore, safety considerations might limit user control.
- Social:
- This dimension describes the number of tourists involved and the interaction in-between them. It ranges from one tourist with and without observers, via many tourists communicating, to many tourists cooperating and depending on each other. This highest class is most relevant for demanding activities (climbing, glacier tour) where tourists need to master specific tasks.
- Achievements:
- To motivate tourists, the guides can make the tourists’ achievements noticeable. The scale ranges from no achievements, via immediate response (e.g., commenting something well done) and evaluation at the end to giving trophies, diplomas or tokens. In an extreme variant, the awarded tokens may have consequences. This is common in game concepts (e.g., withdrawing privileges from those who have not achieved sufficiently).
- Explore:
- Exploring nature is a vital part of trekking tours but might be limited, due to safety and organisational considerations. However, there are concepts where tourists might explore on their own hand and even define their own experience, supported by guides.
The Trekking Engagement Profile can be used (a) to evaluate the overall concept of (existing or planned) guided trekking tours, and (b) to make informed decisions during an ongoing tour when a guide becomes aware that (minor) changes could increase the tourists’ engagement and experience.
3.2. The Trekking Engagement Chart
The Trekking Engagement Profile can be graphically presented in a chart that is similar to the graphical representation for the original Engagement Profile (Leister et al. 2017). In this chart, the eight dimensions are placed as slices of a disk. Each slice is divided into six fields that can be marked with colours. Each field can be identified by a short description of the respective property given in Table 1.
The Trekking Engagement Chart shows the range of suitable characteristics for a category of tours as the green fields. The blue fields indicate the characteristics for specific implementations of such tours. For instance, Figure 1 shows the Trekking Engagement Chart for a several days guided trekking tour from cabin to cabin.
To determine the values in the Trekking Engagement Chart, an evaluator considers each of the eight dimensions and determines which phrase (or range of phrases) fits best. It is recommended that several evaluators discuss their set of characteristics and agree on an understanding.
In an assessment of guided tours, the evaluator marks the fields that are desired by the organiser (green), identifies the fields for the specific tour (blue) and considers the following: If a characteristic for specific guided tours appears outside the green area, this should trigger a reflection with the stakeholders, that is, the organisers or guides. There might be good reasons why one might accept characteristics outside the standard template, for instance facilitating a guided tour for a specific target group. For example, one might want to add more competition to trips developed for younger tourists or a more physical experience for tourists preparing for an expedition.
3.3. The Tourists’ Opinion
After having participated in a guided tour, tourists are requested to answer a poll (a) about desired modifications for each dimension and (b) about their satisfaction level. For each of the eight dimensions of the Trekking Engagement Profile, the tourists indicate whether they want the respective dimension unaltered in its intensity or if they want it to be increased or decreased by one or two steps. The related questions for such an assessment are presented in Table 2.
Table 2.
Formulation of the questions and scales for the tourist’ opinion.
The assessor can apply simple statistics for the evaluation, using the median value for each dimension that tells whether the tourists want to decrease, keep unaltered or decrease a respective dimension. For detail analysis, we can also use mean values, the 10–90% percentiles and the percentage values of those who want to decrease, keep unaltered or increase the respective domain. The statistics can be visualised in the Trekking Engagement Opinion Chart (see Figure 2), where the median values are shown as orange lines and the percentiles are graphically presented as hatches. If more than 50% of the participants in the poll indicate the same (no change, positive, negative), this is marked with a colour in the inner ring of the opinion chart (blue for no change, green for positive, red for negative). Should the tourists’ opinion indicate an expected experience outside the green area or considerably deviate from the current concept, this should trigger a consideration about possible changes to the design of a tour. For instance, in the hypothetical case that participants repeatedly would have wanted more of the A-dimension (Achievements), the organiser could consider to award diplomas or trophies.
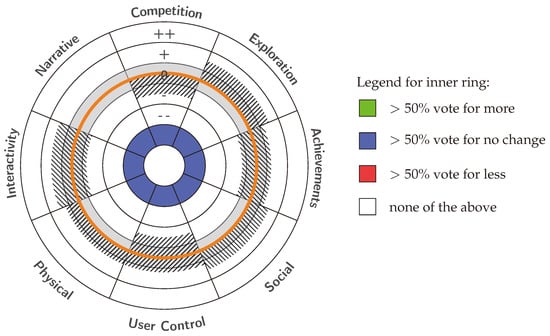
Figure 2.
The Trekking Engagement Opinion Chart (24 participants) visualises the statistics from the tourists’ opinion. Hatches represent the area between the 10% and 90% percentiles; orange lines represent the median.
To assess the tourists’ satisfaction, tour operators employ questionnaires that record feedback from participants. Our questionnaire reflects properties whether these participants liked, recommend and intend to repeat participation of a tour. The related questions are presented in Table 3. The responses are analysed using simple statistics (median, mean value, percentiles).
Table 3.
Formulation of the satisfaction questions and scales.
4. Case Study: Applying the Trekking Engagement Profile to Trips from Cabin to Cabin
In the following case study, we have applied the Trekking Engagement Profile to trekking tours from cabin to cabin. We show how to characterise such tours, how guides can consider changes during an ongoing trip and how to evaluate the tourists’ opinions using a questionnaire.
A typical guided trekking tour of several days from cabin to cabin organised by the DNT is as follows: The tourists meet one or two guides at Oslo Central Station at the announced time. After a train and bus ride of some few hours, the group arrives at the first cabin, possibly after a short trip on foot, in case the first cabin is not directly accessible from the road. The arrangements include all meals and accommodation.
A typical day starts with breakfast at 8 a.m.; the group is ready at 9 a.m. with rucksack including packed lunch. Trekking along the planned route follows with the group members ideally being at sight distance to each other; pauses and planned lunch underway until one reaches the next cabin; dinner at about 6 or 7 p.m.; thereafter information for the next day and time on their own, followed by bedtime.
Minor variations from this schedule are possible but itinerary and hours for the meals are fixed within certain flexibility as unforeseen incidents can happen. Changes to other parameters from this standard setup are at the discretion of the guides.
4.1. Characterising Guided Trekking Tours
Considering the eight dimensions of the Trekking Engagement Profile for a typical guided tour, there are no or few competition elements in this concept. The narrative is rather linear and, usually, interaction does not have an impact on the outcome of the trip. While the tour is rather physical, the tourist has only limited control. In contrast, the social dimension is rather high. The dimensions achievement and exploration are rather low due to limitations given by the overall framework of the trip. Note that allowing free exploration would require more resources than envisaged. The Trekking Engagement Profile of a typical cabin-to-cabin trip is presented as blue coloured fields in Figure 1.
4.2. How to Apply Changes
When becoming aware that the engagement level among the tourists is about to decrease, the guides can evaluate each of the eight dimensions of the Trekking Engagement Profile. Various changes can be applied to a trip without compromising the overall concept.
When applying adjustments to a guided trekking tour, the guides must be aware of limitations that are set by the organiser. First of all, the safety of tourists is more important than other properties. Therefore, no activities that might set the tourist in danger are compatible with the overall concept. Further, activities are incompatible when they may harm the organiser’s reputation, breach environmental goals, are unethical or illegal. In the following, we reason for possible changes that can be applied to guided trekking tours:
- Competition:
- The concept for cabin-to-cabin trips contains usually no or only few competition elements. To increase the competition element, one can consider introducing quizzes, minor tasks to be performed in a competition (e.g., who is the best to build a cairn), or a bet to be the first to reach a given goal. This could also be applied to a sub-group of tourists, as probably not all of the tourists would embrace such a competition element.Note that a very high competition dimension would be in settings as reality shows where tourists would leave the trip if certain conditions apply. Such concepts are not compatible with the goals of the standard guided trekking tour.
- Narrative:
- The narrative of a trip describes the succession of activities and events. It is rather fixed by the overall concept, such as trekking from cabin to cabin. However, one could consider adding activities that do not interfere with the concept, such as short presentations or activities during free time in the evening.
- Interaction:
- Guided trekking tours offer usually many opportunities for interaction; however, when the group is spread out, the possibility for interaction is reduced. Gathering the group or small-talk with tourists can trigger more interaction. Note, however, that some tourists might prefer not to interact more than necessary, which must be respected.
- Physical:
- Guided trekking tours are rather physical. For tourists who want more physical activities one could consider facilitating extra activities or choices, as long as these do not interfere with the overall concept.
- User Control:
- There are few possibilities to give more user control. Giving freedom on the choice of activities on days with consecutive overnight stays at the same cabin or micro decisions can increase user control.
- Social:
- The social profile is rather high. However, while the possibility for the social dimension is present, personality traits and preferences of tourists could restrict this.
- Achievements:
- Experiencing nature can be considered as a reward; thus, increasing the achievement dimension might strictly not be necessary. However, distributing tokens when a tourist has achieved something could be viable. However, one should be careful when selecting tokens and conditions when tokens are awarded, as this involuntarily could create attention to issues that tourists might want to keep private.
- Explore:
- Due to limited resources and for safety reasons, the possibilities for extra exploration are limited. Exploration is usually an individual activity. The tourists can explore in their spare time and at their own risk, as long as the safety conditions are met (e.g., tourists are not supposed to be left alone in free nature).
Table 4 summarises modifications that can be applied to ongoing trekking tours. We also show caveats for unfortunate modifications, as the impact on health, safety and enjoyment must be considered before these changes are engaged. In a concrete setting, the guides must use their soft-skills and probe the tourists’ opinion.
Table 4.
Means to decrease and increase engagement during guided trekking tours.
4.3. Evaluating the Tourists’ Opinion
To explore how the Trekking Engagement Profile works in practice, we performed a study in Autumn 2017 among voluntary guides and participants of guided trekking tours organised by DNT Oslo. The participants in the study were invited through a community Facebook group for guides and by email. Using online questionnaires implemented with Google Forms, we asked the participants to answer the questions shown in Table 2 and Table 3 for the trekking tour they last participated in. Additionally, we asked for gender and age group but no sensitive personal data were queried. Guides were allowed to answer what they assume the participants of the tour they guided would have answered.
A total of 24 persons answered the poll anonymously; nine of them answered as participants and the others as tour guides. The participants (11 female, 13 male) were adults in the age groups of 25–39 (4), 40–59 (9) and 60–75 (11). The data are available in a Supplemental File (Data S1). The results from the analysis are shown in Table 5 and are visualised in Figure 2. Due to the low number of responses, we abstained to analyse the results along with gender or age groups.
Table 5.
Results from the opinions of 24 participants, showing mean, std.dev., 10% percentile, median, 90% percentile and percentages for each of the five alternatives.
As shown in Table 6, trekking tours have a very high satisfaction rate. Note, however, that scored lower than the others; the reasons might be that participants might have had negative experiences during such tours, such as a fall or other physical or medical problems. was not part of our questionnaire, as we did not expect unbiased answers from participating guides who answered on behalf of participants.
Table 6.
Results from the questions , showing mean, standard deviation, 10% percentile, median, 90% percentile and percentages for the respective values of the Likert-scale.
The analysis indicated that the participants of the poll generally did not want to alter the setup of trekking tours. The category for exploration showed the most positive value with a mean value of 0.13, while interaction, physical activity and social were at 0.08, each. However, the categories competition, user control and achievements were on the negative side with mean values of −0.50, −0.13 and −0.04, respectively. We interpreted this that the participants neither embrace competition nor user control.
For the questions to , the responses showed 95%, 81%, 90% and 100% on the positive side, respectively. We interpreted this that the participants generally liked their trekking tour.
The mean value of the mean values for all eight categories was −0.04, which is close to zero. As a comparison, similar studies in science centres and museums (Leister et al. 2017), gave a positive value of about 0.4. From this, we inferred that the participants did not expect modification of the trekking tour setup.
Notice that the number of participants in the poll was too low to draw a strong conclusion and the selection of participants was not representative Therefore, the study cannot give a strong evidence. Further, we are unaware of the impact of asking a mixture of guides and participants, instead of participants only. We did not have the funding to ask a broader representation of participants at that time. We recognise this as a clear limitation in our study, why its results only can give indications. However, the study is able to show how the Trekking Engagement Profile is supposed to be used in practice.
5. Discussion
The objective of the Trekking Engagement Profile has been to provide an evaluation tool for guided hiking and trekking tours and to strengthen the soft skills of the guides by giving them a practical tool. We discuss its suitability for these application areas.
5.1. Suitability of the Trekking Engagement Profile
The transition from the Engagement Profile for exhibits to the Trekking Engagement Profile was rather straight forward, as was the formulation of the questionnaires for the new application area. The eight dimensions seem relevant and changes to each dimension can be evoked by concrete means, as shown in Table 4.
After having tried the Trekking Engagement Profile out in practice while guiding tours, we did not find an obvious gap that would suggest that a dimension would be missing. When considering new dimensions that potentially could be added, we need to ensure that these are not already sufficiently covered by a combination of other dimensions or by frameworks and tools that are already in use. For instance, charts covering safety, navigation or mountain medicine are already available and there is no need to integrate these into our work.
5.2. Use of the Trekking Engagement Profile On-Site
For the guides on-site it would be unrealistic to perform analyses of engagement using questionnaires during a guided trekking tour. However, when talking to the tourists the guides could ask them indirectly how satisfied they are. They could probe the opinion guided by the Trekking Engagement Profile chart and the questionnaire in Table 2 to find out which dimension would need an adjustment. For example, a guide could ask “Would you like to participate in a quiz game in the evening?” to find out whether tourists would be in favour of more competition elements. If there should be indications that point in a negative direction, guides could use countermeasures informed by Table 4.
Note that applying the Trekking Engagement Profile to increase engagement will not always be successful, as the tourists participate on their own will and with their own personal preferences. Therefore, tourists might not wish to participate in “extra” activities if they do not want to. Personality, abilities, skills, and other characteristics can have an impact when choosing means to increase engagement. Further, we request the guides to respect the personal preferences of every single tourist.
When considering means to increase engagement, these need to conform to the preferences of members in the target group and be within the limitations given by the context. For example, safety, extra costs, timing, compatibility with the framework and values must be carefully considered before actions are engaged.
As noted above, using the questionnaire to gather the tourists’ opinion can be considered intrusive and not viable on-site. In addition to guides’ skills to unobtrusively retrieve such information, one could consider using sensors of some kind to recognise engagement. There is a variety of attempts to retrieve emotion by using cameras (Nezami et al. 2018; Terzis et al. 2010), sensors such as electrocardiograph (ECG), electroencephalograph (EEG) or electrooculograph (EOG) (Zennifa et al. 2018), motion sensors (inertial, gyroscope, magnetometer), positioning devices (Mautz 2012) or combinations of these. However, most of these sensor technologies work sufficiently only in controlled settings, as experiments in museums and science centres have shown (Leister et al. 2018, p. 69). Further, it is questionable whether engagement-scanning activities would be unobtrusive enough and socially acceptable. Thus, the soft-skill of the guides to sense the tourists’ engagement level is still the right choice.
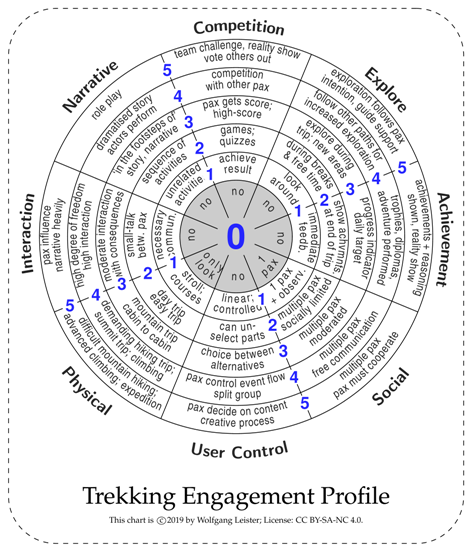
To be used in practice, we present a pocket version of the Trekking Engagement Profile in Appendix A. A printed copy of this chart can be laminated and used as a handy tool on-site, to support making considerations about tourists’ engagement factors. Further, an Android app to create generic Engagement Profiles is available as Supplemental Material (App S2).
5.3. The Trekking Engagement Profile as a Measuring Tool
The Trekking Engagement Profile can be useful, as an evaluation tool after a trekking experience has taken place. As shown, engagement factors from past hiking tours can be retrieved to modify elements of the tour setup, for the benefit of future guided hiking and trekking tours. To achieve this, tour organisers need to assess their guided tours using the chart given in Figure 1, before asking tourists about their opinion. The data assessment including the questionnaires (see Table 2 and Table 3) is best performed as part of evaluation questionnaires sent out to each participant.
The data collection will usually happen days after an experience. Thus, an evaluator needs to take into account that memory biases can occur in such a setting (MacKenzie and Podsakoff 2012) and post-hoc experiences can have an impact when assessing subjective engagement factors.
5.4. About the Case Study
The purpose of the case study has been twofold: (1) to evaluate the method in a pilot and (2) to gather knowledge about typical trekking tours. The pilot could show the viability of the method, as discussed above, albeit the poll was not representative. To perform a more representative study, the questionnaires must be integrated into the tour operators’ assessment systems. However, before performing this step, we first needed to evaluate our method.
6. Conclusions
The Trekking Engagement Profile was designed to be a practical tool for guides to evaluate trekking experiences, both on-site and for evaluation purposes after a tour. This tool consists of a graphical chart that allows stakeholders to characterise hiking and trekking tours. To adjust such tours on-site, tourists are asked informally alongside the eight dimensions of the Trekking Engagement Profile. We have outlined concrete modifications for each of the engagement factors. Further, we presented a set of questionnaires that allow the post-hoc evaluation of engagement factors.
The Trekking Engagement Profile was derived from a similar tool to evaluate engagement in exhibits. While keeping the number of factors that describe engagement unaltered, the model was adjusted to its new domain. After having used the Trekking Engagement Profile in practice, we conclude that it is suitable to support the soft-skills of the guides. The Trekking Engagement Profile can describe concretely which potential modifications to apply, such as adding quizzes as extra competition elements or allowing for more exploration.
We studied the Trekking Engagement Profile for trekking trips from cabin to cabin, using the questionnaires presented in this essay. We did not find any evident need for changes to be applied to the trekking tours of DNT Oslo. However, we could find hints that the participants of the study neither welcome increased competition nor increased user control. On the other hand, they wished slightly more interactivity and social factors. However, the evidence for this was weak.
The use of the Trekking Engagement Profile for guided hiking and trekking tours is promising. To promote its use, we have made the Trekking Engagement Profile charts available in a handy pocket format as a tool to be used on-site (see Appendix A).
We could demonstrate the applicability of the Trekking Engagement Profile with our pilot study. However, as we cannot claim that our study is representative, a study with more participants needs to be performed for stronger evidence. A study covering diverse arrangement types and stakeholders (e.g., trip from cabin to cabin, day trip with seniors, arrangements for families with children) could give evidence whether there are differences from the engagement perspective. The participants in our study were adults, for whom this type of trekking tours was designed. However, other clientele such as children, youth, seniors or persons with specific interests (e.g., glacier, climbing) might have different opinions. As participation is voluntary, possible dissatisfaction must be caught early, particularly regarding the young generation, as they can choose among a variety of competing offers. It is well-known that once clients have decided to abandon an alternative, it is difficult to convince them to return back. Thus, the Trekking Engagement Profile can be used as a tool to early detect changes in tourists’ participation behaviour.
Supplementary Materials
The following data are available online at https://www.mdpi.com/2076-3387/9/2/45/s1, Data S1: Data from the poll among voluntary guides at DNT Oslo and participants of guided trekking tours. These data and formulae for its analysis are made available as a spreadsheet in OpenDocument Spreadsheet (ods) format. Note that the textual data are in the Norwegian language. An app to create Engagement Profiles is available online at no.expology.veiapp, “VeiApp”. This app for the Android platform has originally been developed by Expology AS to support the design of exhibits in museums and science centres. Since the layout of the Engagement Profile is similar to the Trekking Engagement Profile, the app can also be used as a tool for guided hiking and trekking tours.
Funding
Parts of this research have been carried out in the context of the project VisitorEngagement funded by the Research Council of Norway (RCN) in the BIA programme, grant number 228737. Further, this research has been supported through basic institute funding at Norsk Regnesentral, RCN grant number 194067.
Acknowledgments
The author wishes to thank his colleagues at Norsk Regnesentral and his fellow tour guides at the Norwegian Trekking Association for interesting discussions. The author also thanks the anonymous participants who answered the poll in the study.
Conflicts of Interest
The author acts as a voluntary tour guide for DNT. Although guided trekking tours of DNT have been used as examples, this research has not been commissioned by them. Beyond these facts, the author declares that the research was conducted in the absence of any commercial or financial relationships that could be construed as a potential conflict of interest.
Data Protection Statement
No sensitive data were queried in the anonymous poll among voluntary guides at DNT Oslo and participants of guided trekking tours. We consider it not viable to trace back the responses to single participants.
Project Information
The objective of the VisitorEngagement project was to measure the degree of engagement and user experience in science centres and museums. This was done by means of sensor and camera technology and the registration of user behaviour, in combination with short surveys. Project partners were Expology AS, Norsk Regnesentral (Norwegian Computing Centre), The Norwegian Museum of Science and Technology, The Norwegian Maritime Museum, Engineerium and the Department of Education at the University of Oslo. For information about the project, we refer to the project base entry at the Research Council of Norway (Research Council of Norway 2017) and previous publications (Cooney and Leister 2019; Leister et al. 2015, 2016, 2017, 2018; Tjøstheim et al. 2015).
Abbreviations
The following abbreviations and names are used in this manuscript:
| DNT | Den Norske Turistforening (The Norwegian Trekking Association) |
| ECG | electrocardiograph |
| EEG | electroencephalograph |
| EOG | electrooculograph |
| EP | Engagement Profile |
| NRK | Norsk Rikskringkasting (Norwegian Broadcasting Corporation) |
| ods | OpenDocument Spreadsheet |
| pax | participants (of a travel package) |
| RCN | Research Council of Norway |
| SAC | Swiss Alpine Club |
| YDS | Yosemite Decimal System |
Appendix A. Trekking Engagement Profile Chart
References
- Beerli, Asunciòn, and Josefa D. Martín. 2004. Factors influencing destination image. Annals of Tourism Research 31: 657–81. [Google Scholar] [CrossRef]
- Cooney, Martin, and Wolfgang Leister. 2019. Using the engagement profile to design an engaging robotic teaching assistant for students. Robotics 8: 21. [Google Scholar] [CrossRef]
- Hofstein, Avi, and Sherman Rosenfeld. 1996. Bridging the gap between formal and informal science learning. Studies in Science Education 28: 87–112. [Google Scholar] [CrossRef]
- Hosany, Sameer, and David Gilbert. 2010. Measuring tourists’ emotional experiences toward hedonic holiday destinations. Journal of Travel Research 49: 513–26. [Google Scholar] [CrossRef]
- Houge, Jørgen Blystad, ed. 2010. Turlederboka (The Tour Guide’s Book). Oslo: Den Norske Turistforening. (In Norwegian) [Google Scholar]
- Leister, Wolfgang. 2017. Hvordan gjøre fellesturer mer engasjerende (how to make guided tours more engaging). Turleder’n 34: 5–6. (In Norwegian). [Google Scholar]
- Leister, Wolfgang, Ingvar Tjøstheim, Göran Joryd, and Trenton Schulz. 2015. Towards assessing visitor engagement in science centres and museums. Paper presented at PESARO 2015: The Fifth International Conference on Performance, Safety and Robustness in Complex Systems and Applications, Barcelona, Spain, April 19–24; pp. 21–7. [Google Scholar]
- Leister, Wolfgang, Ingvar Tjøstheim, Göran Joryd, Trenton Schulz, Andreas Larssen, and Michel de Brisis. 2016. Assessing visitor engagement in science centres and museums. Journal on Advances in Life Sciences 8: 49–63. [Google Scholar]
- Leister, Wolfgang, Ingvar Tjøstheim, Göran Joryd, Michel de Brisis, Syver Lauritzsen, and Sigrun Reisæter. 2017. An evaluation-driven design process for exhibitions. Multimodal Technologies Interaction 1: 25. [Google Scholar] [CrossRef]
- Leister, Wolfgang, Ingvar Tjøstheim, Per G. Norseng, Göran Joryd, Eyvind Bagle, and Heidi Thöni Sletten. 2018. Digital storytelling and engagement in exhibitions about shipping. Norsk Museumstidsskrift 4: 50–73. [Google Scholar] [CrossRef]
- Lemke, Jay, Robert Lecusay, Michael Cole, and Vera Michalchik. 2015. Documenting and Assessing Learning in Informal and Media-Rich Environments. Cambridge: MIT Press. [Google Scholar]
- Ljøen, Hilde. 2018. New Norwegian Slow TV Experiment: Hiking Minute by Minute. press release. August 14. Available online: https://www.nrk.no/presse/new-norwegian-slow-tv-experiment_-hiking-minute-by-minute-1.14165191 (accessed on 10 May 2019).
- MacKenzie, Scott B., and Philip M. Podsakoff. 2012. Common method bias in marketing: Causes, mechanisms, and procedural remedies. Journal of Retailing 88: 542–55. [Google Scholar] [CrossRef]
- Mårtensson, Katarina, and Torgny Roxå. 2016. Peer engagement for teaching and learning: Competence, autonomy and social solidarity in academic microcultures. Uniped 39: 131–43. [Google Scholar] [CrossRef]
- Martin, Bruce, Mary Breunig, Mark Wagstaff, and Marni Goldenberg. 2017. Outdoor Leadership, 2nd ed. Champaign: Human Kinetics, Inc. [Google Scholar]
- Mautz, Rainer. 2012. Indoor Positioning Technologies. Habilitation Thesis, Environmental and Geomatic Engineering, Institute of Geodesy and Photogrammetry, ETH Zürich, Zürich, Switzerland. [Google Scholar] [CrossRef]
- Nezami, Omid Mohamad, Len Hamey, Deborah Richards, and Mark Dras. 2018. Deep learning for domain adaption: Engagement recognition. arXiv arXiv:1808.02324. [Google Scholar]
- Norwegian Trekking Association. 2017. Grading of Guided Tours. Available online: https://english.dnt.no/grading-of-guided-tours/ (accessed on 10 May 2019).
- Priest, Simon, and Michael A. Gass. 2005. Effective Leadership in Adventure Programming, 3rd ed. Champaign: Human Kinetics. [Google Scholar]
- Rajesh, Raghunathan. 2013. Impact of tourist perceptions, destination image and tourist satisfaction on destination loyalty: A conceptual model. PASOS. Revista de Turismo y Patrimonio Cultural 11: 67–78. [Google Scholar] [CrossRef]
- Reeve, Johnmarshall, Hyungshim Jang, Dan Carrell, Soohyun Jeon, and Jon Barch. 2004. Enhancing students’ engagement by increasing teachers’ autonomy support. Motivation and Emotion 28: 147–69. [Google Scholar] [CrossRef]
- Research Council of Norway. 2017. Visitor Engagement. Entry in PROSJEKTBANKEN. Available online: https://www.forskningsradet.no/prosjektbanken/#/project/NFR/228737/Sprak=en (accessed on 20 March 2012).
- Shooter, Wynn, Jim Sibthorp, and Karen Paisley. 2009. Outdoor leadership skills: A program perspective. Journal of Experiential Education 32: 1–13. [Google Scholar] [CrossRef]
- Store Norske Leksikon. n.d. Ledelse (Leadership). Dictionary Entry. Available online: https://snl.no/ledelse (accessed on 22 April 2019). (In Norwegian).
- Swiss Alpine Club. n.d. Grading Systems. Available online: https://www.sac-cas.ch/en/ausbildung-und-wissen/tourenplanung/grading-systems/ (accessed on 22 April 2019).
- Terzis, Vasileios, Christos N. Moridis, and Anastasios A. Economides. 2010. Measuring instant emotions during a self-assessment test: The use of FaceReader. Paper presented at 7th International Conference on Methods and Techniques in Behavioral Research (MB ’10), Eindhoven, The Netherlands, August 24–27; pp. 18:1–18:4. [Google Scholar] [CrossRef]
- Tjøstheim, Ingvar, Wolfgang Leister, Andreas Larssen, and Trenton Schulz. 2015. The role of emotion and enjoyment for QoE—A case study of a science centre installation. Paper presented at 2015 Seventh International Workshop on Quality of Multimedia Experience (QoMEX), Pylos-Nestoras, Greece, May 26–29; Edited by A. Skodras. Piscataway: IEEE, pp. 1–6. [Google Scholar]
- Wikipedia. n.d. Grade (Climbing). Available online: https://en.wikipedia.org/wiki/Grade_(climbing) (accessed on 22 April 2019).
- World Tourism Organization. 2014. Global Report on Adventure Tourism. AM Reports Volume Nine. Madrid: UNWTO. [Google Scholar]
- Zennifa, Fadilla, Sho Ageno, Shota Hatano, and Keiji Iramina. 2018. Hybrid system for engagement recognition during cognitive tasks using a CFS + KNN algorithm. Sensors 18: 3691. [Google Scholar] [CrossRef] [PubMed]
© 2019 by the author. Licensee MDPI, Basel, Switzerland. This article is an open access article distributed under the terms and conditions of the Creative Commons Attribution (CC BY) license (http://creativecommons.org/licenses/by/4.0/).