Calculation and Analysis of Wind Turbine Health Monitoring Indicators Based on the Relationships with SCADA Data


1
School of Mechanical Engineering, Hunan University of Science and Technology, Xiangtan 411201, China
2
Hunan Provincial Key Lab of Health Maintenance for Mechanical Equipment, Hunan University of Science and Technology, Xiangtan 411201, China
3
XEMC Windpower Co., Ltd., Xiangtan 411000, China
*
Author to whom correspondence should be addressed.
Appl. Sci. 2020, 10(1), 410; https://doi.org/10.3390/app10010410
Submission received: 20 November 2019
/
Revised: 31 December 2019
/
Accepted: 3 January 2020
/
Published: 6 January 2020
(This article belongs to the Special Issue Wind Power Technologies)
Abstract
:This paper proposes an evaluation index of wind turbine generator operating health based on the relationships with SCADA (Supervisory Control and Data Acquisition) data. First, the relationship among the data from a wind turbine SCADA system is thoroughly analyzed. Then, a time based sliding window model is used to process the SCADA data by the bin method, and a running state model of the wind turbine is established by data fitting. Taking the normal operation state model of the wind turbine as the standard reference and based on the Euclidean distance between the state model curve and the standard model curve, the health index of the wind turbine operation state is proposed. Finally, using SCADA data from two 2 MW direct-drive wind turbines as examples for analysis and discussion, the results show that: (1) health indicators have good stability and sensitivity to wind turbine operating conditions; (2) the width of the data window in the sliding window model must cover all operating conditions of the wind turbine to ensure that the health index depicts the operating state of the wind turbine; (3) the data window width, window increment, and data fitting modeling all affect the health indicators, and thus, the selection of the sliding window model parameters and the data relationship modeling methods should consider the accuracy and real-time performance of the health indicators; and (4) the data acquisition cycle does not affect the health indicators. Once the basic characteristics of the data relations are known, direct data fitting modeling is more efficient than bin preprocessing modeling.
1. Introduction
In recent years, the world wind power industry has developed rapidly. According to the statistics, by the end of 2018, the world’s newly installed wind power capacity was 51.3 GW, and the world’s cumulative installed wind power capacity reached 591 GW [1]. The single unit capacity of wind turbines has also increased from 30 kW several decades ago to 8 MW at present. With the continuous increase in the installed capacity, wind turbines are also being deployed to more remote land and sea locations. Difficulties in maintenance lead to increased operating costs of wind farms and increased electricity consumption costs for customers, requiring more stringent requirements for the reliable and economical operation of wind turbines.
To determine the real-time operation status of wind turbines and to implement reasonable maintenance of wind turbines, modern large wind turbines are equipped with SCADA (Supervisory Control and Data Acquisition) systems. The application of SCADA data for wind turbine state identification, fault diagnosis, and early warning is currently a hot research topic in academic circles [2,3,4] and focuses mainly on statistical methods or data mining methods, such as neural networks and support vector machines [5,6]. In terms of statistical methods, Kusiak and others identified faulty wind turbines through comparative analysis of SCADA data of more than three wind turbines [7,8]. Feng and Kim et al. conducted identification research on gearbox faults by extracting the SCADA data of wind farms [9,10]. Yong et al. analyzed SCADA long term operation data based on multivariable state estimation technology, thus identifying gearbox faults of wind turbine units [11]. Yang et al. constructed an evaluation index of state discrimination based on the pretreatment of SCADA raw data to evaluate quantitatively the wind turbine blade failure and generator bearing failure [12]. Gill et al. [13] established a probability model of a wind turbine power curve based on the Copula function. Using the SCADA system operation data, the results showed that the early failure symptoms of blade degradation and the yaw and pitch system of wind turbines could be effectively monitored. Kusiak et al. [14] used the Hotelling T2 statistical method to analyze the active power operation data of a wind turbine to identify its operation state. Yan et al. [15] selected characteristic parameters based on the BP neural network model and used the RSME method to identify generator bearing faults. Zhu et al. [16] proposed a fuzzy synthetic method for real-time condition assessment of the wind turbine gearbox to reduce the Operation and Maintenance (O&M) cost with the optimized O&M strategy. In terms of artificial intelligence methods, Zaher et al. [17] constructed a BP neural network model of gearbox temperature to identify faults. Schlechtingen et al. [18] applied an adaptive neuro-fuzzy inference system to SCADA data processing for a wind farm and investigated wind turbine state identification. Li et al. [19] established a standard operating state model of a wind generator based on the neural network method and proposed a health index to measure the difference between the operating state of the generator and the standard state and to evaluate the operating state of the generator. Ren et al. [20] proposed a fault diagnosis method based on Variational Mode Decomposition (VMD) Multi-scale Permutation Entropy (MPE) and Feature based Transfer Learning (FTL) to monitor the health condition of the wind turbine gearbox. These studies are of guiding significance to the evaluation and identification of wind turbine operation status, but lack in-depth interpretations of the physical significance of the evaluation of the wind turbine operation status and systematic analysis of the factors affecting the evaluation.
Using SCADA data, this paper proposes a new health index and its calculation method to characterize the operating state of wind turbines. The remaining part is organized as follows. In Section 2, the data relationship model of the wind turbine operating state is proposed by using the sliding window model and the data bin process method. Then, the health index of the wind turbine operating state is proposed based on data relations. In Section 3, two 2 MW direct-drive wind turbine units of the same model on a wind farm are selected to describe the health index. One of the wind turbines encountered yaw bearing tooth fault. The effect of window width, window increment, data sampling period, and data relationship modelling on the health index are investigated. Finally, Section 4 ends the paper by summarizing the main conclusions.
2. Materials and Methods
2.1. Data Relationship Modeling of the Wind Turbine Operating State
2.1.1. Data Analysis
Wind turbine SCADA systems are data acquisition and monitoring control systems that include Computer, Communication, Control, and Sensing technologies (3C + S). SCADA systems sample and store many operational parameters during the operation process of a wind turbine, including wind speed, rotor speed, pitch angle, vibration acceleration, generator torque, and output power, at a set frequency. The data sampling and storage period is generally measured in minutes or seconds. An example of raw SCADA data with a sampling period of 1 s is shown in Table 1.
Because a SCADA system records data during both normal operation and shutdown and startup processes, failure or abnormal operation of the wind turbine can also be detected. To improve the accuracy of the results, the raw data should be preprocessed, and only data from normal operation should be retained for analysis. In some cases, measurement reference error, such as pitch angle, or errors caused by measurement positions, such as with wind speed correction, should be corrected [21]. In other cases, specific data may be required for analysis based on the topic being investigated. For example, in this paper, the wind speed between the cut-in wind speed and the rated wind speed in the SCADA raw data must be analyzed; thus, the data describing the wind turbine pitch stage are removed, and the nonlinear effect of pitch change is not considered.
A wind turbine converts wind energy into electric energy. Different wind speeds output different electric power, and different wind speed distributions also output different electric power distributions; these facts imply various functional relationships between SCADA parameter data and wind turbine health metrics. The factors that affect these functional relationships include both the wind turbine itself and external factors. There are two main factors in the system itself: on the one hand, the structural parameters of the wind turbine, including blade airfoil, wind wheel diameter, etc.; and on the other hand, the operating parameters related to the wind turbine control mode, such as the maximum power tracking control mode when the wind speed is lower than the rated wind speed and the constant power control mode when the wind speed is higher than the rated wind speed.
To clarify the various relationships among the wind turbine SCADA data, this paper divides the parameter data into input and output parameters according to the operation parameters corresponding to SCADA data and the input/output relationships of the wind turbine system and its subsystems. This paper also establishes pairwise corresponding relationships between the parameters. For example, in terms of three parameters, such as wind speed, rotation speed, and output power, the parameter relationship includes: the relationship between the wind speed and rotation speed, where wind speed is the input parameter and rotation speed is the output parameter, which depends on the wind wheel subsystem and mainly includes the wind wheel, pitch control system, and yaw control system; the relationship between rotating speed and power, where the rotating speed is the input parameter and power is the output parameter, which depends on the transmission subsystem, electromagnetic subsystem, and power subsystem and includes components such as the transmission device, generator, converter, and transformer; the relationship between wind speed and power, where wind speed is the input parameter, and power is the output parameter, which depends on all parts of the wind turbine, including all subsystems.
2.1.2. Sliding Window Model
The wind turbine SCADA system data are a data sequence arranged in chronological order:
where Xi is the dataset recorded at time ti (i = 1, 2, 3, …). The SCADA sampling frequency τ is 1/(ti − ti−1), and:
where xij is the jth wind turbine state parameter in Xi (j = 1, 2, 3, …), such as wind speed, rotation speed, and power. During wind turbine operation, the SCADA system creates and stores a stream of data for later analysis.
To evaluate the real-time running status of wind turbines, a sliding window model based on time is used to process the data stream, and the status online identification is determined by updating the SCADA data in the window in real time, as shown in Figure 1. The data recording frequency is defined by τ, the data length contained in the window by h, the time length by hτ, the increment by q, and the time increment by qτ. Thus, the SCADA data processed at time tk (k > h) is a data matrix recorded from time tk−h to tk (i.e., sliding window data Dk):
where k is related to the defined window width h and increment q, k = h + nq; n is the number of time steps, and n = 1, 2, …. When data processing finishes at time tk, both ends of the window move q along the positive time direction simultaneously, and the data matrix to be processed changes to Dk+q.
Changing the window width h adjusts the amount of data in the window, and changing the increment q adjusts the update frequency of the data in the window. The data scale corresponding to the window width h must ensure that the relationship between these data can accurately and stably describe the essential relationship, while the update frequency corresponding to the increment q must ensure that there is sufficient calculation processing time to determine the essential relationship between these data. In general, the larger the window width h is, the larger the corresponding data scale is, and the more accurate and stable the relational model obtained by data processing mining is. However, excessive window width h will lead to an increase in data processing time. Additionally, a smaller increment q yields a faster update frequency and a shorter time (period) between the two states, which means the online state identification has better real-time performance.
2.1.3. Data Bin Processing
Due to the turbulent character of the wind speed [22] and the large scale of wind turbine SCADA data, the relationships between the data parameters are complex and contain many nonlinear effects [23]. Thus, it is difficult to identify relationships from scatter plots, and bin processing must be carried out. Before bin processing, the data should be preprocessed as the following steps.
Step 1: Extract the data of wind speed, rotor speed, and output power. The characters of v, ω, and P are employed to denote these parameters, respectively.
Step 2: Eliminate the shutdown data and zero value data by judging the values of ω and P. If or hold, the corresponding state parameters should be eliminated. Furthermore, null data should also be eliminated.
In this paper, wind speed v and output power P are used as examples, and a scatter plot of the relationship between wind speed and wind turbine output power is shown in Figure 2.
According to the IEC 61400-12-1 standard [24], the bin method was used to process data in this study. The data in each window are divided into N bins using wind speed as the reference, where:
where vmax is the maximum wind speed in the window and vmin is the minimum wind speed in the window.
The average wind speed and average power in the ith bin are then calculated as follows:
where Li is the number of data groups in the ith bin; vi,j is the wind speed value of the jth group in the ith bin; and Pi,j is the power value of the jth group in the ith bin.
After data bin processing, the relation curve between wind speed and power in the window can be obtained, as shown in Figure 3. Using the input parameter data as a reference, the output parameter data can be processed in the same way to obtain the relationship between various measures.
2.1.4. Data Relationship Modeling
It is generally believed that the relationship between two measures can be approximately modeled by polynomials using input parameter data x and output parameter data [12]. The relationship between these two measures can be expressed as the following polynomial:
where, are constants that depend on the unit structure and control mode; and n is the polynomial fitting order. A larger n tends to yield better fitting accuracy. However, if the fitting order is too high, the computation time will increase, and numerical stability may become problematic, yielding a worse fit. Using the bin processed data relation graph and the physical and mechanical principles between the corresponding parameters, a reasonable fitting order can be selected. For example, the relationship between wind speed and wind turbine output power can be considered to be third order [25].
The constants in Equation (7) can be obtained based on the least squares fitting method, where the objective function is:
2.2. Health Index of Wind Turbine Operating State
2.2.1. Health Indicators Based on Data Relations
The real-time data relation model is essentially the running state model of a wind turbine generator and its subsystems. When a unit is operating normally, the operating model remains unchanged, and the model parameters are basically constant, although it may be disturbed by environmental factors. Different units, operation models and parameter values may be used. When the unit structure and control mode change, due to events such as component damage or control failure, the model will change, indicating that the operation model and state of the wind turbine unit have changed. From the above analysis, the wind speed and output power of the wind turbine generator are the total input and output of the whole energy conversion process. Therefore, the wind speed V and the output power P in matrix Dk are used to process SCADA data in real time using the sliding window model described in Figure 1. The sliding window gradually moves along as time continues, and the state parameters to be analyzed in each window are processed using Equations (5) and (6) to obtain the functional relation between the wind speed and out power of the wind turbine at different times (i.e., the coefficients ). Let the coefficient matrix at tk time be:
Equation (9) shows that the identification of the operating state of the wind turbine is transformed into the identification of the functional operation model determined by the coefficients .
To evaluate the running health status of wind turbines and their subsystems in real time, a data relation standard model is generally established based on the data from a time period during normal operation of the wind turbine. Then, the differences between the state model and the data relation standard model at each operation time of the data relation are investigated and compared.
2.2.2. Discussion on Health Indicators of Wind Turbine Operation
The relationship between the wind speed and power is the most important relationship among wind turbine operating conditions. A change in the wind turbine operating state is reflected in a difference between its wind speed and power curve; thus, many researchers identify the operating health state of the wind turbine by quantifying the difference between wind speed and the power curve at different times.
Under normal operation, a data relation standard model is:
Let the tk time data relation model be:
Let the state health indicator Cpower be defined based on the output power attenuation as:
The state health index Ceu based on Euclidean distance is defined as:
State health indicators proposed by Yang [12] and others are:
With a 24 h window width and a 1 h increment, the wind speed and power data of wind turbine SCADA for 72 h are processed, and three state health indicators based on data relations were compared and analyzed. The results of these analyses are shown in Figure 4. The three health indicators changed markedly after 40 h, indicating that the health status of the wind turbine generator sets was abnormal.
The operating health of wind turbines can also be evaluated by the real-time wind energy utilization efficiency. Because wind speeds can change rapidly and the mechanical energy stored on the wind wheel of the wind turbine can only change slowly due to the inertia of the wind wheel, the value of the transient wind power coefficient is inconsistent with the actual situation. As shown in Figure 5, the minimum value was 0.18, and the maximum value was 1.95, which was much larger than the theoretical maximum value of 0.593 of the wind power coefficient.
Using the ratio of the total energy of the airflow flowing through the wind wheel in a period of time to the total electrical energy output in that time period and considering the energy stored on the wind wheel [21], the wind power efficiency can be obtained as follows:
where t2 > t1 and J is the moment of inertia of the wind wheel. Figure 6 shows the wind power efficiency of wind turbines at different times. The wind turbine generator power coefficient began to drop after 24 h, which is different from the change rule of the first three health indicators.
2.2.3. Proposed Health Indicators for Wind Turbine Operating State
The above four health indicators are all measures of energy utilization efficiency. These health indicators change when the wind turbine generator sets operate abnormally. However, due to the complexity of factors that affect the energy utilization efficiency, especially those related to the wind speed and how it changes during the observation period, there are differences between efficiencies when characterizing the abnormal structure and control mode of the wind turbine.
From the comparative analysis, the wind energy utilization efficiency was shown to be a poor health indicator from the theoretical and practical points of view. The first three health indicators consistently describe the occurrence and duration of abnormal operating conditions. However, from the perspective of stability and numerical sensitivity, the Euclidean distance based on data relation model function performed best.
Therefore, the dimensionless health index Cd(k) of the wind turbine operating state is proposed based on the data relation at tk time and is defined as:
where Pw is the rated output power of the wind turbine.
The mathematical meaning of the state health index was shown to be the difference (root mean squared average) between the output power of wind turbines relative to the wind speed at a certain time and the output power of wind turbines relative to the wind speed at a normal time. The larger the index value is, the larger the difference between the output power of wind turbines and the normal value is, and the lower the wind energy utilization efficiency is. Conversely, the smaller the index value is, the smaller the difference from the normal value is, and the higher the wind energy utilization efficiency is. Therefore, the physical meaning of the health index of wind turbine operation state is the wind energy dissipation rate.
3. Results
To describe the health index of the wind turbine operation state proposed in this paper, two 2 MW direct-drive wind turbine units (WT1 and WT2) of the same model on a wind farm were selected for study. SCADA data were selected from four days (7 September to 10 September); however, WT1 broke down suddenly due to yaw bearing tooth fault on 10 September. Some parameters of the wind turbines are shown in Table 2.
Based on the SCADA data recorded during the normal operation of the wind turbine on the first day, a data relation standard model was established. Using wind speed and power data as an example, the relationship between wind speed and power data is obtained as follows:
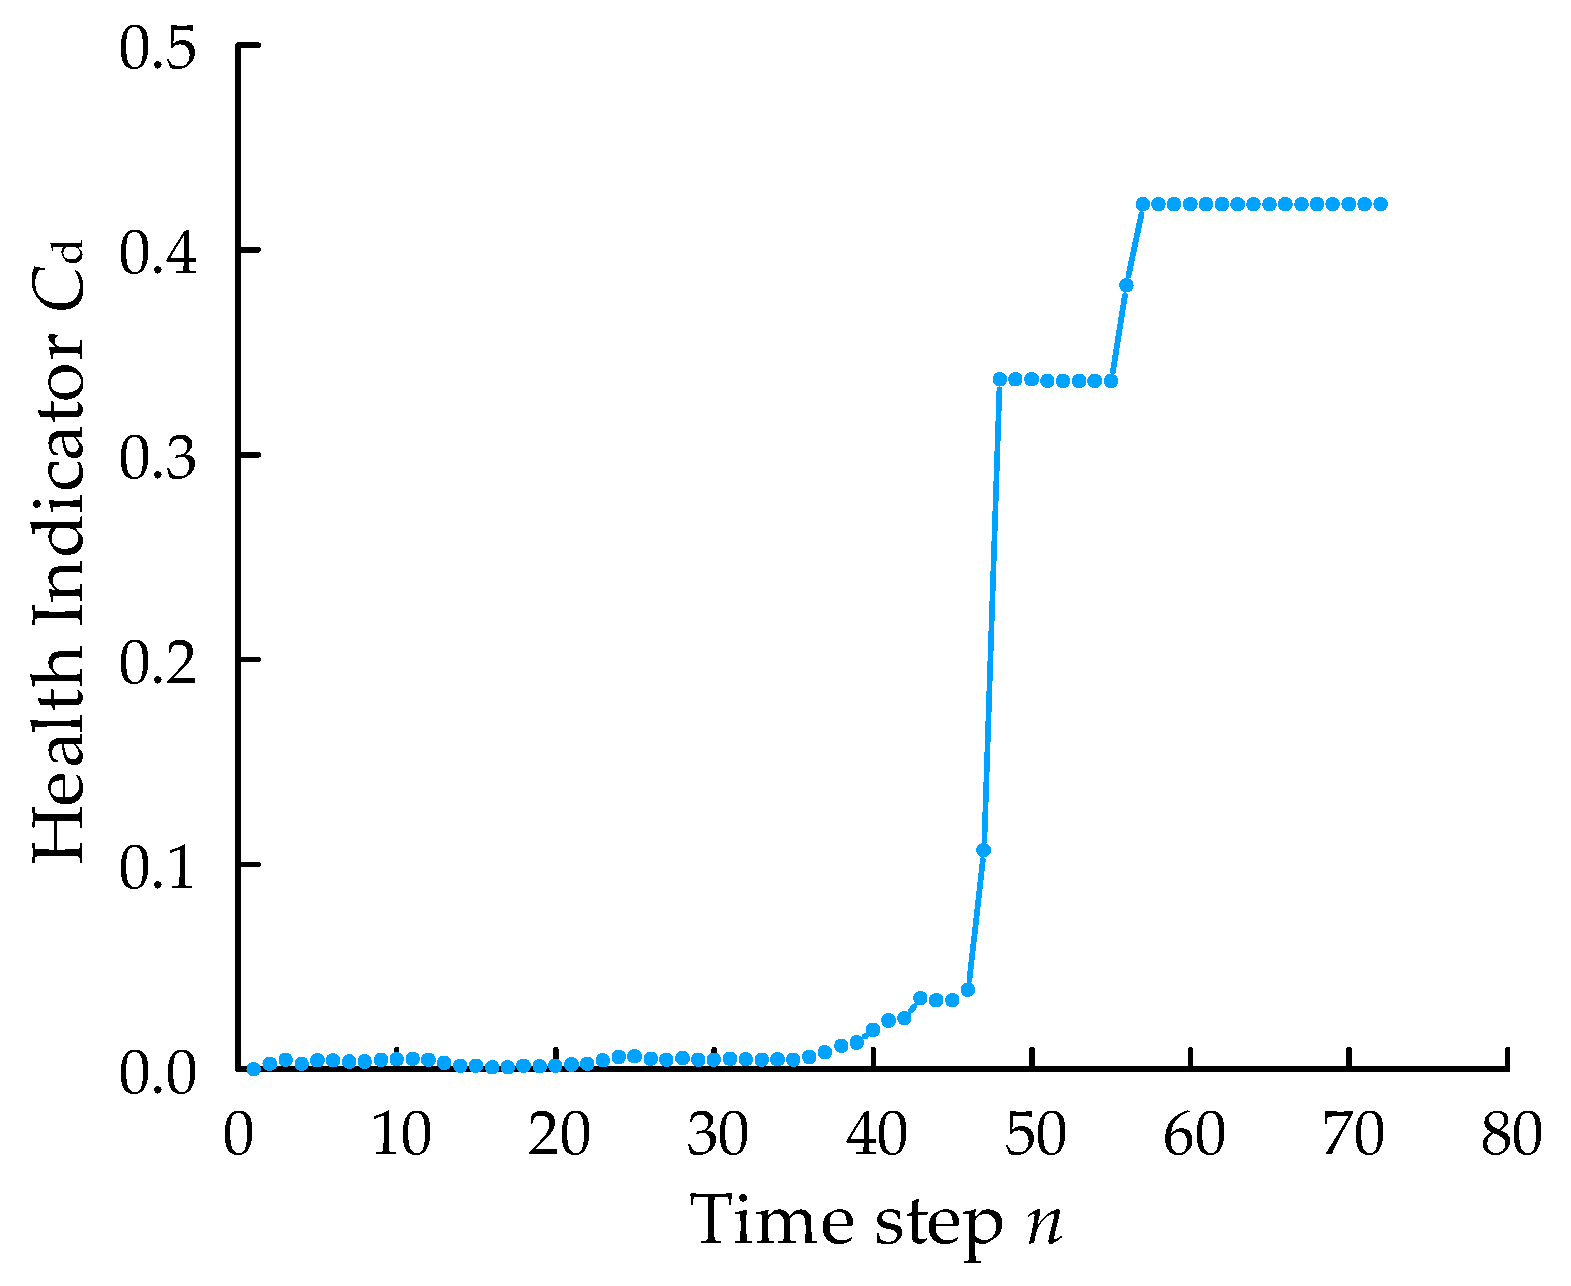
If the window width is set at 24 h and the window increment is set at 1 h, the change rule of wind turbine generator operating health index is obtained via Equation (16), as shown in Figure 7.
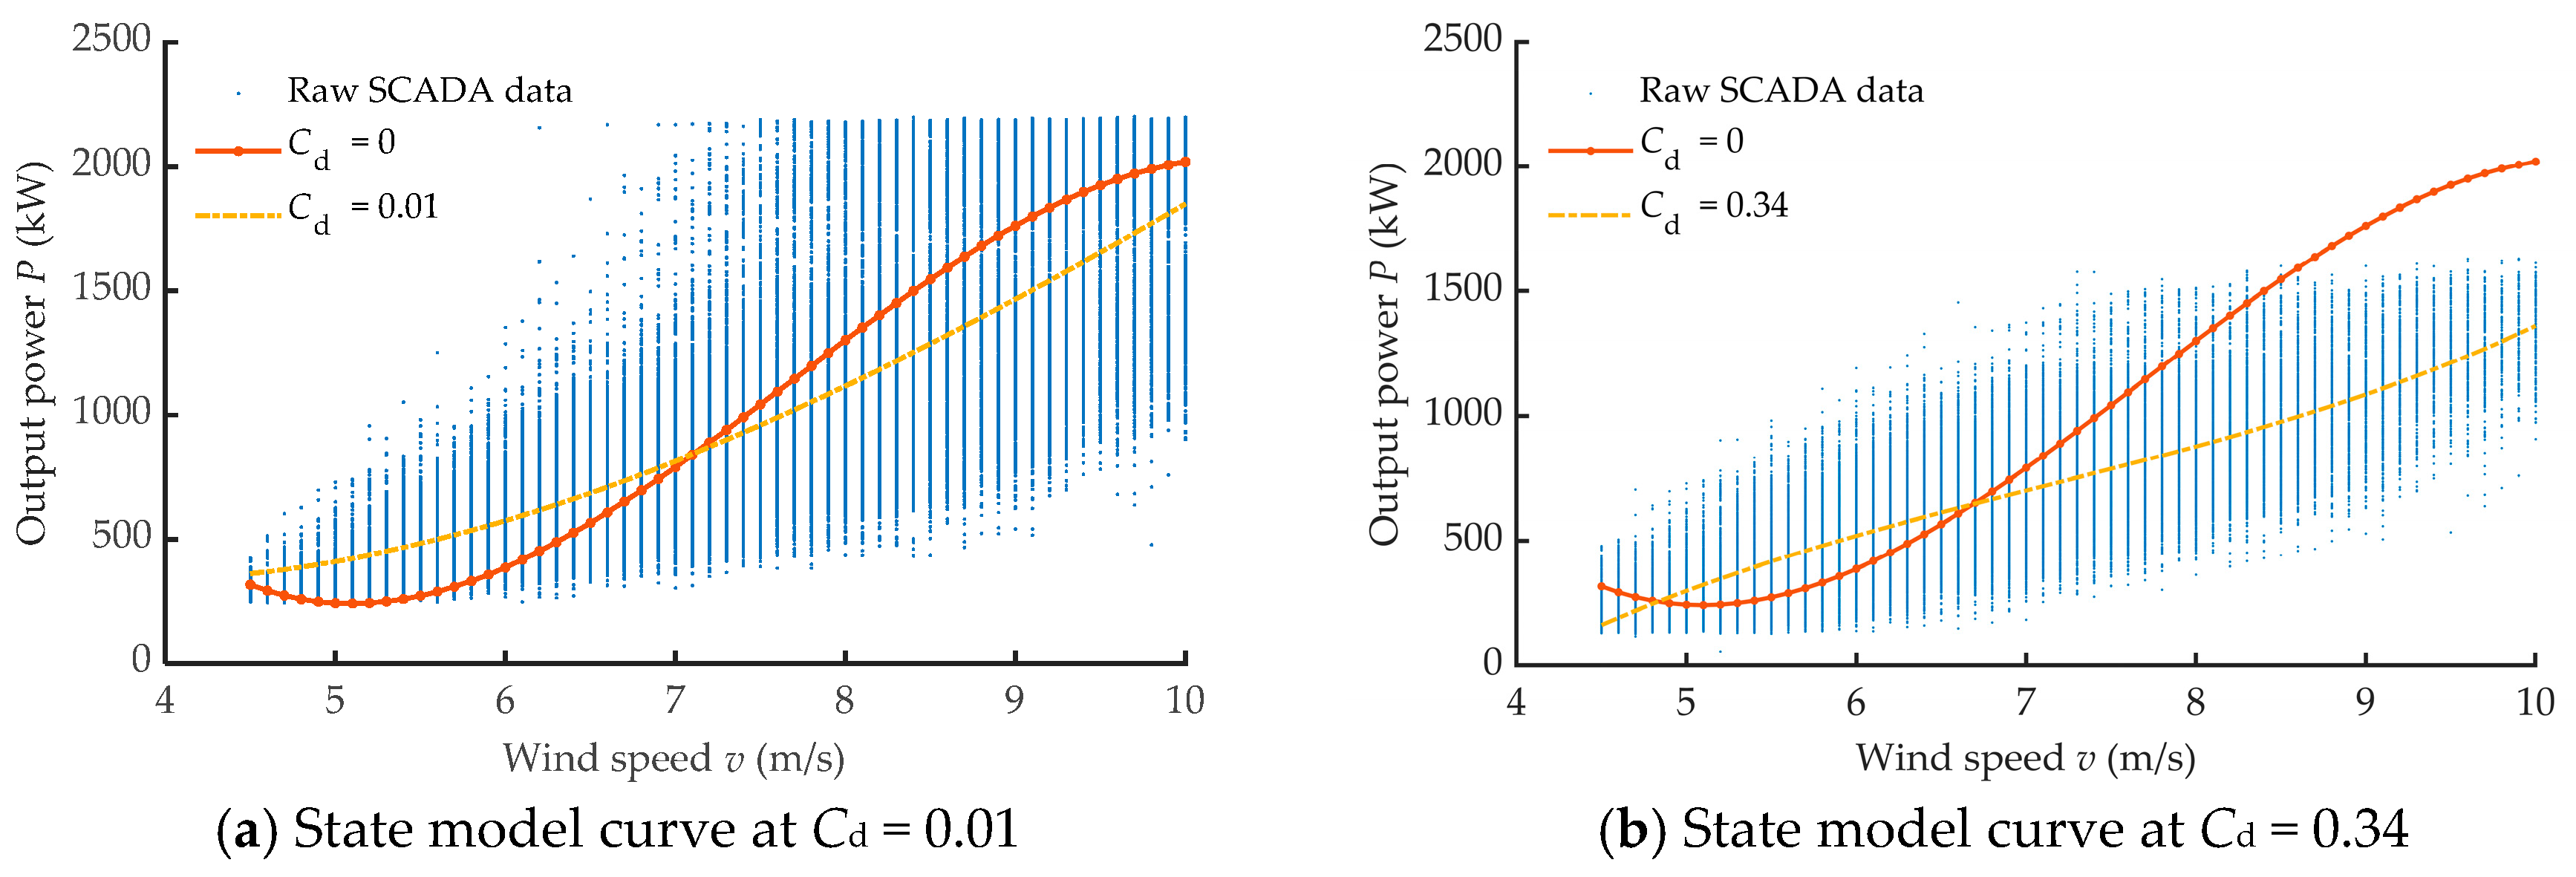
The window data of the 30th and 50th hours with their running state model curves are shown in Figure 8. The wind turbine unit was shown to operate normally at the 30th hour, and the state model curve at this time was not very different from the standard model curve, showing fluctuations within the normal range. At the 50th hour, the operation of the wind turbine generator set was abnormal, and the state model curve at that time differed from the standard model curve. However, it was difficult to observe the obvious difference between the two data scatter plots. This result also showed that the operation health index of wind turbine generator set in Equation (16) could describe a change in the operation state of the wind turbine generator set. In the authors’ previous research [26], we used a small probability method to judge the operation state of the wind turbine. The statistical analysis of the wind turbine health index was carried out in normal operation phase to obtain the distribution function. Then, according to the hypothesis of small probability event, the threshold value of the health index of wind turbine abnormal state was determined. Compared with the small probability method, the proposed health index was more sensitive to the abnormal state of the wind turbine, and the calculation consumption was lower.
To further analyze the factors that affect the operation health index of a wind turbine, the SCADA wind speed and output power data of the four days were processed with different window widths, window increments (i.e., time steps), and other window and modeling parameters.
3.1. Effect of Window Width on Health Indicators
In the sliding window model, a change in the window width changes the amount of data analyzed in each calculation. When the selected time increment q is 1 h and the window width h is 12, 24, 36, and 48 h, the health indices of the two wind turbines were calculated, and the results are shown in Figure 9.
Health indicators are the basis for evaluating the operation status of wind turbines. Even during normal operation, the health indicators fluctuated due to variations in wind speeds. However, a health index with excellent identification performance should meet the following conditions: when the wind turbine generator sets are operating normally, the health index should fluctuate stably in a small interval; conversely, when the wind turbine generator sets are abnormal, the health indicators should exhibit changes along a continuous trend. An analysis of Figure 9 showed that when the window width equaled 12 h, the health indicators of WT1 and WT2 fluctuated markedly during normal operation, indicating a lack of identification; thus, the health indicators were invalid, and misdiagnosis or false positives may occur during operation state evaluation. When the window width equaled 24 h, 36 h, and 48 h, the health index was small and stable during normal operation, but increased rapidly for WT1 at Time 40. Thus, if the window width was too small, fitting accuracy would decrease. Conversely, and more importantly, the relationship model established by data fitting could not represent the relationship between the input and output parameters of the normal operation of the wind turbine because the data in the shorter window may not cover all operating conditions of the wind turbine, perhaps leading to invalid health indicators. The accuracy and stability of health indicators increased as the data window width increased; however, the time required for data processing also increased. Therefore, if the window width was too large, the speed at which health indicators were identified may decrease and may prevent online identification. For this study, the data window width must be above 24 h to ensure the effectiveness of the health indicators of wind turbine generator operating conditions. When the window width was 24 h, 36 h, and 48 h, the health index of WT1 started to increase obviously after 35 h. The larger the window width was, the higher the accuracy of the health index was. When the window width was 48 h, the health index changed obviously in less than 40 h.
3.2. Impact of Window Increment on Health Indicators
Let the window width h equal 24 h and the time increment q equal 0.5 h, 1 h, 1.5 h, and 2 h. The resulting changes in the health index of the two wind turbine sets are shown in Figure 10. The window increment was shown to have no effect on health indicators.
The time increment in the sliding window model reflects the frequency of data measurement within the window. The selected window width h = 24 h, and the time increment q was 0.5 h, 1 h, 1.5 h, and 2 h. The time consumption of the calculation of the health indicators for the two wind turbine sets at different time increments is shown in Figure 11.
As shown in Figure 11, the smaller the time increment was, the more calculation time steps were required and the longer the analysis would take. However, a higher frequency of data measurement in the window yielded better real-time performance of health indicator identification. Additionally, the larger the time increment was, the smaller the number of corresponding calculation steps was, and the higher the computational efficiency of the algorithm was. However, a lower frequency of data measurement in the window yielded worse real-time performance of health indicator identification. Therefore, an appropriate time increment must be selected based on the performance of the computing platform and the requirements for real-time state identification.
3.3. Effect of Data Sampling Period on Health Indicators
The data recorded by the SCADA system were averaged over a given time period. Different SCADA systems may have different periods of data acquisition. State health indicators should have good robustness to changes in data acquisition periods. The raw wind farm SCADA data used in this paper were recorded at 1 Hz and were then averaged at intervals of 5 and 10 s based on the time sequence to analyze changes in health indicators. Let the window width h equal 24 h and the time increment q equal 1 h. Then, the health index from Equation (16) was used to process 5 and 10 s interval data; these results are shown in Figure 12.
Changes in the health indicators were shown to be relatively consistent with those of the raw data, indicating that the proposed health indicators had good robustness to changes in the SCADA data sampling frequency.
3.4. Impact of Data Relationship Modeling on Health Indicators
SCADA data describe wind turbine performance, and modeling via data fitting is used to describe the operation of a wind turbine. Polynomials are typically used to describe unknown functional relationships. Generally, the higher the order is, the more accurate the description is. Under certain conditions, an increase in order will not significantly improve the accuracy. In this paper, first- through fifth-order polynomials were used to fit the wind speed and power data. The results of these analyses are shown in Figure 13.
Based on the fitting mean square error (RMSE) between the fitting curve and the data, increasing polynomial order does increase fitting accuracy in diminishing increments. The accuracy of the third-order polynomial was 10% higher than that of the first-order; however, that of the fifth-order was less than 5% higher than that of the third-order. For the relationship between wind speed and power data, the third-order polynomial yields good fitting precision and was thus used in this study. The relationship between wind speed and power in theory may be the third-order [25].
During the process of data relation modeling, the influence of “abnormal points” should be reduced as much as possible to ensure precise fitting. To achieve this goal, the work in [12] proposed preprocessing the data using the bin method before fitting. In this paper, the bin method was used to process the data so that the data relation curve could clearly show the basic characteristics and allow the selection of a reasonable fitting curve or polynomial. However, this method may yield a “missing report” of abnormal states due to some “abnormal points” caused by abnormal operating states or reduce modeling accuracy and increase computation workload.
Fitting between the wind speed and output power was used again as an example. Raw data were substituted into Equation (8) for fitting; the resulting fit was then compared with that produced after pre-processing. The results of these analyses are shown in Figure 14. The root mean squared error was calculated over the whole raw data, and the calculated result of the direct fitting method equaled 232.9, while that after pretreatment equaled 239.4; thus, direct fitting performed better than refitting after pretreatment. When the basic characteristics of data relations are mastered through physical and mechanical analysis, the bin method’s pretreatment is not needed, and the raw data can be used directly for model fitting.
4. Discussion
There are many factors that affect the modeling of the wind turbine operation status and the calculation of health indicators, including the accuracy and real-time performance of health indicator calculation. For example, increasing the data window width yields a higher accuracy in health indicator modeling and health status identification and an earlier warning of abnormal status identification. However, with the increase in the width of the data window, the time required for the computer to model and identify health indicators and the time required to identify abnormal states increase. As another example, a smaller time increment in the sliding window model yields better real-time performance, allowing faster identification of an abnormal operating health status. However, the time increment should be sufficient to complete calculations involved in operating health identification and to achieve real-time identification. Therefore, the selection of specific health indicators should be combined with the actual situation of wind turbines to coordinate the accuracy and real-time performance of health assessment. From the analysis of the examples in this paper, the method of identifying the operating state of wind turbines based on SCADA data was effective because advanced warning was much larger than the delay.
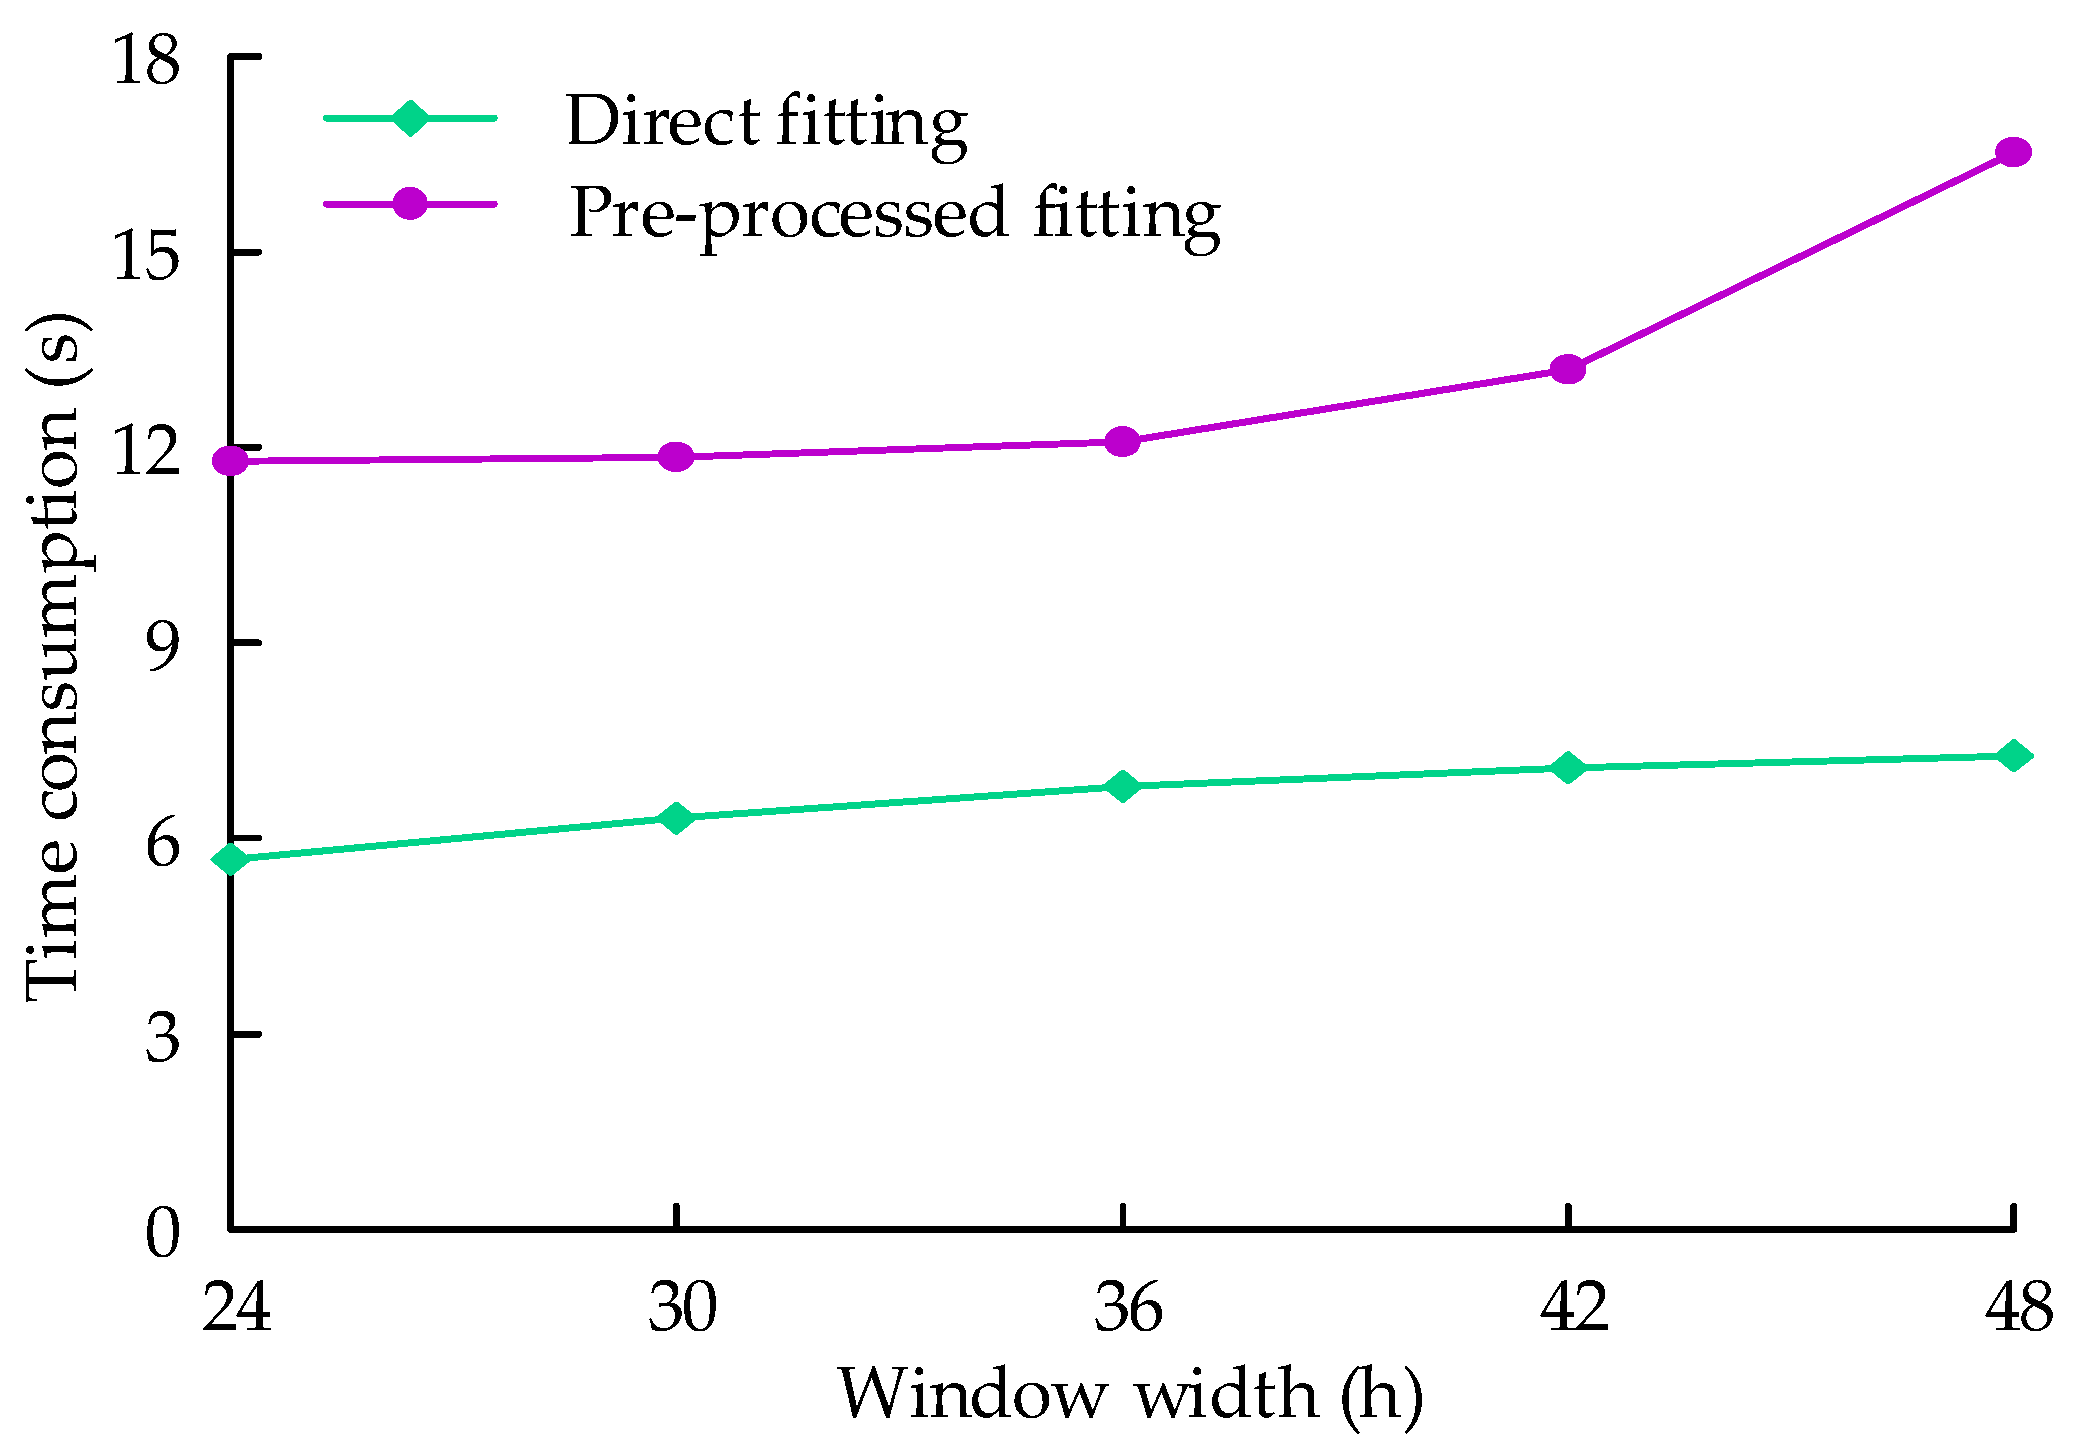
The discussion of this problem involves SCADA system configuration. The better the system configuration is, the shorter the time required for the same calculation workload is. The calculation workload required for health index identification is also critical. For example, considering more relationships between wind turbine operating parameter data requires a higher computation workload and thus longer computation times for the same system configuration. Consider the following large wind turbine SCADA system configuration as an example: Intel i7-4790 CPU, 16 GB of operating memory, 1 TB hard disk, Windows 7 operating system. The system was used for modeling the relationship between wind speed data of WT1 and power data of WT1 in a window width by data fitting to analyze the time consumption of the data fitting calculation statistically. The width of the data window was set equal to 24, 30, 36, 42, and 48 h. The direct fitting method was used and then compared to the preprocessing and refitting method proposed in [12]. The modeling time is shown in Figure 15. The computation duration was shown to increase as the data window width increased, particularly when using the preprocessing and refitting method proposed in [12]. When the window width was 24 h, the computation duration of the direct fitting method was 5.67 s, and that of the preprocessing and fitting method was 11.79 s, which means that the computation duration time of the method proposed in [12] was approximately twice as long as that of the direct fitting method.
Based on the computation durations required for data processing, fitting, modeling, and identification, it could be assumed that if a wind farm had 20 wind turbine sets, each wind turbine set required 10 operation parameter input and output relation models concurrently, and the computer configured by the SCADA was used for processing, the system would required 1134 s using the method proposed in this paper. The same system, using the method proposed in [12], required 2358 s. To ensure that enough time was available to complete the operation state identification calculation, the time increment in the sliding window model could not be less than 1134 s (i.e., approximately 0.32 h). However, using the method proposed in [12], the time increment in the sliding window model could not be less than 2358 s (i.e., approximately 0.66 h). Therefore, the data processing method of direct fitting to the raw data had better real-time performance than the preprocessing and refitting method proposed in [12] and could identify the running health status of wind turbine generator units in a more timely manner. However, in terms of general large scale wind turbine SCADA system configuration, the sliding window time increment for the identification of wind turbine operating state health indicators based on SCADA data analysis may require tens of minutes or even one hour, which means that the currently obtained state health indicators were actually the states (operating data) tens of minutes or even one hour ago. Therefore, state identification was always delayed, and real-time performance was the reverse characteristic of this delay.
5. Conclusions
(1) Using the sliding window model and the bin method to process the data, a polynomial fitting modeling method for wind turbine operation state based on SCADA data relation was proposed.
(2) Based on the Euclidean distance of the data relation curve, a dimensionless health index for wind turbine operation and its calculation were proposed. The proposed health index showed good stability and sensitivity.
(3) The width of the data window in the sliding window model must cover all working conditions of the wind turbine to ensure that the health index depicts the running state of the wind turbine.
(4) The data window width, window increment, and data fitting modeling affect the health indicators. The selection of sliding window model parameters and data relationship modeling methods should comprehensively consider the accuracy and real-time performance of health indicators. Considering the SCADA data of the two wind turbine sets of the same model on a given wind farm as an example, the analysis showed that the data acquisition cycle had no effect on the health indicators. Once the basic characteristics of data relations were known, direct data fitting modeling was more efficient than bin preprocessing modeling.
Author Contributions
The research presented in this paper was a collaborative effort among all authors. Conceptualization, F.Z. and Z.W.; methodology, F.Z. and Z.W.; visualization, J.J. and H.W.; writing, original draft, F.Z.; writing, review and editing, D.L. and B.Z. All authors have read and agreed to the published version of the manuscript.
Funding
This work is supported by the National Key Research and Development Program of China (Grant Number 2016YFF0203400), the Scientific Research Fund of Hunan Provincial Education Department (Grant Number 17A069), and the National Natural Science Foundation of People’s Republic of China (Grant Number 51475160).
Conflicts of Interest
The authors declare no conflict of interest.
References
- IRENA. Renewable Energy Statistics 2019; The International Renewable Energy Agency: Abu Dhabi, UAE, 2019. [Google Scholar]
- Yang, W.; Tavner, P.J.; Crabtree, C.J.; Feng, Y.; Qiu, Y. Wind turbine condition monitoring: Technical and commercial challenges. Wind Energy 2014, 17, 673–693. [Google Scholar] [CrossRef] [Green Version]
- Zhang, P.; Lu, D. A Survey of Condition Monitoring and Fault Diagnosis toward Integrated O&M for Wind Turbines. Energies 2019, 12, 2801. [Google Scholar]
- Liu, Z.; Zhang, L. A review of failure modes, condition monitoring and fault diagnosis methods for large-scale wind turbine bearings. Measurement 2019, 149, 107002. [Google Scholar] [CrossRef]
- Artigao, E.; Martín-Martínez, S.; Honrubia-Escribano, A.; Gómez-Lázaro, E. Wind turbine reliability: A comprehensive review towards effective condition monitoring development. Appl. Energy 2018, 228, 1569–1583. [Google Scholar] [CrossRef]
- Stetco, A.; Dinmohammadi, F.; Zhao, X.; Robu, V.; Flynn, D.; Barnes, M.; Keane, J.; Nenadic, G. Machine learning methods for wind turbine condition monitoring: A review. Renew. Energy 2019, 133, 620–635. [Google Scholar] [CrossRef]
- Kusiak, A.; Li, W. The prediction and diagnosis of wind turbine faults. Renew. Energy 2011, 36, 16–23. [Google Scholar] [CrossRef]
- Zhang, Z.; Kusiak, A. Monitoring wind turbine vibration based on SCADA data. ASME J. Solar Energy Eng. 2012, 134, 021004. [Google Scholar] [CrossRef]
- Feng, Y.; Qiu, Y.; Crabtree, C.J.; Long, H.; Tavner, P.J. Use of SCADA and CMS signals for failure detection and diagnosis of a wind turbine gearbox. In Proceedings of the European Wind Energy Conference and Exhibition EWEA, Brussels, Belgium, 14–17 March 2011. [Google Scholar]
- Kim, K.; Parthasarathy, G.; Uluyol, O.; Foslien, W.; Sheng, S.; Fleming, P. Use of SCADA data for failure detection in wind turbines. In Proceedings of the ASME 2011 5th International Conference on Energy Sustainability 2011, Washington, DC, USA, 7–10 August 2011; American Society of Mechanical Engineers: New York, NY, USA; pp. 2071–2079. [Google Scholar]
- Yongjie, Z.; Dongfeng, W.; Junying, Z.; Yuejiao, H. Research on early fault diagnostic method of wind turbines. Telkomnika Indones. J. Eng. 2013, 11, 2330–2341. [Google Scholar] [CrossRef]
- Yang, W.; Court, R.; Jiang, J. Wind turbine condition monitoring by the approach of SCADA data analysis. Renew. Energy 2013, 53, 365–376. [Google Scholar] [CrossRef]
- Gill, S.; Stephen, B.; Galloway, S. Wind turbine condition assessment through power curve copula modeling. IEEE Trans. Sustain. Energy 2012, 3, 94–101. [Google Scholar] [CrossRef] [Green Version]
- Kusiak, A.; Verma, A. Monitoring wind farms with performance curves. IEEE Trans. Sustain. Energy 2013, 4, 192–199. [Google Scholar] [CrossRef]
- Yan, Y.; Li, J.; Gao, D.W. Condition parameter modeling for anomaly detection in wind turbines. Energies 2014, 7, 3104–3120. [Google Scholar] [CrossRef] [Green Version]
- Zhu, Y.; Zhu, C.; Song, C.; Li, Y.; Chen, X.; Yong, B. Improvement of reliability and wind power generation based on wind turbine real-time condition assessment. Int. J. Electr. Power Energy Syst. 2019, 113, 344–354. [Google Scholar] [CrossRef]
- Zaher, A.S.A.E.; McArthur, S.D.J.; Infield, D.G.; Patel, Y. Online wind turbine fault detection through automated SCADA data analysis. Wind Energy 2009, 12, 574–593. [Google Scholar] [CrossRef]
- Schlechtingen, M.; Santos, I.F.; Achiche, S. Wind turbine condition monitoring based on SCADA data using normal behavior models. Part 1: System description. Appl. Soft Comput. 2013, 13, 259–270. [Google Scholar] [CrossRef]
- Li, J.; Lei, X.; Li, H.; Ran, L. Normal behavior models for the condition assessment of wind turbine generator systems. Electr. Power Compon. Syst. 2014, 42, 1201–1212. [Google Scholar] [CrossRef]
- Ren, H.; Liu, W.; Shan, M.; Wang, X. A new wind turbine health condition monitoring method based on VMD-MPE and feature-based transfer learning. Measurement 2019, 148, 106906. [Google Scholar] [CrossRef]
- Dai, J.; Liu, D.; Wen, L.; Long, X. Research on power coefficient of wind turbines based on SCADA data. Renew. Energy 2016, 86, 206–215. [Google Scholar] [CrossRef]
- Calif, R.; François, G.; Schmitt, F. The Scaling Properties of the Turbulent Wind Using Empirical Mode Decomposition and Arbitrary Order Hilbert Spectral Analysis. In Wind Energy-Impact of Turbulence; Springer: Berlin/Heidelberg, Germany, 2014; pp. 43–49. [Google Scholar]
- Calif, R.; Schmitt, F. Multiscaling and joint multiscaling of the atmospheric wind speed and the aggregate power output from a wind farm. Nonlinear Process. Geophys. 2014, 21, 379–392. [Google Scholar] [CrossRef] [Green Version]
- IEC 61400-12-1. Wind Turbines Part 12-1: Power Performance Measurements of Electricity Producing Wind Turbines; IEC: Geneva, Switzerland, 2005. [Google Scholar]
- Tony, B.; Nick, J.; David, S.; Ervin, B. Wind Energy Hand-Book; John Wiley & Sons Ltd.: New York, NY, USA, 2005. [Google Scholar]
- Zhang, F.; Liu, D.S.; Dai, J.C.; Wang, C.; Shen, X.B. An Operating Condition Recognition Method of Wind Turbine Based on SCADA Parameter Relations. J. Mech. Eng. 2019, 55, 1–9. (In Chinese) [Google Scholar] [CrossRef]
Figure 1.
Sliding window model.

Figure 2.
Scattered relationship between wind speed and output power.

Figure 3.
Relationship between wind speed and output power after bin processing.
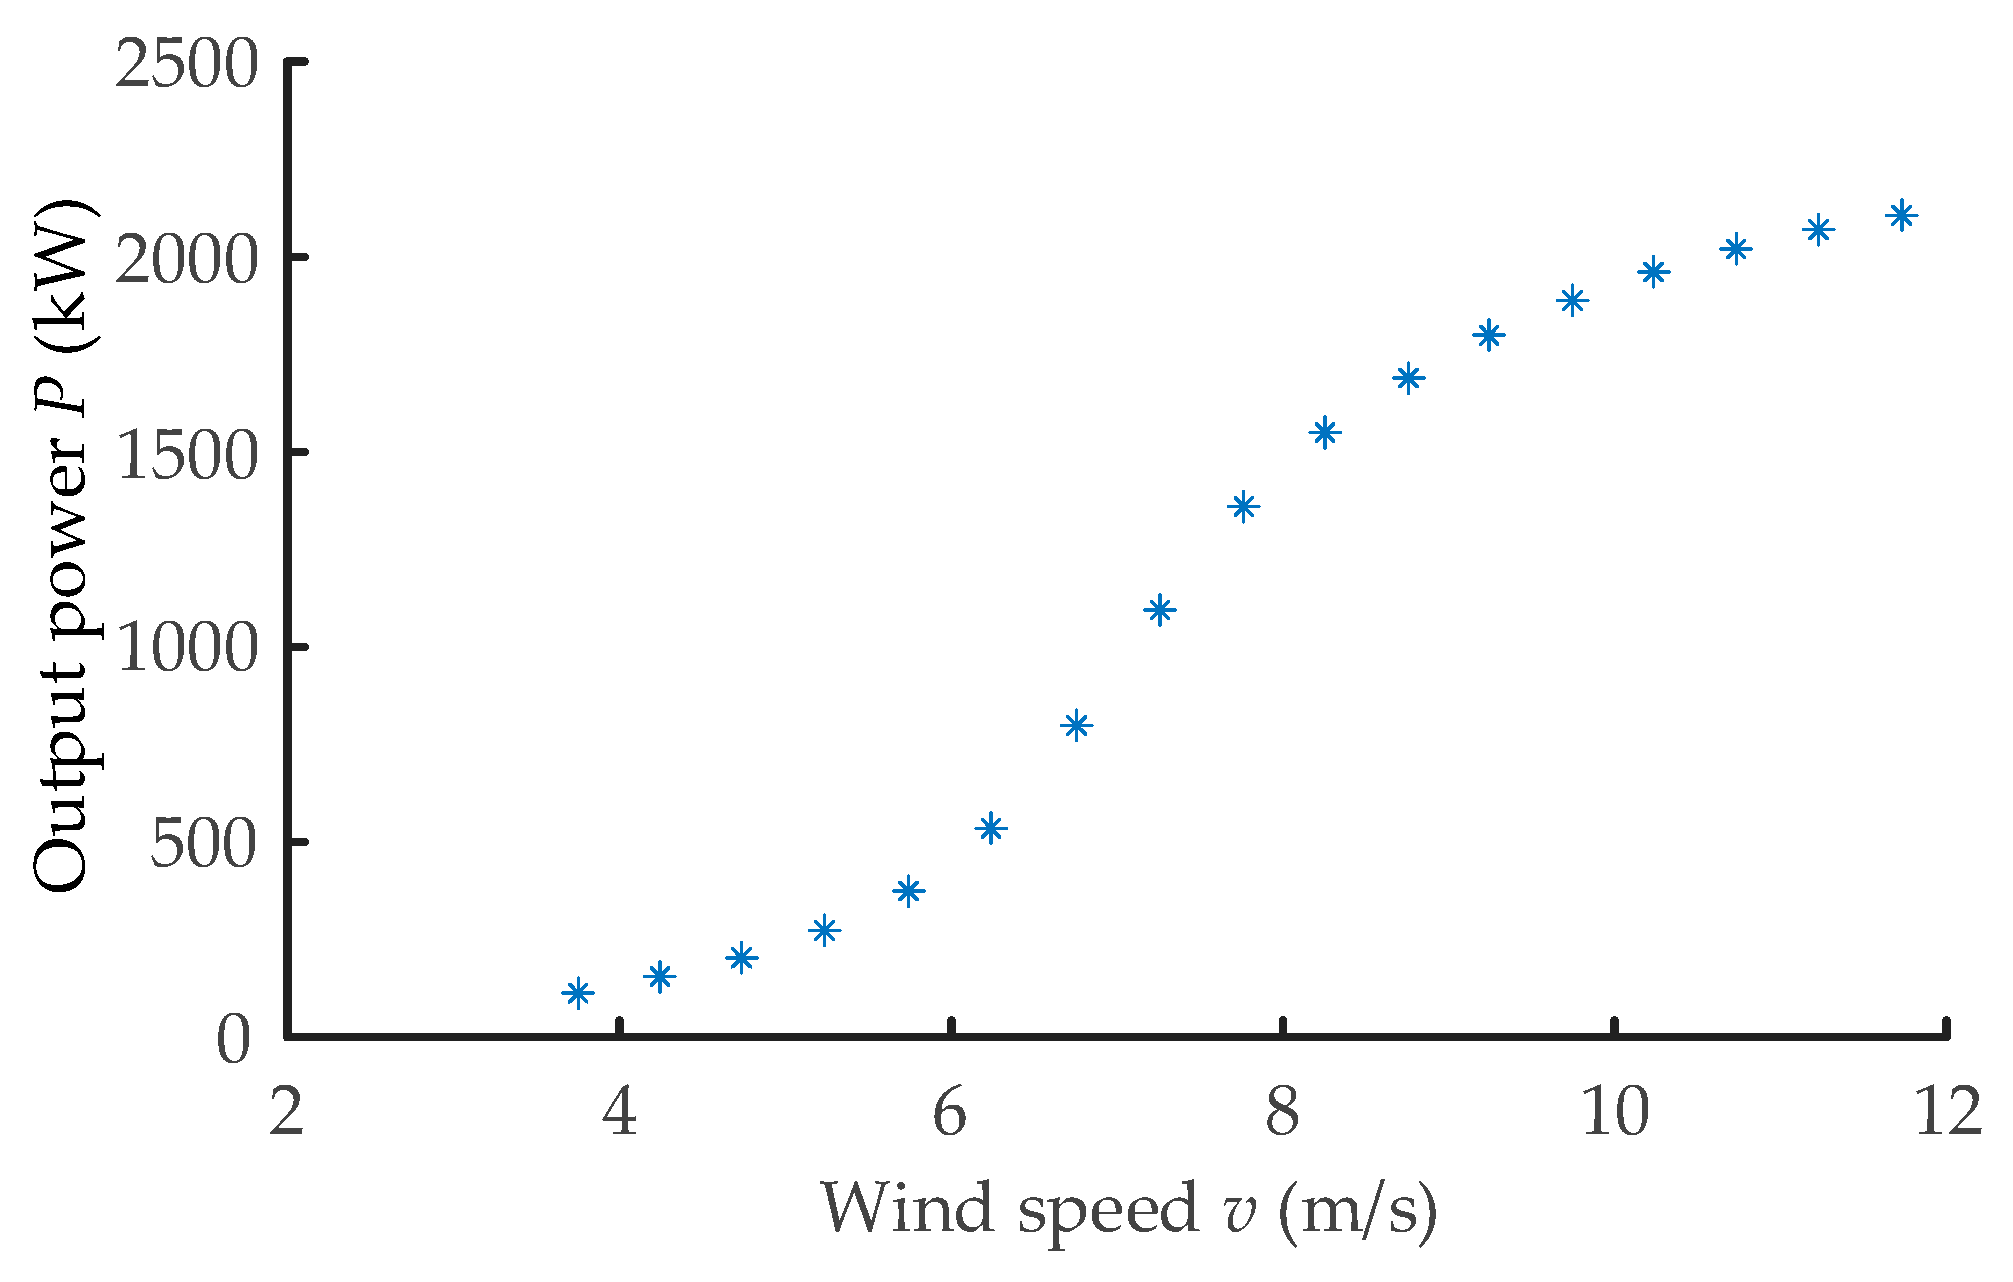
Figure 4.
Comparison of the health indicators of wind turbine operating conditions (total time step n = 73).
Figure 4.
Comparison of the health indicators of wind turbine operating conditions (total time step n = 73).
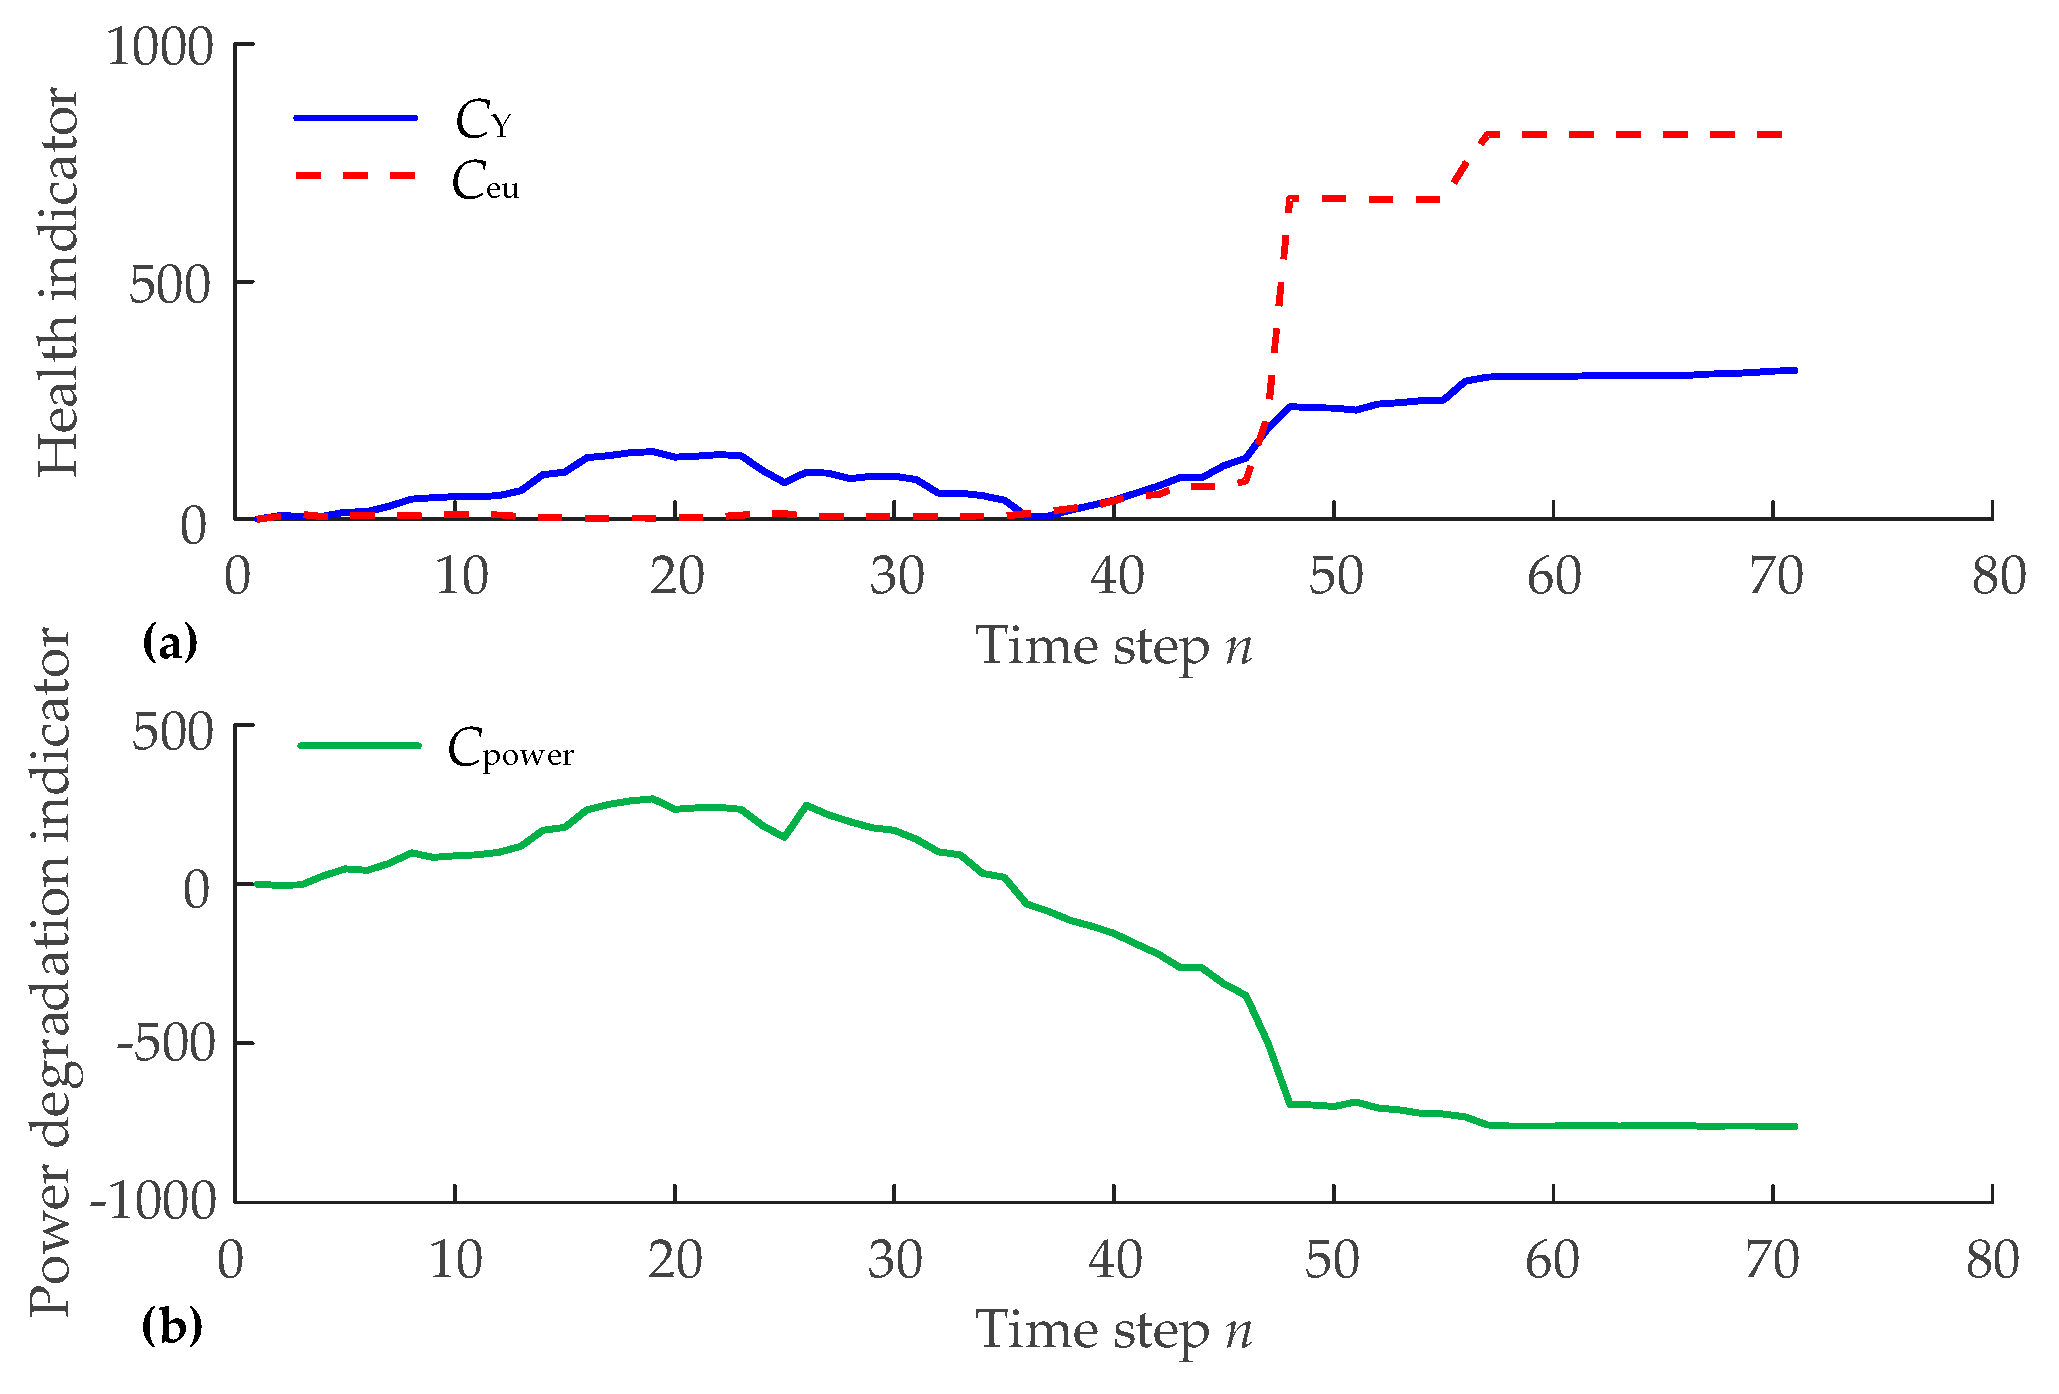
Figure 5.
Directly calculated wind power coefficient.
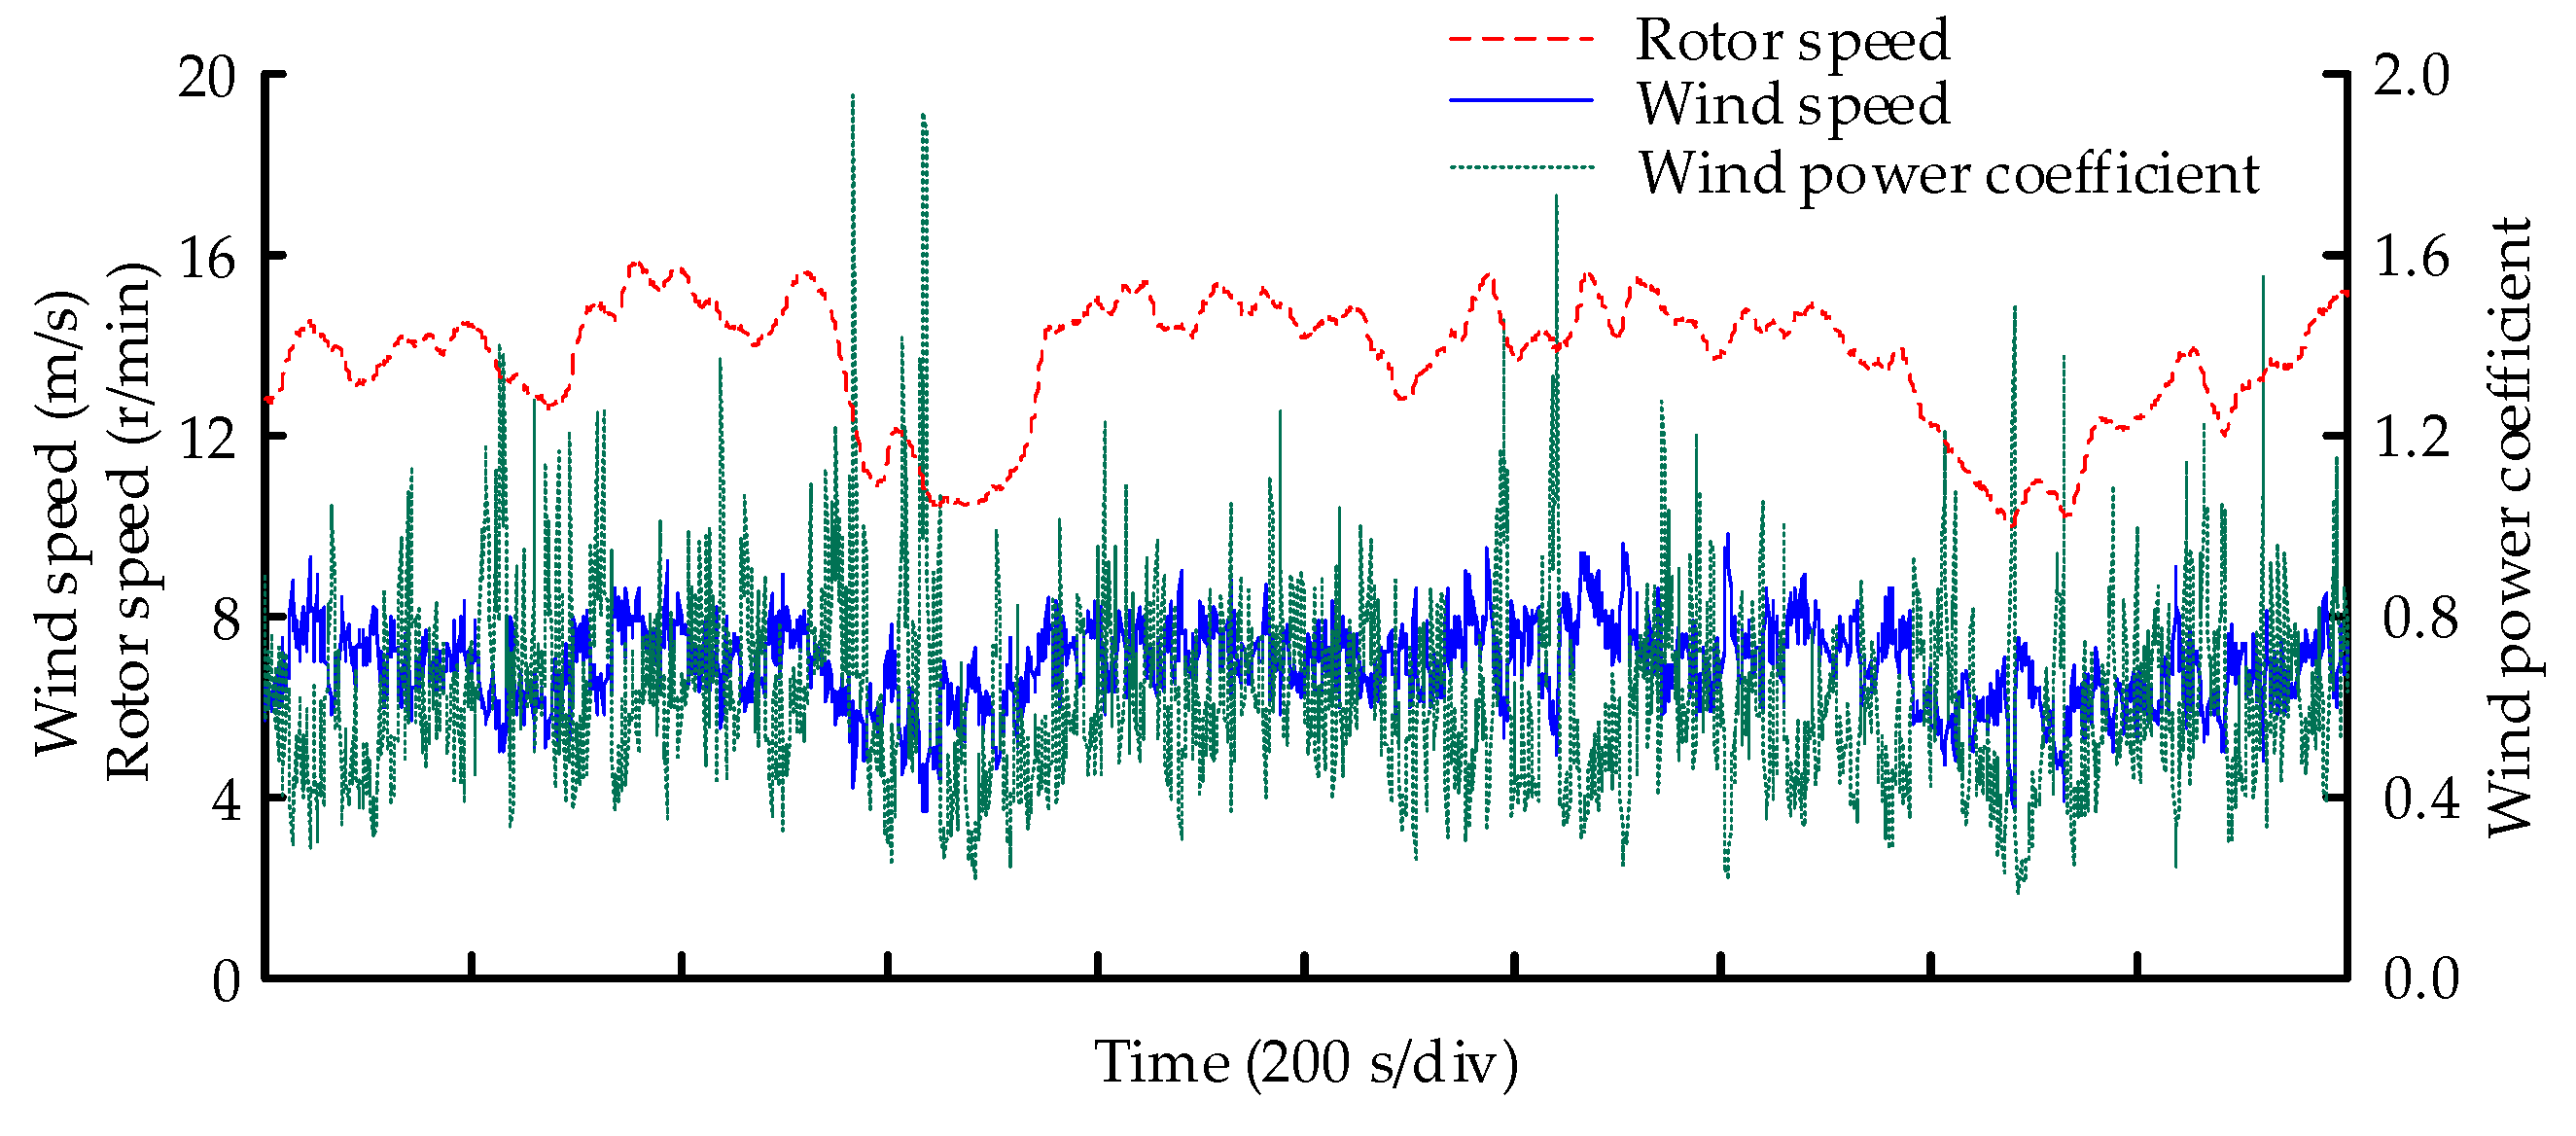
Figure 6.
Wind power coefficient trends with time (total time step n = 73).
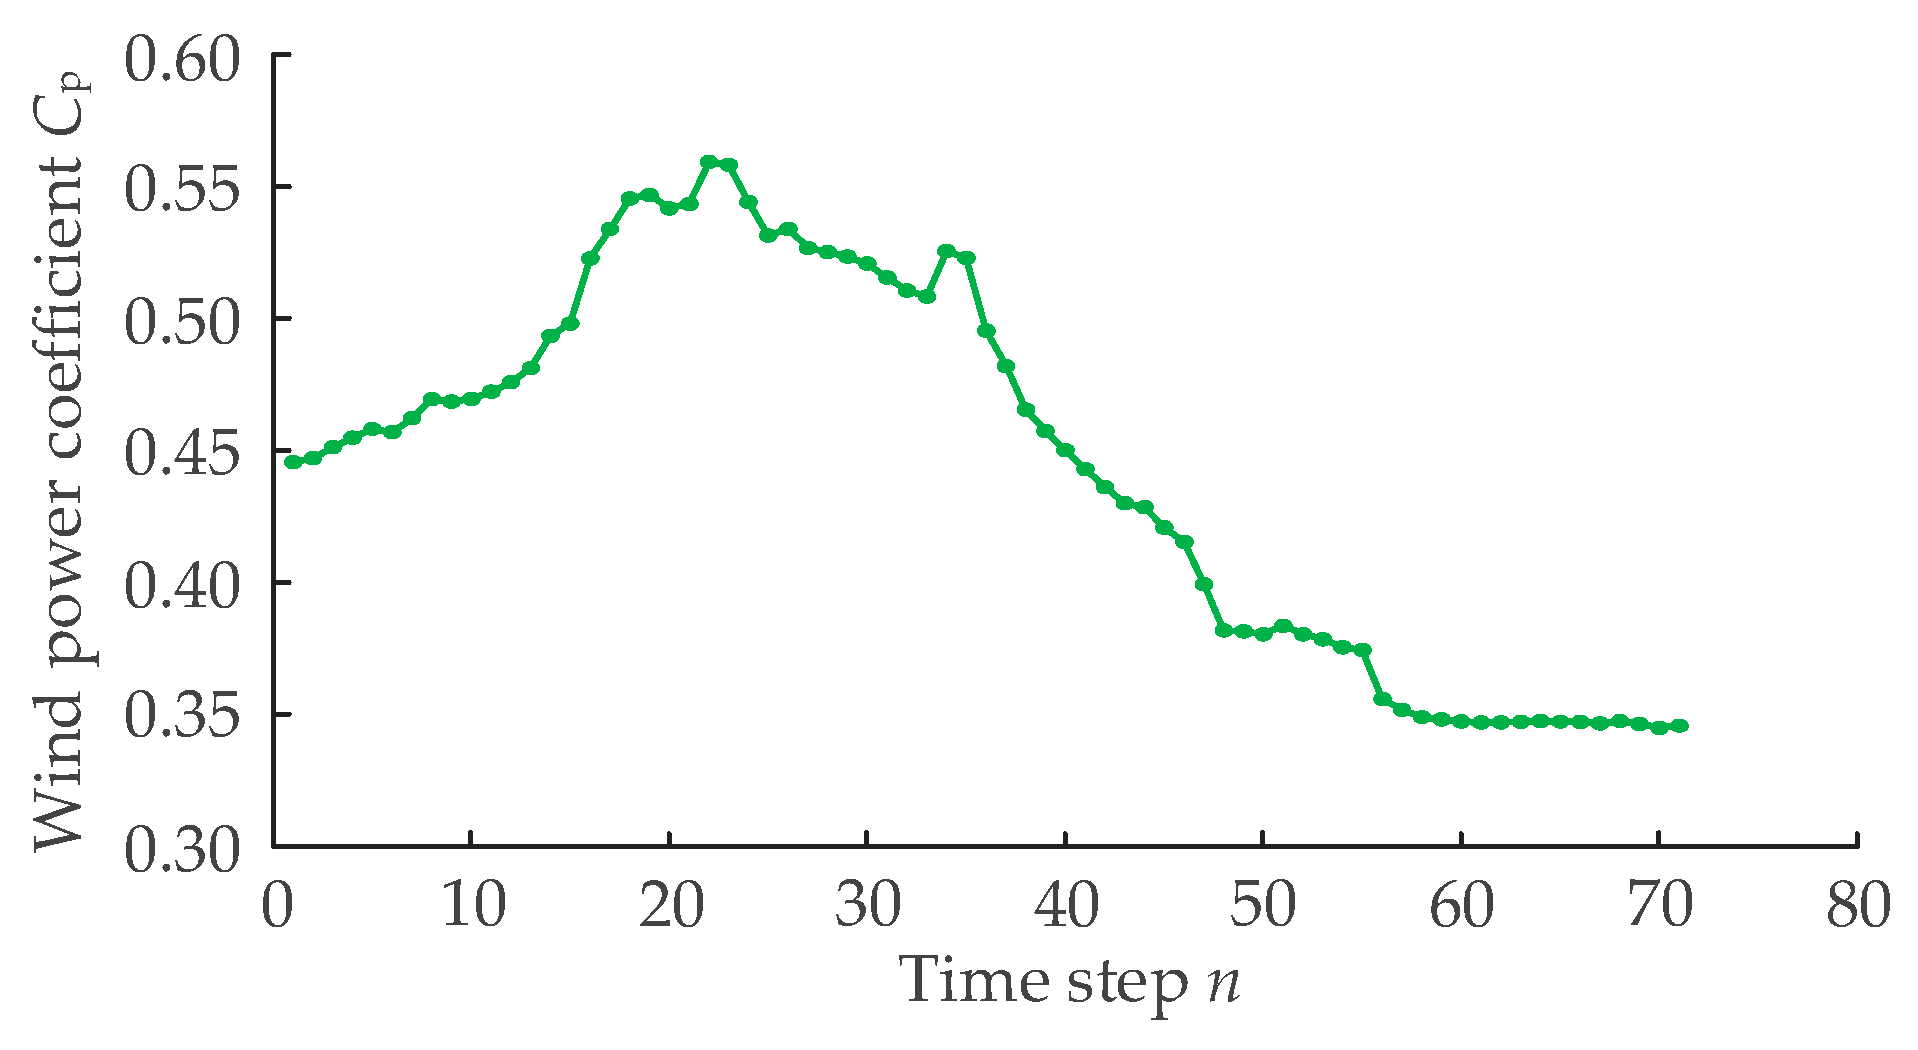
Figure 7.
Regularity of health status indicators over time (total time step n = 73).

Figure 8.
Comparison of state model curves and standard state model curves at different times.

Figure 9.
Health indicators of WT1 under different window widths: (a) h = 12 h, total time step n = 85; (b) h = 24 h, total time step n = 73; (c) h = 36 h, total time step n = 61; (d) h = 48 h, total time step n = 49.
Figure 9.
Health indicators of WT1 under different window widths: (a) h = 12 h, total time step n = 85; (b) h = 24 h, total time step n = 73; (c) h = 36 h, total time step n = 61; (d) h = 48 h, total time step n = 49.
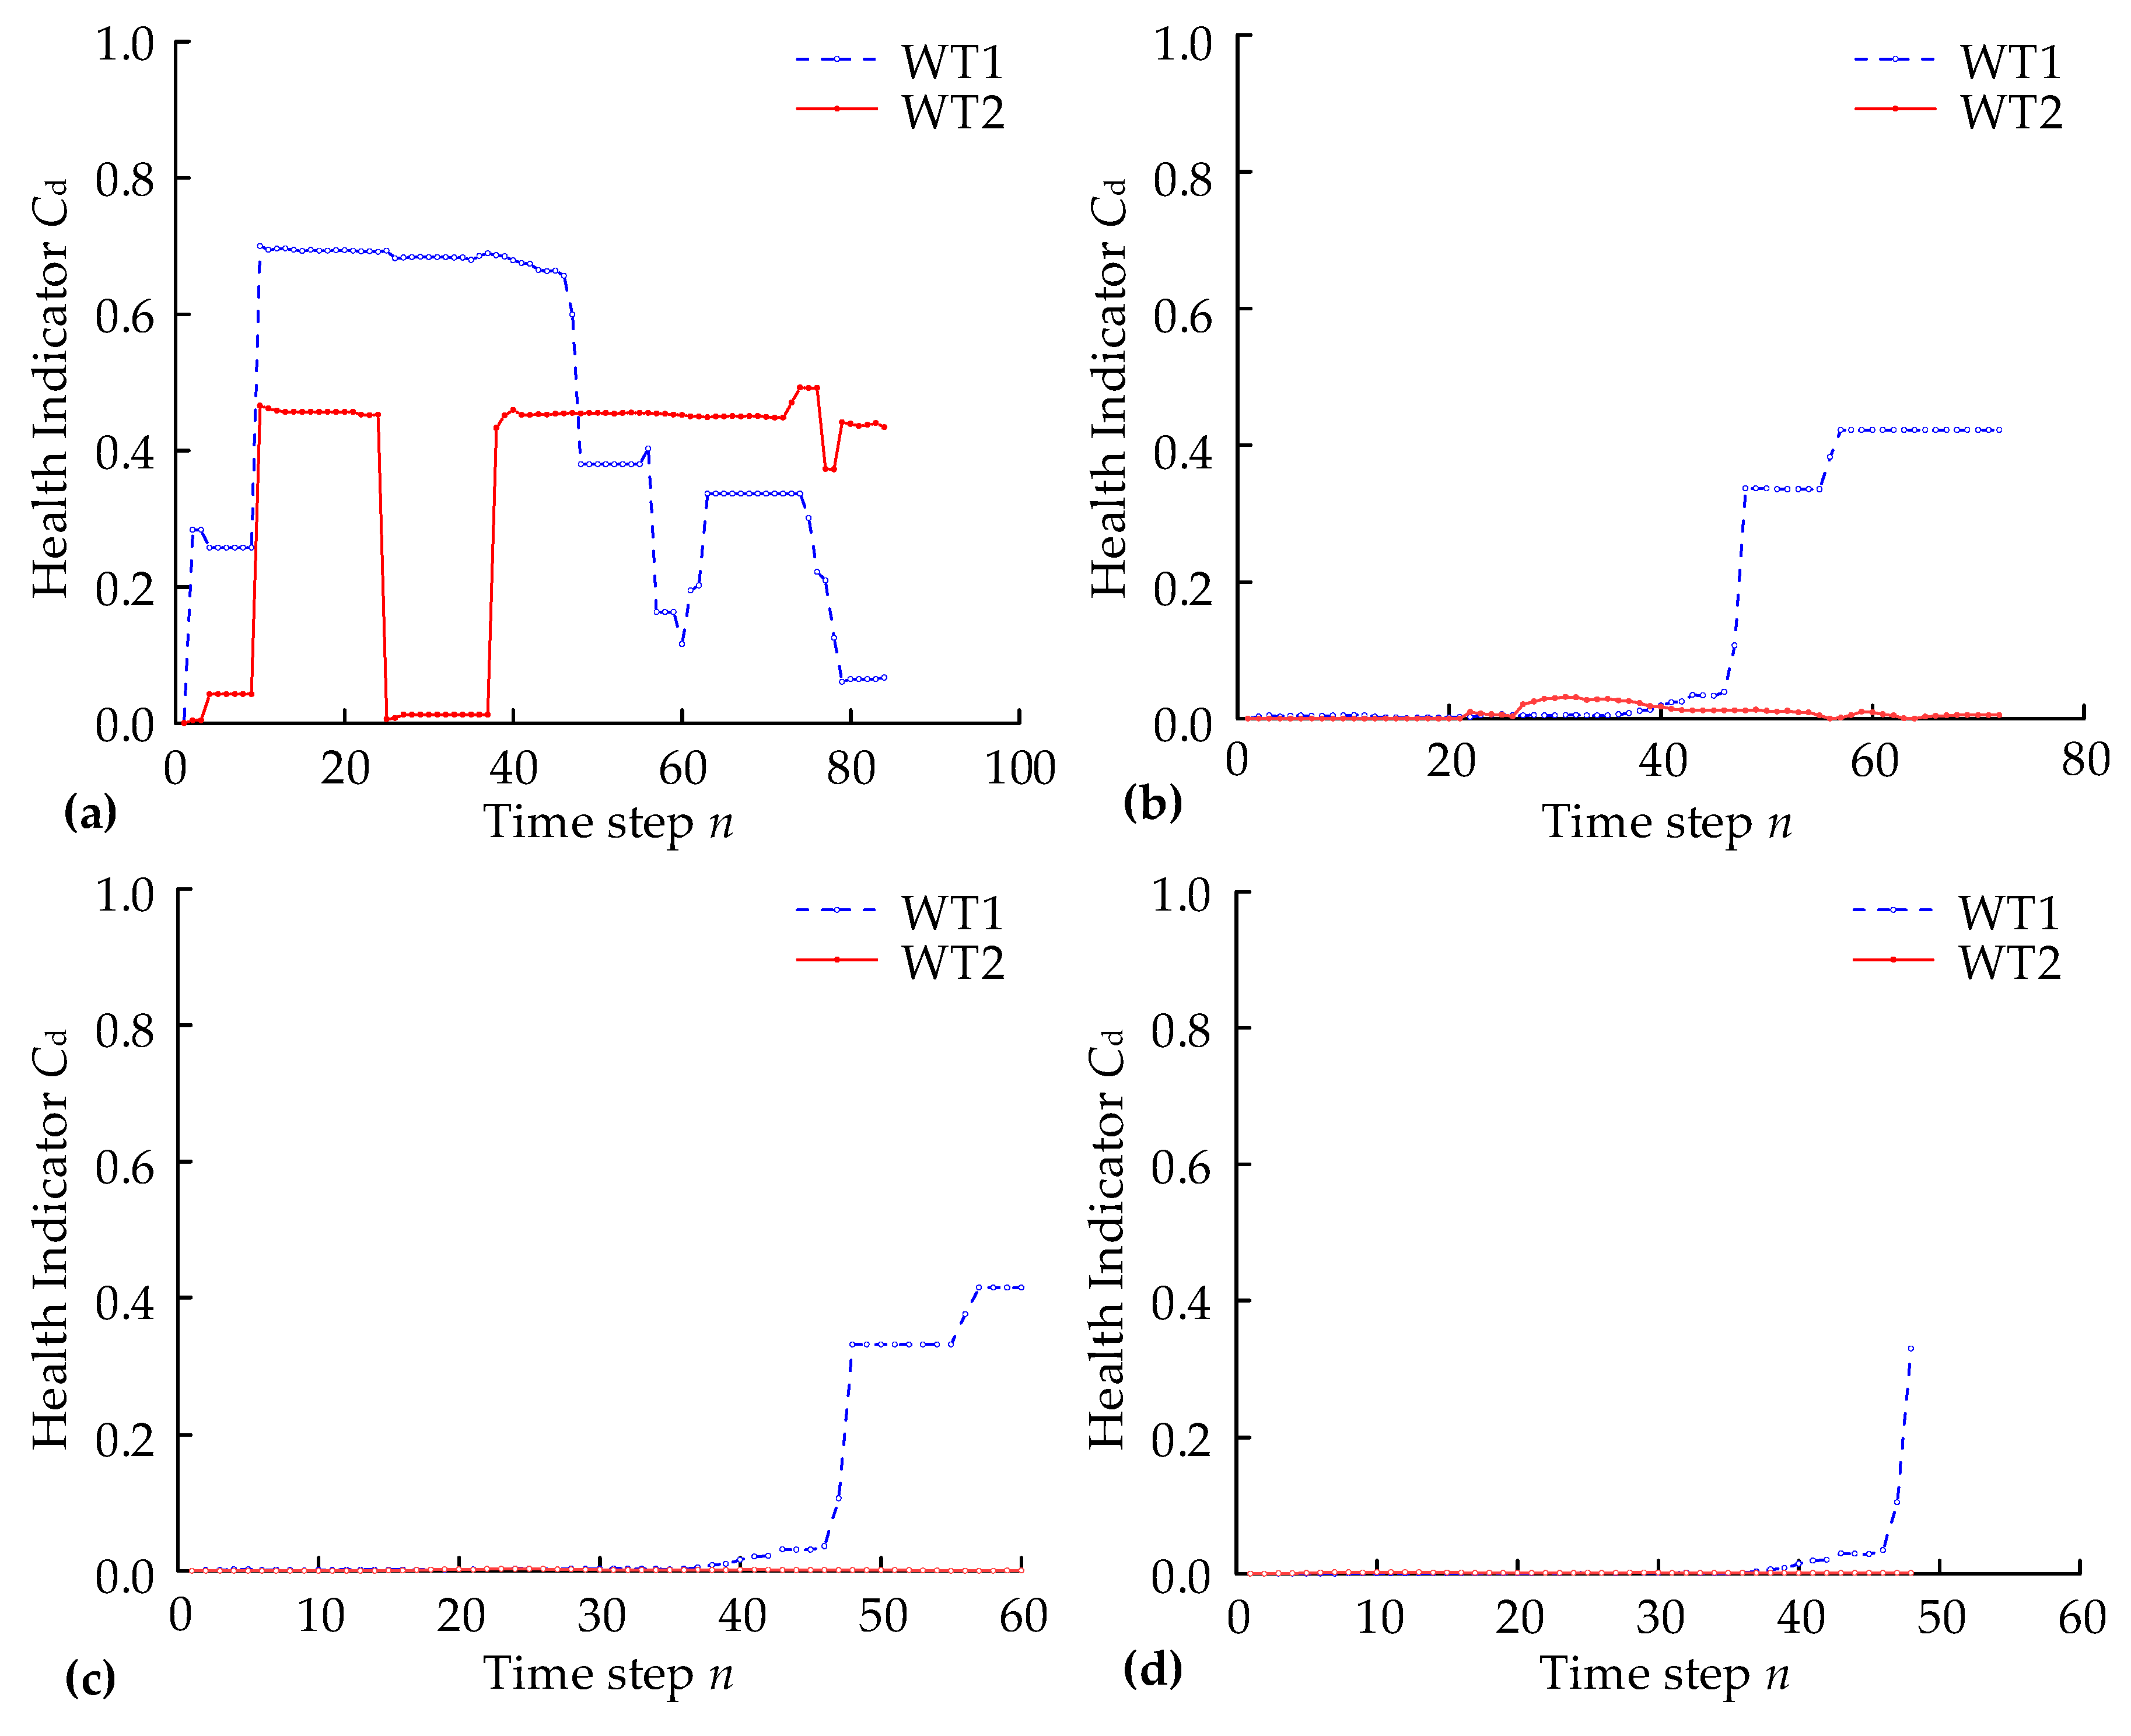
Figure 10.
Effect of time increment on the health indicators of the wind turbine: (a) q = 0.5 h, total time step n = 145; (b) q = 1 h, total time step n = 73; (c) q = 1.5 h, total time step n = 49; (d) q = 2 h, total time step n = 37.
Figure 10.
Effect of time increment on the health indicators of the wind turbine: (a) q = 0.5 h, total time step n = 145; (b) q = 1 h, total time step n = 73; (c) q = 1.5 h, total time step n = 49; (d) q = 2 h, total time step n = 37.
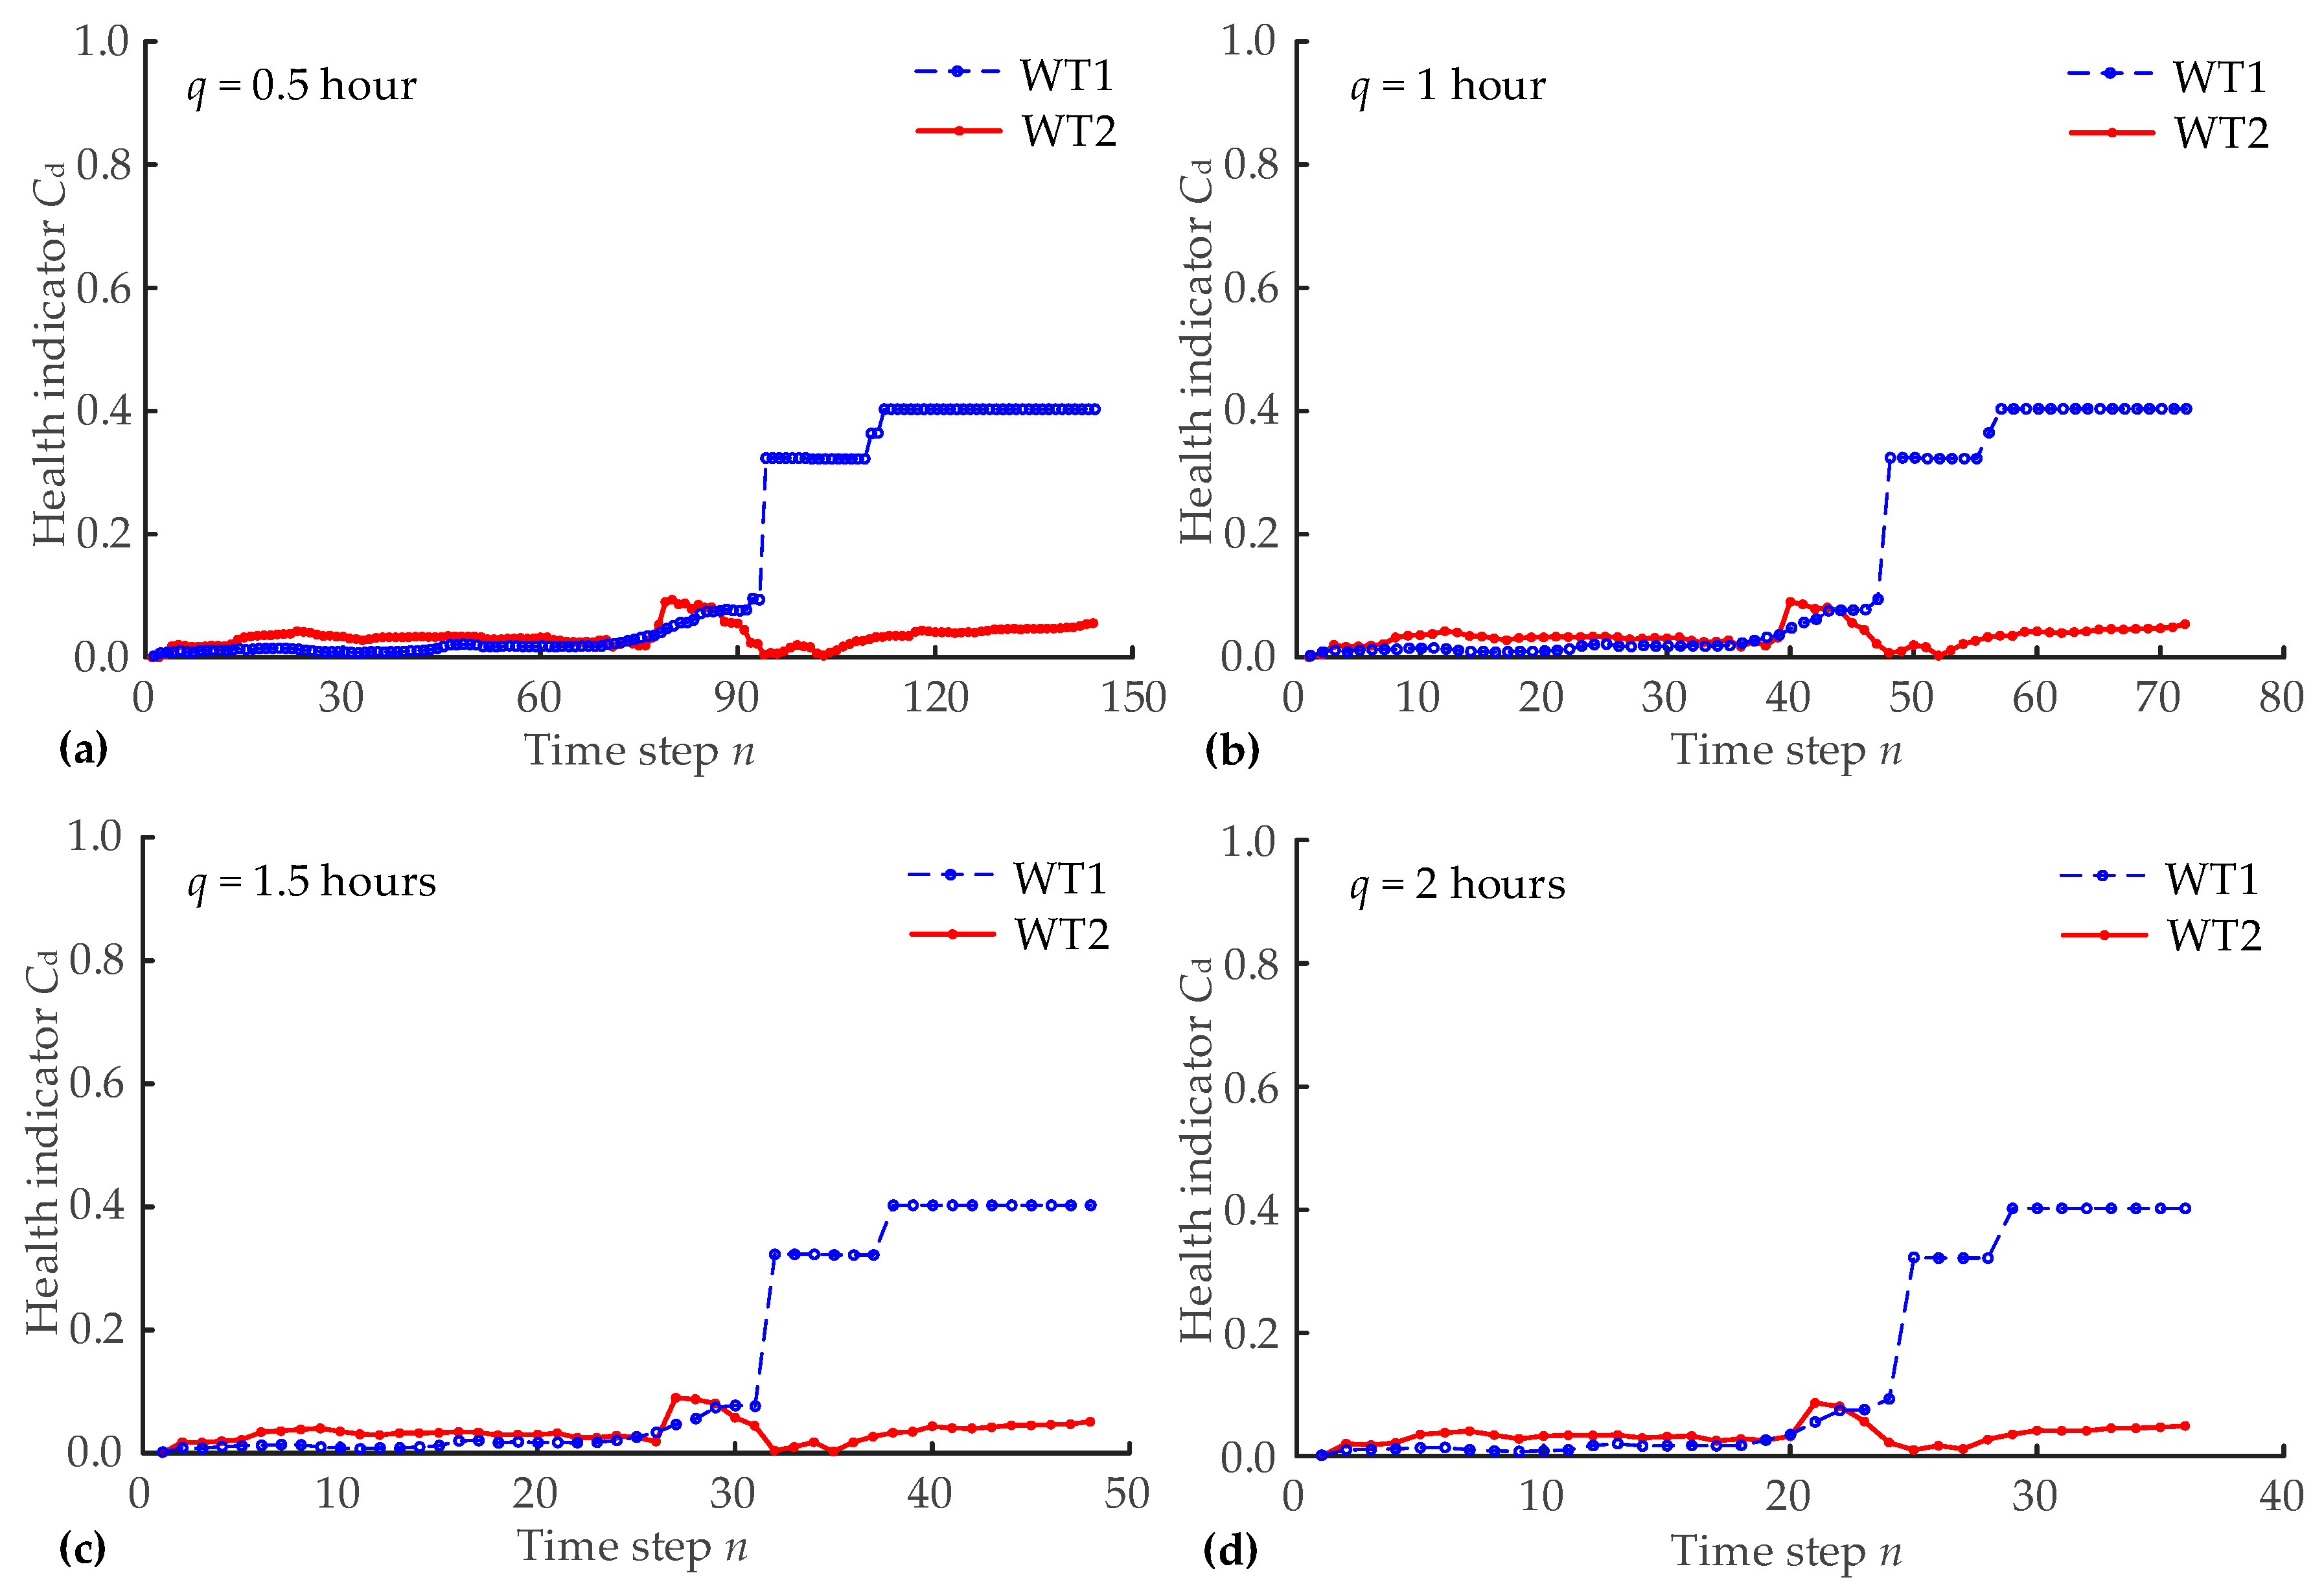
Figure 11.
Time consumption at different time increments.
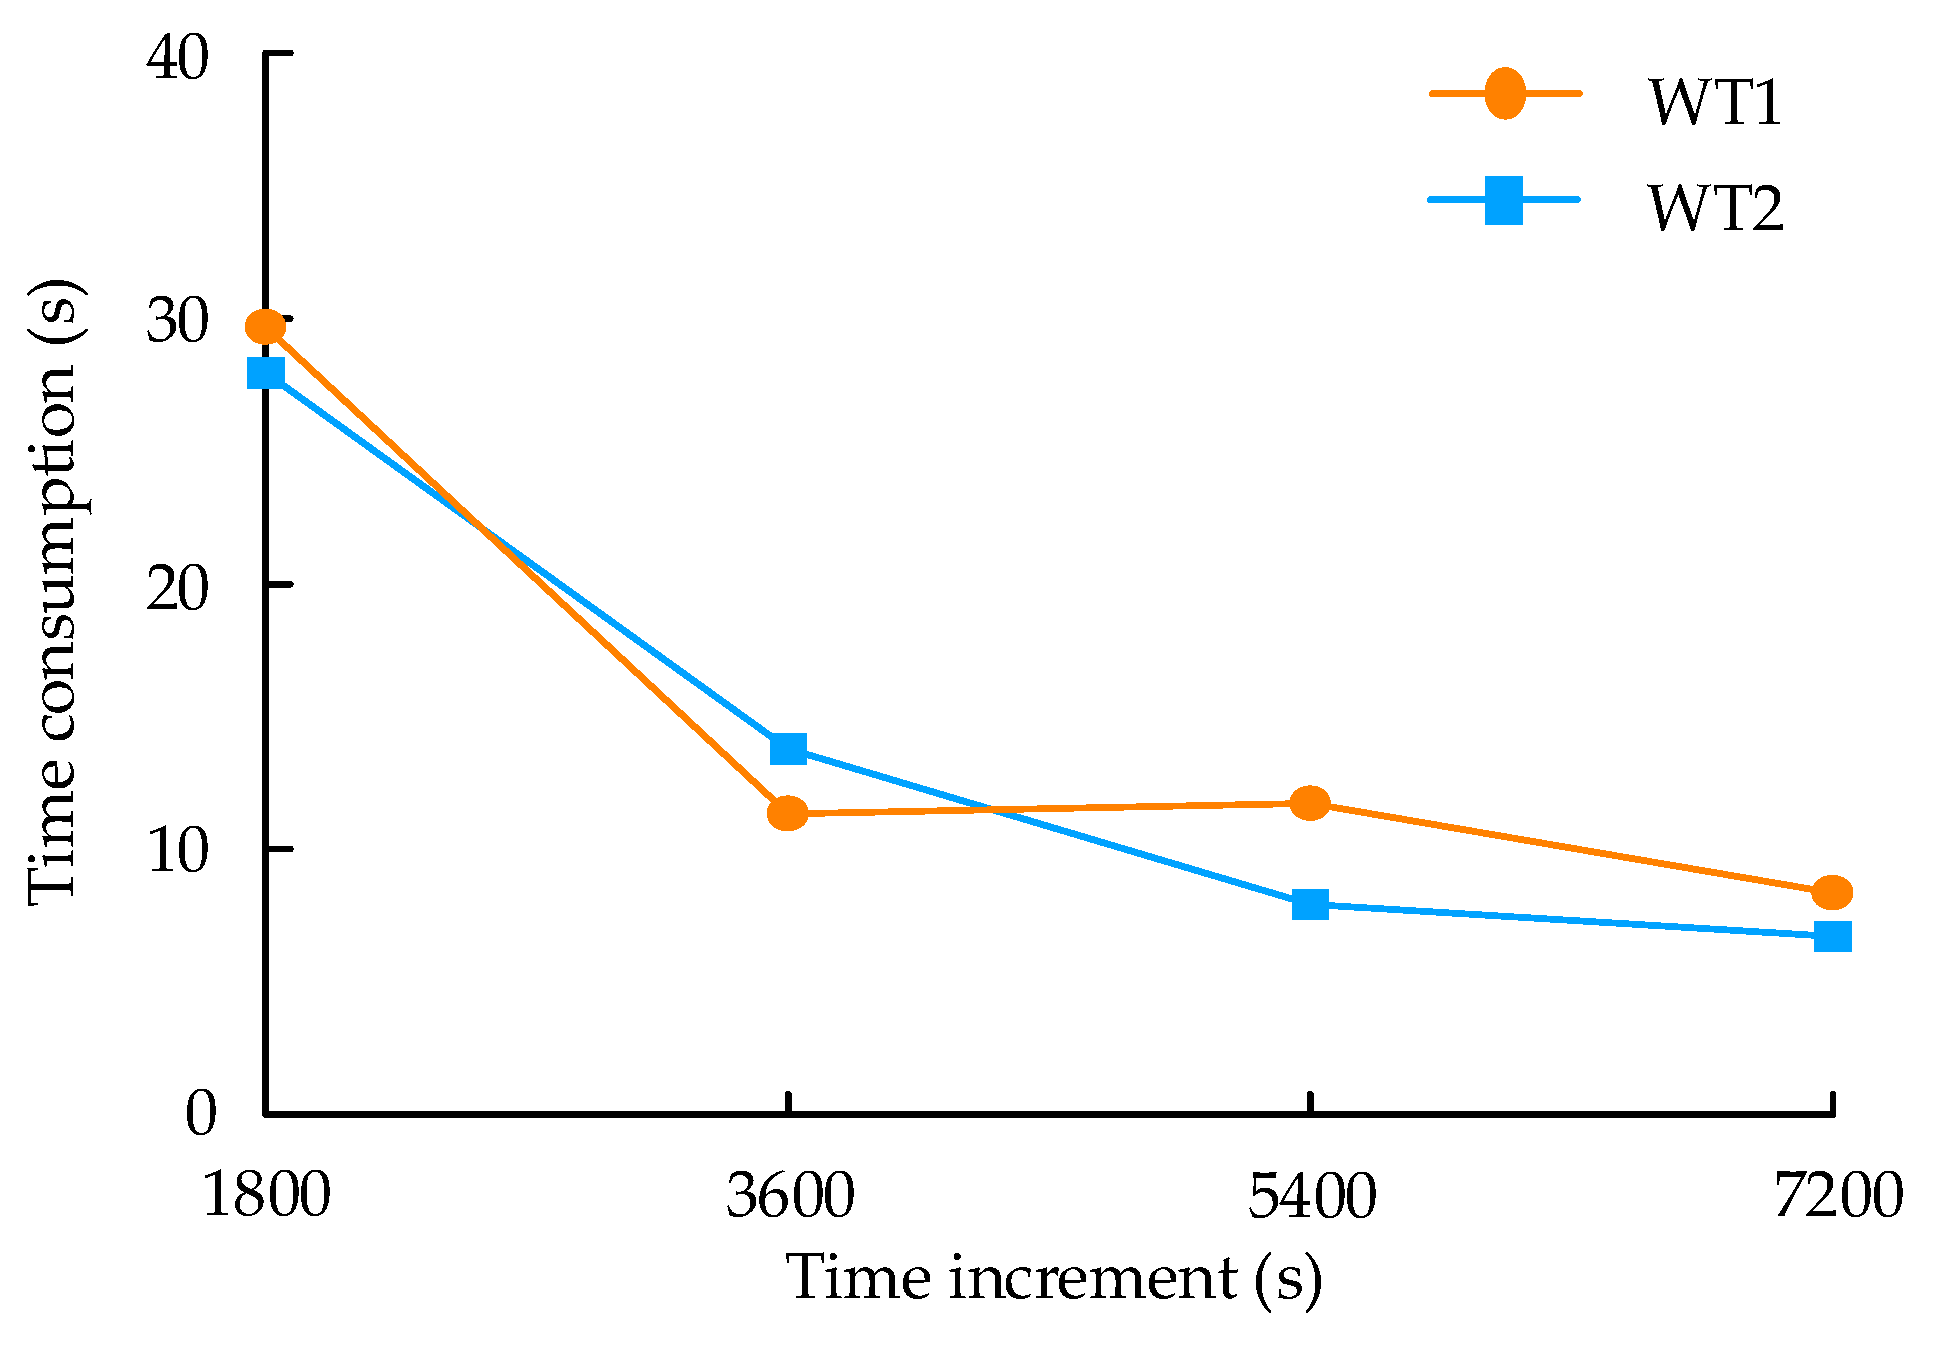
Figure 12.
Effect of sampling frequency on the health indicators of the wind turbine: (a) sampling frequency is 0.2 Hz, total time step n = 73; (b) sampling frequency is 0.1 Hz, total time step n = 73.
Figure 12.
Effect of sampling frequency on the health indicators of the wind turbine: (a) sampling frequency is 0.2 Hz, total time step n = 73; (b) sampling frequency is 0.1 Hz, total time step n = 73.
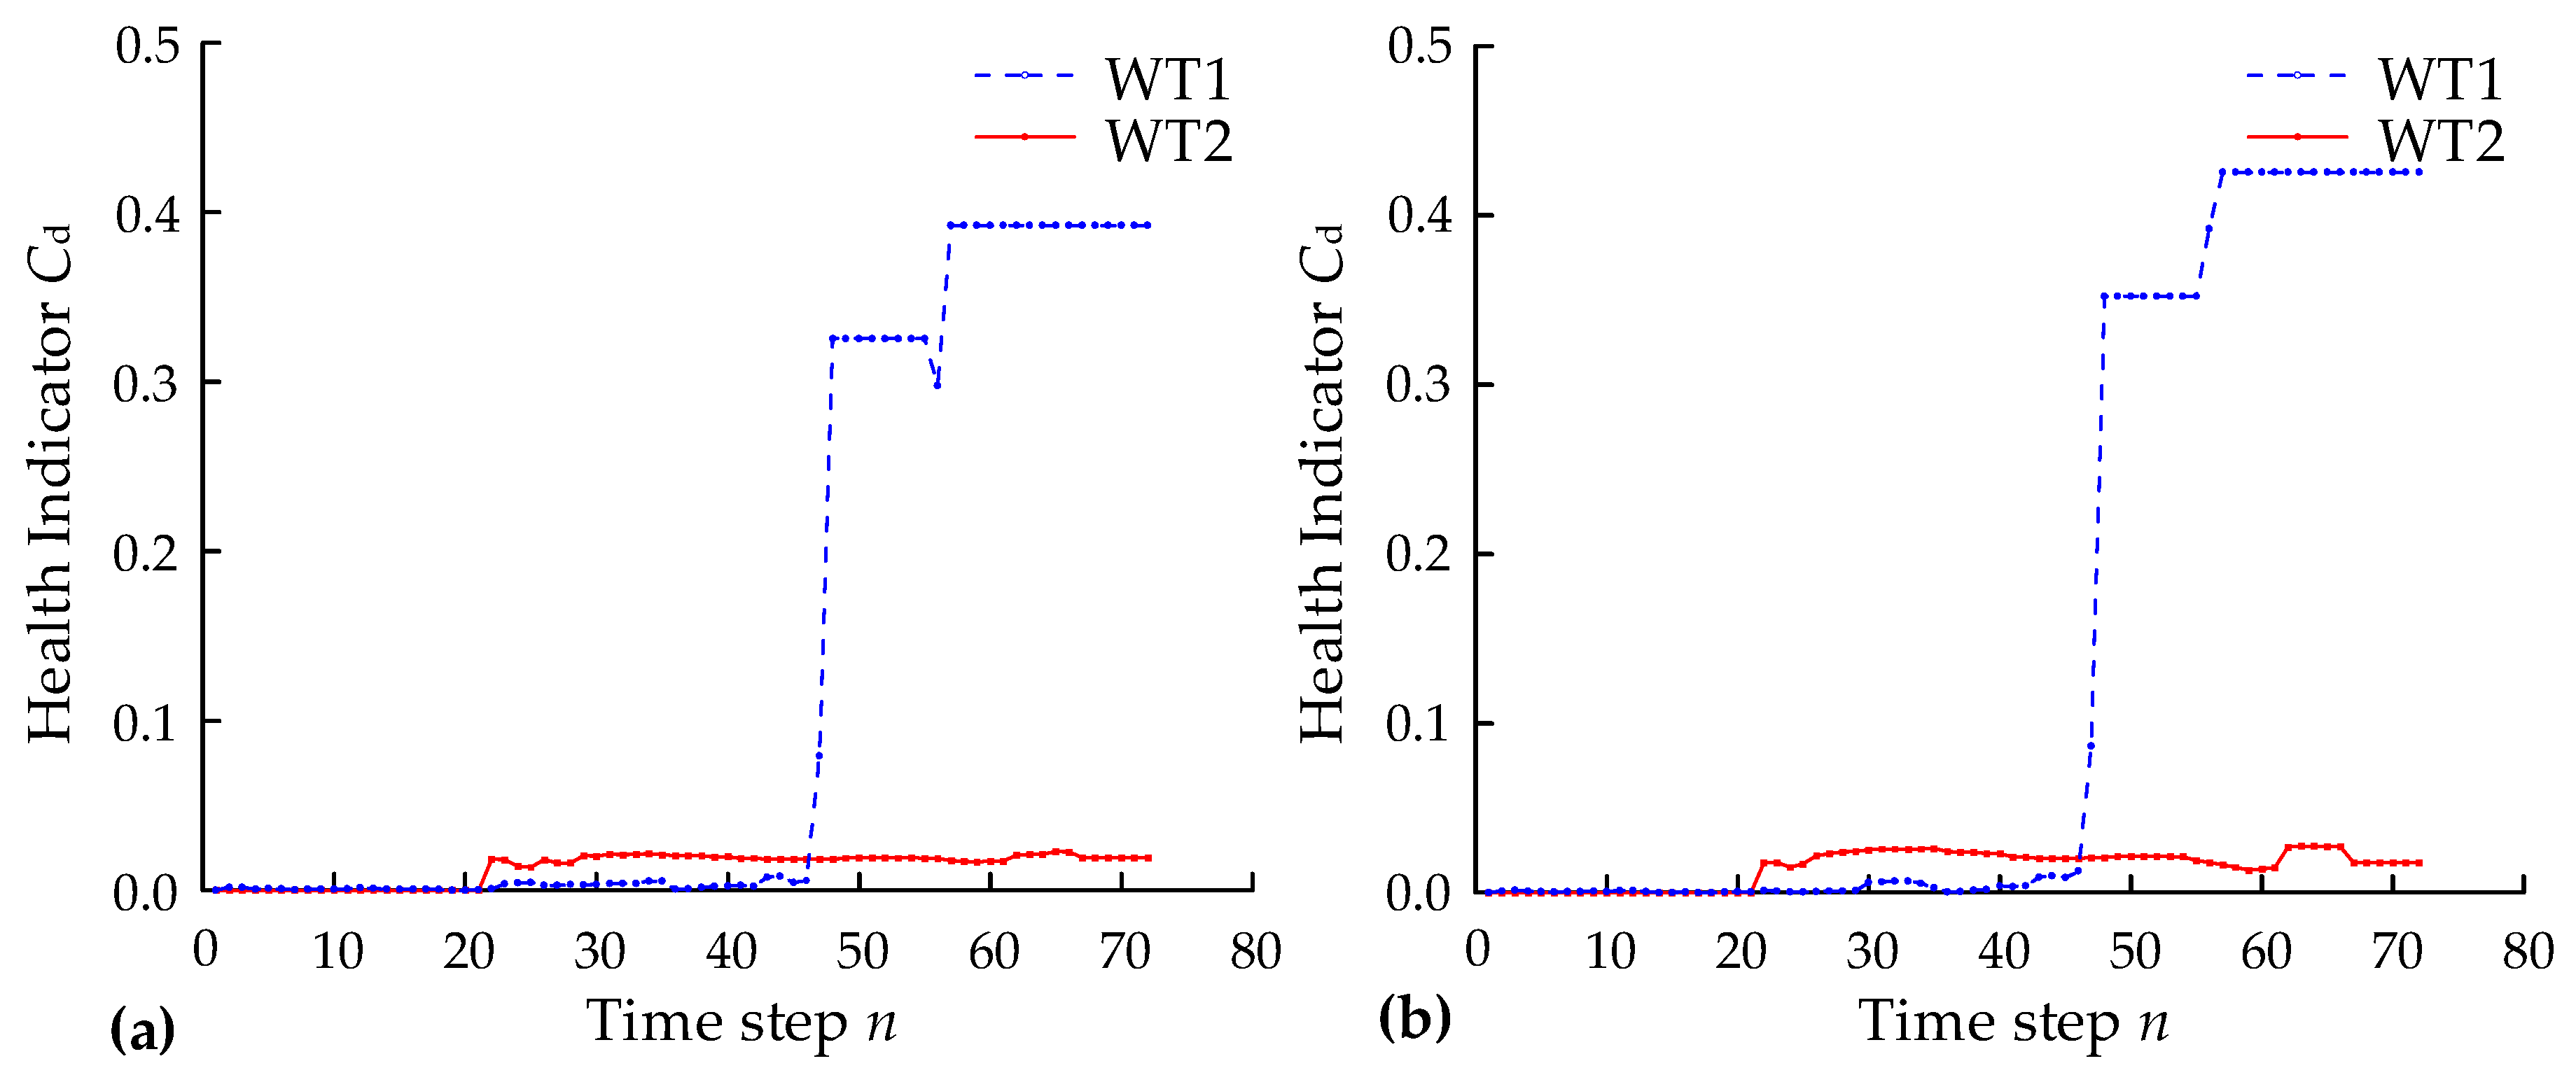
Figure 13.
Comparison between the relationship of wind speed and power with different fitting orders.
Figure 13.
Comparison between the relationship of wind speed and power with different fitting orders.
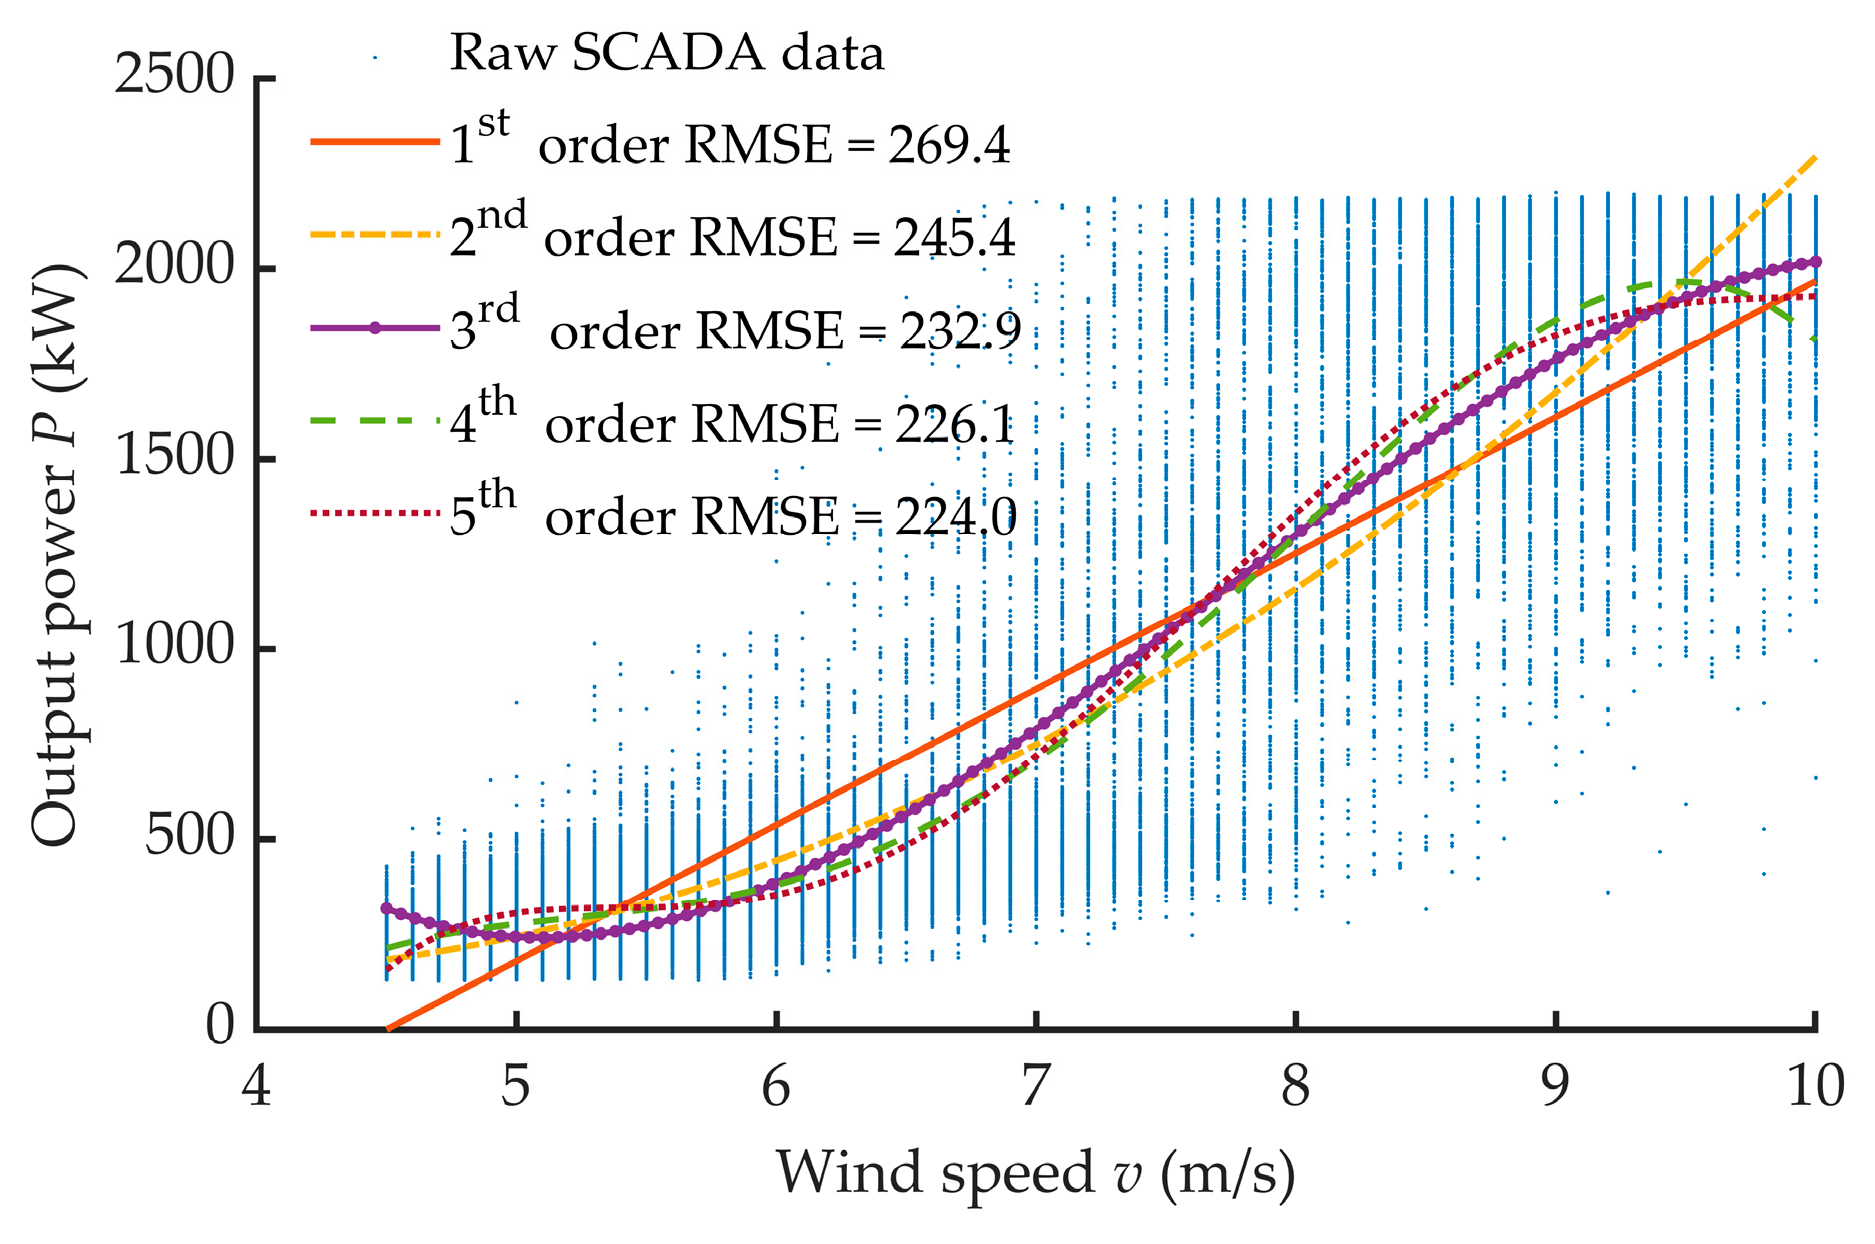
Figure 14.
Comparison of different fitting methods for wind speed and power.

Figure 15.
Comparison of the computation durations of different data processing methods.


Table 1.
Raw SCADA data.
| No. | Time (hh:mm) | Wind Speed (m/s) | Rotor Speed (rpm) | … | Power (kW) |
|---|---|---|---|---|---|
| 1 | 14:20 | 5.9 | 12.82 | … | 434 |
| 2 | 14:20 | 6.0 | 12.72 | … | 432 |
| 3 | 14:20 | 6.1 | 12.72 | … | 435 |
| … | … | … | … | … | … |
Table 2.
Parameters of the 2 MW wind turbines investigated in this study.
| Parameter Name | Value | Parameter Name | Value |
|---|---|---|---|
| Rated power (kW) | 2000 | Cut-in wind speed (m/s) | 3.5 |
| Rotor diameter (m) | 82.6 | Rated wind speed (m/s) | 12 |
| Tower height (m) | 80 | Cut-out wind speed (m/s) | 25 |
| Rated rotor speed (rpm) | 17 | Maximum wind speed (m/s) | 70 |
| Blade weight (kg) | 6750 | Blade length (m) | 40 |
© 2020 by the authors. Licensee MDPI, Basel, Switzerland. This article is an open access article distributed under the terms and conditions of the Creative Commons Attribution (CC BY) license (http://creativecommons.org/licenses/by/4.0/).
Share and Cite
MDPI and ACS Style
Zhang, F.; Wen, Z.; Liu, D.; Jiao, J.; Wan, H.; Zeng, B. Calculation and Analysis of Wind Turbine Health Monitoring Indicators Based on the Relationships with SCADA Data. Appl. Sci. 2020, 10, 410. https://doi.org/10.3390/app10010410
AMA Style
Zhang F, Wen Z, Liu D, Jiao J, Wan H, Zeng B. Calculation and Analysis of Wind Turbine Health Monitoring Indicators Based on the Relationships with SCADA Data. Applied Sciences. 2020; 10(1):410. https://doi.org/10.3390/app10010410
Chicago/Turabian StyleZhang, Fan, Zejun Wen, Deshun Liu, Jie Jiao, Hengzheng Wan, and Bing Zeng. 2020. "Calculation and Analysis of Wind Turbine Health Monitoring Indicators Based on the Relationships with SCADA Data" Applied Sciences 10, no. 1: 410. https://doi.org/10.3390/app10010410
Note that from the first issue of 2016, this journal uses article numbers instead of page numbers. See further details here.