Sonic Watermarking Method for Ensuring the Integrity of Audio Recordings


1
Electronic Technology and Reliability Department, Politehnica University of Bucharest, 061071 Bucharest, Romania
2
Telecommunications Department, Politehnica University of Bucharest, 061071 Bucharest, Romania
*
Author to whom correspondence should be addressed.
Appl. Sci. 2020, 10(10), 3367; https://doi.org/10.3390/app10103367
Submission received: 31 March 2020
/
Revised: 9 May 2020
/
Accepted: 11 May 2020
/
Published: 13 May 2020
(This article belongs to the Special Issue Recent Developments on Multimedia Computing and Networking)
Abstract
:Featured Application
Sonic watermarking system that can embed the electrical network frequency variation into audio recordings captured with modern recording devices that make the classic ENF criterion ineffective by rejecting the mains hum.
Abstract
Methods for inspecting the integrity of audio recordings become a necessity. The evolution of technology allowed the manufacturing of small, performant, recording devices and significantly decreased the difficulty of audio editing. Any person that participates in a conversation can secretly record it, obtaining their own version of the audio captured using their personal device. The recordings can be easily edited afterwards to change the meaning of the message. The challenge is to prove if recordings were tampered with or not. A reliable solution for this was the highly acclaimed Electrical Network Frequency (ENF) criterion. Newer recording devices are built to avoid picking up the electrical network signal because, from the audio content point of view, it represents noise. Thus, the classic ENF criterion becomes less effective for recordings made with newer devices. The paper describes a novel sonic watermarking (i.e., the watermark is acoustically summed with the dialogue) solution, based on an ambient sound that can be easily controlled and is not suspicious to listeners: the ticking of a clock. This signal is used as a masker for frequency-swept (chirp) signals that are used to encode the ENF and embed it into all the recordings made in a room. The ENF embedded using the proposed watermark solution can be extracted and checked at any later moment to determine if a recording has been tampered with, thus allowing the use of the ENF criterion principles in checking the recordings made with newer devices. The experiments highlight that the method offers very good results in ordinary real-world conditions.
1. Introduction
The current solutions for editing multimedia files allow almost anyone to modify them with results that would not draw the attention of a listener. Free software suites exist, such as Audacity. In this context, proving the authenticity of recordings has a great importance if they are to be used in a court of law. Based on their purpose, audio forensics methods can be classified as follows:
- Methods for authenticity checking—have the goal to find the date and time of a recording, the device that was used for recording, etc.
The solutions for checking the integrity of an audio recording are classified in two categories:
- Passive methods—investigate the artifacts caused by the editing operations such as double compression [3], reverberation changes or, in the case of copy-move operations, consequences of the editing (e.g., finding that certain words are uttered identically in the recording, which is improbable in reality), etc. The great advantage of these methods is that they can be used to analyse any recording. However, the degree of certainty of the result is not high enough to consider them reliable. For example, double compression happens when audio recordings are edited, but it cannot highlight if the meaning of the message has been modified;
- Active methods—rely on the insertion of auxiliary data during the recording. Those are extracted in the integrity check process and compared with the reference data that were inserted when the recording was captured. If the extracted data matches the reference, it can be concluded that the integrity of the recording was preserved. These methods offer a much greater degree of certainty about the offered result, but only the recordings that contain the auxiliary data can be checked.
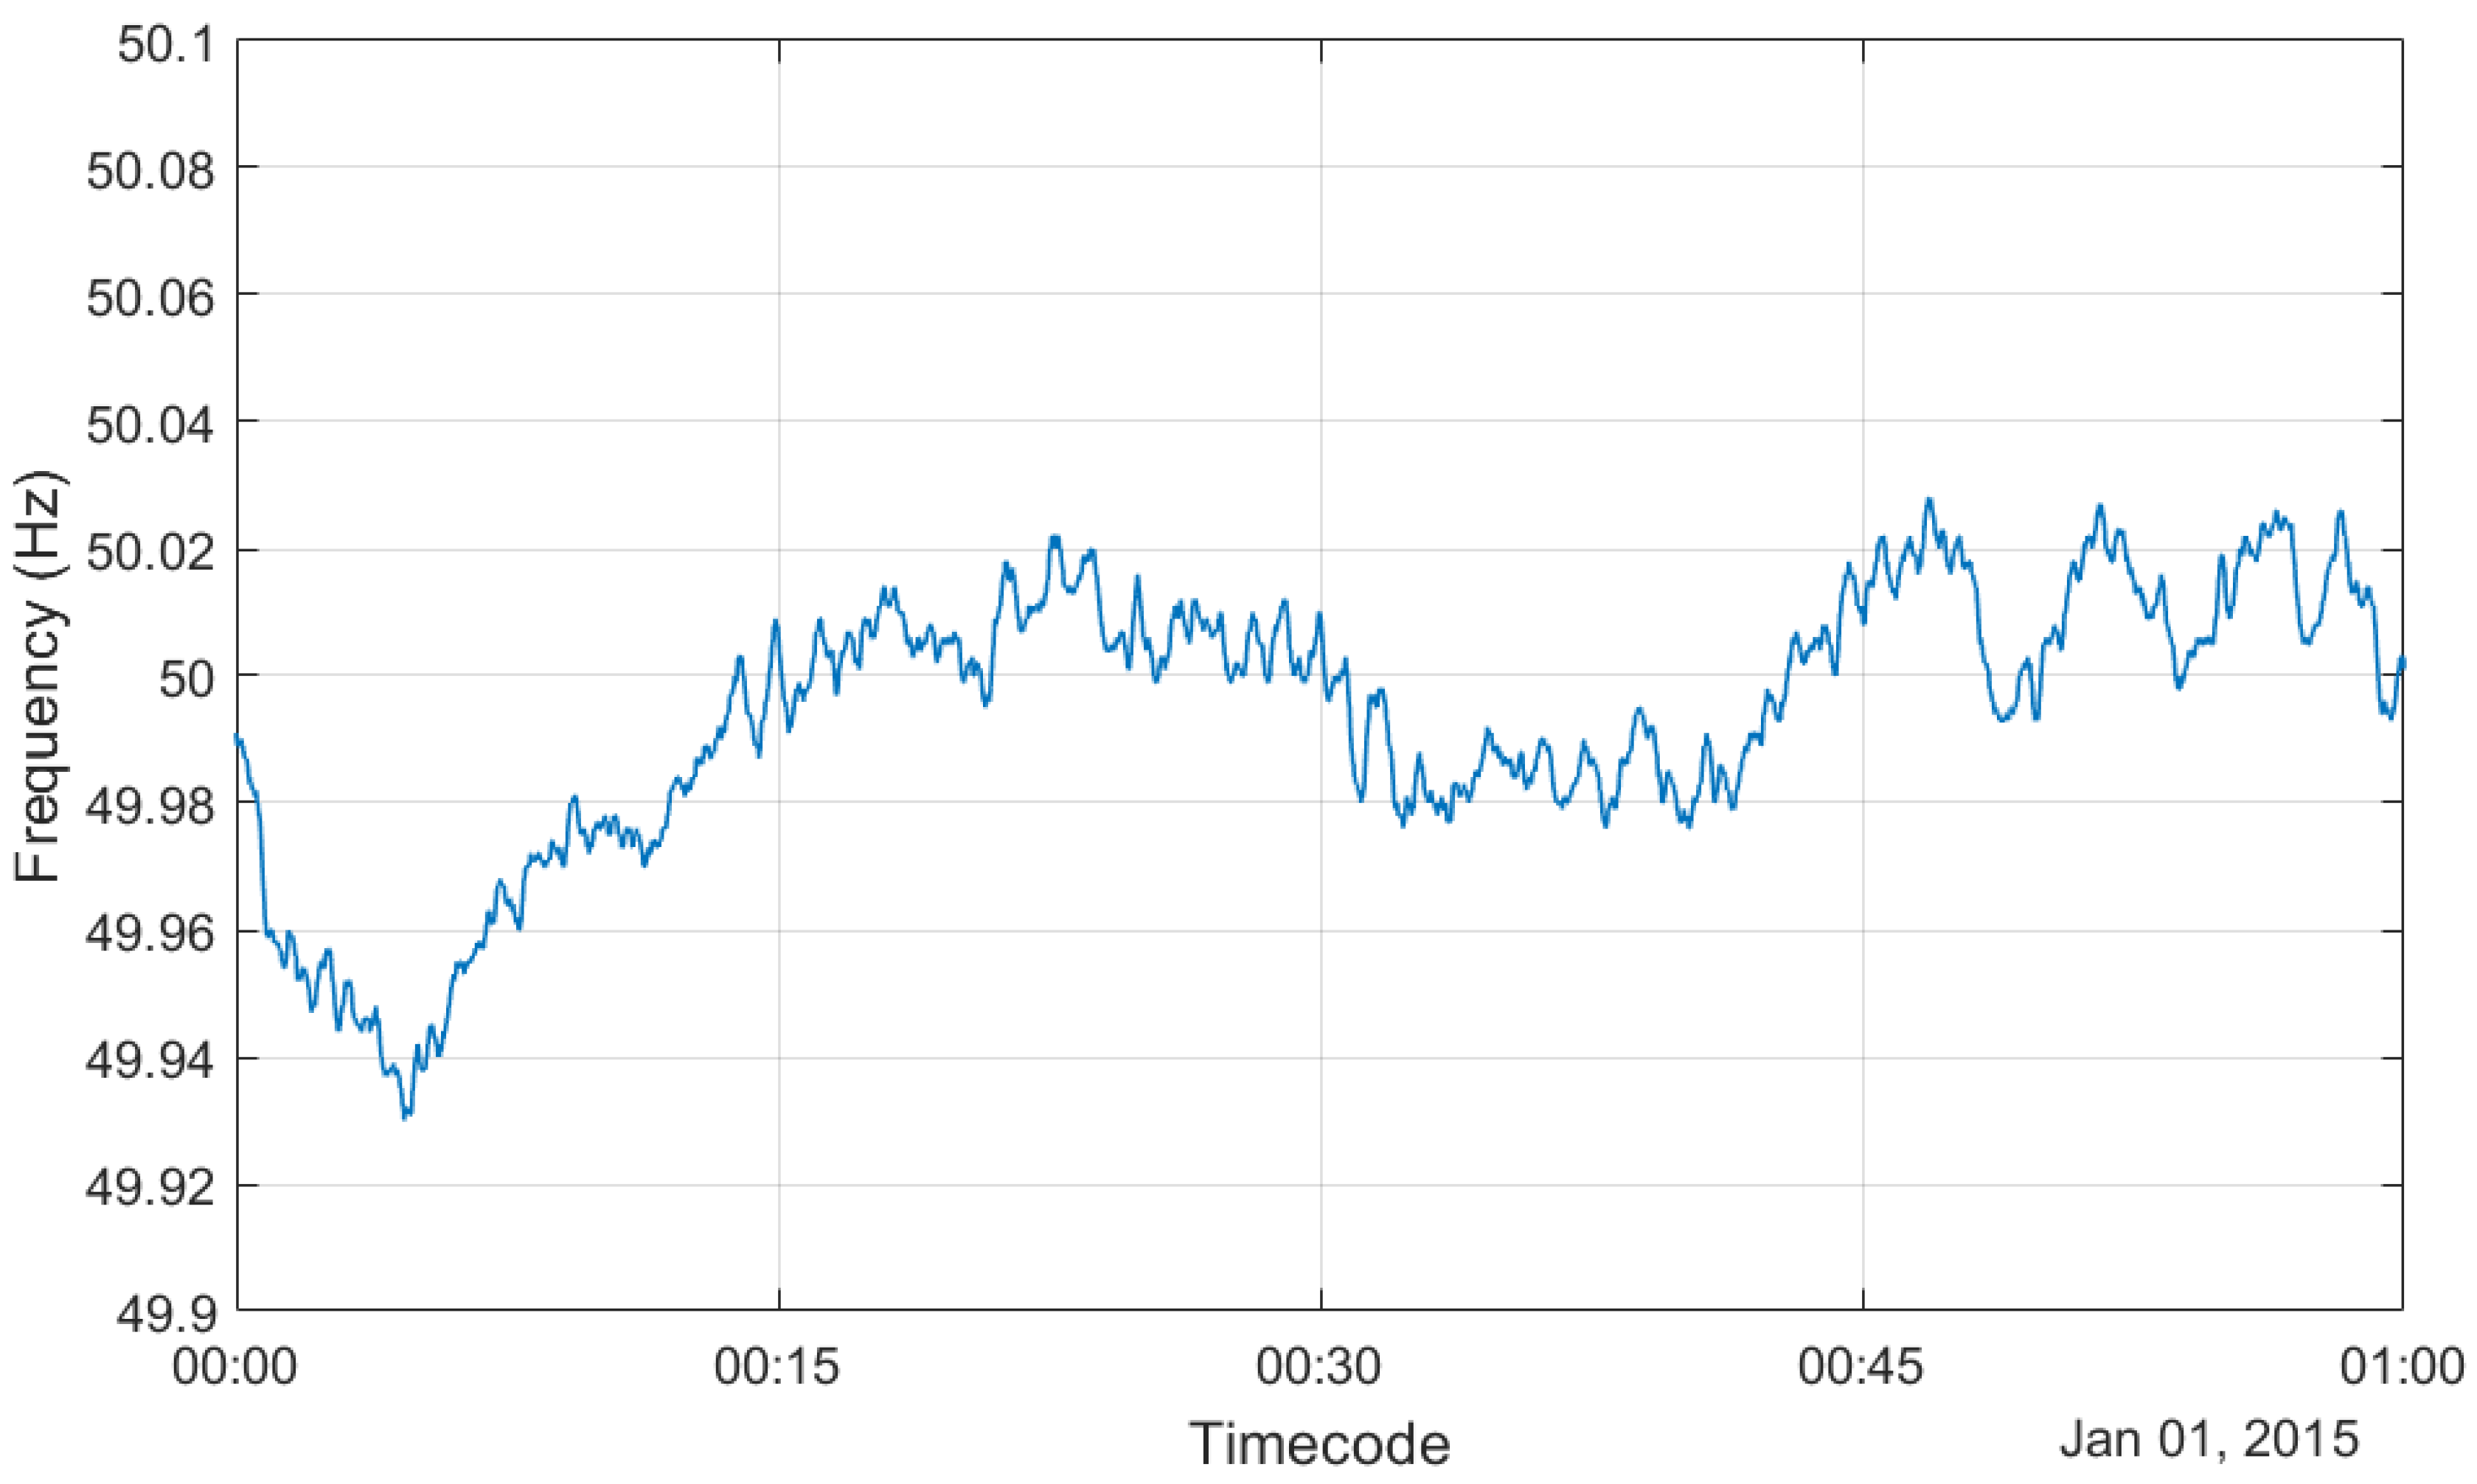
One great breakthrough in both audio authentication and integrity checking was represented by the ENF criterion [4]. This method is based on one key property of the electrical power distribution network: the frequency of the electrical network signal varies randomly in time and is the same over a large area. The variations around the nominal frequency are very small, but detectable. When audio recordings are made in buildings connected to the power grid, the recording devices pick up the electrical network signal. The picked-up signal is very small since the devices are designed to prevent its capture because it contaminates the recording. To check the integrity of a recording, the picked-up electrical network signal is extracted from it, then its frequency variation in time is estimated. Finally, the extracted variation of the ENF is compared with a reference variation that is obtained by monitoring the electrical network signal directly using monitoring stations [5]. Because the variation of the ENF is the same over large areas, only a small number of stations that monitor the electrical network and can deliver the reference ENF variation are needed to cover large territories. The reference ENF variation can be obtained also from the power distribution and monitoring companies. To illustrate the properties presented above, the variation of the ENF for one hour is shown in Figure 1. It was measured by [6] on the 1st of January 2015, between 12:00 a.m. (00:00) and 01:00 a.m. (01:00), with one second resolution.
The ENF criterion can be classified both as an authentication and integrity check method. Because the ENF varies randomly in time, the variation acts like a timestamp. Having available the reference variation of the ENF over a long period of time, the moment when a recording was made can be determined by extracting the ENF variation from it and computing the correlation with the reference ENF variation [7]. The peak value will be found at the most likely recording moment. This favors the method’s classification in the authenticity checking category. Discrepancies between the variation of the ENF extracted from the analyzed recording and the reference indicate that the recording has been tampered with. Cut, copy-paste, move, and other similar operations can be detected in this way, showing that the method can be used for integrity checking of audio recordings. It is shown in [6], on the information page that the mains frequency is the same in all the countries that are connected to the synchronous grid, except short time fluctuations. Of course, the best results are obtained if the ENF is measured locally, using commercial meters, for example the ones available from [6]. The ENF criterion has a blend of characteristics of active and passive methods. It can be considered active because it uses reference data, but also passive because the reference data is not embedded into recordings using a certain developed method, but naturally, as a result of coupling between the power distribution network and the audio recording devices.
The power line frequency (or mains frequency, ENF) has a nominal value of 50 or 60 Hz, depending on the country. Most of the world adopted the 50 Hz system. Both values are in the audible range. Depending on the performance of the audio recording devices, the power line signal can be picked up by them, manifesting as a noise called mains hum. The ENF criterion became one of the industry-standard multimedia forensics tools. A fully automated audio verification process based on it is used in the United Kingdom [8] and Singapore [9]. As the technology advanced, the recording devices got better at rejecting this noise, making the ENF criterion less effective.
A short review of the proposed solutions follows. In [10] the characteristics of various transforms, like DFT (Discrete Fourier Transform), DCT (Discrete Cosine Transform), and DWT (Discrete Wavelet Transform) are discussed in the context of audio watermarking. In [11], the authors present a singular value decomposition (SVD) DWT-based watermarking algorithm that uses the statistical properties of the DWT coefficients to determine the quantization steps for the signals to be watermarked. In general, the transform-based algorithms are more resistant to various attacks, but they are more computationally complex. Time-based watermark algorithms also exist, like [12,13,14]. These algorithms are characterized by less required computation power, while also being less robust. Audio watermarking is still a topic in which new advances arise [15,16,17].
The new sonic watermarking system proposed in this paper is different from most other algorithms because it allows the use of the ENF criterion principles to analyse recordings made with new audio recording devices. Besides this introduction, the paper is structured as follows: Section 2 describes the fundamental requirements for an audio watermark suitable for integrity checking and authentication of audio recordings, Section 3 thoroughly describes the proposed method starting with presenting the scenario, all the involved signals, the watermark generator, the watermark extraction and processing methods to determine the integrity of a recording, Section 4 presents and discusses the results, and Section 5 concludes the paper.
2. Principles for Developing a Suitable Watermark
The underlying principles of a suitable watermark for authenticating and checking the integrity of audio recordings are [18]:
- The watermark should be embedded at the time of recording—embedding the watermark in a recording at a later moment can be considered a malicious operation and contested. This principle imposes computational complexity limits on the embedding method because it should work in real time;
- The watermark should be captured by all the recording devices that are near to one another—all the participants in a discussion can carry their own recording device and, if the watermark is embedded only in some of the recordings, a dispute about what recording is authentic can start;
- The embedding of the watermark should not be noticeable—if people know that a watermarking process is running, they could be reserved in their declarations and the flow of the conversation could be affected by it. Thus, it should be kept secret and the embedding operations should not rise suspicion;
- The watermark should be secure—only authorized persons should be able to extract the watermark.
All the principles presented here are found in the case of the ENF criterion scenario. The security principle is found because, considering the fact that the picked-up power line signal is very small, intense signal processing knowledge is needed to reliably extract the ENF from an audio recording. In the process of developing an audio watermarking method compatible with new recording devices, the first two principles are met if sonic watermarking is used. Let us stress that the third principle does not necessary imposes that the watermark should be inaudible. It only needs to avoid raising the suspicion of the participants. The embedding methods should be chosen to satisfy the fourth principle. In [19], the authors propose a sonic watermarking scheme compliant with the four principles defined above, in which ticking sounds are used to mask one low frequency chirp signal. The watermark is embedded as the temporal distance between ticking sounds. Some disadvantages of the proposed system are the small value of the time-bandwidth product of the chosen chirp signal, thus affecting the detection process, the requirement to use speakers with large dimensions to play the low frequency chirp signal in the room making the system hard to conceal, and the placement of the chirp signal outside the audio bandwidth (starting from 10 Hz), thus risking its filtering by the recording device. The effects of the sound propagation are not considered, and a security issue is present in the form of using a periodic time delay sequence between the ticking sounds (therefore a cut operation equal to the length of the sequence cannot be detected and, similarly, a well-placed copy-paste operation can pass undetected). The system was improved in [20], where the advantages of using a high frequency chirp signal instead of the low frequency one are highlighted, the effects of the sound propagation are investigated, resulting that the high frequency chirp version gives much better results than the original, allows the reduction of the physical dimensions of the system (because smaller speakers are required to play high frequency sounds), thus improving the concealment, and also solving the aforementioned security problem by setting the time delays between ticking sounds using a pseudorandom sequence. The system presented in this paper is further improved based on the advantages brought by embedding the ENF.
3. Materials and Methods
A sound that could exist in almost any room and would not draw attention to it is the ticking of a clock. It satisfies the first three principles but cannot be considered a watermark because it carries no information. In the proposed system, it acts as a masker for a variable number of chirp signals that encode the ENF information. This combination of signals satisfies all the four principles. The blend of sounds propagates through the room where it is mixed with the speech signal and then the result is captured by the recording devices, according to the sonic watermarking definition. A scene in which the system is used is presented in Figure 2.
In this section, the proposed system is described, starting with the signals that are involved and continuing with the operations that are made to generate the watermark. Then, the method for extracting it is presented, continuing with describing the methods for checking the integrity of the watermarked audio recordings. Finally, the effects of the sonic watermark’s propagation through rooms are analyzed.
3.1. Signals Involved in the System
Three categories of signals are involved in the system: the speech signals, the ticking sound that imitates the ticking of a real clock and the chirp signals. The ticking sound acts as a masker for the chirp signals. The second and third categories of signals participate in the synthesis of the sonic watermark. The mixture of the signals from the three categories is captured by the recording devices.
3.1.1. The Speech Signal
The speech signal has most of its energy concentrated at frequencies lower than 8 kHz, as it results from [21] where a study about the bandwidth of the speech signal was conducted, for multiple languages, based on the long-term average spectra. High quality speech applications consider the bandwidth of speech to be 7 kHz according to the ITU-T recommendation shown in [22]. The insertion of the watermark in the recordings is made by making the speech and the watermark to coexist in the room. Because the watermark should be easily extracted from the recording at a later moment, it should not overlap the bandwidth of the speech signal. In this way, the SNR (Signal to Noise Ratio) is improved, and the extraction of the watermark is facilitated (i.e., in this situation, when computing the SNR, it was considered that the watermark plays the role of the signal and the speech signal is the noise). The situation was similar in the classical ENF criterion situation where the power grid signal that was picked-up had very low frequencies, below the inferior limit of the speech bandwidth, thus the bandwidth overlap was naturally avoided.
3.1.2. The Ticking Sound
It represents the first component of the sonic watermark. The main role of the ticking sound is to be an unsuspected, naturally encountered masker for the second component of the watermark (i.e., the chirp signals) described in the next subsubsection. These kinds of signals have the properties of impulses, which are characterized by large bandwidth (in this case, up to 16 kHz), as can be observed in Figure 3. This property plays an essential role in the masking process, detailed in Section 3.2.2, point 5. The temporal distance between consecutive tick sounds can be exploited for watermarking. It can be made to deviate from a second, but not too much, or this could draw the attention of the people who hear it. The control of these slight deviations represents a new degree of freedom in the design because it can be used to embed additional watermark data. The temporal distance between the ticking sounds carries the room identifier information.
3.1.3. The Chirp Signals
They represent the second and the most important component of the sonic watermark because they are used to embed the ENF information. Chirp signals have the frequency variable in time. The frequency variation could follow linear or nonlinear laws. Linear chirp (i.e., chirp signals with linear variable frequency) are used in the system proposed in this paper and are very well detailed in [23]. These signals are used in many applications such as radar, echolocation, and remote sensing of cosmic ray induced air showers because they can be detected in harsh SNR conditions. The mathematical expression of a chirp signal centered around the time origin (i.e., can be written as:
where is a parameter that controls the frequency sweep rate, measured in Hz per second and has positive values for down-chirp signals (the start frequency of the chirp is larger than the final one) or negative values for up-chirp signals. The other parameters are defined as , representing the duration of the chirp (expressed in seconds), where and are the upper and, respectively, lower limits for frequency, , and is the rectangular function defined as:
To exemplify, the waveform of an up-chirp signal with the frequency sweep rate equal to Hz/s, Hz, Hz and its instantaneous frequency variation are depicted in Figure 4. Let us stress that a negative frequency sweep rate is necessary in (1) to obtain an up-chirp signal, while a positive value would lead to generating a down-chirp signal.
3.2. Method for Generating the Sonic Watermark
To ease the understanding of this subsection, the main objective of the proposed sonic watermarking system is reminded: embedding the ENF variation in all the recordings made in the room where the proposed sonic watermarking system is placed, even when newer recording devices that reject the mains hum are used. In this way, the proposed system allows the usage of the acclaimed ENF criterion principles also in these conditions. The block diagram of the proposed sonic watermark generator is illustrated in Figure 5. The data that is embedded in the recordings (i.e., the sonic watermark consisting of the ENF variation and a room identification number) come from external measurement devices (the ENF) or set when the system is installed (the room ID). Those data input blocks are illustrated with yellow in Figure 5. The watermark is transmitted acoustically using two categories of sounds: chirp signals (as main data carriers) and ticking sounds (to mask the chirp signals). The blocks that generate the audio signals in Figure 5 are colored in blue. Two signal processing blocks are required in the watermark generator: one for increasing the SNR of the chirp signals with respect to the ticking sounds to improve the watermark extraction performance and another used to embed the room ID by slightly delaying the audio mixture. The delays should be imperceptible by the human auditory system (HAS). In Figure 5, the signal processing blocks are shown in gray. Each block is described in further detail.
3.2.1. The Data Input Blocks
- The ENF measurement system—Provides the primary data for the sonic watermark. The proposed system receives the value of the ENF averaged over one second, every second. The measurement should be made with great resolution, at least Hz. Systems that offer Hz exist [6]. In the design process of the proposed system, the resources were allocated according to these finer measurements. This approach allows the system to work also with ENF measurement devices that offer coarser measurements ( Hz resolution). According to the power grid specifications in [24], the variation of the ENF is in the range of 50 ± 0.2 Hz. If the measurement of the ENF is made with a resolution equal to Hz, 401 values are obtained (from 49.8 Hz to 50.2 Hz with a 0.001 Hz step size) which can be binary encoded using 9 bits. The ENF measurement is not the main subject of this paper and this is the reason those systems are not thoroughly detailed here. They are well documented in [25]. For this work, the ENF values measured at each second for the year 2015 were analyzed, because they were made available by [6]. Their histogram was computed and illustrated in Figure 6. It can be observed that the data follows a normal distribution with the estimated mean equal to 50 Hz, and the standard deviation equal to Hz.
- The room identification number (room ID)—represents the secondary information carried by the sonic watermark. The room ID is an integer number set once when a sonic watermark system is installed in a room. It can be used later to precisely determine the room in which the conversation that is investigated took place. Because no two rooms should have the same identifier, this number should be assigned automatically by an external room management system (e.g., a server that holds a database of the rooms in which sonic watermarking systems are installed). The room ID is used as the seed of a pseudorandom binary sequence (PRBS) generator. The generator delivers one bit per second.
3.2.2. The Audio Signal Generator Blocks
- The ticking sounds player delivers sounds that imitate the ticking of a mechanical clock at time intervals equal to one second. Those sounds are recorded from a real mechanical clock and then played in an infinite loop. Care must be taken when preparing the loop because it should have a duration equal to an integer number of seconds. In this way they will sound natural and will not draw the attention of the people around them, even if listened for long periods. The longer the recording is, the more natural it will sound, and the less likely is to be suspicious for a listener when played on repeat. The ticking sounds are used to mask the chirp signals that carry the ENF information.
- The chirp signals generator—Synthesizes the chirp signals that encode through their presence or absence the value of the ENF received from the ENF measurement system. It is the block with the greatest importance in the design and is thoroughly described onwards. This block is designed to maximize the probability of detecting the chirp signals in the process of checking the integrity of the audio file that has the proposed sonic watermark embedded in it. The following principles were followed when the parameters of the chirp signals were designed:
- The chirp signals should not be removed by the audio recording devices. Therefore, they should be placed inside the audio bandwidth, between 20 Hz and 20 kHz. The farther away from these limits they are placed, the higher the chance that they will not be removed.
- The chirp signals should be able to be played using small speakers, because the overall dimensions of the sonic watermark generator should not exceed the dimensions of a table clock, given the scenario explained at the beginning of Section 3. Therefore, the chirp signals should be placed at high frequencies so speakers of small dimensions can play them.
- The chirp signals should not share bandwidth with other signals. It was shown in [23] that noise can determine false detections when matched filters are used as chirp signal detectors. The filter matched to a certain signal is given by the time reflected and delayed version of that signal. According to [21,22], the high limit of the speech signals’ bandwidth is 8 kHz. Therefore, the chirp signals should be placed at frequencies over 8 kHz so they will not overlap the bandwidth of the speech signals, minimizing the occurrence of false detections determined by the speech signals.
- The duration of the chirp signals should be similar to the duration of the ticking sounds so simultaneous auditory masking principles can be used. Therefore, a duration of 45 ms was used.
- The presence of the chirp signals should not be perceived by the human auditory system (HAS). Therefore, auditory masking principles should be used to minimize the probability of their detection by persons. The masker of the chirp signals is the ticking sound that is naturally quiet. In these conditions the non-simultaneous auditory masking (i.e., forward masking) cannot be used because the masking threshold decreases very fast after the masker signal disappears and it is lower than the level of the masker [26]. Simultaneous masking remains to be used. The simultaneous masking exploits the organization of the HAS as an array of overlapping band-pass filters (i.e., auditory filters). The bandwidth of each filter is called critical band [27] and it increases as the central frequency increases. The masking effect is stronger if the masker occupies most of the critical band, and the masked signal only a small portion of it. This is likely to happen in the case of the proposed sonic watermark because the ticking sound (i.e., the masker) has a wide bandwidth, as shown in Section 3.1.2. This is an argument for having narrow bandwidth chirp signals, placed at high frequencies where the critical bands are larger. To improve the auditory masking performance even more, only one chirp signal should be placed in each critical band. Auditory filters can be characterized using the equivalent rectangular bandwidth (ERB). In this convenient approach, the filters are treated as rectangular band-pass filters [28,29,30]. The ERB can be computed, for young listeners and moderate sound levels, according to [31], with the following formula:where is the central frequency of the filter in kHz. The results in [31] are given for frequencies between 124 Hz and 6.5 kHz and show an increase of the ERB with the frequency. Later results shown in [32] propose another mathematical relation for estimating the ERB:
The values for ERB obtained using (4) are smaller than the ones estimated by (3). Therefore, for the proposed sonic watermark, the bandwidth of the chirp signals is chosen to be 240 Hz and they are distributed one in each critical band using (3), minimizing the chances that two or more chirp signals will be placed in the same critical band. Based on (3), if the first chirp signal occupies the frequency interval from 8 kHz to 8.24 kHz, the 9th chirp will still be in the audio bandwidth, up to 17.2 kHz. Neither (3) or (4) give accurate results for frequencies over 10 kHz, so the worst-case estimation was considered, using (3) (i.e., the chirp signals may be spread more than the minimum necessary, thus improving the masking performance).
The frequency ranges of the nine chirp signals that are used in the proposed system, designed according to the above-mentioned five principles, are summarized in Table 1. All nine signals have the same bandwidth, equal to 240 Hz, and the same duration, equal to 45 ms.
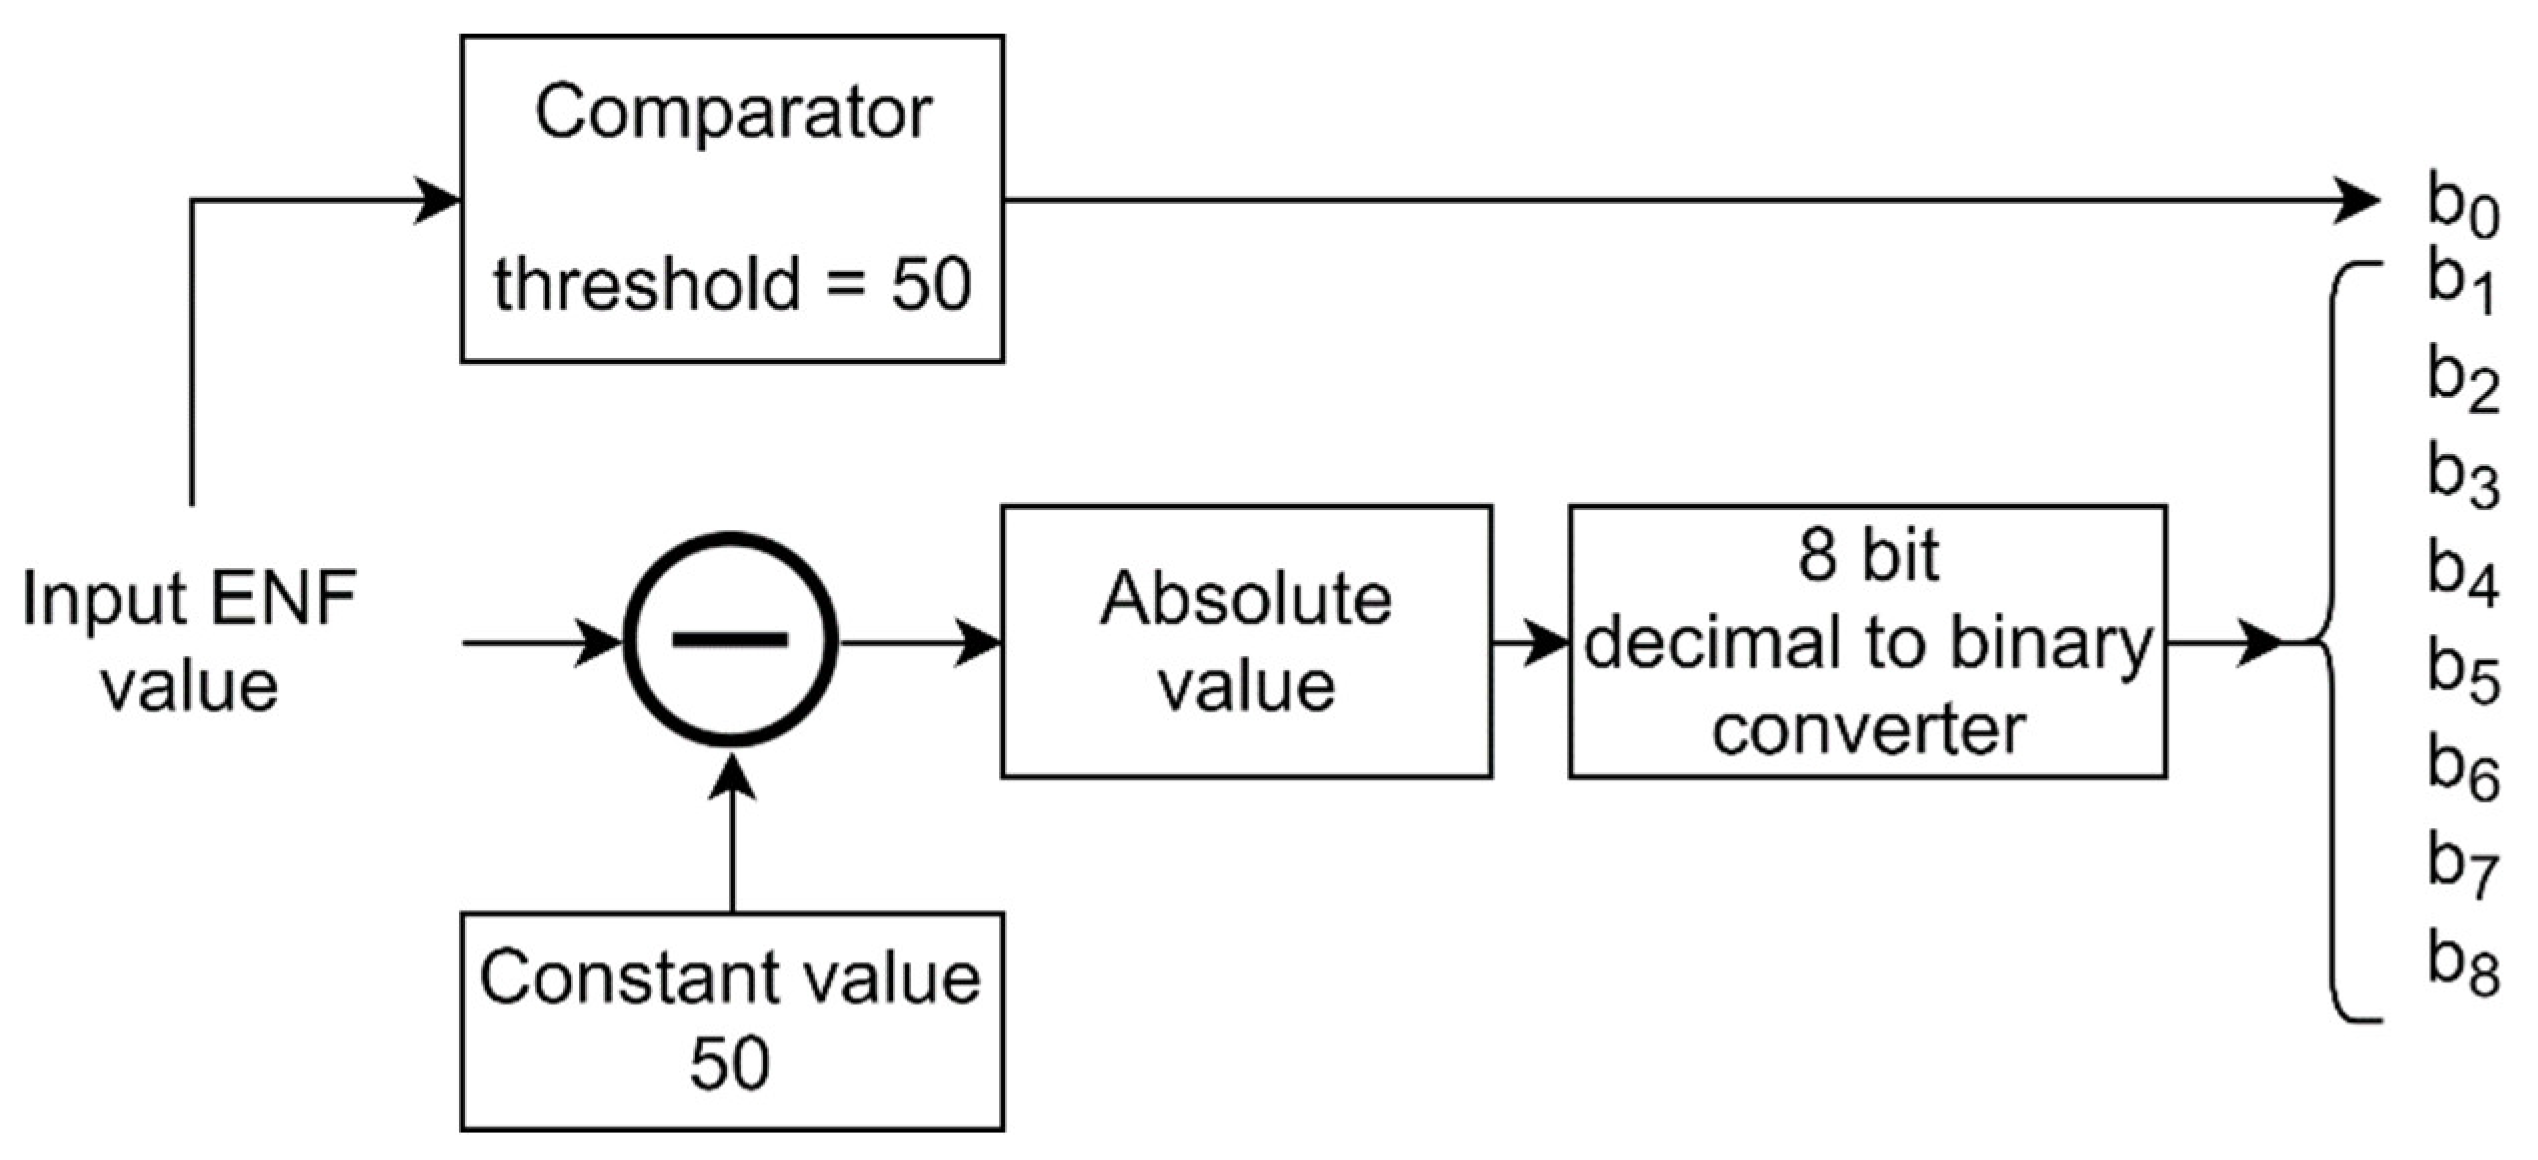
The ENF measurement system considered in this design, presented in Section 3.2.1, delivers the ENF value with a resolution equal to Hz. The received value is processed according to the flow diagram illustrated in Figure 7 to obtain the nine bits (from to that are used further to control the presence or absence of the nine chirp signals that are mixed with the ticking sound.
If is a row vector containing the values of the nine bits, and is a matrix containing on each row the samples of each chirp signal with , the output signal of this block, denoted with , is a mixture of chirp signals that can be obtained using the following relations:
where is the sampling frequency, is the transposition operator, and is a Hamming window with the length equal to This method of encoding the ENF is based on the information illustrated in Figure 6 where it can be observed that the most probable values for the ENF are around 50 Hz. Furthermore, by studying the properties of the ticking sounds shown in Figure 3 and the frequency range of the chirp signals in Table 1, it can be concluded that could fall outside the bandwidth of the ticking sound, making the auditory masking less efficient. Therefore, the probability of occurrence of the chirp signals should decrease from to A signed and magnitude representation (SMR) helps in this case, being equal to “1” if the ENF value is greater than or equal to 50 Hz, and “0” otherwise, while to are used to binary encode the absolute deviation of the ENF value from 50 Hz. The least significant bit (LSB) is It should be noted that the value of the standard deviation in Figure 6 is Hz, so in 99.7% of the cases the deviation from the nominal value of the ENF (i.e., 50 Hz) can be encoded using only six bits because Hz. In conclusion, and (i.e., the chirp signals that could suffer from inefficient auditory masking) will be used very rarely.
3.2.3. The Signal Processing Blocks
- The SNR improvement block—Consists of a filter bank with nine bandstop filters used to increase the chirp-to-tick sound SNR. It was detailed in [23] that noise in the same bandwidth with the chirp signals can determine false chirp detections if a matched filter and threshold comparator is used as the detector. To minimize the probability of false chirp detections, the ticking sounds are filtered using 9 bandstop filters to remove their spectral content existent at frequencies occupied by the chirp signals. Because the stop bands of those filters are very narrow compared to the corresponding critical bands, the filtering effect is inaudible. The magnitude response of this signal processing block is illustrated in Figure 8.
- The controlled delay line—Is used to encode auxiliary information by deviating the temporal distance between the ticking sounds by a small amount. The auxiliary information that is encoded is the room identification number. The input data of this block are the bits of the PRBS generator with its seed equal to the room ID. The bits of the binary sequence switch on or off the controlled delay line (“1” → delay line active, “0” → delay line bypassed). When active, the block delays the input signal with ms. The signal at the input of this block is a mixture made of the filtered ticking sound and the chirp signals corresponding to the current ENF value. Changing the state of the delay line should be done between ticks, to avoid the occurrence of audible artifacts. An example of the delay line functioning is shown in Figure 9 along with the bits of the PRBS generator that are used to control it.
3.3. Method for Extracting the Watermark
3.3.1. Extracting the Chirp Signals and the Enf Information
If stationary white Gaussian noise is considered to be the perturbator signal, the optimal detector for a chirp signal is a matched filter succeeded by a threshold comparator, as demonstrated in [33]. The detection of chirp signals is also thoroughly studied in [23]. The detection of the chirp signal illustrated in Figure 4a in harsh SNR conditions ( dB) using a matched filter is demonstrated in Figure 10.
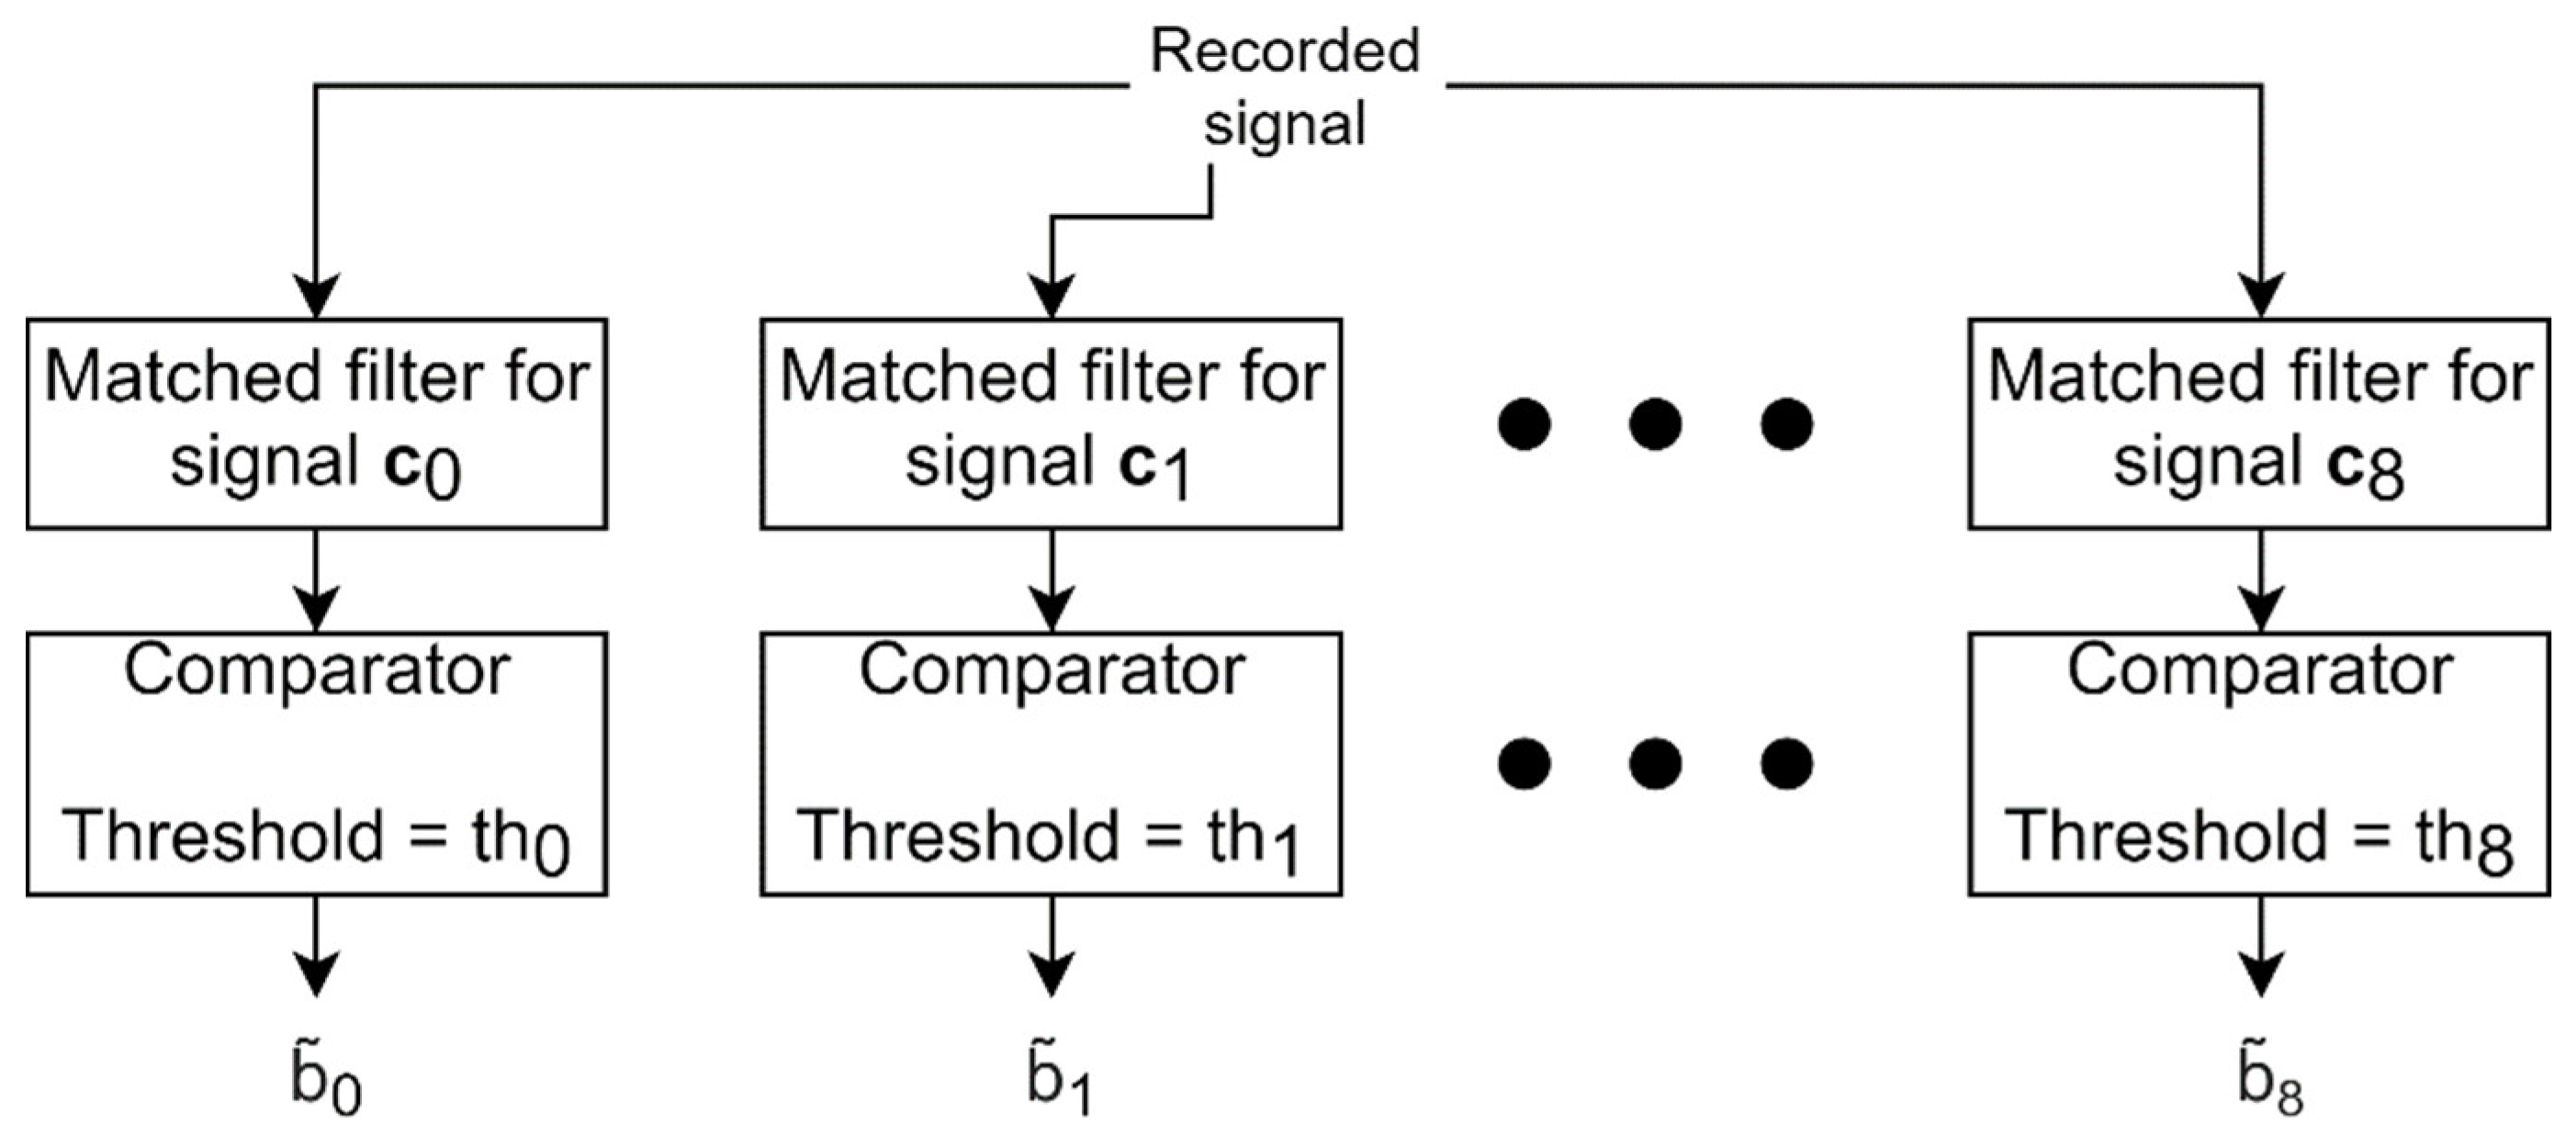
Mathematically, considering a signal denoted with , the filter matched to this signal, denoted with can be written as , where is the duration of the signal. In the example shown in Figure 10, the duration of the chirp signal is one second, it is located from second 1 to second 2 in Figure 10a but cannot be observed directly because it is drowned in noise. The impulse response of the matched filter can be observed in Figure 10b, and the response of this filter to the signal illustrated in Figure 10a is shown in Figure 10c. Even in this harsh SNR condition, the matched filter can sense the presence of the signal that it is matched to [34]. It can be observed in Figure 10c that a large value is obtained after exactly 2 s, indicating that the chirp signal corresponding to the matched filter was detected, and it is located from second 1 to second 2 in the input signal. The detector of the chirp signals was designed based on this principle. Its block diagram is shown in Figure 11.
The values are the estimates of the bits
encoding the ENF value, and are the comparators’ threshold values.
The recorded signal is filtered using the nine matched filters corresponding to the nine chirp signals. The output signal of a matched filter will be large if the corresponding chirp signal was present in the input signal, as demonstrated in Figure 10. Its presence can be detected using a comparator. If the signal is larger than the threshold, the output of the comparator is “1”, and “0” otherwise. Two ways in which can be set are:
- The system can be remote controlled to emit all the chirp signals with the next ticking sound, bypassing the measured ENF value for that second, and encoding a value equal to 50.255 Hz which has a very low probability of occurrence in a real power grid. This will determine maximum values at the output of the matched filters in the receiver. The threshold can be set slightly lower than the maximum value. It was determined through experiments that threshold values 5 dB lower than each maximum can be used.
- The detector can exploit the property that maxima in the output signal of the matched filters can occur at most once per second. The global maximum value of each signal can be found, and the threshold set 5 dB lower than it. After this, the temporal distances between the peaks that were greater than the set threshold can be evaluated. If those are smaller than 1 s it results in that the respective chirp signal was never sent, and what is sensed is the effect of noise and speech signals, because the threshold is set too low. In this case, all the bits corresponding to that chirp signal should be set to “0”.
Finally, the estimated ENF value can be found using:
3.3.2. Extracting the Pseudorandom Binary Sequence
The method used for generating the chirp signals guarantees that at least one will be present in the sonic watermark at any second, no matter the value of the ENF. This means that a peak value will be obtained at the output of at least one matched filter every second. The room identification number information is contained in the temporal distance between the peaks corresponding to consecutive seconds. Extracting the bits of the PRBS is done according to the flowchart illustrated in Figure 12.
This part of the detector monitors the temporal distance
between any consecutive peaks, denoted with . Therefore, can have only three values, ideally: s, s or s. In the practical implementation, the classification tolerance was set to ms. In the event when the distance between peaks cannot be classified in any of the three presented situations, the respective part of the signal is marked for investigation because it is a clue of malicious intervention. Then the procedure is restarted for the rest of the signal, and the results are saved in a new sequence.
3.4. Methods for Checking the Integrity of the Watermarked Audio Recordings
The methods for investigating the recording are based on the principles of the ENF criterion. Data extracted from the recording is compared with the reference, provided by a monitoring station as in [6]. The comparison is usually made using the cross-correlation function [7], computed using:
where is the correlation operator, is the vector containing the estimated ENF values, is its length, is the vector containing the reference ENF values, and represent the samples of the respective vectors. Therefore, is the vector that contains the samples of the cross-correlation function. The nominal value of the ENF (i.e., in this case 50 Hz) would dominate this result. To avoid this, it is subtracted from both sequences. The temporal index where the cross-correlation has the peak value is expected to indicate the moment when the recording was captured. In this case, the temporal resolution of the ENF data is one second, leading to poor localization results using cross-correlation, as can be observed in Figure 13. Three localization results are shown, for durations of the recorded signal equal to s (20 min), and It is clear that the latter two values are unlikely to be found in real-world situations. They are used here only to demonstrate that in the case of the proposed system, the cross-correlation can locate the moment of the recording only when its length is in the range of hundreds of minutes. In this demonstration, the recorded signal had a cut equal to 2 s in it (i.e., two consecutive values of ENF were lost), and perfect ENF recovery was considered for the other values. Thus, using the cross-correlation to find the moment of the recording is disadvantageous because of the temporal resolution of the ENF (i.e., 1 s). However, the great advantage of the proposed system is that it uses ENF values that are discrete, with the representation resolution equal to Hz. If their transmission and extraction are done without errors, the extracted values and the corresponding reference values will be equal. Because of this, much better results are obtained if the recording moment is searched using the root-square-error (RSE), computed as:
The resulted values are stored in a vector denoted with The start of the recording is given by the temporal index where the RSE is minimum. It can be observed in Figure 13 that it precisely locates the recording’s starting moment, even when its duration is in the range of tens of minutes. In the same situation, the cross-correlation fails to locate the recording moment. The minimum value of the RSE is not equal to zero in this example case because of the aforementioned two-seconds cut in the recorded signal, determining the missing of two ENF values. The reference ENF sequence for this demonstration contained the variation over one year.
3.4.1. Identifying a Cut Region Larger Than One Second
In this scenario it is considered that at least seconds of unmodified recording exist before and after the cut. Larger values of lead to greater confidence levels of the results. Both the extracted ENF variation and the auxiliary PRBS participate in this investigation. Firstly, the recording moment is found by determining the index for which is minimum. After this, vectors are computed using:
where is an integer parameter that defines the limits of a search window around the moment From the vectors it is selected the one in which the first at least values are equal to zero, denoted with Then, the actual consecutive trailing zeros from that vector are counted and the result represents the candidate for the starting moment of the cut, found using the ENF information and denoted with Next, the duration of the cut can be determined by finding in the N vectors the one has the last at least values equal to zero, denoted with The duration of the cut is found as the difference between and The same approach is followed using the extracted and reference PRBS, resulting the cut starting moment candidate denoted with The identified cut moment is found as To ease the understanding of this process, an example is shown in Figure 14.
In the example shown in Figure 14, the detection of the placement and duration of a cut operation is demonstrated. It is considered that the original, unmodified recording has a duration of 20 minutes, for ease of understanding the process. The top panel in Figure 14, (a), shows the variation of the ENF recorded by a monitoring station as in [6] over an interval of 20 min, starting at the 1097506th second of the year, meaning it is in the 12th day of the year. This signal would have been extracted from an unmodified recording made at that time. Three parts were highlighted on this signal: the part before the cut, represented in yellow, the part that was removed from the signal (i.e., the cut part), shown in green, and the part after the cut, highlighted with magenta. The cut in this example was 30 s long, to make it visible on the plots. The (b) panel from Figure 14 shows the ENF variation extracted from the tampered recording. Formula (8) is applied to the reference ENF signal (the variation over one year) and the extracted signal, to find the moment of the recording, by finding After this, vectors are computed using (9), denoted with where operation done to search the two vectors of great importance: and described above. The vector was found for therefore . The vector was found for thus . This happened because the cut is done in the first half of the signal (i.e., the part highlighted with yellow is shorter than the part highlighted in magenta), and consequently, has more zeros in it than If the cut is done in the second half of the signal, it is most likely that will be found for . Then, the cut start can be found by counting the consecutive zeros in the signal, as it also can be observed in Figure 14, panels (b) and (c). The duration of the cut is found as s.
3.4.2. Identifying a Cut Smaller Than One Second
In this scenario, the watermark property that is investigated is the temporal distance between consecutive ticking sounds, monitored as it was explained in Section 3.2.2. If a value for is smaller than 0.975 s, and the entire extracted ENF sequence matches the corresponding part of the reference, it indicates that a cut operation was made in this time interval. The value of 0.975 s is used as inferior limit because of the classification tolerance explained in Section 3.3.2. It was shown in [35] that the minimum voice activity duration can be considered 60 ms. The duration of the cut can be found using the auxiliary pseudorandom binary sequence. An approach similar to Section 3.4.1 is done. The aim is to find the value of the reference PRBS that was expected for the interval where extracted was smaller than 0.975 s. The extracted PRBS is compared with the reference PRBS using the RSE. After finding , vectors are computed using a customized version of (9) by replacing the ENF with the values of the PRBS. From the N vectors, the one with the most consecutive trailing zeros is selected, denoted with , for consistency with 3.4.1. The number of consecutive zeros in the selected vector is stored in Finally, the value of the cut duration can be found using two consecutive samples of the reference PRBS sequence, as shown in Table 2.
3.5. The Effects of the Propagation of the Sonic Watermark Through the Room
The propagation of the watermark and the speech signals through the room will be affected by the acoustic properties of that room [36]. Those can be modeled using a finite impulse response (FIR) filter, with its impulse response denoted with , allowing the writing of the recorded signal, denoted with , as:
where is the sonic watermark (the filtered ticking sound summed with the corresponding chirp signals), represents the speech signals, and is the convolution operator. This approach for modeling audio systems involving sound propagation is found in [37,38]. The acoustic impulse response of common meeting rooms negatively influences the propagation of the sounds at low frequencies, because of the room’s modal behavior [39] determined by the construction symmetries (i.e., cuboid shape) and materials (i.e., hard walls). At low frequencies, the reverberation time of rooms is usually larger than at high frequencies. The acoustic characterization of materials is usually done up to frequencies of 4 kHz or, more rarely, 8 kHz [40] because at higher frequencies the acoustic wave’s attenuation caused by its propagation through air becomes dominant, and the effect of reflections can be ignored. The effects presented here are arguments that suggest the placement of the chirp signals at higher frequencies.
4. Results and Discussion
The proposed method was implemented using Matlab. For the ease of experiments’ reproduction, the resources that participated in the process are presented onwards. Clock ticking sounds can be found online as free audio sound effects [41]. The effects of the sound propagation were investigated using acoustic impulse responses of two environments: a meeting room and a lecture room [42]. The reverberation time of the two acoustic environments used in the experiments were calculated using the Schroeder integration method. The found values are: RT60_meeting = 0.244 s and RT60_lecture = 0.861 s. The reverberation time (RT60) is the time it takes for the sound pressure level to decrease by 60 dB, after a sound source is abruptly switched off. The first 100 vocal signals available in the Carnegie Mellon University database [43] were used in the experiments. This section shows the results in two test scenarios:
- The watermark extraction performance depending on the power ratio (PR) between the voice signal and the sonic watermark, while keeping the power ratio between the watermark’s components constant, and on the power ratio between the watermark components, while keeping the power ratio between the voice signal and the sonic watermark constant. This experiment was made in the two studied acoustic environments: a meeting room and a lecture room;
- The performance of detecting forgeries done using audio cut operations.
4.1. Watermark Extraction Performance
The flow diagram showing the processes of the experiments done to characterize the watermark extraction performance is illustrated in Figure 15. Two types of experiments were conducted, depending on the power ratios between the signals in the recorded mixture. We remind here that there are two main components in the recorded signal: the speech signal and the sonic watermark that is composed of the clock ticking sounds and the chirp signals. A database containing the ENF value for each second over one year available from [6] was used. The experiments were run 100 times for each power ratio, for each of the 100 speech signals from [43]. For each speech signal, a random part of the ENF variation was selected, according to its duration. Then, the sonic watermark was generated as described in Section 3.2, using the imposed power ratio between the watermark’s components. After this, the sonic watermark is mixed with the speech signal at the required power ratio, then the obtained mixture is filtered using the acoustic impulse response of the environment (meeting room, lecture room). The method described in Section 3.3 is used to extract the ENF information from the recorded signal. The extracted sequence is compared with the reference one. The preferred evaluation was harsh, the result being either success (100% recovery) or failure (even in the case of 99% the recovery, for example). Even if one ENF value from the whole sequence was not extracted correctly, it is still considered a failure. Since the experiment is run 100 times for each power ratio, the number of successful runs, in which the ENF sequence was perfectly recovered, gives the probability of correct extraction.
In the first experiment, the power ratio between the speech signal and the sonic watermark was varied between 6 dB and 20 dB, while holding constant the power ratio between the components of the sonic watermark (ticking sounds to chirp signals) at 20 dB. A total of 3000 runs were done to obtain the variation (100 for each power ratio, for the two acoustic environments). The results are illustrated in Figure 16a). In the second experiment, the power ratio between the speech signal and the sonic watermark was held constant to 6 dB, while the power ratio between the components of the sonic watermark (ticking sounds to chirp signals) was varied between 20 dB and 30 dB. A total of 2200 runs were done to obtain the variation. The results are shown in Figure 16b.
From the results it can be observed that the method gives the best results when used in a meeting room. This represents a favorable result because the most important discussions are done in such environment. Another observation is that the degradation given by the PR between the speech signal and the sonic watermark is more pronounced than the one given by the PR between the components of the sonic watermark. For best results, care should be taken to set up the system in a way that the PR between the vocal signals and the sonic watermark is 7 dB or less, while the PR between the ticking sounds and the chirp signals should be not more than 24 dB.
4.2. The Performance of Detecting Cut Operations
The second experiment investigated the probability of detecting cut operations. For cuts that are longer than one second, the method presented in Section 3.4.1 is used. A prerequisite to this is to accurately determine the moment of recording. If the moment of the recording is not precisely detected, the cut operation cannot be identified, because, according to the method, the cut is searched around the detected moment.
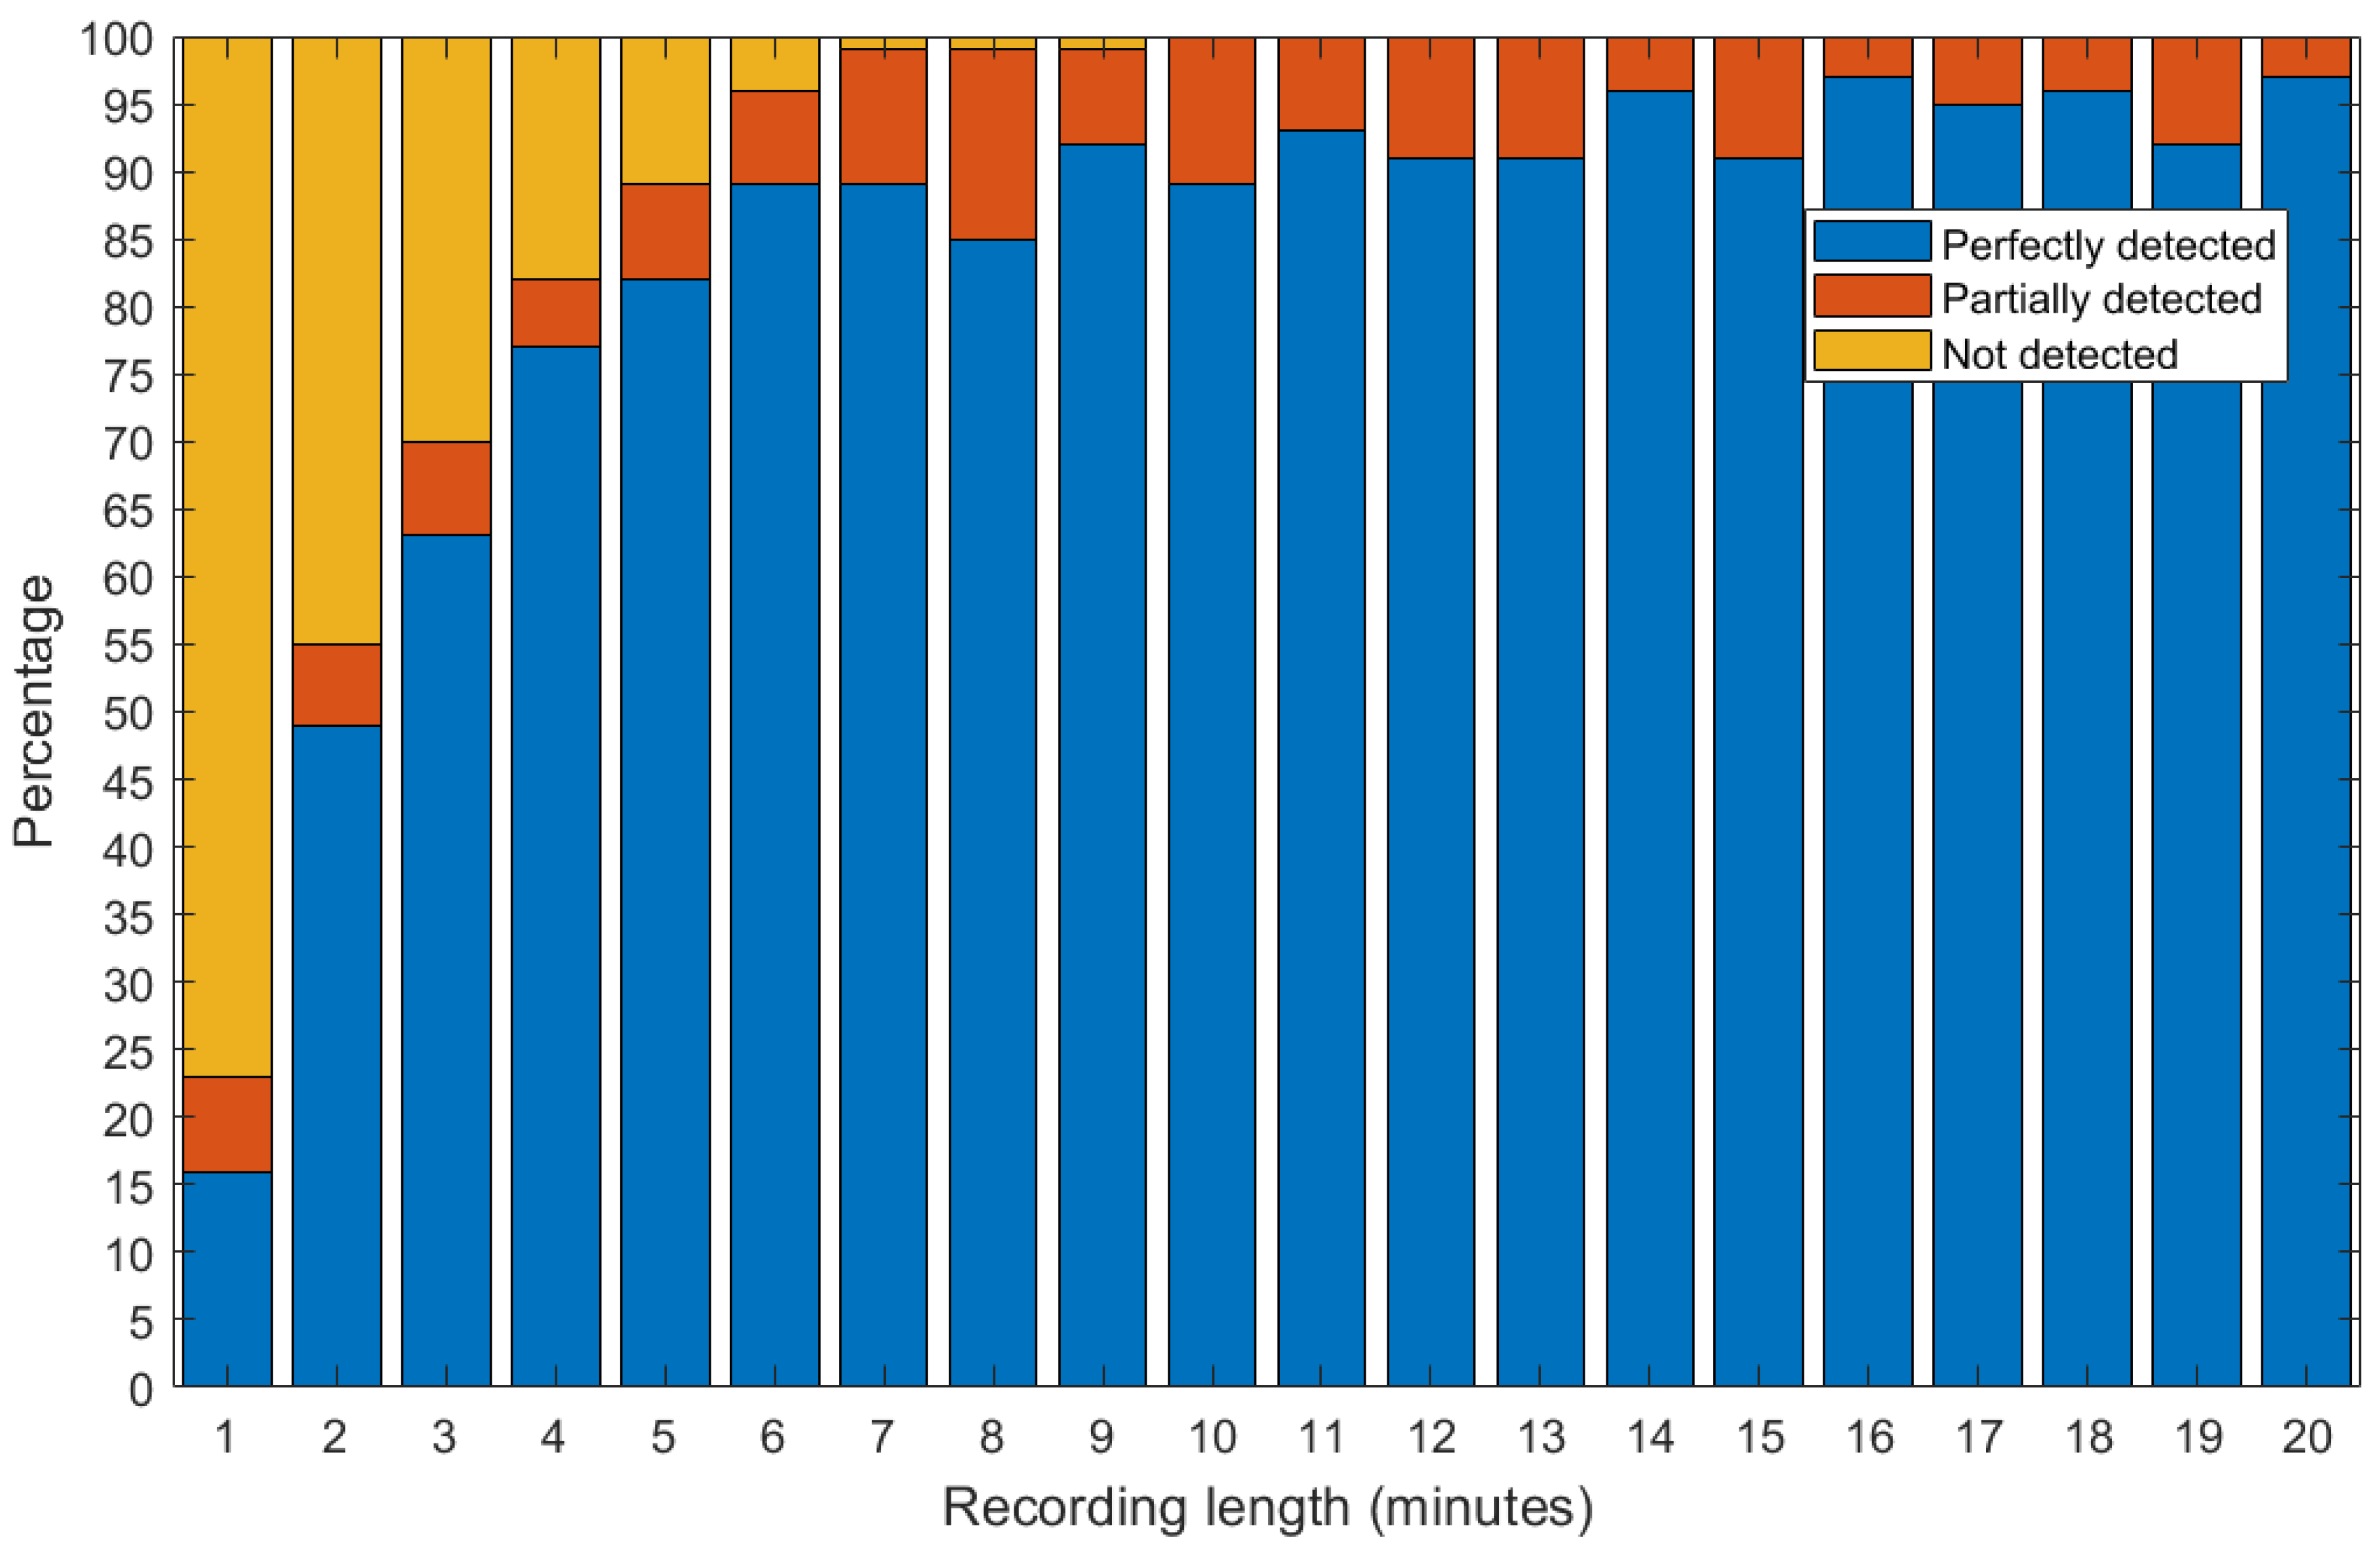
In the experiment, vocal signals [43] were concatenated, if necessary, to obtain the desired recording length. The recording length was varied between 1 and 20 min. The sonic watermark was synthesized, by using a randomly selected part of the ENF variation, equal to the necessary number of seconds, from the variation over one year [6]. The acoustic conditions were the following: meeting room environment, 6 dB vocal signal to sonic watermark PR, and 20 dB ticking sounds to chirp signals PR. Before extracting the ENF, a randomly positioned cut operation with a random duration between 2 and 20 s was executed on the signal. Based on the extracted ENF, the recording moment was determined, then the cut starting moment and duration were estimated and compared with the reference ones. Three possible results are obtained: the cut operation is not detected, is partially detected or perfectly detected. Partially detected means that the recording moment was correctly detected, but the cut start moment was not perfectly estimated. For each recording length, 100 experimental runs were done. The results are shown in Figure 17.
Partially detecting the cut operation is caused by the existence of equal consecutive values in the ENF variation. This phenomenon is easier to explain using an example. Let us consider the reference ENF variation for an 8 s long recording to be A, B, C, D, D, E, F, G, where are values of the ENF. If the cut operation is one second long, done in one of the intervals where the D value is present, the extracted ENF variation would be A, B, C, D, E, F, G, no matter if the part containing the first or the second D value was removed. Therefore, an uncertainty of the cut start moment exists, but given the random variation of the ENF, these situations are rare. The probability of occurrence of several equal consecutive ENF values in a year, if ENF values are captured every second, is shown in Figure 18.
From the results presented in Figure 17 it can be determined that the method gives good results for recording lengths of over 10 min, completely avoiding the wrong identification of the recording moment. The identification of cut operations smaller than one second is determined by the watermark extraction performance. If the watermark is extracted perfectly, then the detection rate is 100%.
From the presented results, it can be determined that the proposed method is suitable for watermarking audio recordings of dialogues. The power ratio between the vocal signal and the sonic watermark should be kept at less or equal than 6 dB for best results. The sonic watermark should be synthesized so that the power ratio between the ticking sounds and the chirp signals is 20 dB. Thanks to the proposed auditory masking techniques, this value does not affect the auditory masking of the chirp signal by the ticking sounds. The recording duration plays an important role in determining the moment of the recording. The moment of a watermarked recording with a duration of at least 10 min can be precisely identified within a year period using the RSE and not the cross-correlation. Also, cut operations longer than 1 s are always detected for recordings longer than 10 min, with perfect detection of cut zones in more than 95% of the cases, while cuts shorter than 1 s are perfectly detected if the watermark is perfectly extracted, which happens if the presented power ratios between the participating signals are achieved.
4.3. Subjective Tests and Investigation on the Effects of Non-Linear Distortions of Real Speakers
Subjective tests were conducted in two parts. In the first part, an audio signal with a duration of five seconds was generated as explained onwards: the ticking sounds, used also in the other experiments of the paper, available at [41], were processed according to the watermark generation procedure described in the paper, using five randomly selected ENF values from the variation over one year made available by [6]. The ticking sound to chirp signals power ratio was set to 20 dB, resulting the sonic watermark. A random vocal signal from the database available at [43] was selected. The sonic watermark was summed with the vocal signal. The power ratio between the vocal signal and the sonic watermark was set to 6 dB. It can be observed that the power ratio values that gave the best results in the watermark recovery were selected for this test. The signal was presented to 60 listeners and they were asked to describe what they hear. None of the listeners mentioned that the ticking sound is suspicious. Most of the listeners wrote the words that were said in the recording mentioning the ticking of a clock in background. Some of them described the recording as: “I hear a man speaking and the ticking of a clock in the background.” The second part was a blind test: the same 60 listeners were presented with two audio signals one after the other. The first signal was 5 s long, containing the sonic watermark (ticking sounds summed with the chirp signals, the power ratio between the ticking sounds and the chirp signals being the same as in the first experiment, 20 dB) and no vocal signal. The only difference between this first signal and the second one was that the latter did not contain the chirp signals (it only contained the ticking sounds). The following question was asked: “Are the two signals identical?” The available answers were “Yes” and “No”. If the listeners answered “No”, they were asked what is different between the two signals. Only six listeners described the first signal as having more high frequency content than the latter, thus it can be concluded that in 90% of the cases, the sonic watermark will not be detected, even with a reference signal available, and in 100% of the cases the sonic watermark will not draw attention to it if no reference signal is available. From the 60 listeners, 25 used headphones during the test, 22 used laptop speakers, eight used smartphone speakers and five declared that they used “speakers” without declaring a type. This is a very tough test because, in real scenarios, the listeners would not have available the unmodified ticking sounds for comparison. The test returned very good results.
To determine the effects of the non-linear distortions of real speakers on the chirp signals detection, experiments were conducted in three situations, using the following speakers: professional audio monitor speakers (Samson Media One M50), budget speakers (Genius SP-U120), and laptop speakers (ASUS ROG GL753VD). In every case, 10 signals were played, every signal with a duration of five seconds, containing a sum of chirp signals encoding five random values of ENF, generated according to the method presented in the paper. The sound recording device was a Samsung Galaxy S10 smartphone. In all the cases, we determined 100% correct detection. From these experiments it results that the speakers’ non-linear distortions do not have degrading effects on the detection of the chirp signals in the situation presented in the paper.
5. Conclusions
The paper presents a sonic watermarking method developed based on the principles of the ENF criterion, a highly acclaimed audio authentication solution. Unfortunately, the new recording devices are built to reject the mains hum, the essential element needed for the ENF criterion to function.
The proposed sonic watermark uses a signal that can exist in any room without drawing attention to it: the ticking of a clock. The method uses this signal as a masker for a variable number of chirp signals that encode the ENF information. Choosing the parameters of the chirp signals is a crucial task, and was done based on five rigorous principles, presented in the paper. The sonic watermark generator was thoroughly described and, to ease its reproduction by other researchers, all the mathematical operations were presented. Also, the integrity check methods are detailed.
The method was comprehensively tested, using for each step of the experiments 100 watermarked vocal signals, considering also the signals’ propagation through the room. The resources used in the experiments are available in referenced online databases, helping other researchers to re-implement for further study. The results show how the power ratio between the involved signals affect the performance of extracting the watermark from the recording, and the limit values are presented. A great importance is played by the investigated signal duration, the results showing that only 10 min of recording allow the perfect finding of the recording moment in a one year period. The performance of perfectly detecting the cut parts of a recording (moment and duration) is also impressive, with over 95% perfect detection.
The main contribution of the method presented in this paper is that it extends the use of the ENF criterion to the recordings captured with newer devices. The other contributions of the paper are the proper design of the system to assure auditory masking of the chirp signals; the proper choice of the frequencies of the chirp signals to assure that they can be played using small enough speakers, allowing the system to be concealed and to maximize the watermark extraction performance; the encoding scheme of the ENF, assuring that the number of chirp signals that are used to encode the ENF value is kept to a minimum (if the ENF has the nominal value, only one chirp signal is played and the number of chirp signals increases with the deviation of the ENF from the nominal value); determining the values of the power ratios between the signals involved in the system that should be met to obtain good results, allowing a user to correctly set up the system; evaluating the impact of the acoustic environment on the proposed method; evaluating the perceptibility of the proposed sonic watermark through subjective testing.
The limitations of the proposed method are represented by the minimum duration of the recording that would allow a correct identification of the recording moment (i.e., 10 min), the maximum required power ratios between the watermark components (i.e., 20 dB ticking sounds to chirp signals power ratio), and the maximum power ratio between the vocal signals and the sonic watermark (i.e., 6 dB). Better performance is obtained in less reverberant environments. It is true that if the recording device does not capture signals above 8 KHz, it will not capture the chirp signals, but it will still capture the time delayed ticking pattern, generated based on a pseudorandom sequence. It can be assumed that at least one of the meeting members has the intention to record the true conversation with good quality, which can be the reference recording. Because the sonic watermark is embedded into all the recordings made in the room, if anyone modified their recording, there will still be enough clues to demonstrate that theirs is a modified copy of the reference recording and not the other way around (e.g., the modified recording has a lower sample rate, has been filtered, has been cut or modified through other ways to remove information).
Future work will further investigate the effects of the sound propagation on the watermark extraction performance, by evaluating the results in more numerous, real, and controlled environments. Special attention will be given to the influence of the reverberation time on the recovery of the watermark from the audio recordings. Also, a study of how various sound systems influence the watermark reproduction will be conducted, closely investigating the effects of the speakers’ non-linear distortions.
Author Contributions
Conceptualization, R.-A.D. and R.-O.P.; methodology, R.-A.D. and R.-O.P.; software, R.-A.D.; validation, R.-O.P. and M.V.; formal analysis, M.V.; writing—Original draft preparation, R.-A.D.; writing—review and editing, R.-O.P.; supervision, M.V. All authors have read and agreed to the published version of the manuscript.
Funding
This research and the APC were partially funded by the Operational Programme Human Capital of the Ministry of European Funds through the Financial Agreement “Developing the entrepreneurial skills of the PhD students and postdoctoral students—key to career success (A-Succes)” contract number 51675/09.07.2019 POCU/380/6/13, SMIS code 125125.
Conflicts of Interest
The authors declare no conflict of interest.
References
- Rodrıguez, D.P.N.; Apolinario, J.A.; Biscainho, L.W.P. Audio authenticity: Detecting ENF discontinuity with high precision phase analysis. IEEE Trans. Inf. Forensics Secur. 2010, 5, 534–543. [Google Scholar] [CrossRef]
- Cooper, A. Detecting Butt-spliced Edits in Forensic Digital Audio Recordings. In Proceedings of the 39th International Conference: Audio Forensics: Practices and Challenges, Hillerod, Denmark, 17–19 June 2010. [Google Scholar]
- Luo, D.; Yang, R.; Huang, J. Detecting Double Compressed AMR Audio Using Deep Learning. In Proceedings of the IEEE International Conference on Acoustics, Speech and Signal Processing (ICASSP), Florence, Italy, 4–9 May 2014; pp. 2669–2673. [Google Scholar]
- Grigoraș, C. Digital Audio Recording Analysis: The Electric Network Frequency (ENF) Criterion. Int. J. Speech Lang. Law 2005, 12, 63–76. [Google Scholar] [CrossRef]
- Kajstura, M.; Trawinska, A.; Hebenstreit, J. Application of the Electrical Network Frequency (ENF) Criterion–A case of a Digital Recording. Forensic Sci. Int. 2005, 155, 165–171. [Google Scholar] [CrossRef]
- Measurement of the Mains Frequency. Available online: www.mainsfrequency.com (accessed on 23 March 2020).
- Huijbregtse, M.; Geradts, Z. Using the ENF Criterion for Determining the Time of Recording of Short Digital Audio Recordings. In Proceedings of the IWCF ′09: Proceedings of the 3rd International Workshop on Computational Forensics, The Hague, The Netherlands, 13–14 August 2009; pp. 116–124.
- The Hum that Helps to Fight Crime. Available online: www.bbc.com/news/science-environment-20629671 (accessed on 7 May 2020).
- Power Grid Fluctuations Hidden in Audio Recordings Proved a Powerful Tool for Police Forensics. Available online: https://phys.org/news/2018-02-power-grid-fluctuations-hidden-audio.html (accessed on 7 May 2020).
- Asmara, R.A.; Agustina, R.; Hidayatulloh. Comparison of Discrete Cosine Transforms (DCT), Discrete Fourier Transforms (DFT), and Discrete Wavelet Transforms (DWT) in Digital Image Watermarking. Int. J. Adv. Comput. Sci. Appl. 2017, 8, 245–249. [Google Scholar]
- Dhar, P.K.; Shimamure, T. Blind audio watermarking in transform domain based on singular value decomposition and exponential-log operations. Radioengineering 2017, 26, 552–561. [Google Scholar] [CrossRef]
- Lei, W.N.; Chang, L.C. Robust and high-quality time-domain audio watermarking based on low-frequency amplitude modification. IEEE Trans. Multimed. 2006, 8, 46–59. [Google Scholar]
- Erfani, Y.; Siahpoush, S. Robust audio watermarking using improved TS echo hiding. Digit. Signal Process. 2009, 19, 809–814. [Google Scholar] [CrossRef]
- Basia, P.; Pitas, I.; Nikolaidis, N. Robust audio watermarking in the time domain. IEEE Trans. Multimed. 1998, 3, 232–241. [Google Scholar] [CrossRef]
- Natgunanathan, I.; Xiang, Y.; Hua, G.; Beliakov, G.; Yearwood, J. Patchwork-Based multi-layer audio watermarking. IEEE Trans. Audio Speech Lang. Process. 2017, 25, 2176–2187. [Google Scholar] [CrossRef]
- Xiang, S.J.; Li, Z.H. Reversible audio data hiding algorithm using noncausal prediction of alterable orders. EURASIP J. Audio Speech Music Process. 2017, 4. [Google Scholar] [CrossRef] [Green Version]
- Hu, H.T.; Hsu, L.Y.; Chou, H.H. Variable-dimensional vector modulation for perceptual-based DWT blind audio watermarking with adjustable payload capacity. Digit. Signal Process. 2014, 31, 115–123. [Google Scholar] [CrossRef]
- Hua, G.; Huang, J.; Shi, Y.Q.; Goh, J.; Thing, V.L. Twenty years of digital audio watermarking—A comprehensive review. Elsevier Signal Process. 2016, 128, 222–242. [Google Scholar] [CrossRef]
- Nita, V.A.; Ciobanu, A. Tic-Tac, Forgery Time Has Run-Up! Live Acoustic Watermarking For Integrity Check in Forensic Applications. In Proceedings of the 2018 IEEE International Conference on Acoustics, Speech and Signal Processing (ICASSP), Calgary, AB, Canada, 15−20 April 2018; pp. 1977–1981. [Google Scholar]
- Dobre, R.A.; Preda, R.O.; Marcu, A.E. TIC-TAC Based Live Acoustic Watermarking With Improved Forgery Detection Performances. In Proceedings of the 2019 IEEE 25th International Symposium for Design and Technology in Electronic Packaging (SIITME), Cluj-Napoca, Romania, 23−26 October 2019; pp. 408–412. [Google Scholar]
- Byrne, D.; Dillon, H.; Tran, K. An International Comparison of Long-term Average Speech Spectra. J. Acoust. Soc. Am. 1994, 96, 2108–2120. [Google Scholar] [CrossRef]
- 7 kHz Audio Coding within 64 kbit/s. ITU-T Rec. G.722. 1988. Available online: https://www.itu.int/rec/dologin_pub.asp?lang=f&id=T-REC-G.722-198811-S!!PDF-E&type=items (accessed on 12 May 2020).
- Othman, M.A.B.; Belz, J.; Farhang-Boroujeny, B. Matched Filter Bank for Detection of L inear Frequency Modulated Chirp Signals. IEEE Trans. Aerosp. Electron. Syst. 2017, 53, 41–54. [Google Scholar] [CrossRef]
- ENTSO-E Policy 1: Load Frequency Control and Performance, Chapter A. Available online: https://erranet.org/wp-content/uploads/2017/02/Policy_1_final.pdf (accessed on 12 May 2020).
- Zhang, Y.; Penn, M.; Tao, X.; Lang, C.; Yanzhu, Y.; Zhongyu, W.; Zhiyong, Y.; Lei, W.; Jason, B.; Jon, B.; et al. Wide-area Frequency Monitoring Network (FNET) Architecture and Applications. IEEE Trans. Smart Grid 2010, 1, 159–167. [Google Scholar] [CrossRef]
- Spanias, A.; Painter, T.; Atti, V. Audio Signal Processing and Coding; John Wiley & Sons: Hoboken, NJ, USA, 2007. [Google Scholar]
- Fletcher, H. Auditory Patterns. Rev. Mod. Phys. 1940, 12, 47–65. [Google Scholar] [CrossRef]
- Gelfand, S.A. Hearing -An Introduction to Psychological and Physiological Acoustics, 6th ed.; CRC Press, Taylor & Francis Group: New York, NY, USA, 2018. [Google Scholar]
- Munkong, R.; Biing-Hwang, J. Auditory perception and cognition. IEEE Signal Process. Mag. 2008, 25, 98–117. [Google Scholar] [CrossRef]
- Eggermont, J. Hearing Loss, 1st ed.; Academic Press: Cambridge, MA, USA, 2017. [Google Scholar]
- Moore, B.C.J.; Glasberg, B.R. Suggested Formulae for Calculating Auditory-filter Bandwidths and Excitation Patterns. J. Acoust. Soc. Am. 1983, 74, 750–753. [Google Scholar] [CrossRef]
- Glasberg, B.R.; Moore, B.C.J. Derivation of Auditory Filter Shapes from Notched-noise Data. Hear. Res. 1990, 47, 103–138. [Google Scholar] [CrossRef]
- Charles, M.B.; Cook, E. Radar Signals: An Introduction to Theory and Application, 1st ed.; Academic Press: Cambridge, MA, USA, 1967. [Google Scholar]
- Achim, H. Processing of SAR Data: Fundamentals, Signal Processing, Interferometry, 1st ed.; Springer: Berlin, Germany, 2004. [Google Scholar]
- Esquef, P.A.A.; Apolinario, J.A.; Biscainho, L.W.P. Edit Detection in Speech Recordings via Instantaneous Electric Network Frequency Variations. IEEE Trans. Inf. Forensics Secur. 2014, 9, 2314–2326. [Google Scholar] [CrossRef]
- Gay, S.L.; Benesty, J. Acoustic Signal Processing for Telecommunication; Kluwer Academic Publisher: Boston, MA, USA, 2000. [Google Scholar]
- Benesty, J.; Paleologu, C.; Gänsler, T.; Ciochină, S. A Perspective on Stereophonic Acoustic Echo Cancellation; Springer-Verlag Berlin Heidelberg: Berlin, Germany, 2011; ISBN 978-642-22573-4. [Google Scholar]
- Paleologu, C.; Benesty, J.; Ciochină, S. Linear System Identification Based on a Kronecker Product Decomposition. IEEE/ACM Trans. Audio Speech Lang. Process. 2018, 11, 1793–1808. [Google Scholar] [CrossRef]
- Karjalainen, M.; Antsalo, P.; Mäkivirta, A.; Välimäki, V. Pereption of Temporal Decay of Low-frequency Room Modes. In Proceedings of the AES 116th Convention, Berlin, Germany, 8−11 May 2004; pp. 1–8. [Google Scholar]
- Zhang, J.; Shen, Y.; Jiang, B.; Li, Y. Sound Absorption Characterization of Natural Materials and Sandwich Structure Composites. Aerospace 2018, 5, 75. [Google Scholar] [CrossRef] [Green Version]
- Freesound. Available online: www.freesound.org/ (accessed on 23 March 2020).
- Aachen Impulse Response Database. Available online: www.iks.rwth-aachen.de/en/research/tools-downloads/databases/aachen-impulse-response-database (accessed on 23 March 2020).
- Carnegie Melon University. Available online: http://www.speech.cs.cmu.edu/cmu_arctic/cmu_us_bdl_arctic/wav/ (accessed on 23 March 2020).
Figure 1.
Example of ENF behavior (recorded by [6] on the 1st of January 2015 between midnight and 01:00 a.m.).
Figure 1.
Example of ENF behavior (recorded by [6] on the 1st of January 2015 between midnight and 01:00 a.m.).

Figure 2.
The proposed sonic watermarking system is disguised as a clock. The mixture made from the ticking sounds and the chirp signals masked by them (i.e., the watermark) is played in the room. The recording devices in the room capture the mixture and the dialogue. In this way, the watermark is embedded in all the recordings.

Figure 3.
A recording of the acoustic signal produced by a mechanical clock: (a) Time domain representation highlighting the impulsive nature of the ticking sounds; (b) The spectrogram of the signal illustrated in panel (a) highlighting the large bandwidth of this type of audio signals.
Figure 3.
A recording of the acoustic signal produced by a mechanical clock: (a) Time domain representation highlighting the impulsive nature of the ticking sounds; (b) The spectrogram of the signal illustrated in panel (a) highlighting the large bandwidth of this type of audio signals.

Figure 4.
Linear up-chirp signal: (a) Time domain representation. The signal’s frequency increases linearly as the time passes; (b) The variation of the frequency of the signal that is illustrated in panel (a).
Figure 4.
Linear up-chirp signal: (a) Time domain representation. The signal’s frequency increases linearly as the time passes; (b) The variation of the frequency of the signal that is illustrated in panel (a).

Figure 5.
The block diagram of the proposed sonic watermark generator. The yellow blocks deliver the data to be embedded in the recordings, the blue blocks are the controlled audio signal generators, the gray blocks are signal processing stages, and the green block is the output stage, the speaker, playing the sonic watermark in the room.

Figure 6.
The histogram of the ENF values measured by [6] in the year 2015 with a 1 s resolution. It can be observed that the data follows a normal distribution (illustrated in red color). The parameters of the normal distribution that fits the data are the mean Hz and the standard deviation Hz.
Figure 6.
The histogram of the ENF values measured by [6] in the year 2015 with a 1 s resolution. It can be observed that the data follows a normal distribution (illustrated in red color). The parameters of the normal distribution that fits the data are the mean Hz and the standard deviation Hz.

Figure 7.
The flow diagram illustrating the processing that is made to convert the ENF value received from the measurement device to the nine bits that are used further to synthesize the output signal of this block.
Figure 7.
The flow diagram illustrating the processing that is made to convert the ENF value received from the measurement device to the nine bits that are used further to synthesize the output signal of this block.

Figure 8.
The magnitude response of the SNR improvement signal processing block.

Figure 9.
The functioning of the controlled delay line. When active (i.e., input bit equal to “1”), it delays the input signal with ms.
Figure 9.
The functioning of the controlled delay line. When active (i.e., input bit equal to “1”), it delays the input signal with ms.

Figure 10.
Chirp signal detection in harsh SNR conditions using a matched filter: (a) The chirp signal heavily affected by noise; (b) The impulse response of the matched filter; (c) The output of the matched filter.
Figure 10.
Chirp signal detection in harsh SNR conditions using a matched filter: (a) The chirp signal heavily affected by noise; (b) The impulse response of the matched filter; (c) The output of the matched filter.

Figure 11.
The block diagram of the chirp signals detector.

Figure 12.
The flowchart for extracting the pseudorandom binary sequence carrying the auxiliary room identification information.
Figure 12.
The flowchart for extracting the pseudorandom binary sequence carrying the auxiliary room identification information.

Figure 13.
The performance in localizing the moment of recording based on the cross-correlation function with various durations of the recording ( = 1200 s = 20 min, , and ) and the localization performance obtained using the RSE. In all four cases, a two-seconds cut operation was considered in the recording. The best performance is obtained using the RSE, while the cross-correlation requires a much longer recording (at least 10 times the duration used for RSE) to give notable results.

Figure 14.
Signals involved in identifying a cut region larger than one second (a) The reference ENF signal. Three parts are highlighted: the part before the cut (yellow), the part that has been cut (green) and the part after the cut (magenta); (b) The ENF signal extracted from the tampered recording (the cut part is missing). (c) The vector, (d) The vector, .

Figure 15.
The flow diagram describing the processes of the experiment done to characterize the watermark extraction performance.
Figure 15.
The flow diagram describing the processes of the experiment done to characterize the watermark extraction performance.

Figure 16.
(a) Probability of correct watermark detection depending on the PR between the vocal signal and the sonic watermark (ticking sound to chirp signals PR was constant, equal to 20 dB); (b) Probability of correct watermark detection depending on the PR between the ticking sound and the chirp signals (vocal signal to sonic watermark PR was constant, equal to 6 dB).

Figure 17.
The performance of detecting a cut operation, depending on the length of the recording.

Figure 18.
The probability of occurrence of a certain number, between 3 and 6, consecutive equal ENF values in one year, if the ENF values are captured every second.
Figure 18.
The probability of occurrence of a certain number, between 3 and 6, consecutive equal ENF values in one year, if the ENF values are captured every second.


Table 1.
The frequency range occupied by the nine chirp signals.
| Chirp Signal Identifier | Frequency Range (kHz) | Chirp Signal Identifier | Frequency Range (kHz) |
|---|---|---|---|
Table 2.
Determining the cut duration if the selected vector has the sequence of consecutive zeros placed at the beginning.
Table 2.
Determining the cut duration if the selected vector has the sequence of consecutive zeros placed at the beginning.
| Cut Duration | ||
|---|---|---|
| 0 | 0 | |
| 0 | 1 | |
| 1 | 0 | |
| 1 | 1 |
© 2020 by the authors. Licensee MDPI, Basel, Switzerland. This article is an open access article distributed under the terms and conditions of the Creative Commons Attribution (CC BY) license (http://creativecommons.org/licenses/by/4.0/).
Share and Cite
MDPI and ACS Style
Dobre, R.-A.; Preda, R.-O.; Vlădescu, M. Sonic Watermarking Method for Ensuring the Integrity of Audio Recordings. Appl. Sci. 2020, 10, 3367. https://doi.org/10.3390/app10103367
AMA Style
Dobre R-A, Preda R-O, Vlădescu M. Sonic Watermarking Method for Ensuring the Integrity of Audio Recordings. Applied Sciences. 2020; 10(10):3367. https://doi.org/10.3390/app10103367
Chicago/Turabian StyleDobre, Robert-Alexandru, Radu-Ovidiu Preda, and Marian Vlădescu. 2020. "Sonic Watermarking Method for Ensuring the Integrity of Audio Recordings" Applied Sciences 10, no. 10: 3367. https://doi.org/10.3390/app10103367
Note that from the first issue of 2016, this journal uses article numbers instead of page numbers. See further details here.