Article

Episode-Based Analysis of Size-Resolved Carbonaceous Aerosol Compositions in Wintertime of Xinxiang: Implication for the Haze Formation Processes in Central China

1
Key Laboratory for Yellow River and Huai River Water Environment and Pollution Control, Henan Key Laboratory for Environmental Pollution Control, School of Environment, Henan Normal University, Xinxiang 453007, China
2
State Key Laboratory of Atmospheric Boundary Layer Physics and Atmospheric Chemistry, Institute of Atmospheric Physics, Chinese Academy of Science, Beijing 100029, China
3
Center for Excellence in Regional Atmospheric Environment, Institute of Urban Environment, Chinese Academy of Science, Xiamen 361021, China
4
School of Resource and Environment, University of Chinese Academy of Science, Beijing 100049, China
*
Authors to whom correspondence should be addressed.
Appl. Sci. 2020, 10(10), 3498; https://doi.org/10.3390/app10103498
Submission received: 20 April 2020 / Revised: 12 May 2020 / Accepted: 12 May 2020 / Published: 19 May 2020
(This article belongs to the Special Issue Remote Sensing and Geoscience Information Systems in Applied Sciences)

Abstract

:
To provide a comprehensive understanding of carbonaceous aerosol and its role in the haze formation in the Central Plains Urban Agglomeration of China, size-segregated particulate matter samples (PM1, PM2.5 and PM10) were continually collected from 20 December 2017, to 17 January 2018, in Xinxiang, the third largest city of Henan province. The results showed that the mean mass concentrations of PM1, PM2.5 and PM10 were 63.20, 119.63 and 211.95 μg·m−3, respectively, and the organic carbon (OC) and elemental carbon (EC) were 11.37 (5.87), 19.24 (7.36), and 27.04 (10.27) μg·m−3, respectively. Four pollution episodes that were categorized by short evolution patterns (PE1 and PE3) and long evolution patterns (PE2 and PE4) were observed. Meteorological condition was attributed to haze episodes evolution pattern. Carbonaceous components contributed to PE1 and PE2 under drier condition through transportation and local combustion emission, while they were not main species in PE3 and PE4 for haze explosive growth under suitable RH, whatever for the short or long evolution pattern. The atmospheric self-cleaning processes were analyzed by a case study, which showed the wet scavenging effectively reduced the coarse particles with a removal rate of 73%, while it was not for the carbonaceous components in fine particles that is hydrophobic in nature. These results highlight that local primary emissions such as biomass combustion were the important sources for haze formation in Central China, especially in dry conditions.

1. Introduction

The frequent outbreaks and unprecedentedly high particulate matter (PM) concentrations of haze pollution during winter in China has drawn worldwide attention. The health hazardous of PM is size-dependent [1,2], due to its inhalable and adverse effects on the respiratory and cardiovascular system [3]. Besides, distinctive physical or chemical processes are associated to particle size [4,5], especially for the chemical components of a given size, such as carbonaceous species [6], which are closely related to a variety combustion processes and their secondary transformation [7,8,9]. However, the unpredicted temporal and spatial variations in PMs’ atmospheric dynamics makes each PM pollution event totally different, even if one pollution event contains the same chemical components as another. Therefore, insight into the concentration of PM size distribution and carbonaceous components are crucial to recognize the influence of the physical and chemical development of aerosol properties during the haze formation process [10].
The temporal pollution characteristics and source apportionment of haze in winter have been extensively reported in recent few years in China (e.g., [11,12,13]). For example, the peak value of PM10 (aerodynamic diameter 10 μm and smaller) appeared in spring in northwest area of China, such as Yulin [11], because of the frequent sand storms in Asia. In comparison, PM2.5 and PM1 (aerodynamic diameter 2.5 or 1 μm and smaller, respectively) showed similar seasonal variations with high value in winter in most cities of China [12]. It seems to be more complex for PM diurnal variations. A bimodal pattern was observed in most cities of north China due to morning and evening rush hour. A unimodal pattern associated with morning rush hour was observed in the central aera. While no clear pattern was observed in south China [13]. Therefore, the underlying aerosol formation mechanisms are so complicated that no universal controlling measurement could be used to mitigate PM fast and effectively. At present, various analogy methods aiming to comprehensively understand the haze formation mechanism and processes had been reported in previous studies, but haze-episode-based analysis was more effective to unveil the nature and differences between each haze pollution. For example, fine PM is the main contributor of the two most serious haze pollution episodes in eastern China in winter [14]. By further categorizing these into wet and dry haze, the key chemical species was attributed to sulfate in wet haze episodes and nitrate in dry haze episodes in Changzhou, a developed city in eastern China [15]. No doubt that the triggers are highly episode-dependent, especially for the secondary aerosol formation process in atmospheric PMs. Usually, carbonaceous aerosols constitute a substantial fraction of the atmospheric particles in China, accounting for approximately 20–50% of the PM2.5 mass [16,17,18], even higher in PM1 [19]. The Carbonaceous aerosols could change radiative forcing, then result in climate change. In addition, exposed in the toxic carbonaceous species longer, such as polycyclic aromatic hydrocarbons (PAHs) and polychlorinated biphenyls (PCBs), have the potential to increase human carcinogenic risk [20]. It is noteworthy that most carbonaceous species are anthropogenic, which could be divide into organic carbon (OC) and elemental carbon (EC). EC released directly through the combustion process is the main light-absorbing fraction in the atmosphere and plays an important role in reducing visibility and aerosol radiation forcing [21]. One the other hand, OC is derived not only from primary emissions which is regarded as primary organic carbon (POC) such as coal burning, traffic and biomass burning [22], but also from secondary organic carbon (SOC) formed by its precursors through atmospheric chemical transformation [23]. Variations in secondary organic carbon (SOC) and element carbon [24] were commonly attributed to atmospheric secondary formation and primary emission. Therefore, analyzing variations in size-dependent carbonaceous components with aux parameters on a basis of haze episodes event might facilitate to comprehensively understand each haze formation process.
Xinxiang is the third largest city of the Henan province, which is a hotspot area of severe haze pollution in North China with the air quality index (AQI) value frequently exceeding 500 in recent years, approximately double 300, the highest value of National Ambient Air Quality Standard of China (NAAQS, GB 3095-2012). Previous studies conducted at Xinxiang have demonstrated the seasonal characteristics of PM2.5 mass concentration and its chemical components, and subsequently speculated about the potential sources [25,26]. However, PM1 and PM10 have been seldom reported. Moreover, it is still a challenge for local government to further mitigate PM’s mass concentration in the following Five-Year Plan, 60% of days were clean (PM2.5 and PM10 less than 75 and 150 μm m−3, respectively, NAAQS, GB 3095-2012), unless we can understand each haze episode or a same type of haze episodes as much as possible. The source-related, size-segregated mass concentrations and their carbonaceous components, and dynamic relationships among them may give us clues on the underlying mechanism for each haze episode. Unfortunately, it remains unclear. Therefore, a monthly field measurement was conducted in Xinxiang from December 2017 to January 2018, with the following expectation: (1) to illustrate the characteristics of mass concentration and the carbonaceous components in PM1, PM2.5 and PM10; (2) to interpret the underlying processes of haze formation in different haze episodes.

2. Materials and Methods

2.1. Site Description and Sampling

The winter sampling campaign was conducted on the top of Tianjiabing teaching building (30 m above the ground) the campus of Henan Normal University (35°19′29″N, 113°54′27″E; Figure 1.).
PM1, PM2.5 and PM10 samples were simultaneously collected using three mid-volume air samplers at a rate of 100 L/min (TH-150C; Tianhong Company, Wuhan, China). In order to avoid flow rate decrease due to too much particle mass accumulated in the filter, two filter samples for each particles size were collected onto pre-baked (450 °C, 4.5 h) quartz fiber filters (Φ90 mm, Pall) every day from 08:00 to 19:30 in the daytime and from 20:00 to 07:30 in the following day for the nighttime, respectively; thus, a total of 87 aerosol samples were collected from 20 December 2017 to 17 January 2018. Before sampling, the filters were conditioned at 25 ± 0.5 °C and 50 ± 2% relative humidity for 48 h using a microbalance. All the filters were weighted using a microbalance with a resolution of 10 μg (XPE205; Mettler-Toledo, Switzerland) before and after sampling. After that, samples were kept in a deep freezer at −20 °C until chemical analysis.

2.2. Measurement

The OC and EC were determined on a 0.296-cm2 rounded quartz filter punch through the DRI Model 2001 Thermal/Optical Carbon Analyzer with IMPROVE_A (Interagency Monitoring of Protected Visual Environment) protocol. The quartz filters were heated in a non-oxidizing helium (He) tube in four temperature gradients (120, 250, 450 and 550 °C) to analyze the OC1, OC2, OC3 and OC4, respectively. Then, the temperature was raised stepwise to 550, 700 and 800 °C with 2% oxygen (O2) added, in order to analyze the EC1, EC2 and EC3, respectively. The gas generated under the above temperature gradients was oxidized to CO2 via the oxidation furnace (MnO2), converted to CH4 under the reduction environment, and the carbon content was determined using a flame ion detector (FID). The pyrolysis OC [27] was defined as the carbon that combusted after the initial introduction of oxygen and before the laser reflectance signal achieved its original value [17], and the OP was assigned to the OC fraction. According to the IMPROVE_A protocol, Total carbon (TC) was defined as OC + EC, OC was defined as OC1 + OC2 + OC3 + OC4 + OP, and EC was defined as EC1 + EC2 + EC3-OP. According to the study conducted by Han, Cao [28], Char-EC is defined as EC1-OP, and Soot-EC is defined as EC2 + EC3. Standard gas was used to calibrate the instrument every day, before and after the sample analysis, and test the instrument blank. One of every 10 samples was randomly selected for repeated testing. If the relative deviation of the sum of the EC and OC repeatedly tested is less than 5%, and if OC and EC are less than 10% [29], the sample analysis result is proven to be effective.

2.3. Backward Trajectories

The 48-h air mass backward trajectories that reached the sampling site (35°19′29″ N, 113°54′27″ E) were calculated using the National Oceanic and Atmospheric Administration (NOAA) HYSPLIT-4 model. The meteorological data (1° × 1° latitude-longitude horizontal resolution) introduced into the TrajStat software was acquired from the Global Data Assimilation System (ftp://arlftp.arlhq.noaa.gov/pub/archives/gdas1/). The 48-h air mass back trajectories were calculated at a height of 500 m for every sampling day, starting at 00:00. The cluster analysis was based on the 48-h backward trajectories, which were categorized into four clusters for each season.

2.4. POC and SOC

EC is inert in the atmosphere, and might be a tracer for POC [30]. Due to the lack of an analytical technique for directly quantifying the atmospheric concentrations of POC and SOC, the OC/EC minimum ratio method, which relies mainly on the ambient measurement of OC and EC, has received widespread application [31]. However, this approach can only be employed when the ratio of (OC/EC)min can be assumed to remain reasonably constant during the sampling campaign [32]. Furthermore, the meteorology remained constant during the sampling period. Hence, the following Equations (1) and (2) can be obtained for the semi-quantitative estimation of POC and SOC:
POC = EC × ( OC EC ) min ,
SOC = OC EC × ( OC EC ) min ,
where (OC/EC)min is the minimum OC/EC ratio of the ambient aerosol.

3. Results and Discussion

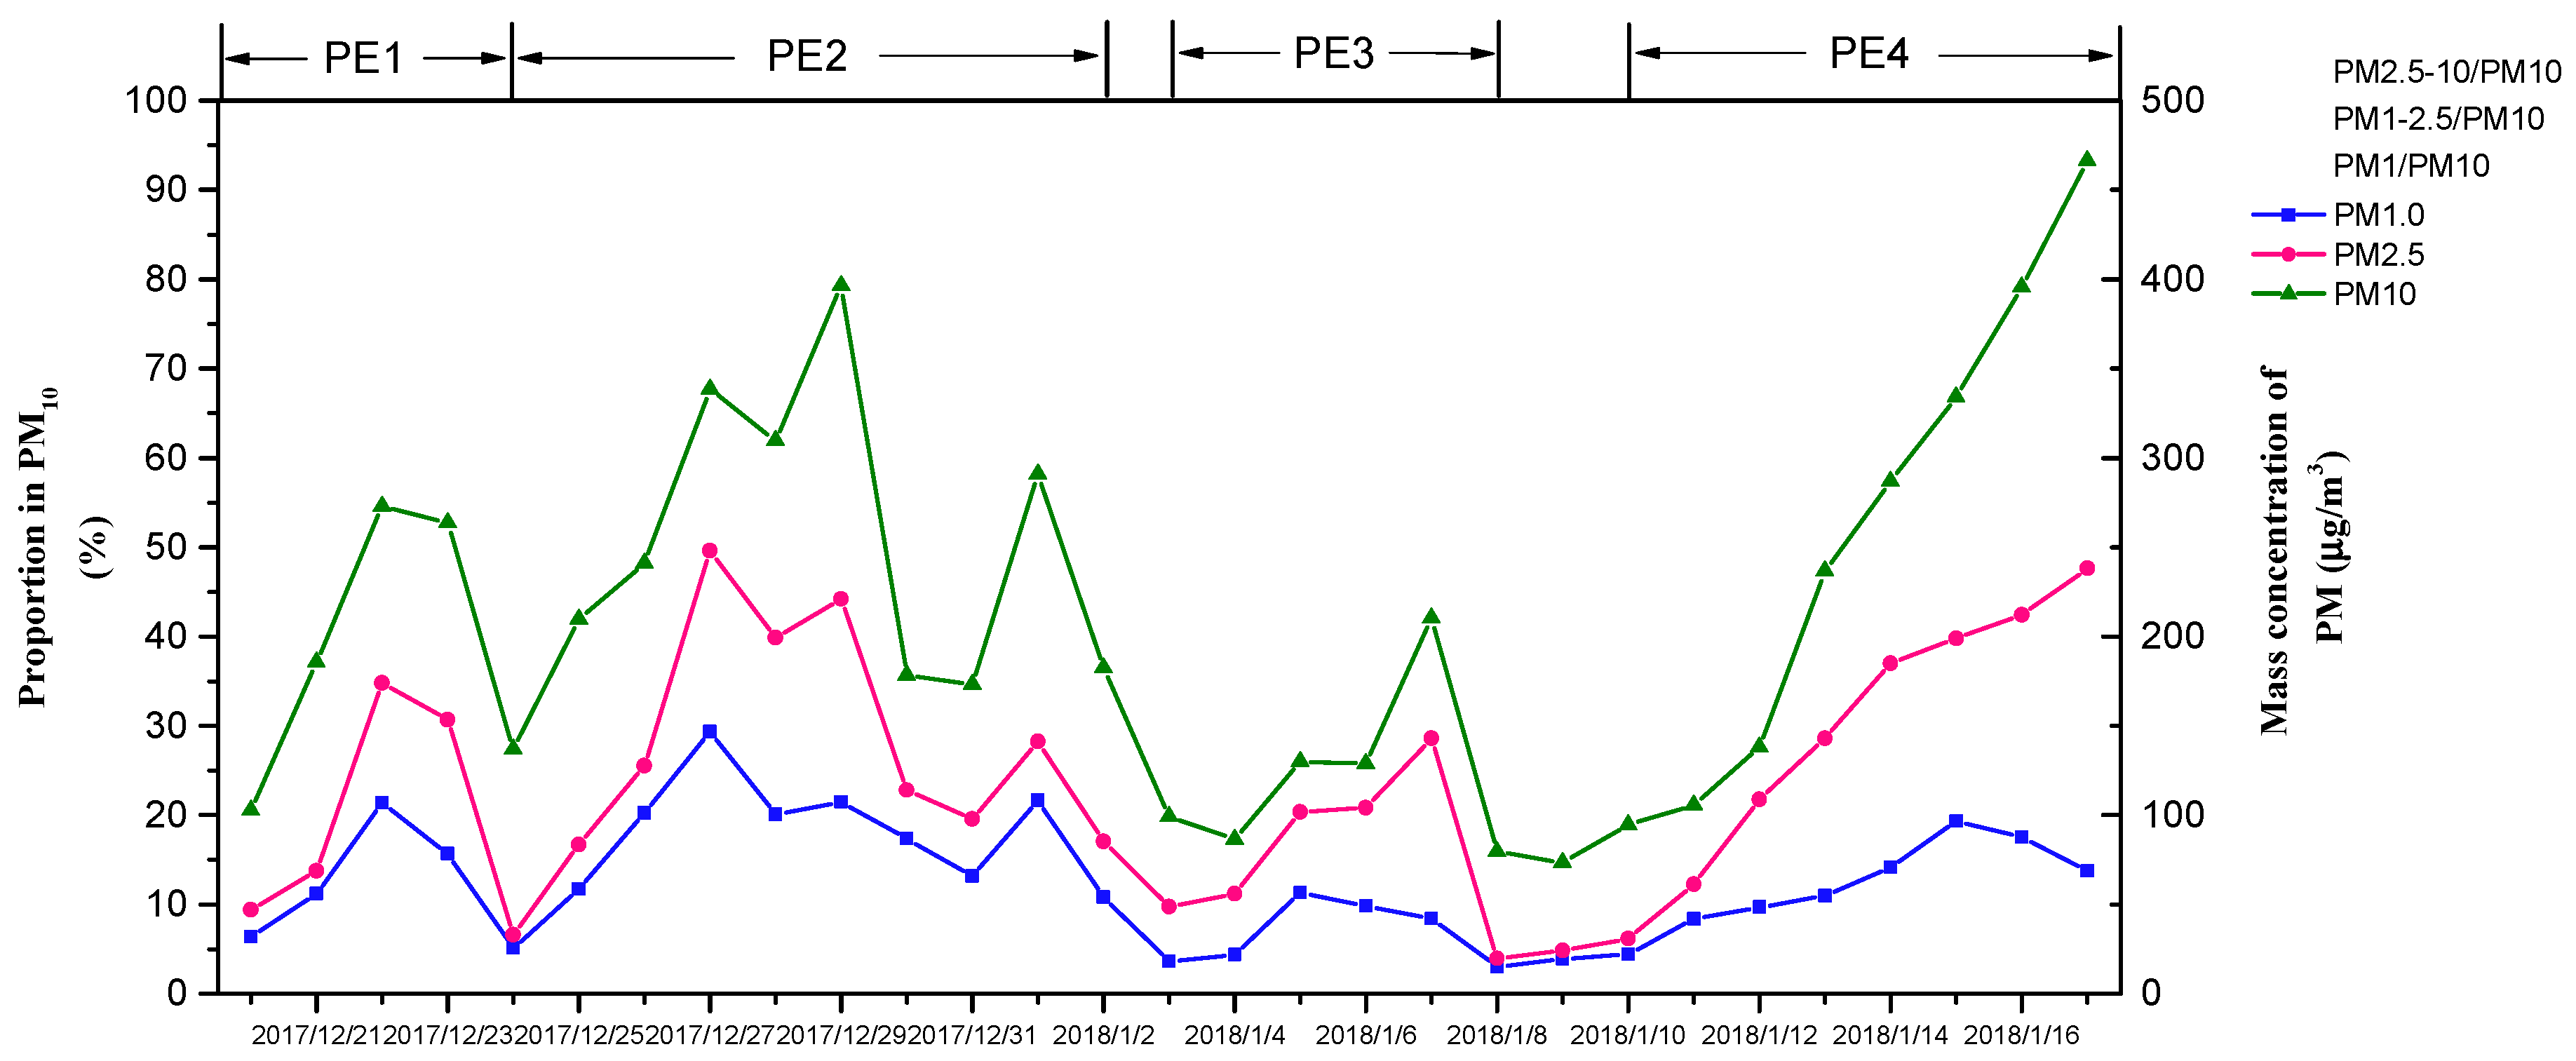
3.1. Mass Concentrations of PM and Meteorological Condition

Figure 2 depicted the temporal variations of the mass concentrations of PM1, PM2.5 and PM10 in the winter of 2017. The daily mean mass concentrations were 63.20 (range of 15.05 to 146.79) μg·m−3 for PM1, 119.63 (range of 19.62 to 248.06) μg·m−3 for PM2.5 and 211.95 (range of 73.34 to 466.41) μg·m−3 for PM10, respectively, which decreased by approximately 50% compared with those reported in the wintertime of 2015 and 2016 (224 and 223μg·m−3, respectively). Nevertheless, 69% of the sampling days were still recognized as polluted days, with a daily average PM2.5 exceeding 75 μg·m−3, and there were nine days with a daily average PM2.5 exceeding 150 μg·m−3. This indicated it was still heavily polluted and necessary to further mitigate in the future.
It has been widely accepted that specific meteorological conditions facilitate haze formation, such as high relative humidity (RH), low wind speed (WS) and temperature inversion condition, especially in wintertime in north China [33]. High RH is favored by atmospheric chemical reactions in the dry season, and then accelerates the PM2.5 retention in low WS or temperature inversion conditions [34]. Accordingly, in the present study, the mean RH and WS in the periods of PM2.5 exceeding 150 were 65% and 1.1 m·s−1, respectively (Figure S1). This is consistent to other studies in Zibo (WS of 1.1 m·s−1 and a RH of 55%) [35] and Zhengzhou (2.0 m·s−1 and the RH of 50–65%) [36] in the North China Plain. This suggested that meteorological conditions were important factors to contribute to heavy haze formation.

3.2. Characteristics of the Four Pollution Episodes

The haze episode definition in this study referred to a previous study by Tan, Hu [37]. Briefly, a complete haze episode is defined as the mass concentration of PM2.5 starting from less than 50 μg·m−3, up to a peak of more than 100 μg·m−3 and subsequently ending at less than 50 μg·m−3 again. We obtained four episodes that were 20–24 December 2017 (PE1), 24 December 2017–3 January 2018 (PE2), 3–8 January 2018 (PE3), and 10–17 January 2018 (PE4), respectively. Notably, PE4 was not a complete pollution episode without the concentration of PM2.5 decreasing to less than 50 μg·m−3 due to failure sampling after January 17.
The mean mass concentrations of PM1, PM2.5 and PM10 in the four pollution episodes were in the range of 59.69 to 192.32 μg·m−3, 79.35 to 232.37 μg·m−3, 33.78 to 122.34 μg·m−3, and 59.85 to 257.19 μg·m−3, respectively (Figure 2). According to durations and the peak values of PM2.5 (Table 1), the four PEs can be categorized into two short evolution pattern events (lasting for 5–6 days with relatively lower peak PM2.5 concentration for PE1 and PE3) and two long evolution pattern events (lasting for approximately 10 days with higher peak PM2.5 concentration for PE2 and PE4). The PM2.5 to PM10 ratio showed the same increase tendency to all four PEs as the elevation of PM2.5 (from 35.2% to 60.0%), which suggested the predominant contribution of fine particles on the developing of haze pollution. However, compared to a previous study in Beijing [37], the duration of the long evolution pattern was longer (11 vs. 9), but the peak concentrations of PM2.5 were lower than in Beijing (250 vs. 310 μg·m−3). This was most likely attributed to the different key chemical compositions and atmospheric chemistry processes between the two cities, especially in the extensity of secondary inorganic and organic formation.
In order to obtain more information on the four PEs, variation in the growth rate of size-dependent PM in each episode was calculated (Table 1). All three size fractions increased and were comparable in PE1 (25.0, 17.3 and 14.5 μg·m−3 for PM1, PM1–2.5 and PM2.5–10, respectively), while a predominant increase appeared for PM1 (25.2 μg·m−3) in PE2. The air mass wiggled between the south of Henan province and the south of Hebei province on 22–23 December in PE1 (Figure S2a), which facilitated the accumulation of PMs transported in the study area. However, the relatively clear and humid air mass from the south on December 27 and stable meteorological conditions appeared on the following December 28 in PE2, which most likely pointed to a heterogenous reaction under high local primary emission (Figure S2b). On the contrary, a predominant increase rate was observed for PM1 (11.6 μg·m−3) in PE3, which may be attributed to the aerosol merging effect in ice crystal. Differently, for PE4, the growth rate of PM2.5 (26.0 μg·m−3), especially for PM1–2.5 (23.9 μg·m−3) was significantly higher than that of PM10 and PM1. This was typically a feature of the secondary reaction and hygroscopic growth of PMs under stagnant conditions with high RH (58.2%) and low WS (0.82 m·s−1) (Table S1). The detailed reasons for this will be discussed in Section 3.3. Besides all four PEs, a lasting three days of snowfall was observed on 2–4 January. Subsequently, the PM2.5–10 mass decreased by 75%. The effective clearance of the coarse particles by wet scavenging was consistent with a previous study in Beijing, which showed that the removal effects through precipitation are positive for both PM2.5 and PM2.5–10, and the efficiency is 19.1–68.5% and 31.7–86.3%, respectively [38].

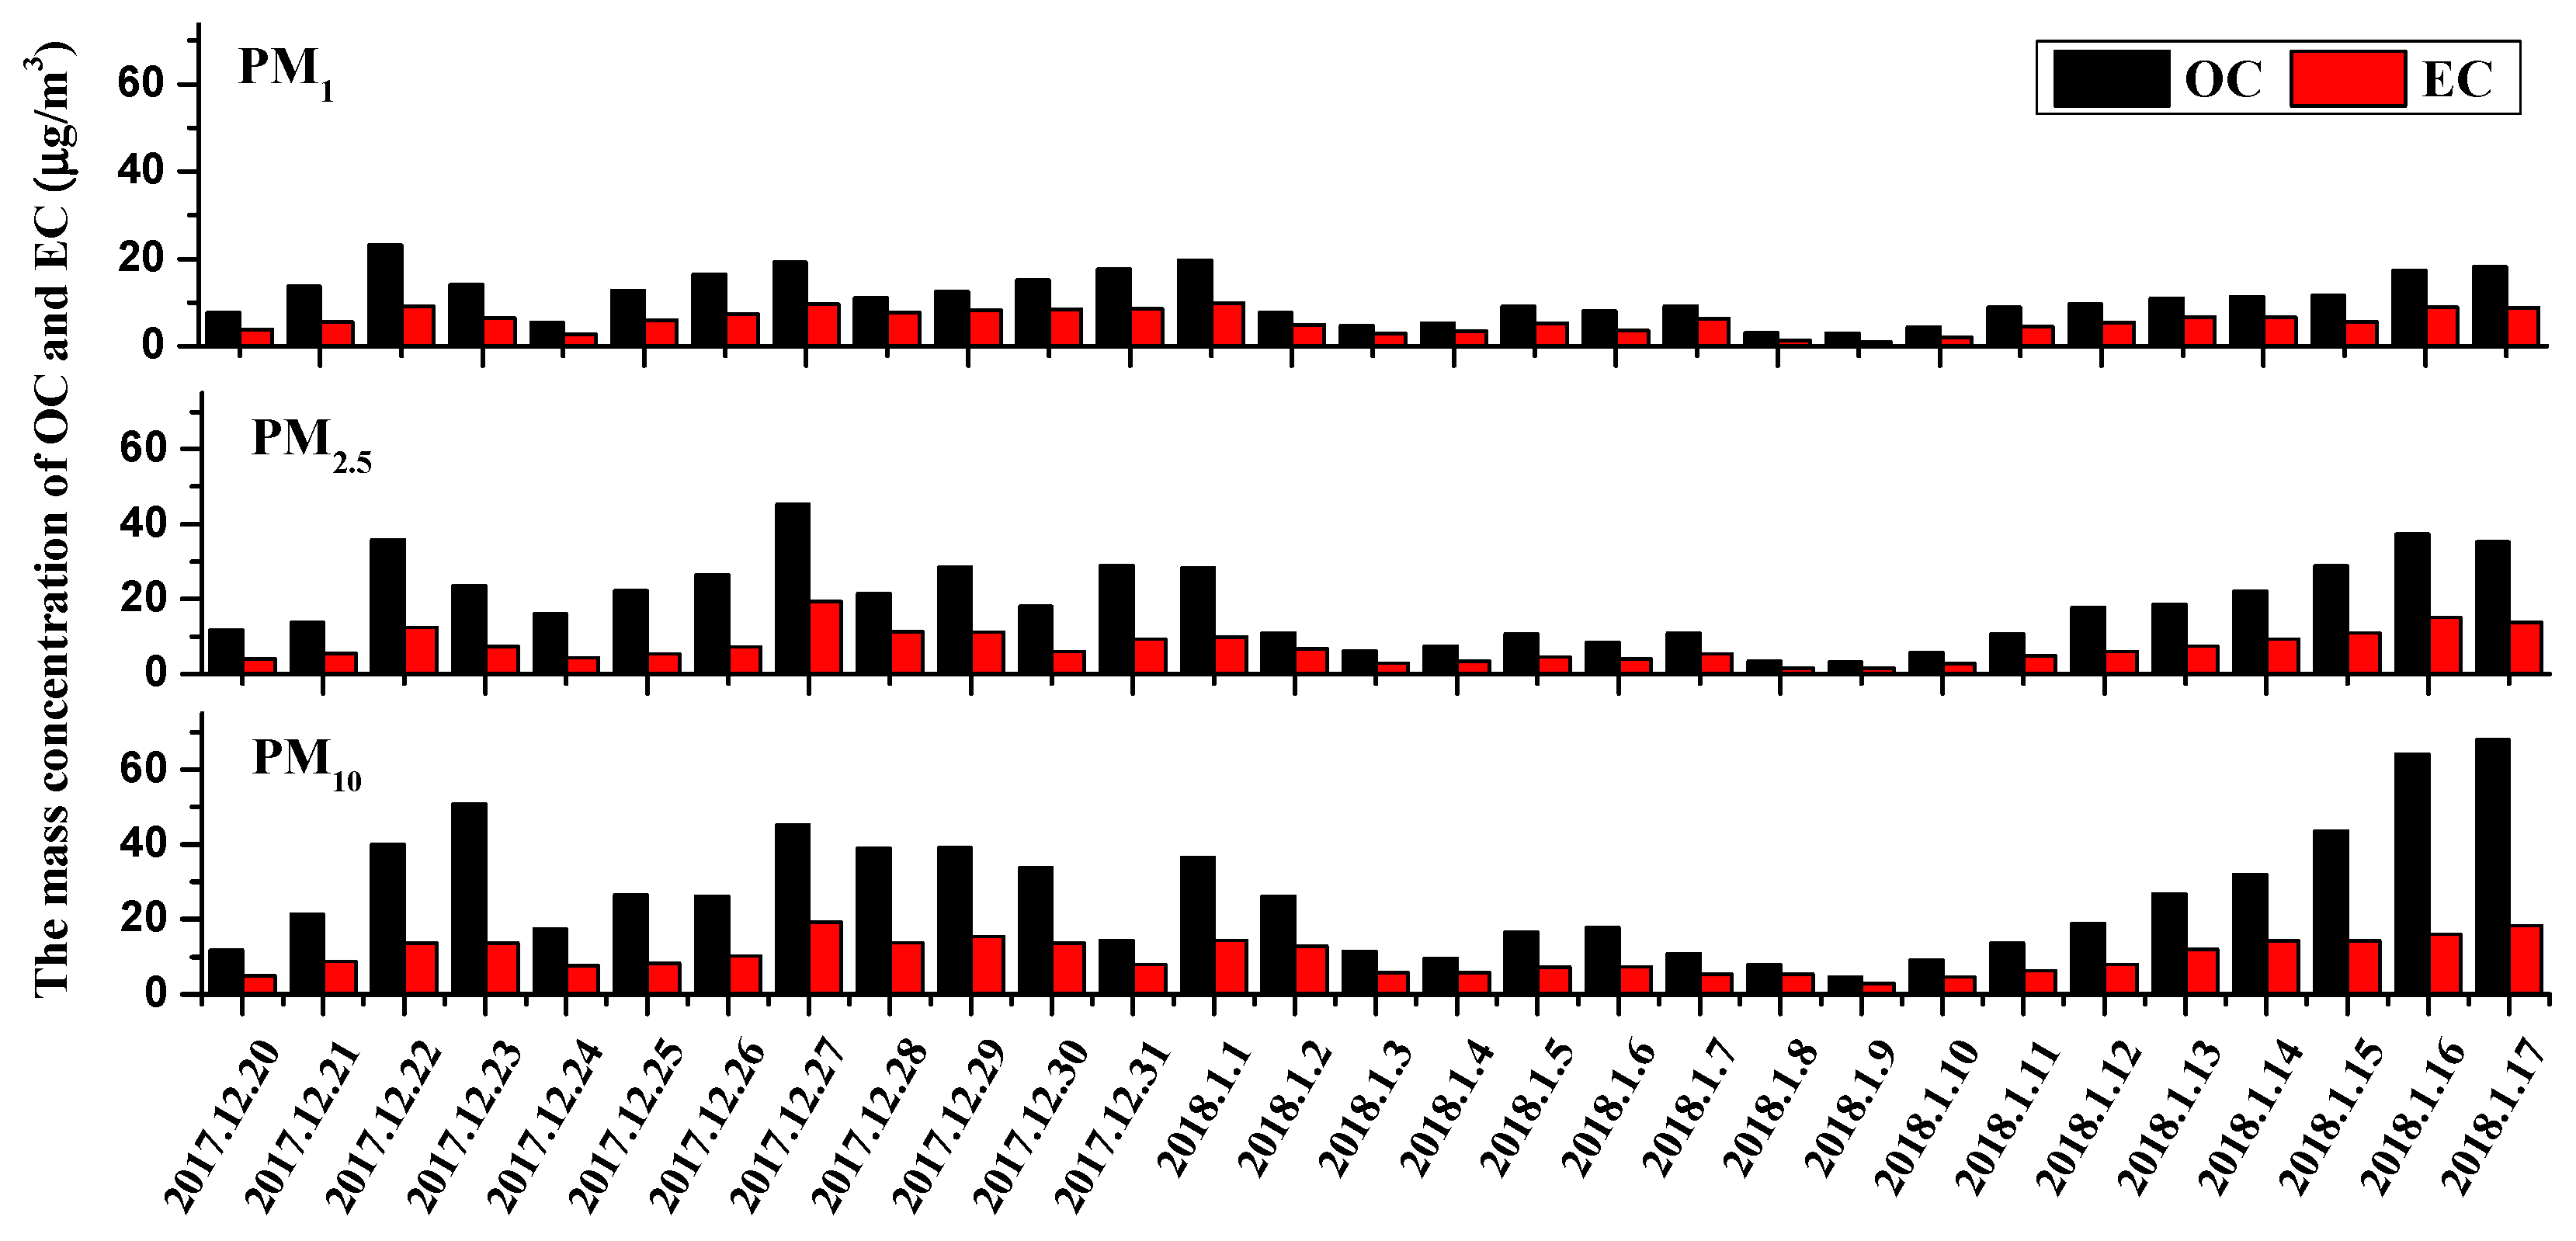
3.3. OC and EC Fractions

The average mass concentration of carbonaceous components (OC and EC) in PM1, PM2.5 and PM10 were 11.37 and 5.87, 19.24 and 7.36 μg·m−3, and 27.04 and 10.27 μg·m−3 during the whole sampling days, respectively (Figure 3). For the four PEs, both the mean OC and EC concentrations of PM1, PM2.5 and PM10 in PE3 were the lowest, with values in range of 6.59 to 12.39 μg·m−3 and 3.60–6.41 μg·m−3, respectively. While both OC and EC values were comparable in other three PEs, with values approximately double that in PE3 (Table 2). The proportion of TAC (TAC = OM + EC, OM (organic matter) = 1.6 × OC [39]) in PM1, PM2.5 and PM10 ranged from 25.4% to 59.7%, 17.2% to 58.1%, and 11.1% to 38.7%, with an average proportion of 43%, 36% and 26%, respectively. The decreasing trend with particle size increasement was consistent to that in previous study, which reported TAC accounted for 59.2% of PM0.1, while it was 44.6% and 43.8% of PM2.5 and PM10 in Vietnam [40]. The variation in size-dependent OC and EC concentration in these four PEs are discussed in the following three sections.

3.3.1. Effect of PMs Accumulation by Transportation and Local Emission in PE1 and PE2

The growth rates of OC in PE1 were comparable for PM1 and PM1–2.5, with values of 5.18 and 2.84 μg·m−3·day−1, respectively (Table 3), which come up to 21% and 16% of the mass growth rates of PM1 and PM1–2.5. The values increased up to 27% and 23% if we calculated TC growth rate to PM1 and PM1–2.5 mass. Interestingly, the percentages of TC in PM1 and PM1–2.5 mass were 30% and 24%, respectively, on the day of peak concentration. Additionally, the three sizes of PM mass concentration had similar increase rates. All this does not seem to take place chemical reaction rather than a physical process. Considering that the air mass wiggled on 23 December in PE1 combined with SOC increasing in PM1 fraction, we confidently speculated that a strong aerosol aging process took place during fully mixing with the polluted air from the south of Henan, west of Shandong and south of Hebei in PE1 (Figure S2a). In addition, the proportion of the four components of OC (OC1, OC2, OC3 and OC4) in TC during the formation of pollution was relatively stable in PE1 (Figure 4; since the content of EC3 and optical pyrolyzed OC (py) components are too low and the proportions are negligible, they are not in consideration), which was also a partly proof of the full mixing effect of air masses.
EC and POC are both mainly produced by primary emissions [41,42,43]. Therefore, summation of EC and POC could be regarded as the primary emission carbon (PC). The mean PC concentrations were 17.08, 22.37 and 29.19 μg·m−3 for PM1, PM2.5 and PM10, respectively. The concentration as well as the growth rate of PC in PE2 was clearly higher (4.21 in PM1, 9.85 μg·m−3·day−1 in PM2.5 and 7.27 μg·m−3·day−1 in PM10, respectively) (Table 3). Eventually, the ratios of TC to PM were 20% and 35% in the day with peak PM1 and PM2.5 mass concentration, with 81% and 78% contribution from PC. These indicated that local primary emission pollution has an important contribution to the formation of PE2. Through higher ratios of Char-EC/Soot-EC (ranging from 2.93 to 11.17 μg·m−3 for PM1, 2.38 to 18.67 μg·m−3 for PM2.5, and 4.95 to 17.04 μg·m−3 for PM10, with an average ratio of 6.54, 6.87 and 10.13 μg·m−3, respectively) (Table 2), we speculated that the incomplete combustion process from heating, such as biomass burning [44,45,46], or the difference in coal types, such as bituminous coal [46], need to be paid more attention in the controlling strategy. In summary, these results highlighted the accumulation effect on transportation and local primary emission under low RH condition.

3.3.2. Effect of Photochemical Reaction and Hygroscopic Growth in PE3 and PE4

Different to PE1 and PE2, the RH was relatively higher in PE3 and PE4. Carbonaceous components were predominantly in PM1, accounting to 37% and 39% in the day with peak PM1 mass concentration in PE3 and PE4, respectively. For PE3, it started after a snowfall. The temperature was below 0 °C and RH was 84%. In ice dominant condition, carbon components as ice cores could grow through ice collision, leading to aerosol aging [47]. This maybe the reason we overserved such high contribution of TC to PM1 mass. However, the situation changed in PM1–2.5, with only 2% contribution to PM increasement. Considering high RH and more radiation in clear air, a strong photochemical reaction or heterogenous reaction with SO2 or NO2 took place, which contributed to the fast increase of PM2.5.
In PE4, carbonaceous components contributed to 13% PM2.5 increasement. Although it was higher than that of PE3, it was 46–63% lower than that of PE1 and PE2. Moreover, the SOC growth rates were predominantly in PM2.5 with a value of 2.27 μg·m−3·day−1 (Table 3). Although an increase in SOC dominance occurred in PM2.5, the low percentile of SOC to PM2.5 did not seem to contribute to such an explosive growth in PM2.5 mass. Other components should contribute more in PE4, such as secondary inorganic aerosol through heterogenous reaction and hygroscopic growth. A previous study revealed that the particle size rapidly increased when the relative humidity exceeded 50% [48]. The liquid water not only satisfied the demand for the hygroscopic growth of PM, but also facilitated heterogeneous reactions for forming more secondary aerosols, and subsequently accelerating hygroscopic growth, eventually accounting for 48% of the total secondary organic aerosols [49]. In PE4, the average wind speed was 0.82 m·s−1 and the average relative humidity was 58.2%. Long-term stagnant and high-humidity meteorology conditions promoted the non-carbonaceous components to grow into PM1–2.5 through hygroscopic growth. In summary, these above clues strongly point to the influence of hygroscopic growth of PM and the heterogeneous secondary reaction from non-carbonaceous components on the formation of haze in suitable RH condition.

3.3.3. Effect of Wet Scavenging

When the emission of pollution sources was stable, meteorological conditions were the important factors that affected the concentration of PM and its components, such as the atmospheric self-cleaning processes by rainfall or snowfall [50]. The scavenging activity of snowfall is a crucial indicator of air quality improvement in winter. In 2–4 January 2018, a moderate snowfall was observed in Xinxiang lasting for three days. It is clearly showed that both OC and EC had low concentrations in PE3 (Table 2). In particular, the concentration of OC significantly decreased on 2–4 January (Figure 3). In order to visually show the wet scavenging effect of snowfall on PE3, three days before snowfall and other days in PE3 was used as the pre-snowfall and snowfall period to calculate the clearance rate. The clearance rates of OC and EC were 65% and 59% for PM1, 67% and 49% for PM2.5, and 44% and 32% for PM10, respectively. The carbonaceous components in PM1 had the highest clearance rate, but as for the PM mass concentration, PM10 had the highest clearance rate (59% for PM1, 64% for PM2.5 and 73% for PM10), which indicated that wet scavenging could effectively remove coarse particles and that OC was not predominant components in PM10. In addition, we estimated the clearance rates of POC and SOC to further elucidate wet scavenging effect on OC. The clearance rates of POC and SOC were 59% and 90% for PM1, 49% and 85% for PM2.5, and 32% and 64% for PM10, respectively. The clearance trends of POC and SOC for the three sizes were similar to that of OC. Notably, more than 85% of SOC was removed in PM1 and PM2.5 through wet cleansing while POC was not. This most likely related to the fact that SOC was composed of more hydrophilic components [50,51,52,53,54]. Witkowska [51] found that precipitation was the most effective form of atmospheric cleansing of water soluble organic carbon (WSOC) contained in PM1 and PM2.5 aerosols, and snow and rain cleaned WSOC more effectively when precipitation lasted longer than 24 h. Accordingly, it has been reported that 10–80% of the OC in aerosols is composed of WSOC [52,53,54]. On mid-latitude areas, wet deposition can remove as much as 80% of the carbonaceous aerosols [55]. Compared with OC, the influence of snowfall events on the EC concentration was relatively lower, which may relate to that EC has a longer atmospheric residence time than OC as its smaller size [56,57].

4. Conclusions

The daily mean mass concentration of PM1, PM2.5, and PM10 were 63.20, 119.63 and 211.95 μg·m−3, respectively. The average mass concentrations of OC and EC in PM1, PM2.5 and PM10 were 11.37 and 5.87, 19.24 and 7.36, and 27.04 and 10.27 μg·m−3, respectively. The average proportions of TM for the three particle sizes of PM1, PM2.5 and PM10 were 43%, 36% and 26%, respectively. These results revealed that the carbonaceous components in fine particles is high, and decrease along with the increase in particle size.
These four episodes were categorized as a short evolution pattern (PE1 and PE3) and a long evolution pattern (PE2 and PE4). Unstable metrological conditions, such as air mass frequently fluctuating or heavy wind blowing, was the main reason for the short evolution pattern. In comparison, stagnant condition facilities to atmospheric chemical reaction, which would last for more days in long evolution pattern. Carbonaceous components contributed to PE1 and PE2 under drier conditions through transportation and local combustion emission, while they were not main species in PE3 and PE4 for haze explosive growth under suitable RH, whether for the short or long evolution pattern. These results highlight that local primary emissions such as biomass combustion were important sources of haze formation in Central China, especially in dry conditions.

Supplementary Materials

The following are available online at https://www.mdpi.com/2076-3417/10/10/3498/s1, Figure S1: Mass concentration of PM2.5 and meteorological conditions (wind speed and relative humidity) during sampling period, Figure S2: The backward air mass trajectories of 48 h starting form Xinxiang, (a) for PE1, (b) for PE2, (c) for PE3 and (d) for PE4, Table S1: Meteorological parameters during the sampling period.

Author Contributions

Conceptualization, G.Y. and Z.L.; methodology, J.Z.; software, P.Z.; validation, G.Y., Z.L. and Y.W.; formal analysis, G.Y.; investigation, J.Z.; resources, G.Z. and Z.C.; data curation, P.Z.; writing—original draft preparation, J.Z.; writing—review and editing, G.Y. and Z.L.; visualization, G.Y.; supervision, Y.W.; project administration, G.Y.; funding acquisition, G.Y. All authors have read and agreed to the published version of the manuscript.

Funding

This work was funded by the Ministry of Science and Technology of China (grant no. 2017YFC0210000), the National Natural Science Foundation of China (41807327, 41805123), and the Program for Innovative Research Team in Science and Technology in University of Henan Province (No. 20 IRTSTHN011).

Conflicts of Interest

The authors declare no conflict of interest.

References

  1. Harrison, R.M.; Yin, J. Particulate matter in the atmosphere: Which particle properties are important for its effects on health? Sci. Total Environ. 2000, 249, 85–101. [Google Scholar] [CrossRef]
  2. Cifuentes, L.A.; Vega, J.; Kopfer, K.; Lave, L.B. Effect of the fine fraction of particulate matter versus the coarse mass and other pollutants on daily mortality in Santiago, Chile. J. Air Waste Manag. Assoc. (1995) 2000, 50, 1287–1298. [Google Scholar] [CrossRef] [PubMed]
  3. Heyder, J. Deposition of inhaled particles in the human respiratory tract and consequences for regional targeting in respiratory drug delivery. Proc. Am. Thorac. Soc. 2004, 1, 315–320. [Google Scholar] [CrossRef] [PubMed]
  4. Trippetta, S.; Caggiano, R.; Telesca, L. Analysis of particulate matter in anthropized areas characterized by the presence of crude oil pre-treatment plants: The case study of the Agri Valley (Southern Italy). Atmos. Environ. 2013, 77, 105–116. [Google Scholar] [CrossRef]
  5. Morawska, L.; Keogh, D.U.; Thomas, S.B.; Mengersen, K. Modality in ambient particle size distributions and its potential as a basis for developing air quality regulation. Atmos. Environ. 2008, 42, 1617–1628. [Google Scholar] [CrossRef] [Green Version]
  6. Ye, B.; Ji, X.; Yang, H.; Yao, X.; Chan, C.K.; Cadle, S.H.; Chan, T.; Mulawa, P.A. Concentration and chemical composition of PM2.5 in Shanghai for a 1-year period. Atmos. Environ. 2003, 37, 499–510. [Google Scholar] [CrossRef]
  7. Liu, X.; Zhang, Y.-L.; Peng, Y.; Xu, L.; Zhu, C.; Cao, F.; Zhai, X.; Haque, M.M.; Yang, C.; Chang, Y.; et al. Chemical and optical properties of carbonaceous aerosols in Nanjing, eastern China: Regionally transported biomass burning contribution. Atmos. Chem. Phys. 2019, 19, 11213–11233. [Google Scholar] [CrossRef] [Green Version]
  8. Ji, D.; Gao, W.; Maenhaut, W.; He, J.; Wang, Z.; Li, J.; Du, W.; Wang, L.; Sun, Y.; Xin, J.; et al. Impact of air pollution control measures and regional transport on carbonaceous aerosols in fine particulate matter in urban Beijing, China: Insights gained from long-term measurement. Atmos. Chem. Phys. 2019, 19, 8569–8590. [Google Scholar] [CrossRef] [Green Version]
  9. Kaushal, D.; Kumar, A.; Yadav, S.; Tandon, A.; Attri, A.K. Wintertime carbonaceous aerosols over Dhauladhar region of North-Western Himalayas. Environ. Sci. Pollut. Res. 2018, 25, 8044–8056. [Google Scholar] [CrossRef]
  10. Zhang, G.H.; Bi, X.H.; Chan, L.Y.; Wang, X.M.; Sheng, G.Y.; Fu, J.M. Size-segregated chemical characteristics of aerosol during haze in an urban area of the Pearl River Delta region, China. Urban Clim. 2013, 4, 74–84. [Google Scholar] [CrossRef]
  11. Wang, Y.Q.; Zhang, X.Y.; Gong, S.L.; Zhou, C.H.; Hu, X.Q.; Liu, H.L.; Niu, T.; Yang, Y.Q. Surface observation of sand and dust storm in East Asia and its application in CUACE/Dust. Atmos. Chem. Phys. 2008, 8, 545–553. [Google Scholar] [CrossRef] [Green Version]
  12. Zhan, C.L.; Zhang, J.Q.; Zheng, J.R.; Yao, R.Z.; Wang, P.; Liu, H.X.; Xiao, W.S.; Liu, X.L.; Cao, J.J. Characterization of carbonaceous fractions in PM2.5 and PM10 over a typical industrial city in central China. Environ. Sci. Pollut. Res. 2019, 26, 16855–16867. [Google Scholar] [CrossRef] [PubMed]
  13. Wang, Y.Q.; Zhang, X.Y.; Sun, J.Y.; Zhang, X.C.; Che, H.Z.; Li, Y. Spatial and temporal variations of the concentrations of PM10, PM2.5 and PM1 in China. Atmos. Chem. Phys. Discuss. 2015, 15, 3585–13598. [Google Scholar] [CrossRef]
  14. Deng, X.; Cao, W.; Huo, Y.; Yang, G.; Yu, C.; He, D.; Deng, W.; Fu, W.; Ding, H.; Zhai, J.; et al. Meteorological conditions during a severe, prolonged regional heavy air pollution episode in eastern China from December 2016 to January 2017. Theor. Appl. Climatol. 2019, 135, 1105–1122. [Google Scholar] [CrossRef]
  15. Ye, S.; Ma, T.; Duan, F.; Li, H.; He, K.; Xia, J.; Yang, S.; Zhu, L.; Ma, Y.; Huang, T.; et al. Characteristics and formation mechanisms of winter haze in Changzhou, a highly polluted industrial city in the Yangtze River Delta, China. Environ. Pollut. 2019, 253, 377–383. [Google Scholar] [CrossRef] [PubMed]
  16. Cao, J.J.; Lee, S.C.; Ho, K.F.; Zou, S.C.; Fung, K.; Li, Y.; Watson, J.G.; Chow, J.C. Spatial and seasonal variations of atmospheric organic carbon and elemental carbon in Pearl River Delta Region, China. Atmos. Environ. 2004, 38, 4447–4456. [Google Scholar] [CrossRef]
  17. Cao, J.J.; Wu, F.; Chow, J.C.; Lee, S.C.; Li, Y.; Chen, S.W.; An, Z.S.; Fung, K.K.; Watson, J.G.; Zhu, C.S.; et al. Characterization and source apportionment of atmospheric organic and elemental carbon during fall and winter of 2003 in Xi’an, China. Atmos. Chem. Phys. 2005, 5, 3127–3137. [Google Scholar] [CrossRef] [Green Version]
  18. Cao, J.J.; Lee, S.C.; Chow, J.C.; Watson, J.G.; Ho, K.F.; Zhang, R.J.; Jin, Z.D.; Shen, Z.X.; Chen, G.C.; Kang, Y.M.; et al. Spatial and seasonal distributions of carbonaceous aerosols over China. J. Geophys. Res. Atmos. 2007, 112. [Google Scholar] [CrossRef] [Green Version]
  19. Lim, S.; Lee, M.; Lee, G.; Kim, S.; Yoon, S.; Kang, K. Ionic and carbonaceous compositions of PM10, PM2.5 and PM1.0 at Gosan ABC Superstation and their ratios as source signature. Atmos. Chem. Phys. 2012, 12, 2007–2024. [Google Scholar] [CrossRef] [Green Version]
  20. Vedal, S. Ambient Particles and Health: Lines that Divide. J. Air Waste Manag. Assoc. 1997, 47, 551–581. [Google Scholar] [CrossRef] [Green Version]
  21. Jacobson, M.Z. Strong radiative heating due to mixing state of black carbon in atmospheric aerosol. Nature 2001, 409, 695–697. [Google Scholar] [CrossRef] [PubMed]
  22. Duan, F.; Liu, X.; Tong, Y.; Cachier, H. Identification and estimate of biomass burning contribution to the urban aerosol organic carbon concentrations in Beijing. Atmos. Environ. 2004, 38, 1275–1282. [Google Scholar] [CrossRef]
  23. Pankow, J.F. An absorption model of the gas/aerosol partitioning involved in the formation of secondary organic aerosol. Atmos. Environ. 2007, 41, S75–S79. [Google Scholar] [CrossRef]
  24. Decesari, S.; Facchini, M.C.; Fuzzi, S.; McFiggans, G.B.; Coe, H.; Bower, K.N. The water-soluble organic component of size-segregated aerosol, cloud water and wet depositions from Jeju Island during ACE-Asia. Atmos. Environ. 2005, 39, 211–222. [Google Scholar] [CrossRef]
  25. Feng, J.L.; Yu, H.; Mi, K.; Su, X.F.; Li, Y.; Li, Q.L.; Sun, J.H. One year study of PM2.5 in Xinxiang city, North China: Seasonal characteristics, climate impact and source. Ecotoxicol. Environ. Saf. 2018, 154, 75–83. [Google Scholar] [CrossRef] [PubMed]
  26. Feng, J.; Yu, H.; Liu, S.; Su, X.; Li, Y.; Pan, Y.; Sun, J. PM2.5 levels, chemical composition and health risk assessment in Xinxiang, a seriously air-polluted city in North China. Environ. Geochem. Health 2017, 39, 1071–1083. [Google Scholar] [CrossRef]
  27. Dai, Q.; Bi, X.; Liu, B.; Li, L.; Ding, J.; Song, W.; Bi, S.; Schulze, B.C.; Song, C.; Wu, J.; et al. Chemical nature of PM2.5 and PM10 in Xi’an, China: Insights into primary emissions and secondary particle formation. Environ. Pollut. 2018, 240, 155–166. [Google Scholar] [CrossRef]
  28. Han, Y.M.; Cao, J.J.; Chow, J.C.; Watson, J.G.; An, Z.S.; Jin, Z.D.; Fung, K.; Liu, S.X. Evaluation of the thermal/optical reflectance method for discrimination between char- and soot-EC. Chemosphere 2007, 69, 569–574. [Google Scholar] [CrossRef]
  29. Li, J.J.; Shen, Z.X.; Tong, Z.; Cao, J.J.; Han, Y.M.; Liu, S.X.; Zhu, C.S. Day-night variation of carbonaceous aerosols in PM10 during winter and spring over Xi’an. Huan Jing Ke Xue Huanjing Kexue 2009, 30, 1506–1513. [Google Scholar]
  30. Turpin, B.J.; Huntzicker, J.J. Identification of secondary organic aerosol episodes and quantitation of primary and secondary organic aerosol concentrations during SCAQS. Atmos. Environ. 1995, 29, 3527–3544. [Google Scholar] [CrossRef]
  31. Castro, L.M.; Pio, C.A.; Harrison, R.M.; Smith, D.J.T. Carbonaceous aerosol in urban and rural European atmospheres: Estimation of secondary organic carbon concentrations. Atmos. Environ. 1999, 33, 2771–2781. [Google Scholar] [CrossRef]
  32. Turpin, B.J.; Huntzicker, J.J. Secondary formation of organic aerosol in the Los Angeles basin: A descriptive analysis of organic and elemental carbon concentrations. Atmos. Environ. Part A Gen. Top. 1991, 25, 207–215. [Google Scholar] [CrossRef]
  33. Ye, W.F.; Ma, Z.Y.; Ha, X.Z. Spatial-temporal patterns of PM2.5 concentrations for 338 Chinese cities. Sci. Total Environ. 2018, 631–632, 524–533. [Google Scholar] [CrossRef] [PubMed]
  34. Sun, Y.L.; Wang, Z.F.; Fu, P.Q.; Jiang, Q.; Yang, T.; Li, J.; Ge, X.L. The impact of relative humidity on aerosol composition and evolution processes during wintertime in Beijing, China. Atmos. Environ. 2013, 77, 927–934. [Google Scholar] [CrossRef]
  35. Luo, Y.Y.; Zhou, X.H.; Zhang, J.Z.; Xiao, Y.; Wang, Z.; Zhou, Y.; Wang, W.X. PM2.5 pollution in a petrochemical industry city of northern China: Seasonal variation and source apportionment. Atmos. Res. 2018, 212, 285–295. [Google Scholar] [CrossRef]
  36. Jiang, N.; Duan, S.G.; Yu, X.; Zhang, R.Q.; Wang, K. Comparative major components and health risks of toxic elements and polycyclic aromatic hydrocarbons of PM2.5 in winter and summer in Zhengzhou: Based on three-year data. Atmos. Res. 2018, 213, 173–184. [Google Scholar] [CrossRef]
  37. Tan, T.; Hu, M.; Li, M.; Guo, Q.; Wu, Y.; Fang, X.; Gu, F.; Wang, Y.; Wu, Z. New insight into PM2.5 pollution patterns in Beijing based on one-year measurement of chemical compositions. Sci. Total Environ. 2018, 621, 734–743. [Google Scholar] [CrossRef]
  38. Zheng, Z.; Xu, G.; Li, Q.; Chen, C.; Li, J. Effect of precipitation on reducing atmospheric pollutant over Beijing. Atmos. Pollut. Res. 2019, 10, 1443–1453. [Google Scholar] [CrossRef]
  39. Li, B.; Zhang, J.; Zhao, Y.; Yuan, S.; Zhao, Q.; Shen, G.; Wu, H. Seasonal variation of urban carbonaceous aerosols in a typical city Nanjing in Yangtze River Delta, China. Atmos. Environ. 2015, 106, 223–231. [Google Scholar] [CrossRef]
  40. Thuy, N.T.T.; Dung, N.T.; Sekiguchi, K.; Thuy, L.B.; Hien, N.T.T.; Yamaguchi, R. Mass Concentrations and Carbonaceous Compositions of PM0.1, PM2.5, and PM10 at Urban Locations of Hanoi, Vietnam. Aerosol Air Qual. Res. 2018, 18, 1591–1605. [Google Scholar] [CrossRef] [Green Version]
  41. Hu, W.W.; Hu, M.; Deng, Z.Q.; Xiao, R.; Kondo, Y.; Takegawa, N.; Zhao, Y.J.; Guo, S.; Zhang, Y.H. The characteristics and origins of carbonaceous aerosol at a rural site of PRD in summer of 2006. Atmos. Chem. Phys. 2012, 12, 1811–1822. [Google Scholar] [CrossRef] [Green Version]
  42. Lim, H.-J.; Turpin, B.J. Origins of primary and secondary organic aerosol in Atlanta: Results of time-resolved measurements during the Atlanta Supersite Experiment. Environ. Sci. Technol. 2002, 36, 4489–4496. [Google Scholar] [CrossRef] [PubMed]
  43. Lin, P.; Hu, M.; Deng, Z.; Slanina, J.; Han, S.; Kondo, Y.; Takegawa, N.; Miyazaki, Y.; Zhao, Y.; Sugimoto, N. Seasonal and diurnal variations of organic carbon in PM2.5 in Beijing and the estimation of secondary organic carbon. J. Geophys. Res. Atmos. 2009, 114. [Google Scholar] [CrossRef]
  44. Cao, J.J.; Zhu, C.S.; Tie, X.X.; Geng, F.H.; Xu, H.M.; Ho, S.S.H.; Wang, G.H.; Han, Y.M.; Ho, K.F. Characteristics and sources of carbonaceous aerosols from Shanghai, China. Atmos. Chem. Phys. 2013, 13, 803–817. [Google Scholar] [CrossRef] [Green Version]
  45. Chow, J.C.; Watson, J.G.; Chen, L.W.A.; Arnott, W.P.; Moosmuller, H.; Fung, K. Equivalence of elemental carbon by thermal/optical reflectance and transmittance with different temperature protocols. Environ. Sci. Technol. 2004, 38, 4414–4422. [Google Scholar] [CrossRef] [PubMed]
  46. Han, Y.M.; Cao, J.J.; Lee, S.C.; Ho, K.F.; An, Z.S. Different characteristics of char and soot in the atmosphere and their ratio as an indicator for source identification in Xi’an, China. Atmos. Chem. Phys. 2010, 10, 595–607. [Google Scholar] [CrossRef] [Green Version]
  47. Ding, S.; Zhao, D.; He, C.; Huang, M.; He, H.; Tian, P.; Bi, K.; Liu, Q.; Yu, C.; Pitt, J.; et al. Observed Interactions Between Black Carbon and Hydrometeor During Wet Scavenging in Mixed-Phase Clouds. Geophys. Res. Lett. 2019, 46. [Google Scholar] [CrossRef] [Green Version]
  48. McMurry, P.H.; Stolzenburg, M.R. On the sensitivity of particle size to relative humidity for Los Angeles aerosols. Atmos. Environ. (1967) 1989, 23, 497–507. [Google Scholar] [CrossRef]
  49. Wu, J.; Bei, N.; Hu, B.; Liu, S.; Zhou, M.; Wang, Q.; Li, X.; Liu, L.; Feng, T.; Liu, Z.; et al. Is water vapor a key player of the wintertime haze in North China Plain? Atmos. Chem. Phys. 2019, 19, 8721–8739. [Google Scholar] [CrossRef] [Green Version]
  50. Tie, X.; Zhang, Q.; He, H.; Cao, J.; Han, S.; Gao, Y.; Li, X.; Jia, X.C. A budget analysis of the formation of haze in Beijing. Atmos. Environ. 2015, 100, 25–36. [Google Scholar] [CrossRef]
  51. Witkowska, A.; Lewandowska, A.U. Water soluble organic carbon in aerosols (PM1, PM2.5, PM10) and various precipitation forms (rain, snow, mixed) over the southern Baltic Sea station. Sci. Total Environ. 2016, 573, 337–346. [Google Scholar] [CrossRef]
  52. Zhang, Y.L.; Liu, J.W.; Salazar, G.A.; Li, J.; Zotter, P.; Zhang, G.; Shen, R.R.; Sch, K.; Schnelle-Kreis, J.; Prév, A.S.H. Micro-scale (μg) radiocarbon analysis of water-soluble organic carbon in aerosol samples. Atmos. Environ. 2014, 97, 1–5. [Google Scholar] [CrossRef] [Green Version]
  53. Lopes, S.P.; Matos, J.T.V.; Silva, A.M.S.; Duarte, A.C.; Duarte, R.M.B.O. H-1 NMR studies of water- and alkaline-soluble organic matter from finen urban atmospheric aerosols. Atmos. Environ. 2015, 119, 374–380. [Google Scholar] [CrossRef]
  54. Qiao, T.; Zhao, M.; Xiu, G.; Yu, J. Seasonal variations of water soluble composition (WSOC, Hulis and WSIIs) in PM1 and its implications on haze pollution in urban Shanghai, China. Atmos. Environ. 2015, 123, 306–314. [Google Scholar] [CrossRef]
  55. Pan, Y.P.; Wang, Y.S. Atmospheric wet and dry deposition of trace elements at 10 sites in Northern China. Atmos. Chem. Phys. 2015, 15, 951–972. [Google Scholar] [CrossRef] [Green Version]
  56. Lim, H.J.; Turpin, B.J.; Russell, L.M.; Bates, T.S. Organic and elemental carbon measurements during ACE-Asia suggest a longer atmospheric lifetime for elemental carbon. Environ. Sci. Technol. 2003, 37, 3055–3061. [Google Scholar] [CrossRef] [PubMed]
  57. Niu, Z.; Zhang, F.; Chen, J.; Yin, L.; Wang, S.; Xu, L. Carbonaceous species in PM2.5 in the coastal urban agglomeration in the Western Taiwan Strait Region, China. Atmos. Res. 2013, 122, 102–110. [Google Scholar] [CrossRef]
Figure 1. Location of sampling site in Xinxiang.
Applsci 10 03498 g001
Figure 2. Concentration of particle mass in PM1, PM2.5 and PM10.
Applsci 10 03498 g002
Figure 3. The mass concentration of OC and EC in PM1, PM2.5 and PM10 during the sampling days.
Applsci 10 03498 g003
Figure 4. The percentage contributions (to TC) of eight carbon fractions in PM1, PM2.5 and PM10 when PM2.5 exceeded 100 μg·m−3 during the pollution formation of the four PEs.
Applsci 10 03498 g004
Table 1. Characteristic of the four pollution episodes.
Pollution Episode1234
Period12/20–12/2412/24–1/31/3–1/81/10–1/17
Duration time (day)5116>8
Average growth rate of PM1 (μg·m−3·day−1)25.025.211.62.1
Average growth rate of PM2.5 (μg·m−3·day−1)42.331.617.726.0
Average growth rate of PM10 (μg·m−3·day−1)56.834.810.214.5
Table 2. Concentration and range of carbonaceous components in PM1, PM2.5 and PM10 in the four PEs.
PEPE1PE2PE3PE4
PM1PM2.5PM10PM1PM2.5PM10PM1PM2.5PM10PM1PM2.5PM10
TC (μg·m−3)18.2926.9237.7819.9031.6240.5010.4611.4618.5217.5730.8246.26
OC (μg·m−3)1120.2328.3312.9523.0728.756.597.8612.3911.5222.0334.54
EC (μg·m−3)5.546.719.706.958.5411.763.603.876.146.068.7911.72
POC (μg·m−3)8.0710.8714.3810.1313.8317.435.635.839.108.8214.2317.37
PC (μg·m−3)13.5217.5824.0817.0822.3729.199.239.715.2414.8823.0229.09
SOC (μg·m−3)4.699.3613.953.1110.1711.320.962.033.952.697.8017.18
SOC/OC34%46%45%19%38%37%15%26%23%23%34%42%
TAC/PM46%51%28%36%37%26%46%24%23%44%32%26%
OC/EC2.223.062.771.852.832.421.802.191.981.922.482.72
Char-EC/Soot-EC6.977.886.776.546.8710.134.744.245.396.8210.678.52
Table 3. The growth rate of OC, SOC, POC and PC of PM1, PM2.5 and PM10 in 4 PEs.
SizesPE1PE2PE3PE4
Average growth rate of OC (μg·m−3·day−1)PM15.183.672.271.75
PM2.58.023.471.543.99
PM109.312.891.703.27
Average growth rate of SOC (μg·m−3·day−1)PM12.651.460.270.12
PM2.53.471.930.602.27
PM105.031.580.991.66
Average growth rate of POC (μg·m−3·day−1)PM12.532.221.191.63
PM2.54.551.540.941.72
PM104.641.300.711.61
Average growth rate of PC (μg·m−3·day−1)
(increased to the maximum)
PM14.274.211.672.42
PM2.57.369.851.294.67
PM107.277.270.994.27

