Spectrogram Classification Using Dissimilarity Space


1
DEI, Via Gradenigo 6, 35131 Padova, Italy
2
DISI, University of Bologna, Via dell’Università 50, 47521 Cesena, Italy
3
Department of Information Technology and Cybersecurity, Missouri State University, 901 S. National Street, Springfield, MO 65804, USA
*
Author to whom correspondence should be addressed.
Appl. Sci. 2020, 10(12), 4176; https://doi.org/10.3390/app10124176
Submission received: 19 May 2020
/
Revised: 9 June 2020
/
Accepted: 9 June 2020
/
Published: 17 June 2020
(This article belongs to the Special Issue Texture and Colour in Image Analysis)
Abstract
:In this work, we combine a Siamese neural network and different clustering techniques to generate a dissimilarity space that is then used to train an SVM for automated animal audio classification. The animal audio datasets used are (i) birds and (ii) cat sounds, which are freely available. We exploit different clustering methods to reduce the spectrograms in the dataset to a number of centroids that are used to generate the dissimilarity space through the Siamese network. Once computed, we use the dissimilarity space to generate a vector space representation of each pattern, which is then fed into an support vector machine (SVM) to classify a spectrogram by its dissimilarity vector. Our study shows that the proposed approach based on dissimilarity space performs well on both classification problems without ad-hoc optimization of the clustering methods. Moreover, results show that the fusion of CNN-based approaches applied to the animal audio classification problem works better than the stand-alone CNNs.
1. Introduction
Sound classification and recognition have been applied in different domains, e.g., speech recognition [1], music classification [2], environmental sound recognition, and biometric identification [3]. Traditionally, in pattern recognition problems, features have been extracted from the actual audio traces (e.g., Statistical Spectrum Descriptor and Rhythm Histogram [4]). However, by replacing audio traces by their visual representation, image classification techniques can be used to extract features on sound classification problems. The most commonly used visual representation of audio traces involves the display of their frequency spectrum as they vary in time, as in spectrograms [5] and Mel-frequency Cepstral Coefficients spectrograms [6]. A spectrogram can be described as a graph with two dimensions (time and frequency) plus a third dimension in terms of pixel intensity [7] that represents the signal amplitude in a specific frequency at a particular time step. Costa et al. [8,9] applied several classification and texture analysis techniques to music genre classification using such a method. In [9], the authors extracted grey level co-occurrence matrices (GLCMs) [10] from spectrograms, while in [8] they used the local binary pattern (LBP) [11], which is a popular texture descriptor. In [12], two other feature descriptors were extracted from audio images: local phase quantization (LPQ) and Gabor filters [13]. In 2017, Nanni et al. [2] demonstrated on multiple audio datasets how the fusion of acoustic features extracted from audio traces using state-of-the-art texture descriptors greatly improves the accuracy of acoustic and visual feature-based systems.
When deep learning became popular and Graphic Processing Units (GPUs) became more powerful at accessible costs, traditional pattern recognition changed, and attention focused even more on visual representations of acoustic traces. In the traditional machine learning framework, the optimization of the feature extraction step plays a key role, especially with the evolution of handcrafted features, which minimize the distance between patterns of the same class in the feature space while simultaneously attempting to maximize their distance from the patterns of other classes. Since deep classifiers learn the best features for describing patterns during the training process, these engineered features have diminished in significance, playing in the deep framework more of a supporting role when combined with features extracted from visual representations of acoustic traces that the deep classifiers determine are most informative. Another reason for the growing popularity of representing audio as images is the fact that the convolutional neural network (CNN), one of the most famous deep classifiers, requires images for its input. In their study, Humphrey and Bello [14,15] explored CNNs as an alternative approach to music classification problems, establishing the state-of-the-art in automatic chord detection and recognition. Nakashika et al. [16] converted spectrograms into GCLM maps to train CNNs for music genre classification, and Costa et al. [17] performed better than the state-of-the-art on the LMD dataset by fusing canonical approaches, e.g., LMP-trained SVMs with CNNs. Only a few studies, however, have focused on making these processes that were designed for image classification more specific for sound image recognition. In their study, Sigtia and Dixon [18] focused on adjusting CNN parameters and structures and showed how using Rectified Linear Units (ReLu) instead of stochastic gradient descent with the Hessian Free optimization and sigmoid units reduced training time. Wang et al. [19] presented an innovative CNN, which they named a sparse coding CNN, for sound event recognition and retrieval, which, when evaluated under noisy and clean conditions, achieved competitive and sometimes better performance than the majority of other approaches. In Oramas [20], a hybrid approach was presented that combined diverse modalities (album cover images, reviews, and audio tracks) for multi-label music genre classification by applying deep learning techniques appropriate for each modality, an approach that outperformed the single-modality methods. Finally, it should be mentioned that many methods in machine learning are also proposed for the human voice classification task: emotion recognition [21], English accent classification, and gender classification [22], to name a few.
Because deep classifiers have produced a patent improvement in music classification, researchers have begun to apply deep learning approaches to other sound recognition tasks, such as biodiversity assessment. Precise sound recognition systems can be of crucial importance in assessing and handling environmental threats like animal species loss and climate changes affecting wildlife fauna [23]. Birds, for instance, have been acknowledged as an indicator species for ecological research, and their monitoring has become increasingly important for biodiversity preservation [23], especially considering the minimal impact video and audio acquisition has on ecosystems. To date, many datasets are available to develop classifiers to identify and monitor different species, such as birds [24,25], whales [26], frogs [24], bats [25], and cats [27]. For instance, both Cap et al. [28] and Salamon et al. [29] have investigated the fusion of CNNs with other methods to classify animals. The former study combined CNNs with handcrafted features to classify marine animals [30] using the Fish and MBARI benthic animal dataset [31], while the latter fused deep learning with shallow learning for bird species identification based on 5428 bird flight calls from 43 species. In both cases, the fusion of CNNs with other canonical techniques outperformed the single approaches.
Existing approaches for animal audio classification can roughly be classified into two categories: fingerprinting and CNN approaches. Fingerprinting [32] relies on the compact representation of audio traces so that each one can be efficiently matched against other audio clips to compare for similarity and dissimilarity [33]. A sample of audio fingerprinting by CNN is shown in [34], where the authors used a Siamese neural network to produce semantic representations of the audio traces. However, fingerprinting is useful only in finding an exact match; the problem addressed in this work involves audio classification. As already noted, CNN-based approaches [35,36] train networks for animal audio classification starting from an image representation of the audio signal. Unfortunately, CNNs require a large number of training examples to be effective (larger than available in most animal audio datasets) and cannot generalize to new classes without retraining the network. The objective of this work is to solve these issues by proposing an approach based on Dissimilarity Spaces. Recently, Agrawal [37] proposed an approach that learns a distance model by training a Siamese neural network directly on dissimilarity values for brain image classification, and in [38] an approach is proposed for online signature verification using a Siamese neural network and a contrastive loss function. In the latter work, the authors claim that the main advantage a Siamese network offers over a canonical CNN is the ability to generalize: the Siamese network approach they developed was shown to verify the authenticity of the signature of a new user without being trained on any examples from this user.
In this work, the dissimilarity space is created using a Siamese Neural Network (SNN) trained on the entire training set to define a distance function among the samples. The training phase for SNN is aimed at maximizing the distance between patterns of different classes; the testing phase of the SNN is used to compare two spectrograms to obtain a measure of their dissimilarity. In theory, all the training samples can be selected as centroids of the dissimilarity space. Dimensionality reduction is obtained by selecting a smaller number (k) of prototypes via a clustering approach. The dissimilarity space is the space where each spectogram is represented by a its distance to each centroid/prototype: in this space, the SNN is used to compare the spectrogram to every centroid, obtaining the spectrogram’s dissimilarity vector, which is the final descriptor. The classification task is performed by a support vector machine (SVM) trained using the dissimilarity descriptors generated from the training samples. The proposed system is evaluated on two different datasets for animal audio classification: domestic cat sounds [27] and bird sounds [23]. Results for the different clustering methods and different values of the hyperparameter (k) are reported.
In addition, an ensemble of SVMs trained on different dissimilarity spaces (by changing the value of k) are combined by sum rule, and its performance is compared with (i) some canonical CNN approaches and (ii) the fusion of the SVMs and the CNNs. Experiments demonstrate for the first time that the use of dissimilarity spaces based on SNN is a feasible representation for image data and can, when combined with a general purpose classifier, achieve high classification performance. Because the descriptors obtained in the dissimilarity space show high diversity with respect to the representations based on CNNs, their fusion can be exploited in an ensemble, as proven by the high classification accuracy obtained by the fusion of CNNs with our approach. The MATLAB code used in this study is freely available at https://github.com/LorisNanni.
2. Proposed Approach
The proposed method for spectrogram classification using dissimilarity space is based on several steps which are schematized in Figure 1. This figure is followed by the pseudo-code for each step (Algorithms 1 and 2). In order to define a similarity space, it is necessary to select a distance measure and a set of prototypes in the training phase. The distance measure is learned by means of a SNN trained to maximize the similarity between couples of spectrograms in the same class, while minimizing the similarity for couples in different classes. The set of prototypes are obtained as the k centroids of the clusters generated by a supervised clustering procedure. The final step represents each training sample x in the dissimilarity space by a feature vector , where each component is the distance between x and the prototype : . These feature vectors are used to train a SVM for the final classification task. In the testing phase, each unlabeled spectrogram is first represented in the dissimilarity space by calculating its distance to all the prototypes, then the resulting feature vector is classified by SVM.
| Algorithm 1 Training phase |
|
| Algorithm 2 Testing phase |
|
Each of the main functions used in the pseudo-code are described below.
2.1. Siamese Neural Network Training
The SNN, described in more detail in Section 3, is trained to compare a pair of spectrograms by returning a measure of their similarity. Algorithm 3 presents the pseudocode for this phase and corresponds with step 1 of Algorithm 1. The SNN architecture is defined in steps 2 and 3 of algorithm Algorithm 3. Steps 5–8 are repeated for each training iteration. Step 5 extracts randomly spectrograms pairs from the training set using the function getSiameseBatch. Step 6 feeds the pairs to the network and computes loss and gradients for gradient descent. Steps 7 and 8 use the gradients and loss to update the weights of the fully connected layer and the twin subnetworks.
| Algorithm 3 Siamese training pseudocode |
|
Note: in the case where the SNN fails to converge on the training set, training is rerun.
2.2. Prototype Selection
In this phase, k prototypes are extracted from the training set. In theory, every spectrogram in the training set could be selected as a prototype, but this would be too resource expensive and the dimensionality of the generated dissimilarity vectors would be too high. A better alternative is to employ clustering techniques to compute k centroids for each class. Clustering would significantly reduce the dimension of the resulting dissimilarity space and thus make the process more viable. Algorithm 4 presents the pseudo code for prototype selection, which provides a selection from among four clustering procedures, which are used separately to cluster the training samples belonging to each class.
| Algorithm 4 Clustering pseudocode |
|
2.3. Projection in the Dissimilarity Space
Existent classification methods learn to classify patterns using their feature space. In this work, patterns are represented in a dissimilarity space in which every pattern x is represented by its similarity to a selected set of prototypes by a dissimilarity vector:
where the similarity among pattern is obtained using a trained SNN. In order to project each image in the Dissimilarity space , Algorithm 5 compares each input image (stored in X in step 3) with the k centroids (stored in P) using the trained SNN with the predictSiamese function (step 4). The resulting feature space F includes the projected features of all the input images.
| Algorithm 5 Projection in the Dissimilarity space pseudocode |
|
2.4. Support Vector Machine Training and Prediction
A Support Vector Machine (SVM) is a supervised learning model witch can be used to perform classification or regression. An SVM model represents each training example as a data point in space and is trained to construct one or more hyperplanes that divide the space in two, separating data points belonging to different classes (function trainSVM). The model will predict (function predictSVM) the class of a new pattern mapped in the space according to the side of the hyperplane the data point falls into. The hyperplane found by an SVM is defined as follows:
where is the hyperplane, x is the data point vector, w is the hyperplane’s normal vector, and the ratio is the hyperplane’s distance from the origin. The optimal hyperplane is the one that maximizes the distance to the nearest data point of any class, defined as , which is also called the margin. The i-th point will be assigned to the first class when and to the second class when . The points that lie on the margin line, defined by the equation , completely describe the solution to the problem and are called support vectors. An example of an optimal hyperplane with highlighted support vectors is shown in Figure 2.
Because SVMs use hyperplanes to discriminate data, they do not work well with data that is not linearly separable in its original space. This problem can be solved using kernel functions, which map data into a much higher dimensional space, presumably to make the separation easier in that space. To keep the computational complexity to an acceptable level, the kernel function of choice has to be computationally efficient.
Being binary classifiers, SVMs can only determine the separation surface between two classes of data; however, it is possible to apply SVMs to multi-label problems by training an ensemble of SVMs and combining them. In this work, the One-Against-All approach is used, where for each class an SVM is trained to discriminate between a given class and all the other classes put together. The pattern is then assigned to the class that gives the higher confidence score.
3. Siamese Neural Network
The Siamese Neural Network (SNN) is a class of neural network architectures that contains two or more twins, i.e., sub-networks with the same parameters and weights. SNNs are used in tasks involving similarity or in identifying correlations between different entities. SNN was first proposed by Bromley et al. [39] for performing signature verification. SNNs have since been used successfully in other application domains, such as face verification [40], image recognition [41], human fall detection [42], content-based audio representation [34], and sound search by vocal imitation [43]. The SNN architecture used in this work is similar to the one used in [43] and is represented in (Figure 3).
As shown in Figure 3, the SNN used in this work is composed of five blocks:
- Two identical twin subnetworksThe twin subnetworks in our SNN are two Convolutional Neural Networks composed of 13 layers, as listed in Table 1.These subnetworks learn the features best representing the spectrograms in the input ( and ), returning a 4096-dimensional feature vector for each ( and ). The subnetworks share parameters and weights which are mirrored during the training.
- Subtract blockThe output vectors of the subnetworks are subtracted, resulting in a feature vector Y representing the features in which the images differ:
- Fully Connected LayerAs in [37], the Fully Connected Layer (FCL) learns the distance model to calculate the dissimilarity. The output vector of the subtract block is fed to the FCL which returns a dissimilarity value for the pair of spectrograms in the input.
- SigmoidThe sigmoid function is a class of mathematical real functions having a characteristic S-shaped curve. We apply the sigmoid to the dissimilarity value returned by the FCL to convert it to a probability value in the range [0, 1], using the standard logistic function:
- Binary Cross EntropyThe Binary Cross Entropy (BCE) is a popular loss function, which, given the prediction of the model and the correct observation label (in our case, 1 if the two spectrograms belong to the same class, 0 otherwise) returns a measure of the performance of the model. Loss functions are used by learning algorithms to train the network by adjusting the weights. BCE is applied to the probability obtained from the sigmoid and computes the gradients of the loss function with respect to the weights of the network in order to adjust them. In a two-class problem, BCE can be calculated as:where y is the binary value that indicates whether the class label c is correct for the observation o, p is the predicted probability that observation o is of class c, and log is the natural logarithm.
4. Clustering
Clustering is the task of organizing data in groups (Figure 4) so that patterns in the same cluster are more similar to each other than they are to patterns belonging to other clusters. Clustering is often used to find natural clusters in unlabeled data. Some clustering techniques calculate centroids during the process. A centroid is the mean vector of all the patterns in a cluster. Because it is a mean vector, it contains the most characterizing features of a cluster’s patterns. Centroids are computed to reduce the dissimilarity space size without losing too much information. The greater the number of centroids used for each class, the more information that is retained. In this work, samples are divided into classes before clustering, and the clustering procedure is applied to each class separately. The remainder of this section describes the four clustering techniques used in this study.
4.1. K-Means
K-means is a popular clustering algorithm that partitions a set of patterns into k clusters by assigning each observation to the cluster with the nearest centroid, or mean vector. There are several versions of this algorithm. In this study, the default implementation (with the Euclidean distance metric) in the MATLAB Statistics and Machine Learning Toolbox was applied. The standard k-means algorithm cycles through the following steps:
- Choose k initial cluster centers (centroids) according to the k-means++ variation detailed below.
- Compute point-to-cluster-centroid distances of all observations to each centroid.
- Assign each observation to the cluster with the closest centroid.
- Compute the average of the observations in each cluster to obtain k new centroids.
- Repeat steps 2 through 4 until cluster assignments no longer change (i.e., until the algorithm converges) or until the maximum number of iterations is reached.
The k-means++ variation [44] employs a heuristic to find the initial centroids:
- Choose one center uniformly at random from among the data points.
- For each data point x, compute , the distance between x and the nearest center that has already been chosen.
- Choose one new data point at random as a new center, using a weighted probability distribution where a point x is chosen with probability proportional to .
- Repeat Steps 2 and 3 until k centers have been chosen.
4.2. K-Medoids
K-medoids is a clustering technique very similar to k-means. It partitions a set of observations into k clusters by minimizing the sum of distances between a pattern and the center of that pattern’s cluster. The main difference between k-means and k-medoids is that, in the first case, the center of a cluster is its centroid, or mean, whereas, in the latter case, the center is a member, or medoid, of the cluster. A medoid is an observation in a cluster whose sum of distances from the other observations within the cluster is minimal. The basic algorithm for K-medoids loops through the following three steps:
- Build-step: each k cluster is associated with a potential medoid. The first assignment can be performed in various ways; the standard MATLAB’s implementations uses the k-means++ heuristic.
- Swap-step: within each cluster, each point is tested as a potential medoid by checking whether the sum of the within-cluster distances gets smaller using that particular point as the medoid. If so, the point is defined as a new medoid. Every point is then assigned to the cluster with the closest medoid.
- Repeat steps 1–4 until medoids no longer swap (i.e., until the algorithm converges) or until the maximum number of iterations is reached.
4.3. Hierarchical
Hierarchical clustering is a clustering technique that groups data by building a hierarchy of clusters. The hierarchy tree that is obtained is divided into n levels chosen for the application at hand. There are two main categories of hierarchical clustering:
- Agglomerative: each pattern starts in its own cluster; then, moving up the hierarchy, each cluster in one level is obtained by merging two clusters in the previous level.
- Divisive: all patterns start in one cluster; then, by moving down the hierarchy, each pair of clusters is obtained by splitting a single cluster in the previous level.
In this work, the default MATLAB implementation of hierarchical clustering is used, which is the agglomerative type. The MATLAB algorithm loops through the following three steps:
- Find the similarity or dissimilarity between every pair of objects in the dataset using a distance metric.
- Group the objects into a binary hierarchical cluster tree by linking objects in pairs based on their distance. As objects are paired into binary clusters, the newly formed clusters are grouped into larger clusters until a hierarchical tree is formed.
- Determine where to cut the hierarchical tree into clusters. Here, MATLAB’s function is used to prune branches off the bottom of the hierarchical tree and to assign all the objects below each cut to a single cluster. In this way, k clusters are obtained.
After applying this algorithm, centroids, as the mean vectors of each cluster, are computed.
4.4. Spectral
The spectral clustering technique splits data into groups using the data’s undirected similarity graph represented by a similarity matrix (also called an adjacency matrix). In the similarity graph, every·node is an observation, and two nodes are connected by an edge if their similarity is larger then a certain threshold, which is often 0. The algorithm uses four mathematical expressions:
- Similarity Matrix: a square symmetrical matrix that represents the similarity graph. Letting M be the similarity matrix, each cell value is the similarity value of two connected nodes in the graph, which, in turn, represent the spectrogram pairs .
- Degree Matrix: a diagonal matrix obtained by summing the similarity matrix rows. The degree matrix is defined by the equationwhere is the degree matrix, and is a value of the similarity matrix.
- Laplacian Matrix: another way of representing the similarity graph that is defined as
Here are the steps required by the spectral algorithm:
- For each spectrogram in the dataset, define a local neighborhood. There are different ways such a neighborhood can be defined. The MATLAB implementation defaults to the nearest-neighbor method. Once the neighborhood is defined, compute the pairwise similarities of each spectrogram in the neighborhood using some distance metric.
- Calculate the Laplacian matrix L.
- Create a matrix V containing columns , where the columns are the k eigenvectors that correspond to the k smallest eigenvalues of the Laplacian matrix. The eigenvalues of the matrix are also called spectrum, hence the algorithm’s name.
- Treating each row of V as a pattern, perform k-means clustering or k-medoids clustering.
- Assign the original spectrograms in the dataset to the same clusters as their corresponding rows in V.
5. Experimental Results
The approach proposed in this paper is tested, along with some comparison canonical approaches, using a stratified ten-fold cross validation protocol and the classification accuracy as the performance indicator. Tests were performed on two datasets:
- BIRDZ, which was also used as a control and as a real-world audio dataset in [23]. The real-world tracks were obtained from the Xeno-canto Archive (http://www.xeno-canto.org/) and cover 11 widespread North American bird species. Thus, the dataset contains 11 classes: (1) Blue Jay, (2) Song Sparrow, (3) Marsh Wren, (4) Common Yellowthroat, (5) Chipping Sparrow, (6) American Yellow Warbler, (7) Great Blue Heron, (8) American Crow, (9) Cedar Waxwing, (10) House Finch, and (11) Indigo Bunting. BIRDZ is composed of five types of spectrograms: constant frequency, frequency modulated whistles, broadband pulses, broadband with varying frequency components, and strong harmonics, for a total of 2762 bird acoustic events with 339 detected “unknown” events corresponding to noise and other unknown species vocalizations. Including the “unknown class”, BIRDZ has 3101 samples for 12 classes.
- CAT, which was first presented in [27,45]. This dataset is composed of 10 balanced classes with about 300 samples per class: (1) Resting, (2) Warning, (3) Angry, (4) Defence, (5) Fighting, (6)·Happy, (7) Hunting mind, (8) Mating, (9) Mother call, and (10) Paining. The samples have an average duration of about 4s and were collected by the author from different sources: Kaggle, Youtube and Flickr. CAT has a total of 2962 samples.
In Table 2 and Table 3, the performance of the four tested clustering algorithms is reported using different values of (i.e., the number of clusters per class). As a baseline for comparison, the classification accuracy is also reported for the following well-known CNN models, each fine-tuned on the problem (for 30 epochs, using a batch size of 30, and a learning rate of 0.0001, no freezing):
- GoogleNetP365, a GoogleNet model pretrained on Places365 [49].
Moreover, in Table 2 and Table 3, the accuracy obtained by the following fusion approaches are reported:
- KAll, fusion by sum rule of the four SVMs trained using the dissimilarity space built with all tested values for = 15, 30, 45, 60;
- ALL, fusion by average rule of the four approaches KAll (one for each clustering method);
- eCNN, fusion by sum rule of the four CNNs;
- ALL+eCNN, fusion by sum rule between ALL and eCNN;
- ALL+GoogleNet, fusion by sum rule between ALL and GoogleNet;
- ALL+GoogleNetP365, fusion by sum rule between ALL and GoogleNetP365.
- KAll outperforms each stand alone method based on a single value of ;
- ALL outperforms each KAll in both datasets;
- Performance of ALL is similar to that obtained by GoogleNet;
- The ensemble ALL based on our dissimilarity space is a feasible representation for spectograms and achieves a performance that is comparable to the CNNs.
- In both datasets, the best performance is obtained by ALL+eCNN, (even though the improvement with respect to eCNN is negligible).
- ALL+GoogleNet strongly outperforms ALL and Googlenet; this light ensemble, which uses only one CNN, is our recommended method.
The proposed approach based on the representation of animal sound in a dissimilarity space has two main advantages: (1) it produces a compact representation on the signal (ranging from 15 to 60, depending on the number of clusters for the single space, to 150 for the KAll ensemble); (2) it generates a high diversity of classification results with respect to the baseline CNNs, which can be exploited to improve the performance in an ensemble method (i.e., ALL+GoogleNet).
In Table 4, the ensembles proposed in this work are shown to achieve a performance on the two datasets that is similar to some of the state-of-the-art approaches reported in the literature. Two results are taken from [27], and are labeled [27] and [27]-.
Unfortunately, most published papers in the field of acoustic animal classification focus only on a single dataset. The authors of this paper are aware that evaluating the proposed approach on two different datasets instead of focusing on just one limits the strength of the conclusions drawn. Be that as it may, the experiments reported here prove the robustness of the proposed approach, which obtains good classification accuracy on two different problems without any ad-hoc parameter optimization and according to a clear and unambiguous testing protocol. As a result, the performances reported in this paper can be used for baseline comparisons with other audio classification methods developed in the future.
6. Conclusions
In this work, a method using dissimilarity space is presented that achieves competitive results in automated audio classification of animal sounds (bird and cat sounds). Different types of clustering techniques to obtain centroids for dissimilarity space generation were tested and compared. A set of SVMs was trained on the dissimilarity spaces generated using four clustering techniques and different numbers of centroids. These SVMs were then combined by sum rule to obtain a high performing ensemble.
Moreover, it is shown that the method presented here can be fused with other state-of-the-art approaches to improve classification accuracy. The proposed ensemble of SVMs was fused with other state-of-the-art approaches. The fusions improved performance on the two audio classification problems and were shown to outperform the standalone approaches.
In the future, this study will be further developed by including other sound classification problems, e.g., those cited in [26,37], in order to obtain a more comprehensive validation of the proposed approach. The plan is also to test the proposed method on some image classification problems using additional supervised and unsupervised clustering techniques.
Author Contributions
L.N. conceived of the presented idea., A.R. carried out the implementation. L.N., A.L. performed the experiments. A.L. and S.B. wrote the manuscript with input from all authors. S.B. provided some resources. All authors have read and agreed to the published version of the manuscript.
Funding
This research received no external funding.
Acknowledgments
The authors thank NVIDIA Corporation for supporting this work by donating a Titan Xp GPU.
Conflicts of Interest
The authors declare no conflict of interest.
References
- Padmanabhan, J.; Premkumar, M.J.J. Machine learning in automatic speech recognition: A survey. IETE Tech. Rev. 2015, 32, 240–251. [Google Scholar] [CrossRef]
- Nanni, L.; Costa, Y.M.G.; Lucio, D.R.; Silla, C.N., Jr.; Brahnam, S. Combining visual and acoustic features for audio classification tasks. Pattern Recognit. Lett. 2017, 88, 49–56. [Google Scholar] [CrossRef]
- Sahoo, S.K.; Choubisa, T.; Prasanna, S.R.M. Multimodal biometric person authentication: A review. IETE Tech. Rev. 2012, 29, 54–75. [Google Scholar] [CrossRef]
- Lidy, T.; Rauber, A. Evaluation of Feature Extractors and Psycho-Acoustic Transformations for Music Genre Classification; ISMIR: Washington, DC, USA, 2005; pp. 34–41. [Google Scholar]
- Wyse, L. Audio spectrogram representations for processing with convolutional neural networks. arXiv 2017, arXiv:1706.09559. [Google Scholar]
- Rubin, J.; Abreu, R.; Ganguli, A.; Nelaturi, S.; Matei, I.; Sricharan, K. Classifying heart sound recordings using deep convolutional neural networks and mel-frequency cepstral coefficients. In Proceedings of the 2016 Computing in Cardiology Conference, Vancouver, BC, Canada, 11–14 September 2016; pp. 813–816. [Google Scholar]
- Nanni, L.; Costa, Y.; Brahnam, S. Set of Texture Descriptors for Music Genre Classification. In WSCG 2014: Communication Papers Proceedings: 22nd WSCG International Conference on Computer Graphics, Visualization and Computer Vision; UNION Agency: Plzen, Czech Republic, 2014. [Google Scholar]
- Costa, Y.M.G.; Oliveira, L.S.; Koerich, A.L.; Gouyon, F.; Martins, J.G. Music genre classification using LBP textural features. Signal Process. 2012, 92, 2723–2737. [Google Scholar] [CrossRef] [Green Version]
- YCosta, M.G.; Oliveira, L.S.; Koericb, A.L.; Gouyon, F. Music genre recognition using spectrograms. In Proceedings of the 18th International Conference on Systems, Signals and Image Processing, Sarajevo, Bosnia-Herzegovina, 16–18 June 2011; pp. 1–4. [Google Scholar]
- Haralick, R.M. Statistical and structural approaches to texture. Proc. IEEE 1979, 67, 786–804. [Google Scholar] [CrossRef]
- Ojala, T.; Pietikainen, M.; Maenpaa, T. Multiresolution gray-scale and rotation invariant texture classification with local binary patterns. IEEE Trans. Pattern Anal. Mach. Intell. 2002, 24, 971–987. [Google Scholar] [CrossRef]
- Costa, Y.; Oliveira, L.; Koerich, A.; Gouyon, F. Music genre recognition using gabor filters and lpq texture descriptors. In Iberoamerican Congress on Pattern Recognition; Springer: Berlin/Heidelberg, Germany, 2013; pp. 67–74. [Google Scholar]
- Ojansivu, V.; Heikkilä, J. Blur insensitive texture classification using local phase quantization. In Lecture Notes in Computer Science (Including Subser. Lect. Notes Artif. Intell. Lect. Notes Bioinformatics); Springer: Berlin, Germany, 2008; pp. 236–243. [Google Scholar] [CrossRef] [Green Version]
- Humphrey, E.J.; Bello, J.P. Rethinking automatic chord recognition with convolutional neural networks. In Proceedings of the 11th International Conference on Machine Learning and Applications, Boca Raton, FL, USA, 12–15 December 2012; pp. 357–362. [Google Scholar]
- Humphrey, E.J.; Bello, J.P.; LeCun, Y. Moving beyond feature design: Deep architectures and automatic feature learning in music informatics. In Proceedings of the 13th International Society for Music Information Retrieval Conference ISMIR, Porto, Portugal, 8–12 October 2012; pp. 403–408. [Google Scholar]
- Nakashika, T.; Garcia, C.; Takiguchi, T. Local-feature-map integration using convolutional neural networks for music genre classification. In Proceedings of the Thirteenth Annual Conference of the International Speech Communication Association, Portland, OR, USA, 9–13 September 2012. [Google Scholar]
- Costa, Y.M.G.; Oliveira, L.S.; Silla, C.N., Jr. An evaluation of convolutional neural networks for music classification using spectrograms. Appl. Soft Comput. 2017, 52, 28–38. [Google Scholar] [CrossRef]
- Sigtia, S.; Dixon, S. Improved music feature learning with deep neural networks. In Proceedings of the 2014 IEEE International Conference on Acoustics, Speech and Signal Processing, Florence, Italy, 4–9 May 2014; pp. 6959–6963. [Google Scholar]
- Wang, C.-Y.; Santoso, A.; Mathulaprangsan, S.; Chiang, C.-C.; Wu, C.-H.; Wang, J.-C. Recognition and retrieval of sound events using sparse coding convolutional neural network. In Proceedings of the 2017 IEEE International Conference on Multimedia and Expo, Hong Kong, China, 10–14 July 2017; pp. 589–594. [Google Scholar]
- Oramas, S.; Nieto, O.; Barbieri, F.; Serra, X. Multi-label music genre classification from audio, text, and images using deep features. arXiv 2017, arXiv:1707.04916. [Google Scholar]
- Badshah, A.M.; Ahmad, J.; Rahim, N.; Baik, S.W. Speech Emotion Recognition from Spectrograms with Deep Convolutional Neural Network. In Proceedings of the 2017 International Conference on Platform Technology and Service (PlatCon), Busan, Korea, 13–15 February 2017; pp. 1–5. [Google Scholar]
- Zeng, Y.; Mao, H.; Peng, D.; Yi, Z. Spectrogram based multi-task audio classification. Multimed. Tools Appl. 2019, 78, 3705–3722. [Google Scholar] [CrossRef]
- Zhao, Z.; Zhang, S.; Xu, Z.; Bellisario, K.; Dai, N.; Omrani, H.; Pijanowski, B.C. Automated bird acoustic event detection and robust species classification. Ecol. Inform. 2017, 39, 99–108. [Google Scholar] [CrossRef]
- Acevedo, M.A.; Corrada-Bravo, C.J.; Corrada-Bravo, H.; Villanueva-Rivera, L.J.; Aide, T.M. Automated classification of bird and amphibian calls using machine learning: A comparison of methods. Ecol. Inform. 2009, 4, 206–214. [Google Scholar] [CrossRef]
- Cullinan, V.I.; Matzner, S.; Duberstein, C.A. Classification of birds and bats using flight tracks. Ecol. Inform. 2015, 27, 55–63. [Google Scholar] [CrossRef] [Green Version]
- Fristrup, K.M.; Watkins, W.A. Marine Animal Sound Classification; No. WHOI-94-13; Woods Hole Oceanographic Institution: Falmouth, MA, USA, 1993. [Google Scholar]
- Pandeya, Y.; Kim, D.; Lee, J. Domestic Cat Sound Classification Using Learned Features from Deep Neural Nets. Appl. Sci. 2018, 8, 1949. [Google Scholar] [CrossRef] [Green Version]
- Cao, Z.; Principe, J.C.; Ouyang, B.; Dalgleish, F.; Vuorenkoski, A. Marine animal classification using combined CNN and hand-designed image features. In Proceedings of the Oceans 2015-MTS/IEEE Washington, Washington, DC, USA, 19–22 October 2015; pp. 1–6. [Google Scholar]
- Salamon, J.; Bello, J.P.; Farnsworth, A.; Kelling, S. Fusing shallow and deep learning for bioacoustic bird species classification. In Proceedings of the 2017 IEEE International Conference on Acoustics, Speech and Signal Processing, New Orleans, LA, USA, 5–9 March 2017; pp. 141–145. [Google Scholar]
- Nanni, L.; Brahnam, S.; Lumini, A.; Barrier, T. Ensemble of local phase quantization variants with ternary encoding. In Local Binary Patterns: New Variants and Applications; Springer: Berlin/Heidelberg, Germany, 2014. [Google Scholar] [CrossRef]
- Edgington, D.R.; Cline, D.E.; Davis, D.; Kerkez, I.; Mariette, J. Detecting, tracking and classifying animals in underwater video. In Proceedings of the Oceans 2006, Boston, MA, USA, 18–21 September 2006; pp. 1–5. [Google Scholar]
- Wang, A. An Industrial Strength Audio Search Algorithm; ISMIR: Washington, DC, USA, 2003; Volume 2003, pp. 7–13. [Google Scholar]
- Haitsma, J.; Kalker, T. A Highly Robust Audio Fingerprinting System; ISMIR: Washington, DC, USA, 2002; Volume 2002, pp. 107–115. [Google Scholar]
- Manocha, P.; Badlani, R.; Kumar, A.; Shah, A.; Elizalde, B.; Raj, B. Content-based Representations of audio using Siamese neural networks. In Proceedings of the 2018 IEEE International Conference on Acoustics, Speech and Signal Processing (ICASSP), Calgary, AB, Canada, 15–20 April 2018; IEEE: Piscataway, NJ, USA, 2018; pp. 3136–3140. [Google Scholar]
- Şaşmaz, E.; Tek, F.B. Animal Sound Classification Using A Convolutional Neural Network. In Proceedings of the 2018 3rd International Conference on Computer Science and Engineering (UBMK), Sarajevo, Bosnia-Herzegovina, 20–23 September 2018; pp. 625–629. [Google Scholar]
- Oikarinen, T.; Srinivasan, K.; Meisner, O.; Hyman, J.B.; Parmar, S.; Fanucci-Kiss, A.; Desimone, R.; Landman, R.; Feng, G. Deep convolutional network for animal sound classification and source attribution using dual audio recordings. J. Acoust. Soc. Am. 2019, 145, 654–662. [Google Scholar] [CrossRef] [PubMed]
- Agrawal, A. Dissimilarity learning via Siamese network predicts brain imaging data. arXiv 2019, arXiv:1907.02591. [Google Scholar]
- Sekhar, C.; Mukherjee, P.; Guru, D.S.; Pulabaigari, V. OSVNet: Convolutional Siamese Network for Writer Independent Online Signature Verification. In Proceedings of the International Conference on Document Analysis and Recognition (ICDAR), Sydney, Australia, 20–25 September 2019. [Google Scholar] [CrossRef] [Green Version]
- Bromley, J.; Guyon, I.; LeCun, Y.; Säckinger, E.; Shah, R. Signature verification using a “siamese” time delay neural network. Adv. Neural Inf. Process. Syst. 1994, 7, 737–744. [Google Scholar]
- Chopra, S.; Hadsell, R.; LeCun, Y. Learning a similarity metric discriminatively, with application to face verification. In Proceedings of the Computer Vision and Pattern Recognition (CVPR), San Diego, CA, USA, 20–25 June 2005; pp. 539–546. [Google Scholar]
- Koch, G.; Zemel, R.; Salakhutdinov, R. Siamese neural networks for one-shot image recognition. In Proceedings of the 32nd International Conference on Machine Learning (ICML), Lille, France, 6–11 July 2015. [Google Scholar]
- Droghini, D.; Vesperini, F.; Principi, E.; Squartini, S.; Piazza, F. Few-shot siamese neural networks employing audio features for human-fall detection. In Proceedings of the International Conference on Pattern Recognition and Artificial Intelligence (PRAI 2018). Association for Computing Machinery, New York, NY, USA, 15–17 August 2018; pp. 63–69. [Google Scholar]
- Zhang, Y.; Pardo, B.; Duan, Z. Siamese style convolutional neural networks for sound search by vocal imitation. IEEE/ACM Trans. Audio, Speech, Lang. Process. 2018, 27, 429–441. [Google Scholar] [CrossRef]
- David, A.; Vassilvitskii, S. K-means++: The Advantages of Careful Seeding. In Proceedings of the Eighteenth Annual ACM-SIAM Symposium on Discrete Algorithms, New Orleans, LA, USA, 7–9 January 2007; pp. 1027–1035. [Google Scholar]
- Pandeya, Y.R.; Lee, J. Domestic cat sound classification using transfer learning. Int. J. Fuzzy Log. Intell. Syst. 2018, 18, 154–160. [Google Scholar] [CrossRef] [Green Version]
- Szegedy, C.; Liu, W.; Jia, Y.; Sermanet, P.; Reed, S.; Anguelov, D.; Rabinovich, A. Going deeper with convolutions. In Proceedings of the IEEE Conference on Computer Vision and Pattern Recognition, Boston, MA, USA, 7–12 June 2015; pp. 1–9. [Google Scholar]
- Simonyan, K.; Zisserman, A. Very deep convolutional networks for large-scale image recognition. arXiv 2014, arXiv:1409.1556. [Google Scholar]
- Deng, J.; Dong, W.; Socher, R.; Li, L.J.; Li, K.; Fei-Fei, L. Imagenet: A large-scale hierarchical image database. In Proceedings of the 2009 IEEE conference on computer vision and pattern recognition, Miami, FL, USA, 20–25 June 2009; pp. 248–255. [Google Scholar]
- Zhou, B.; Lapedriza, A.; Xiao, J.; Torralba, A.; Oliva, A. Learning deep features for scene recognition using places database. In Proceedings of the 27th International Conference on Neural Information Processing Systems (NIPS’14) 2014; MIT Press: Cambridge, MA, USA, 2014; Volume 1, pp. 487–495. [Google Scholar]
- Nanni, L.; Costa, Y.M.G.; Lumini, A.; Kim, M.Y.; Baek, S.R. Combining visual and acoustic features for music genre classification. Expert Syst. Appl. 2016, 45, 108–117. [Google Scholar] [CrossRef]
- Zhang, S.; Zhao, Z.; Xu, Z.; Bellisario, K.; Pijanowski, B.C. Automatic Bird Vocalization Identification Based on Fusion of Spectral Pattern and Texture Features. In Proceedings of the 2018 IEEE International Conference on Acoustics, Speech and Signal Processing, Calgary, AB, Canada, 15–20 April 2018; pp. 271–275. [Google Scholar]
Figure 1.
Proposed approach scheme.
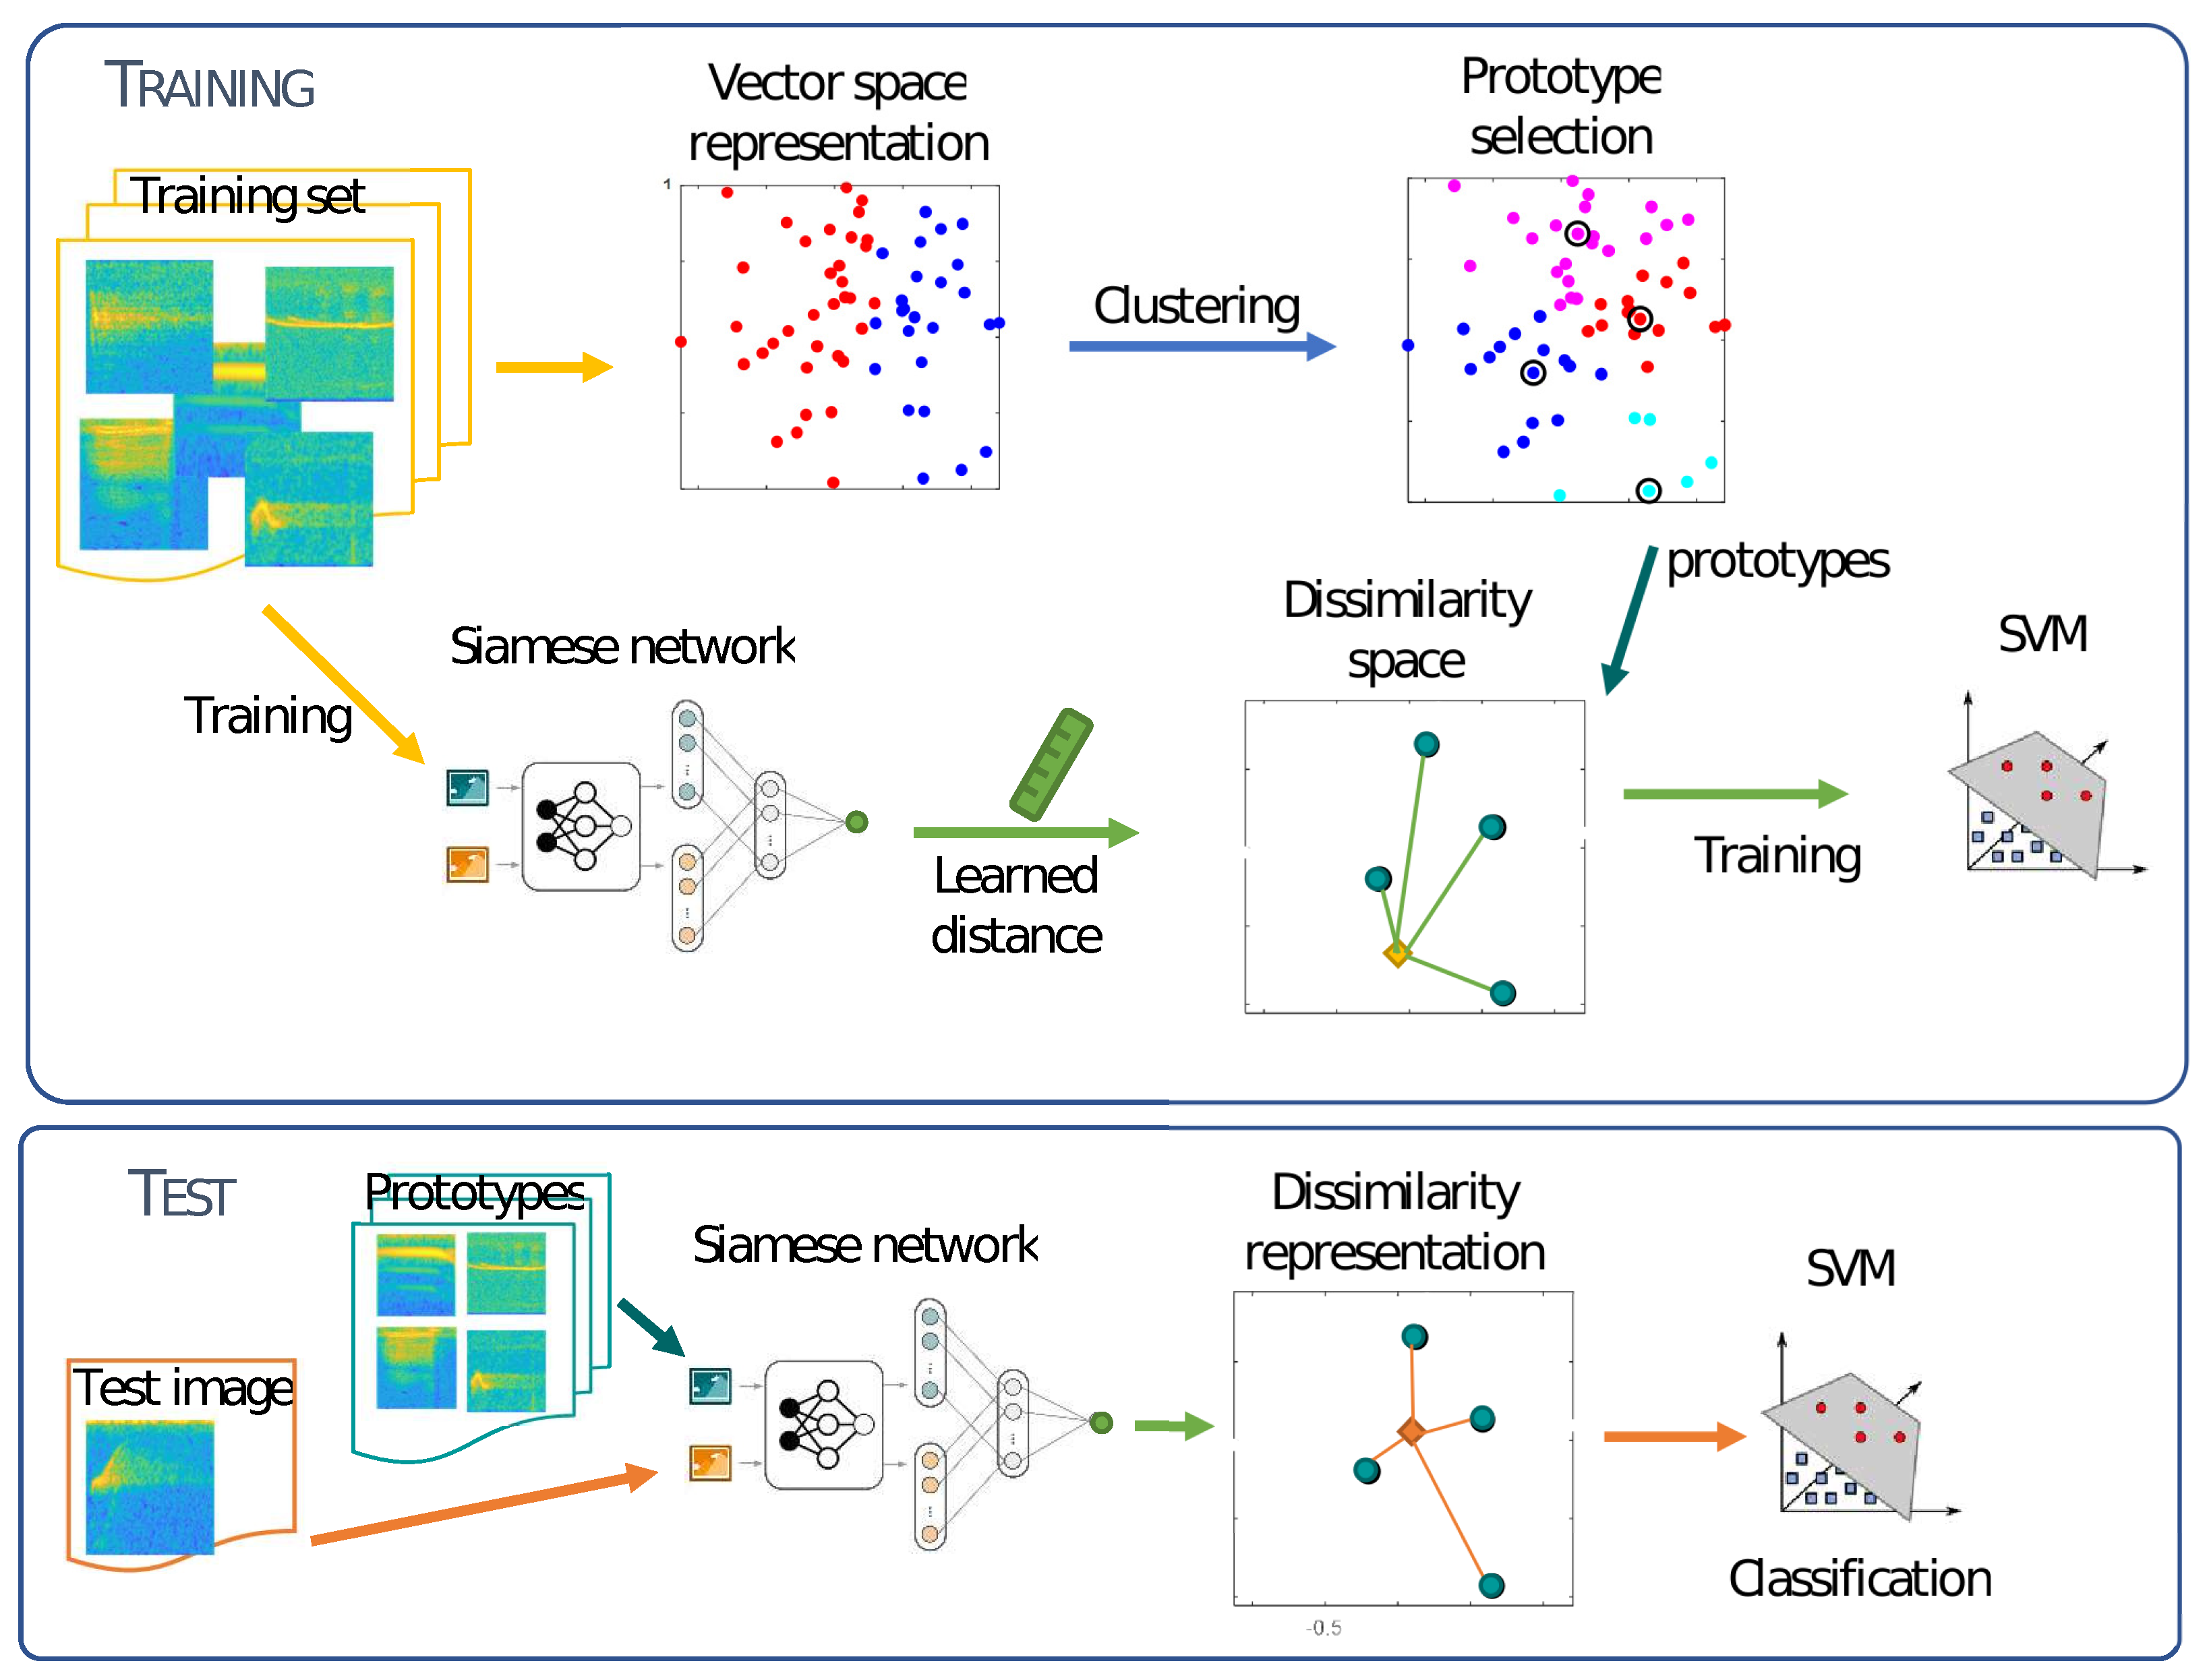
Figure 2.
SVM’s hyperplane.

Figure 3.
Siamese Neural Network architecture.

Figure 4.
A sample of clusters found from unlabeled data: on the left the original 2D data, on the right clustered data, where different colors denote different clusters.
Figure 4.
A sample of clusters found from unlabeled data: on the left the original 2D data, on the right clustered data, where different colors denote different clusters.


Table 1.
Siamese subnetworks layers.
| # | Layer | Filer Size | Number of Filters |
|---|---|---|---|
| 1 | Input Layer | 224 × 224 images | |
| 2 | 2D Convolution | 10 × 10 | 64 |
| 3 | ReLU | ||
| 4 | Max Pooling | 2 × 2 | |
| 5 | 2D Convolution | 7 × 7 | 128 |
| 6 | ReLU | ||
| 7 | Max Pooling | 2 × 2 | |
| 8 | 2D Convolution | 4 × 4 | 128 |
| 9 | ReLU | ||
| 10 | Max Pooling | 2 × 2 | |
| 11 | 2D Convolution | 5 × 5 | 64 |
| 12 | ReLU | ||
| 13 | Fully Connected | Returns a 4096-dimensional vector |
Table 2.
Classification accuracy on the BIRDZ dataset.
| BIRDZ | k-Means | K-Medoids | Hierarchical | Spectral |
|---|---|---|---|---|
| = 15 | 91.85 | 92.06 | 91.85 | 92.09 |
| = 30 | 91.81 | 92.05 | 91.94 | 92.05 |
| = 45 | 92.03 | 91.69 | 91.90 | 92.24 |
| = 60 | 91.61 | 91.77 | 91.39 | 91.79 |
| KAll | 92.71 | 92.59 | 92.63 | 92.95 |
| ALL | 92.97 | |||
| GoogleNet | 92.41 | |||
| VGG16 | 95.30 | |||
| VGG19 | 95.19 | |||
| GoogleNetP365 | 92.94 | |||
| eCNN | 95.81 | |||
| ALL+eCNN | 95.95 | |||
| ALL+GoogleNet | 95.64 | |||
| ALL+GoogleNetP365 | 94.74 | |||
Table 3.
Classification accuracy on the CAT dataset.
| CAT | k-Means | K-Medoids | Hierarchical | Spectral |
|---|---|---|---|---|
| = 15 | 65.83 | 78.75 | 75.12 | 65.69 |
| = 30 | 56.88 | 78.47 | 77.66 | 71.29 |
| = 45 | 72.81 | 72.31 | 66.34 | 67.36 |
| = 60 | 80.37 | 78.54 | 80.37 | 73.73 |
| KAll | 80.61 | 81.59 | 81.29 | 81.69 |
| ALL | 82.41 | |||
| GoogleNet | 82.98 | |||
| VGG16 | 84.07 | |||
| VGG19 | 83.05 | |||
| GoogleNetP365 | 85.15 | |||
| eCNN | 87.36 | |||
| ALL+eCNN | 87.76 | |||
| ALL+GoogleNet | 85.02 | |||
| ALL+GoogleNetP365 | 87.49 | |||
Table 4.
Literature results.
| Descriptor | BIRDZ | CAT |
|---|---|---|
| [50] | 96.3 | — |
| [2] | 95.1 | — |
| [23] | 93.6 | — |
| [45] | — | 87.7 |
| [27] | — | 91.1 |
| [27] | — | 90.8 |
| [51] | 96.7 * | — |
* Note that the results in [51] are based on a feature selection approach where the number of selected features is the hyperparameters selected on that dataset; the approach presented here has no hyperparameters selected on a given dataset.
© 2020 by the authors. Licensee MDPI, Basel, Switzerland. This article is an open access article distributed under the terms and conditions of the Creative Commons Attribution (CC BY) license (http://creativecommons.org/licenses/by/4.0/).
Share and Cite
MDPI and ACS Style
Nanni, L.; Rigo, A.; Lumini, A.; Brahnam, S. Spectrogram Classification Using Dissimilarity Space. Appl. Sci. 2020, 10, 4176. https://doi.org/10.3390/app10124176
AMA Style
Nanni L, Rigo A, Lumini A, Brahnam S. Spectrogram Classification Using Dissimilarity Space. Applied Sciences. 2020; 10(12):4176. https://doi.org/10.3390/app10124176
Chicago/Turabian StyleNanni, Loris, Andrea Rigo, Alessandra Lumini, and Sheryl Brahnam. 2020. "Spectrogram Classification Using Dissimilarity Space" Applied Sciences 10, no. 12: 4176. https://doi.org/10.3390/app10124176
Note that from the first issue of 2016, this journal uses article numbers instead of page numbers. See further details here.