Article

Digital Volume Correlation Applied to X-ray Micro-Tomography Images in Uniaxial Creep Tests on Anisotropic Clayey Rock

1
LaMcube—Laboratoire de Mécanique Multiphysique et Multiéchelle, Univ. Lille, CNRS, Centrale Lille, UMR9013, F-59000 Lille, France
2
Andra, 92298 Chatenay Malabry, France
3
Department of Structural Geotechnical and Building Engineering, Politecnico di Torino, 10138 Torino, Italy
*
Author to whom correspondence should be addressed.
Appl. Sci. 2020, 10(14), 4898; https://doi.org/10.3390/app10144898
Submission received: 22 June 2020 / Revised: 7 July 2020 / Accepted: 13 July 2020 / Published: 16 July 2020
(This article belongs to the Special Issue Nondestructive Testing (NDT): Volume II)

Abstract

:
Creep tests are commonly performed to characterize time-dependent deformation of geological materials. Classical measuring methods are not suitable for long term tests and not able to provide full three-dimensional strain fields. In this study, Digital Volume Correlation (DVC) is applied to X-ray micro-tomography (XRMT) images from creep tests on a hard clayey rock. In situ uniaxial compression creep tests are performed under different levels of stress and with different loading orientations with respect to the structural anisotropy of rock. Based on the XRMT images taken during the creep tests, DVC is applied to compute the full three dimensional strain fields and global averages strains of tested samples. The effects of bedding planes and hard inclusions on the non-uniform distribution of strains are analyzed.

1. Introduction

Creep deformation is commonly observed in geological materials, in particular in clayey rocks. Description of time-dependent behavior of these materials is an essential issue for long-term stability analysis of related structures. Creep tests are widely performed to characterize time-dependent deformation. Such tests are generally realized for a relative long period and sometimes under complex environmental conditions, for instance under controlled temperature and moisture content. On the other hand, most geological materials contain different kinds of heterogeneities such as mineral inclusions and pores. As a consequence, strain fields in these materials can be strongly non-uniform even at sample scale. Classical measuring methods such as strain gauges are not suitable for long duration tests and not able to provide non-uniform full strain fields.
During the last decades, different kinds of non-destructive techniques have been rapidly developed for the characterization of non-uniform deformation and micro-structural evolution. For instance, the optical microscopy, scanning electron microscopy and other techniques have been used for studying micro-structural evolutions at selected two-dimensional sections [1,2,3,4,5]. In order to get three-dimensional evolutions of micro-structure, X-ray micro-tomography has been increasingly used in a very large range of materials from biological tissues to geological formations [6,7,8,9,10]. On the other hand, in order to compute quantitatively local strain fields from images obtained from the different kinds of observation techniques, Digital Image Correlation (DIC) method has been developed for two-dimensional images [11]. DIC has further been extended to Digital Volume Correlation (DVC) for dealing with three-dimensional deformation processes [6,12].
In the present study, we shall apply the combination of DVC and X-ray micro-tomography to investigate creep deformation of the Callovo-Oxfordian (COx) claystone. This clayey rock is selected as a potential geological barrier for underground disposal of radioactive waste in France. In this context, the time-dependent behavior of claystone is a crucial feature, affecting the long-term thermo-hydromechanical responses of storage facilities [13,14,15,16,17]. On the other hand, the claystone has also complex mineralogical compositions and its macroscopic mechanical properties can significantly vary with the mineralogy [17,18]. Due to the diagenetic history, most sedimentary rocks contain sub-horizontal bedding planes. This generally leads to a transversely isotropy on both mechanical and transport properties at the macroscopic scale [19,20,21,22,23,24,25].
In addition to macroscopic studies mentioned above, a number of works have also been conducted to studying deformation and cracking processes in clayey rocks, by using different types of imaging methods and the DIC or DVC. For instance, some studies have been devoted to the three-dimensional strain characterization of the COx claystone in uniaxial or triaxial compression tests [10,26,27]. By considering heterogeneities of different scales, it was found that the deformation of the COx claystone was dominated by the clay matrix [9]. Interface debonding and crack growth inside the clay matrix have been highlighted in [22,28] during drying and hydration processes. Some authors have used a combination of Scanning Electron Microscopy (SEM), Broad Ion Beam (BIB) polishing and DIC to investigate the evolution of microstructure in deformed samples of the COx claystone [5]. Recently, the dynamics of water absorption in the COx claystone was revealed by using multi-modal X-ray and neutron tomography [29]. However, few studies have so far been devoted to the characterization of non-uniform local strain fields during creep tests in the COx claystone. In this study, a series of new In situ creep tests are performed by using a specially designed device. Different stress levels are applied on the samples with three different loading orientations with respect to the bedding planes. X-ray micro-tomographic images are taken during each creep tests. Based on these images, non-uniform local strains fields and global averaged strains of tested samples are calculated by using DVC. The effects of materials anisotropy on the creep deformation are analyzed.

2. X-ray Micro-Tomography and Digital Volume Correlation

2.1. X-ray Micro-Tomography

X-ray micro-tomography is a versatile and non-destructive imaging tool that aims at obtaining a three dimensional map of X-ray absorption coefficient of the material components. Basically, the sample is irradiated by a beam coming from an X-ray source. A generally planar detector measures the transmitted intensity. A 2D projection (radiograph) of the sample is therefore obtained, containing information on average attenuations along the different paths from source to detector through the material. Then, this acquisition is performed for various angles. Usually the sample is rotated a fraction of degree along its vertical axis until a 180 or 360-degree turn. The series of acquired 2D radiographs allows a 3D reconstruction through different existing computational methods as filtered back-projection algorithm for instance [30]. The resolution of this 3D map of attenuation highly relies on the configuration of the performed acquisition: size of the sample, size of the focal spot, size of the detector, magnification used (ratio between the sample-to-detector and the sample-to-source distances)… In addition, the X-ray attenuation of a given constituent is linked to its chemical properties (atomic number and density) and to X-ray energy [31]. The attenuation contrast between the constituents should be high enough to be able to identify the microstructure. Acquisitions have been performed at the In Situ Innovative Set-ups under X-ray Micro-tomography (ISIS4D) platform [32] using a computed tomography system Ultra Tom R from RX Solutions. This device allows to scan a wide range of material samples and sizes (from hundreds of micrometres up to several tens of centimetres) under various loading conditions thanks to the different X-ray generators, detectors, in situ devices and parameters of acquisition. For this study, the X-ray source is a nanofocus X-ray tube from Hamamatsu. The operation voltage was set at 100 kV in order to discern the constituents of the hard clayey rock. To achieve a voxel size of 4.5 μ m required to investigate its microstructure and its evolution under creep, the filament current was set to 45 μ A (maintaining the focal spot of the X-ray cone beam smaller than the resolution) and the geometrical magnification was a compromise between diameter of the specimen and duration of each acquisition. The specimen, placed the closest to the source, has a diameter limited to 5 mm, a flat-panel detector (1874 × 1496 pixels, pixel size 127 μ m) has been selected and 1440 radiographs were taken through a 360-degree turn. We averaged six images at a given angular position to reduced noise. The reconstruction of the tomographic data is performed with a filtered back-projection algorithm using X-act R software. It is noticed that in our study, the amplitude contrast mode is used for X-ray imaging. For the studied claystone, the amplitude contrast between the clay matrix and hard inclusion is large enough so that it is not necessary to use the phase contrast mode. Further, the emphasis of our study to investigate the non-uniform strain field during creep test, therefore, the stress field is not investigated.

2.2. Digital Image and Volume Correlation

Digital Image Correlation (DIC) is a technique for measuring displacements on surfaces under different load conditions [33]. If grey scale conservation is assumed, the difference between taken pictures at different instants depends only on the displacement field:
f ( x ¯ ) = g ( x ¯ + u ¯ ( x ¯ ) )
with f ( x ¯ ) and g ( x ¯ ) , are respectively the reference and deformed states seen as scalars (grey levels) and u ¯ is the displacement vector for each position x ¯ . Finding the best u ¯ field is achieved by minimizing the optical flow equation (Equation (1)) over the region of interest.
The digital volume correlation (DVC) approach corresponds to the extension of the two-dimensional DIC method in three dimensions [34]. In this study, DVC was carried out with YaDICs software, developed in Laboratoire de Mécanique de Lille [35]. The platform was based on C++, and optimized to process 3D volumes in a reduced time. To identify displacements, several parameters have to be defined: a metric, a sampling, an interpolator, a transformation, an optimizer and finally a regularization method (Figure 1). More details can be found in [35].
Displacements can be searched using a decomposition on a discrete basis:
u ¯ ( x ¯ ) = a n ψ ¯ n ( x ¯ )
with a n , the sought degrees of freedom and ψ ¯ n , the shape functions. In this study, finite elements method shape functions were used [37], providing a continuous displacements field on the whole studied volume. A concern is to present the same formalism for numerical simulations so that interpolation errors can be reduced for material parameters identification for example [38].
A multi-scale resolution strategy was adopted for the DVC. This pyramid scheme reduced the problem size and thus avoided some local minimum traps. In the present case, six scales (or resolutions) are employed; the coarsest one was the ‘scale 5’ with one ‘macro’ voxel, which was averaged over 2 5 × 2 5 × 2 5 voxels while the full resolution image corresponds to the ’scale 0’ (Figure 2).
In this study, DIC procedure was achieved with 8 × 8 × 8 pixels windows ensuring a good spatial resolution thanks to the good natural speckle pattern of the studied material (claystone) in X-ray micro-tomography. This size of correlation window thus helped to have a fine description of localization phenomena in the material while having a moderate uncertainty, i.e., less than 0.1 voxel. Finally, the YaDICs software enabled a regularization with a median filter to limit uncertainties. Considering a set of pixels including an aberrant value, the median filter sorted the values in ascending order to determine the median value. It allowed the outlier to be replaced by a consensus value for neighbouring values [39]. The median filter thus reduces measurement uncertainties in images correlation while maintaining discontinuities [40].
The accuracy of DVC method was generally evaluated by using the uncertainty of displacement field, which was calculated in terms of the standard deviation of the displacement between two pictures. One was at the reference position and the other was translated by 20 microns [41,42]. For this study, we calculated the standard deviation for the three components of the displacement vector for the element size varying from 4 to 64 voxels. It was found that the element size with 8 voxels provided a good compromise between the uncertainty and contrast of displacement field. For instance, the uncertainty was below 0.1 voxels.

3. Experimental Program

3.1. In Situ Creep Test Device

A special loading system was designed in order to carry out in situ uniaxial compression creep tests with X-ray micro-photography imaging [43]. As shown in Figure 3a, the experimental system included a manual axial loading frame, a long transparent tube, a stiff base, a force sensor and a data logger. The transparent tube was made of polycarbonate with a high X-ray transmission and a good mechanical stability. The use of such a long tube allowed placing the sample as close as possible to the X-ray source in order to obtain a high resolution. The range of the force sensor was 100 kg and its accuracy was about 0.01 kg. In order to reduce the friction at the top and bottom surfaces of sample and also to obtain clear boundaries in X-ray scanning, the tested sample was placed between two transparent polycarbonate pistons, as shown in Figure 3b. The axial force was manually applied with a slow rate.

3.2. Tested Material

The geological material tested in this study was the Callovo-Oxfordian (COx) claystone, which was investigated in France as a potential geological barrier for underground disposal of nuclear waste [16,44]. Cores used in this study were drilled at the Underground Research Laboratory (URL) at Bure at a depth of about 500 m, operated by Andra (French National Agency for management of radioactive waste). The COx claystone was mainly composed of clay minerals (illite, montmorillonite, kaolinite and a small amount of chlorite), carbonate and quartz particles. The clay content was about 40–45%, the carbonate (mainly calcite) 25–35% and the quartz 30%. Other secondly minerals, namely feldspar, mica and pyrite, could also be found [7,45]. The COx claystone had complex multi-scale structures. As a first approximation, two scales are generally considered as relevant for the description of mechanical behavior. At the so-called mesoscopic scale (up to mm), carbonate and quartz particles are distributed in an almost continuous clay-rich matrix [7,27,45]. The average size of these particles is generally smaller than 100 μ m. An example of 3D image by synchrotron X-ray micro-tomography is shown in Figure 4. Then at the microscopic scale (less than 1 μ m), the clay-rich matrix is composed of clay particles and pores between them. Therefore, the clay matrix is seen as a porous medium. Similar structures are also found in other clay-rich rocks [46,47].
In the present study, the emphasis is put on the measuring of creep strain field at the mesoscopic scale. At this scale, for most sedimentary clayey rocks, a layered morphology was generally observed with the presence of so-called bedding (or sedimentation) planes. Indeed, after the initial deposition, the sediment was gradually transformed into hard rock by physical (compaction, dehydration), chemical (precipitation, dissolution, epigenization) and biological (bacterial action, bioturbation) processes [48]. These diagenetic processes caused a change in the initial arrangement of sediment particles. As a consequence, most sedimentary rocks exhibited a transversely isotropy on thermal hydraulic and mechanical properties [20,21,22,23,25].

3.3. Samples Preparation

The cylindrical samples used in this study had a diameter of ∼5 mm and a height of ∼10 mm. They were drilled from large cores conserved in special containers of about 79 mm in diameter and 300 mm in length (with Andre reference of EST58125) [49]. In spite of special cares taken to prevent the loss of moisture, due to the small size samples and complex preparation procedure, the moisture content of the samples was inevitably reduced, in average from ∼7% to ∼4%. The samples were successfully drilled with three different orientations with respect to the bedding planes ( α = 0 , 45 and 90 ), as shown in Figure 5, which were called the parallel sample (‖), inclined sample ( ⃫ ) and perpendicular sample (⊥) respectively in this paper.

4. Creep Strain Fields And Discussions

The initial 3D image of each tested sample was first taken by using X-ray micrography, and considered as the reference configuration. The parallel and perpendicular samples were then successively subjected to four steps of creep under constant axial stresses while the inclined sample to three creep steps. Each creep step may have lasted for several weeks. During each creep step, 3D images were taken at different instances. The images obtained at the deformed configurations were compared with the reference ones to compute the displacement and strain fields of tested samples. Some representative results obtained are presented and discussed in this section, in relation with material heterogeneity. However, with the resolution of ISIS-4D platform and the size of samples adopted here, only big mineral particles could be identified in X-ray images.
All the tests were conducted in a air-conditioned room with a constant temperature of 15 ± 0.5 C. Further, the stress levels prescribed for different creep steps were calculated as ratios to the corresponding uniaxial compression strength for three loading orientations. For this purpose, three preliminary uniaxial compression tests were first performed to determine the peak strengths. It can be already noticed that the uniaxial compression strength of the inclined sample was significantly lower than those of the parallel and perpendicular samples for which the peak strength is almost identical. Therefore, the failure strength of the COx claystone exhibited a clear anisotropy. As mentioned in many previous studies [20,23,25], the small strength of the sample inclined at 45 was due to the fact that the sliding along bedding planes enhanced the failure of sample. Further, it is worth noticing that the values of uniaxial strength obtained here were higher than the average value reported in previous works [16,17,50]. The difference was probably due to the low moisture content of the tested samples. The values of axial elastic modulus and Poisson’s ratio are also given in Table 1. One can observe that the elastic properties were also anisotropic. The axial elastic modulus decreased continuously from the parallel to perpendicular directions. The kind of evolution is consistent with many previous studies on sedimentary rocks [20,23,25]. The evolution of elastic modulus was generally related to compaction of bedding planes.

4.1. Evolution of Average Strains

DVC was applied to the X-ray micro-tomographic images obtained at the different steps of creep tests. This allowed computing three-dimensional strain fields of all tested samples. From these fields, the macroscopic strains of each sample were calculated as volumetric averages of full strain field. In Figure 6, the evolutions of both axial and radial strains with time are presented for three samples with different orientations. It is noticed that the step-like variations in these figures corresponded to the instantaneous strains induced by the increase of axial stress at the change of loading step.
At first sight, the strains evolutions were clearly different between three samples, indicating a strong anisotropy of creep behavior of the COx claystone. Comparing the parallel and perpendicular samples (see Figure 6a,c, despite the very similar peak strength of these two samples, the axial strain of the perpendicular sample (⊥) was almost two times larger than that of the parallel one (‖), both for the instantaneous strain when the axial stress was increased and the creep strain under the constant stress. This difference was clearly related to the progressive compaction of bedding planes under the axial stress in the perpendicular sample. It is also interesting to compare the radial strain between these two samples. Under low stress levels, the radial strain of the perpendicular sample was smaller than that of the parallel one. It is even compressive (positive value) during the first step of loading. This means that due to the important compaction of bedding planes, the application of axial stress did not induce extensive radial strain. The sample exhibited a compaction in both the axial and radial direction. When the prescribed axial stress became higher, the radial strain became extensive and progressively larger. During the third and fourth loading steps, the radial strain of the perpendicular sample became larger than that of the parallel one, due to its higher creep deformation. As mentioned above, only three loading steps were realized on the inclined sample due to the sample failure at the third step. Its axial strain was larger than the parallel sample and smaller than the perpendicular one. For this sample, the compressive axial stress could generate the time-dependent sliding of bedding planes, enhancing the creep deformation of sample. As a consequence of inclination of bedding planes, the radial strain was also amplified. Therefore, the radial strain of the inclined sample was larger than those of two other samples. From these results, one can remark that both the instantaneous and creep strains of the COx claystone were significantly dependent on the loading orientation and the motion of bedding planes (compaction or sliding) played an essential role in the deformation process of material.

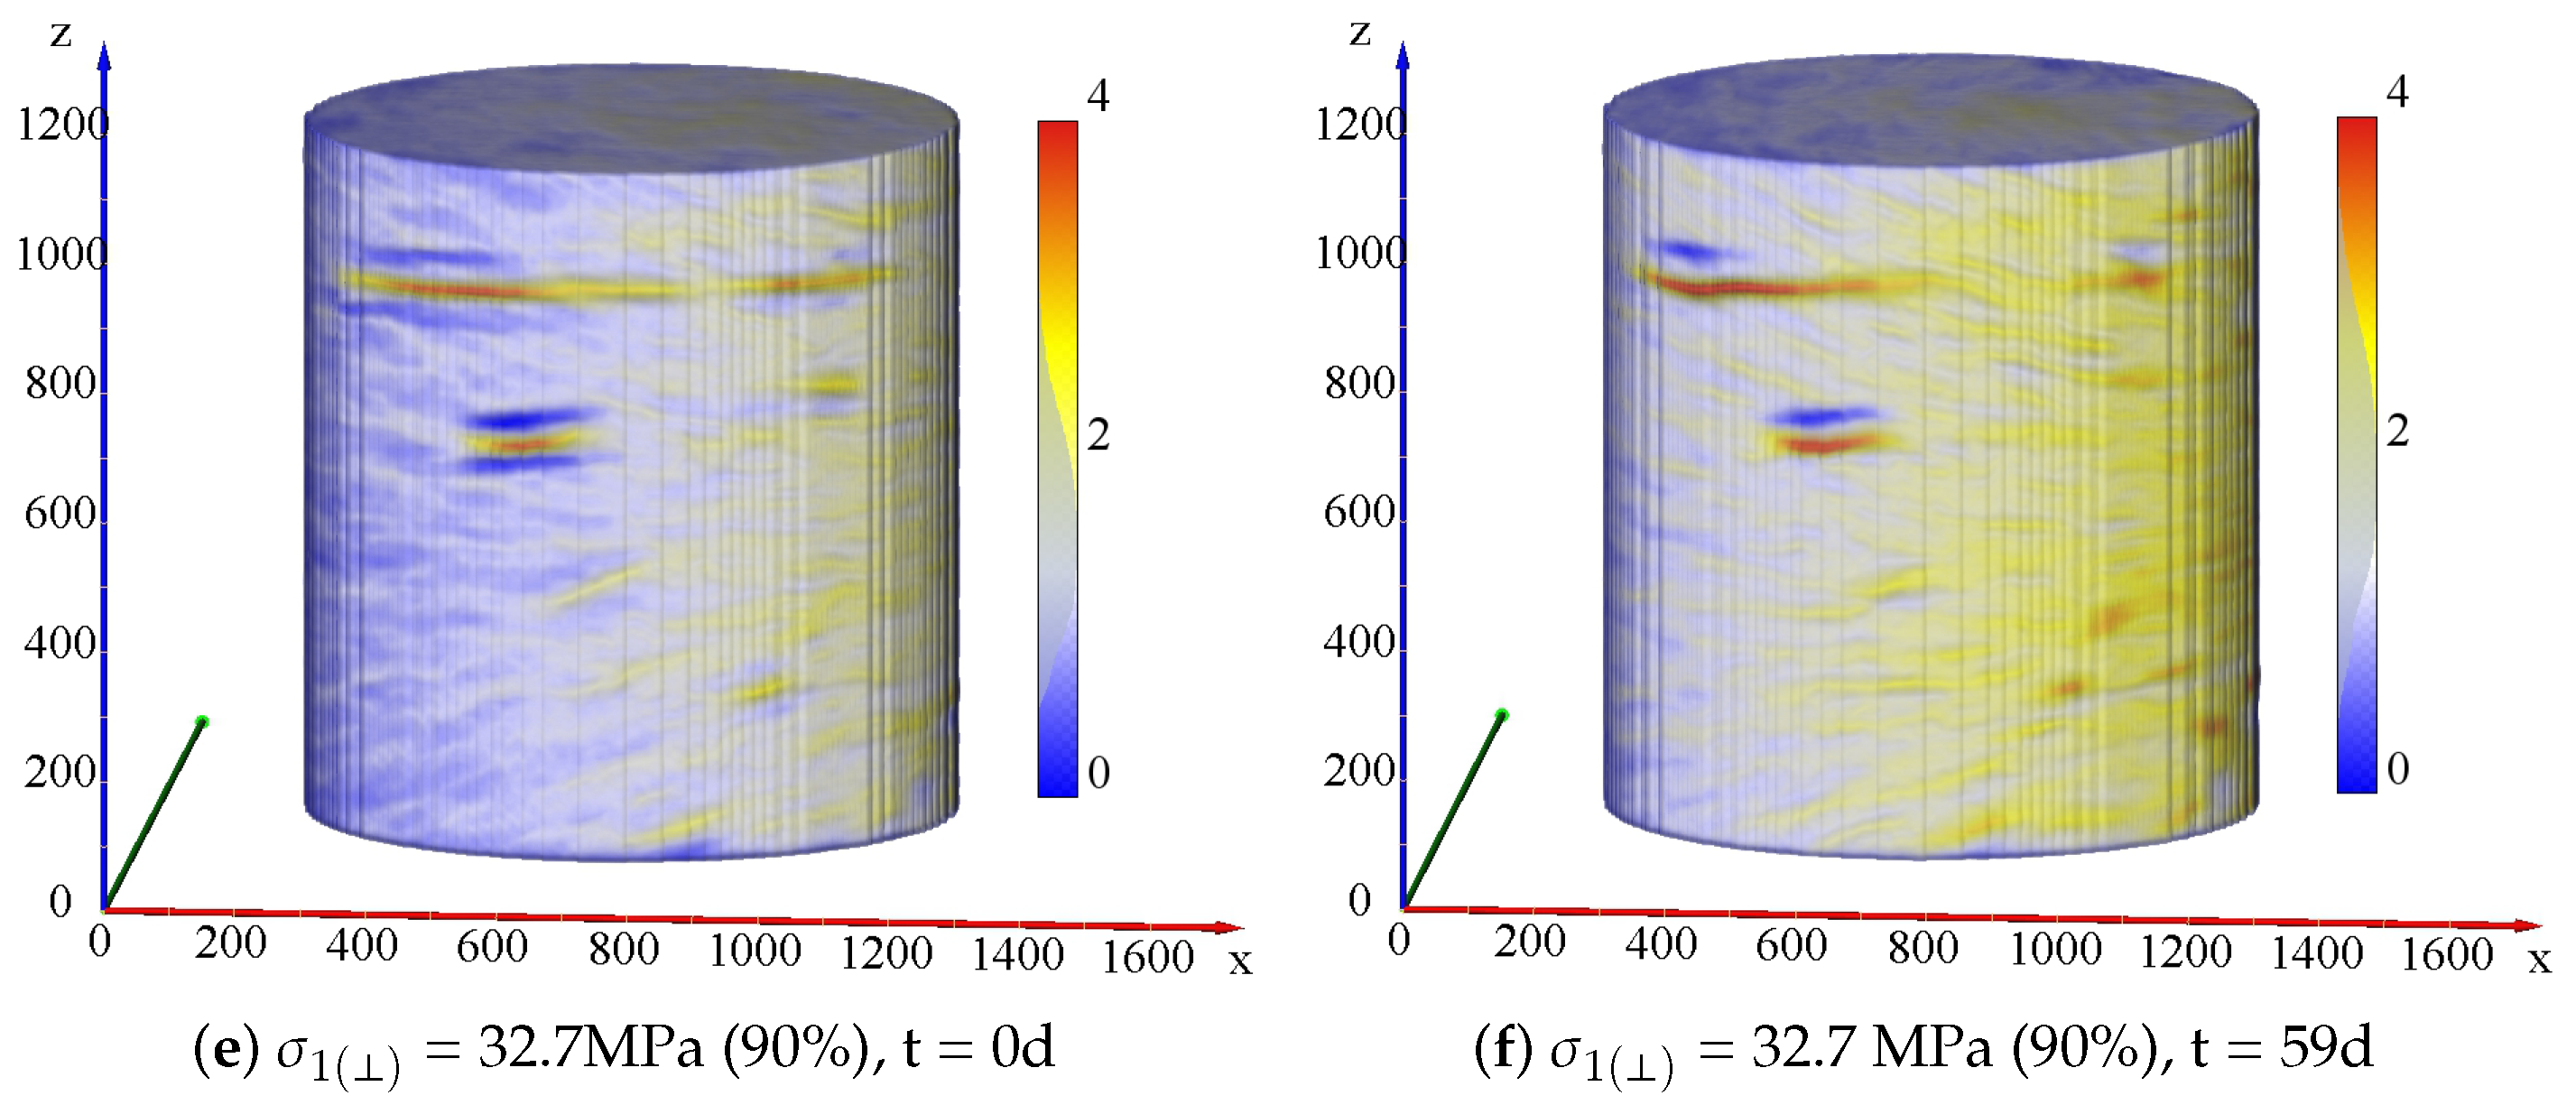
4.2. Non-Uniform Strain Fields

As an important advantage with respect to classical measuring techniques, the application of DVC to X-ray tomographic images allows the computation and analysis of non-uniform strain fields inside samples. In Figure 7, we show the full axial strain fields in the three samples under two similar stress levels and time periods, respectively at 60–67% and 27–30 days, and 90–94% and 13 days.
As a common feature of three tested samples, the axial strain fields were strongly non-uniform. More precisely, the axial strain fields showed a clear layered distribution. However, the concentration degree and orientation of strain layers differed between the three samples. As mentioned above, this layered distribution of axial strain was inherently related to the motion of bedding planes. For the perpendicular sample (⊥), as the bedding planes were strongly compacted by the applied stress which was normal to them, one got regular and clearly identifiable horizontal strain concentration layers. For the parallel sample (‖), even the applied stress is parallel to the bedding planes, one still observed horizontal strain concentration layers, probably due to the compaction of initial cracks. However the concentration degree of strain layers was less marked than the perpendicular sample (⊥). For the inclined sample ( ⃫ ) with an angle of 45 , the applied axial stress generated both normal and tangential stresses on the bedding planes, which could exhibit a frictional sliding. As an interesting result, the strain concentration layers in this sample were also inclined and almost parallel to the bedding planes. On the other hand, the strain concentration layers were more and more marked and the difference between the three samples was larger when the applied stress was higher.
In order to investigate the evolution of strain field under a prescribed constant stress, the axial strains fields in three samples at two different instances under a fixed axial stress are presented Figure 8. It is clear that the strain fields evolve with time due to the creep of COx claystone. As the mineral inclusions had an elastic behavior, the creep deformation occurred mainly inside the clayey matrix. Further, the creep deformation enhanced the concentration degree of strain layers, which became more and more marked with time.
In order to deeply investigate the evolutions of radial strain, the local distribution of strain on some cross sections are now presented. It is noticed that the 3D analysis used in the present study allowed providing the local strain field on any cross section of tested sample. As a representative example, a horizontal cross section also called slice was cut at the mid-height of each tested sample, as shown in Figure 9. The distributions of accumulated radial strain on the selected slices are presented in Figure 10 for the three tested samples under two different stress levels, the same as those used in Figure 7 for the axial strain fields. It is found that at the low axial stress, the concentration degree (or heterogeneity) of radial strain in the parallel (‖) and perpendicular (⊥) samples was significantly less marked than that of the inclined sample ( ⃫ ). This is consistent with the average radial strains discussed above. The frictional sliding along bedding planes in the inclined sample ( ⃫ ) enhanced the non-uniform distribution of radial strain. When the applied stress was high, i.e., about 90 to 94% of the peak strength, the distributions of radial strain on the slice became strongly non-uniform for the three samples. In these figures, hard inclusions are represented by the white colored zones. One can observe a strong strain concentration around those hard inclusions. It seems that the difference of elastic stiffness between the clayey matrix and hard inclusions favored the strain concentration process inside the samples. Therefore, the material heterogeneity was at the origin of strongly non-uniform distribution of local strain fields. More interestingly, the radial strains on the slices were not always in extension (in blue color) like that should be found in a homogeneous material. Some compressive radial strain areas (in orange and red color) were also found. As a consequence, a compressive average radial strain could be obtained for the whole sample even under uniaxial compression loading, as that for the perpendicular one discussed above. However, the effects of mineral inclusions on the local strain fields of the COx claystone seemed to complex. Further in-depth quantitative analyses should be performed in our future works.

5. Conclusions

The application of digital volume correlation to X-ray images provides an efficient method for the characterization of full strain field in heterogeneous rocks during long term creep tests. This method can be extended to complex environmental conditions with variations of temperature and moisture content.
The creep deformation of the COx claystone has been investigated under uniaxial compression condition by using the proposed measuring method and a specially designed device. Both the full strain fields and averaged global strains have been computed for the tested samples. In particular, the effects of structural anisotropy have been investigated by considering three different loading orientations.
It is found that due to the material heterogeneities, especially the presence of hard mineral inclusions, the distributions of both stress-induced and creep strains are strongly non-uniform inside the tested samples. There are strong strain concentration zones around the hard inclusions. Even under uniaxial compression loading, local compressive radial strains can be observed. At the mesoscopic scale, the motion of bedding planes plays an important role in the deformation and failure processes of the COx claystone. The progressive compaction of bedding planes leads to large instantaneous and time-dependent axial strains. The frictional sliding along the bedding planes enhances the growth of strain localization and controls the failure for inclined loading orientations. The strain localization process is strongly affected by the loading orientation with respect to the bedding planes.
However, the effects of materials heterogeneities such as mineral inclusions and pores are complex. Further in-depth analyses are still needed for getting a quantitative characterization of those effects.

Author Contributions

Conceptualization, J.T., J.S. and S.X.; laboratory tests, H.S., J.H. and T.R.; results analysis, H.S., J.H., T.R., S.X. and J.S.; writing, H.S., J.H., T.R., S.X., J.S., J.T. and G.L. All authors have read and agreed to the published version of the manuscript.

Funding

The present study was jointly supported by Andra, the I-site project of University of Lille and the ISIS4D X-Ray CT platform. This platform has been funded by the International Campus on Safety and Inter-modality in Transportation (CISIT), the Hauts-de-France Region, the European Community and the National Center for Scientific Research (CNRS).

Acknowledgments

Special thanks are addressed to Jean-Pierre Parent and Jean Secq for their invaluable assistance to the design of experimental device and preparation of samples.

Conflicts of Interest

The authors declare no conflict of interest.

References

  1. Hicher, P.; Wahyudi, H.; Tessier, D. Microstructural analysis of strain localisation in clay. Comput. Geotech. 1994, 16, 205–222. [Google Scholar] [CrossRef]
  2. Tang, C.; Tang, A.M.; Cui, Y.J.; Delage, P.; Schroeder, C.; Shi, B. A study of the hydro-mechanical behaviour of compacted crushed argillite. Eng. Geol. 2011, 118, 93–103. [Google Scholar] [CrossRef] [Green Version]
  3. Laurich, B.; Urai, J.L.; Desbois, G.; Vollmer, C.; Nussbaum, C. Microstructural evolution of an incipient fault zone in Opalinus Clay: Insights from an optical and electron microscopic study of ion-beam polished samples from the Main Fault in the Mt-Terri Underground Research Laboratory. J. Struct. Geol. 2014, 67, 107–128. [Google Scholar] [CrossRef]
  4. Robinet, J.; Sardini, P.; Siitari-Kauppi, M.; Prêt, D.; Yven, B. Upscaling the porosity of the Callovo-Oxfordian mudstone from the pore scale to the formation scale; insights from the 3H-PMMA autoradiography technique and SEM BSE imaging. Sediment. Geol. 2015, 321, 1–10. [Google Scholar] [CrossRef]
  5. Desbois, G.; Höhne, N.; Urai, J.L.; Bésuelle, P.; Viggiani, G. Deformation in cemented mudrock (Callovo-Oxfordian Clay) by microcracking, granular flow and phyllosilicate plasticity: Insights from triaxial deformation, broad ion beam polishing and scanning electron microscopy. Solid Earth 2017, 8, 291. [Google Scholar] [CrossRef] [Green Version]
  6. Viggiani, G.; Lenoir, N.; Bésuelle, P.; Michiel, M.; Marello, S.; Desrues, J.; Kretzschmer, M. X-ray microtomography for studying localized deformation in fine-grained geomaterials under triaxial compression. Comptes Rendus Mécanique 2004, 332, 819–826. [Google Scholar] [CrossRef]
  7. Robinet, J.C. Minéralogie, Porosité et Diffusion des Solutés dans L’argilite du Callovo-Oxfordien de Bure (Meuse, Haute-Marne, France) de L’échelle Centimétrique à Micrométrique. Ph.D. Thesis, University of Poitiers, Poitiers, France, 2008. [Google Scholar]
  8. Buffiere, J.Y.; Maire, E.; Adrien, J.; Masse, J.P.; Boller, E. In situ experiments with X ray tomography: An attractive tool for experimental mechanics. Exp. Mech. 2010, 50, 289–305. [Google Scholar] [CrossRef]
  9. Bornert, M.; Vales, F.; Gharbi, H.; Nguyen Minh, D. Multiscale full-field strain measurements for micromechanical investigations of the hydromechanical behaviour of clayey rocks. Strain 2010, 46, 33–46. [Google Scholar] [CrossRef]
  10. Viggiani, G.; Besuelle, P.; Desrues, J. X-ray Micro Tomography as a Tool for Studying Localized Damage/deformation in Clay Rock; Technical Report: NEA-RWM-CLAYCLUB–2013-1; Nuclear Energy Agency of the OECD (NEA): Paris, France, 2013.
  11. Chu, T.; Ranson, W.; Sutton, M.A. Applications of digital-image-correlation techniques to experimental mechanics. Exp. Mech. 1985, 25, 232–244. [Google Scholar] [CrossRef]
  12. Bay, B.K.; Smith, T.S.; Fyhrie, D.P.; Saad, M. Digital volume correlation: Three-dimensional strain mapping using X-ray tomography. Exp. Mech. 1999, 39, 217–226. [Google Scholar] [CrossRef]
  13. Gasc-Barbier, M.; Chanchole, S.; Bérest, P. Creep behavior of Bure clayey rock. Appl. Clay Sci. 2004, 26, 449–458. [Google Scholar] [CrossRef]
  14. Fabre, G.; Pellet, F. Creep and time-dependent damage in argillaceous rocks. Int. J. Rock Mech. Min. Sci. 2006, 43, 950–960. [Google Scholar] [CrossRef]
  15. Liu, Z.; Shao, J.; Liu, T.; Xie, S.; Conil, N. Gas permeability evolution mechanism during creep of a low permeable claystone. Appl. Clay Sci. 2016, 129, 47–53. [Google Scholar] [CrossRef]
  16. Armand, G.; Conil, N.; Talandier, J.; Seyedi, D.M. Fundamental aspects of the hydromechanical behaviour of Callovo-Oxfordian claystone: From experimental studies to model calibration and validation. Comput. Geotech. 2017, 85, 277–286. [Google Scholar] [CrossRef]
  17. Liu, Z.; Shao, J.; Xie, S.; Conil, N.; Zha, W. Effects of relative humidity and mineral compositions on creep deformation and failure of a claystone under compression. Int. J. Rock Mech. Min. Sci. 2018, 103, 68–76. [Google Scholar] [CrossRef]
  18. Guéry, A.A.C.; Cormery, F.; Shao, J.F.; Kondo, D. A comparative micromechanical analysis of the effective properties of a geomaterial: Effect of mineralogical compositions. Comput. Geotech. 2010, 37, 585–593. [Google Scholar] [CrossRef]
  19. Amadei, B. Importance of anisotropy when estimating and measuring in situ stresses in rock. Int. J. Rock Mech. Min. Sci. Geomech. Abstr. 1996, 33, 293–325. [Google Scholar] [CrossRef]
  20. Niandou, H.; Shao, J.F.; Henry, J.P.; Fourmaintraux, D. Laboratory investigation of the mechanical behaviour of Tournemire shale. Int. J. Rock Mech. Min. Sci. 1997, 34, 3–16. [Google Scholar] [CrossRef]
  21. Zhang, F.; Xie, S.; Hu, D.; Shao, J.F.; Gatmiri, B. Effect of water content and structural anisotropy on mechanical property of claystone. Appl. Clay Sci. 2012, 69, 79–86. [Google Scholar] [CrossRef]
  22. Yang, D.; Chanchole, S.; Valli, P.; Chen, L. Study of the anisotropic properties of argillite under moisture and mechanical loads. Rock Mech. Rock Eng. 2013, 46, 247–257. [Google Scholar] [CrossRef]
  23. Liu, Z.; Xie, S.; Shao, J.F.; Conil, N. Effects of deviatoric stress and structural anisotropy on compressive creep behavior of a clayey rock. Appl. Clay Sci. 2015, 114, 491–496. [Google Scholar] [CrossRef]
  24. Togashi, Y.; Kikumoto, M.; Tani, K. An experimental method to determine the elastic properties of transversely isotropic rocks by a single triaxial test. Rock Mech. Rock Eng. 2017, 50, 1–15. [Google Scholar] [CrossRef]
  25. Zhang, C.; Armand, G.; Conil, N.; Laurich, B. Investigation on anisotropy of mechanical properties of Callovo-Oxfordian claystone. Eng. Geol. 2019, 251, 128–145. [Google Scholar] [CrossRef]
  26. Bésuelle, P.; Viggiani, G.; Lenoir, N.; Desrues, J.; Bornert, M. X-Ray Micro CT for Studying Strain Localization in Clay Rocks Under Triaxial Compression; John Wiley & Sons: Hoboken, NJ, USA, 2006; Volume 118, pp. 35–52. [Google Scholar]
  27. Lenoir, N.; Bornert, M.; Desrues, J.; Bésuelle, P.; Viggiani, G. Volumetric digital image correlation applied to X-ray microtomography images from triaxial compression tests on argillaceous rock. Strain 2007, 43, 193–205. [Google Scholar] [CrossRef]
  28. Wang, L.L.; Bornert, M.; Heripre, E.; Chanchole, S.; Pouya, A.; Halphen, B. The mechanisms of deformation and damage of mudstones: A micro-scale study combining ESEM and DIC. Rock Mech. Rock Eng. 2015, 48, 1913–1926. [Google Scholar] [CrossRef]
  29. Stavropoulou, E.; Andò, E.; Roubin, E.; Lenoir, N.; Tengattini, A.; Briffaut, M.; Bésuelle, P. Dynamics of water absorption in Callovo-Oxfordian Claystone revealed with multimodal X-ray and neutron tomography. Front. Earth Sci. 2020, 8, 6. [Google Scholar] [CrossRef] [Green Version]
  30. Kak, A.C.; Slaney, M. Principles of Computerized Tomographic Imaging; Society for Industrial and Applied Mathematics: Philadelphia, PA, USA, 2001. [Google Scholar]
  31. Attix, F.H. Introduction to Radiological Physics and Radiation Dosimetry; John Wiley & Sons: Hoboken, NJ, USA, 2008. [Google Scholar]
  32. Limodin, N.; Rougelot, T.; Hauss, G. ISIS4D-In Situ Innovative Set-Ups under X-ray Microtomography. 2013. Available online: http://isis4d.univ-lille1.fr/wordpress/ (accessed on 13 July 2020).
  33. Sutton, M.; Wolters, W.; Peters, W.; Ranson, W.; McNeill, S. Determination of displacements using an improved digital correlation method. Image Vis. Comput. 1983, 1, 133–139. [Google Scholar] [CrossRef]
  34. Buljac, A.; Jailin, C.; Mendoza, A.; Neggers, J.; Taillandier-Thomas, T.; Bouterf, A.; Smaniotto, B.; Hild, F.; Roux, S. Digital volume correlation: Review of progress and challenges. Exp. Mech. 2018, 58, 661–708. [Google Scholar] [CrossRef] [Green Version]
  35. Seghir, R.; Witz, J.F.; Courdert, S. YaDICs-Digital Image Correlation 2/3D Software. 2014. Available online: http://yadics.univ-lille1.fr/wordpress/ (accessed on 13 July 2020).
  36. Dahdah, N.; Limodin, N.; El Bartali, A.; Witz, J.F.; Seghir, R.; Charkaluk, E.; Buffiere, J.Y. Damage Investigation in A319 Aluminium Alloy by X-ray Tomography and Digital Volume Correlation during In Situ High-Temperature Fatigue Tests. Strain 2016, 52, 324–335. [Google Scholar] [CrossRef] [Green Version]
  37. Besnard, G.; Hild, F.; Roux, S. “Finite-element” displacement fields analysis from digital images: Application to Portevin–Le Châtelier bands. Exp. Mech. 2006, 46, 789–803. [Google Scholar] [CrossRef] [Green Version]
  38. Avril, S.; Bonnet, M.; Bretelle, A.S.; Grédiac, M.; Hild, F.; Ienny, P.; Latourte, F.; Lemosse, D.; Pagano, S.; Pagnacco, E.; et al. Overview of identification methods of mechanical parameters based on full-field measurements. Exp. Mech. 2008, 48, 381. [Google Scholar] [CrossRef] [Green Version]
  39. Witz, J.F.; Réthoré, J.; Hosdez, J. Regularization Techniques for Finite Element DIC. In International Digital Imaging Correlation Society; Springer: Berlin/Heidelberg, Germany, 2017; pp. 137–140. [Google Scholar]
  40. Hosdez, J.; Witz, J.; Martel, C.; Limodin, N.; Najjar, D.; Charkaluk, E.; Osmond, P.; Szmytka, F. Fatigue crack growth law identification by Digital Image Correlation and electrical potential method for ductile cast iron. Eng. Fract. Mech. 2017, 182, 577–594. [Google Scholar] [CrossRef] [Green Version]
  41. Wang, L.; Limodin, N.; El Bartali, A.; Witz, J.F.; Seghir, R.; Buffiere, J.Y.; Charkaluk, E. Influence of pores on crack initiation in monotonic tensile and cyclic loadings in lost foam casting A319 alloy by using 3D in-situ analysis. Mater. Sci. Eng. 2016, 673, 362–372. [Google Scholar] [CrossRef]
  42. Li, Z.; Limodin, N.; Tandjaoui, A.; Quaegebeur, P.; Witz, J.F.; Balloy, D. Influence of Fe content on the damage mechanism in A319 aluminum alloy: Tensile tests and digital image correlation. Eng. Fract. Mech. 2017, 183, 94–108. [Google Scholar] [CrossRef]
  43. Shi, H.; Hosdez, J.; Rougelot, T.; Xie, S.; Shao, J.; Talandier, J. Analysis of local creep strain field and cracking process in claystone by X-ray micro-tomography and digital volume correlation. Rock Mech. Rock Eng. 2020. Submitted. [Google Scholar]
  44. Amann, F.; Kaiser, P.; Button, E.A. Experimental Study of Brittle Behavior of Clay Shale in Rapid Triaxial Compression. Rock Mech. Rock Eng. 2012, 45, 21–33. [Google Scholar] [CrossRef] [Green Version]
  45. Robinet, J.C.; Sardini, P.; Coelho, D.; Parneix, J.C.; Pret, D.; Sammartino, S.; Boller, E.; Altmann, S. Effects of mineral distribution at mesoscopic scale on solute diffusion in a clay-rich rock: Example of the Callovo-Oxfordian mudstone (Bure, France). Water Resour. Res. 2012, 48, W05554. [Google Scholar] [CrossRef]
  46. Bennett, K.; Berla, L.; Nix, W.; Borja, R. Instrumented nanoindentation and 3D mechanistic modeling of a shale at multiple scales. Acta Geotech. 2015, 10, 1–14. [Google Scholar] [CrossRef]
  47. Abedi, S.; Slim, M.; Hofmann, R.; Bryndzia, T.; Ulm, F. Nanochemo-mechanical signature of organic-rich shales: A coupled indentation-EDX analysis. Acta Geotech. 2016, 11, 559–572. [Google Scholar] [CrossRef] [Green Version]
  48. Aplin, A.C.; Yang, Y.; Hansen, S. Assessment of β the compression coefficient of mudstones and its relationship with detailed lithology. Mar. Pet. Geol. 1995, 12, 955–963. [Google Scholar] [CrossRef]
  49. Conil, N.; Talandier, J.; Djizanne, H.; de La Vaissière, R.; Righini-Waz, C.; Auvray, C.; Morlot, C.; Armand, G. How rock samples can be representative of in situ condition: A case study of Callovo-Oxfordian claystones. J. Rock Mech. Geotech. Eng. 2018, 10, 613–623. [Google Scholar] [CrossRef]
  50. Liu, Z.; Xie, S.; Shao, J.; Conil, N. Multi-step triaxial compressive creep behaviour and induced gas permeability change of clay-rich rock. Géotechnique 2018, 68, 281–289. [Google Scholar] [CrossRef]
Figure 1. Different steps of the digital volume correlation (DVC) process with YaDICs software [36].
Applsci 10 04898 g001
Figure 2. Pyramidal process employed in YaDICs.
Applsci 10 04898 g002
Figure 3. (a) Overall view of in situ creep test system; (b) translucent polycarbonate pistons [43].
Applsci 10 04898 g003
Figure 4. (a) 3D image by synchrotron X-ray micro-tomography (with a spatial resolution of 0.7 × 0.7 × 0.7 μ m 3 /pixel); (b) 3D distribution of a simplified mineralogy [7,45].
Applsci 10 04898 g004
Figure 5. Schematic illustration of sample preparation from initial big core and definition of loading angle between bedding planes and sample axis ( α = 0 , 45 , 90 ).
Applsci 10 04898 g005
Figure 6. Evolutions of average axial and radial strains during In situ creep tests on three samples with different loading orientations
Applsci 10 04898 g006aApplsci 10 04898 g006b
Figure 7. Distributions of accumulated axial strain under different stress levels and at different instances: (a,d): parallel sample (‖) with q c / q p e a k = 60% and q c / q p e a k = 94%; (b,e): inclined sample ( ⃫ ) with q c / q p e a k = 67% and q c / q p e a k = 90%; (c,f): perpendicular sample (⊥) with q c / q p e a k = 60% and q c / q p e a k = 90%.
Applsci 10 04898 g007
Figure 8. Distributions of accumulated axial strain and at different instances under a constant stress level: (a,b): parallel sample (‖) under q c / q p e a k = 94%; (c,d): inclined sample ( ⃫ ) under q c / q p e a k = 90%; (e,f): perpendicular sample (⊥) under q c / q p e a k = 90%.
Applsci 10 04898 g008aApplsci 10 04898 g008b
Figure 9. Positions of the selected slices in the three samples (‖, ⃫ , and ⊥).
Applsci 10 04898 g009
Figure 10. Distributions of accumulated radial strain under two different stress levels: (a,d): slice-680 of parallel sample (‖); (b,e) slice-505 of inclined sample ( ⃫ ); (c,f) slice-500 of perpendicular sample (⊥).
Applsci 10 04898 g010
Table 1. Elastic and strength properties of the Callovo-Oxfordian (COx) claystone and stress steps for creep tests.
Rock CoreDirectionDiameter
(mm)
Height
(mm)
Creep
Steps
Failure
Stress q peak /
(MPa)
Stress Ratios for
Creep Tests
q c / q peak / ( % )
Axial Elastic
Modulus
E/(GPa)
Axial
Poisson’s
Ratio ν
EST58125 4.87 10.65 4 35.0 41 % , 60 % , 77 % , 94 % ∼10.00.18–0.20
EST58125 4.84 10.88 3 27.7 40 % , 67 % , 90 % ∼8.00.15–0.24
EST58125 4.96 9.54 4 36.0 40 % , 60 % , 70 % , 90 % ∼6.30.26–0.30

