Application of Post-Embedded Piezoceramic Sensors for Force Detection on RC Columns under Seismic Loading


1
Department of Civil and Construction Engineering, National Taiwan University of Science and Technology, Taipei 10607, Taiwan
2
Department of Civil Engineering, National Taipei University of Technology, Taipei 10608, Taiwan
*
Authors to whom correspondence should be addressed.
Appl. Sci. 2020, 10(15), 5061; https://doi.org/10.3390/app10155061
Submission received: 15 June 2020
/
Revised: 9 July 2020
/
Accepted: 16 July 2020
/
Published: 23 July 2020
(This article belongs to the Special Issue Seismic Structural Health Monitoring)
Abstract
:To quantify damage to reinforced concrete (RC) column members after an earthquake, an engineer needs to know the maximum applied force that was generated by the earthquake. Therefore, in this work, piezoceramic transducers were used to detect the applied force on an RC column member under dynamic loading. To investigate the use of post-embedded piezoceramic sensors in detecting the force that is applied to RC columns, eight full-size RC column specimens with various failure modes were tested under specific earthquake loadings. Post-embedded piezoceramic sensors were installed at a range of depths (70–80 mm) beneath the surface of a column specimen to examine the relationship between the signals that were obtained from them and the force applied by the dynamic actuator. The signals that were generated by the post-embedded piezoceramic sensors, which correlate with the applied force, are presented. These results indicate that the post-embedded piezoceramic sensors have great potential as tools for measuring the maximum applied force on an RC column in an earthquake. In other words, signals that are obtained from post-embedded piezoceramic sensors on an RC column in an earthquake can be used to determine the applied force and corresponding damage or residual seismic capacity.
1. Introduction
Reinforced concrete (RC) is one of the most widely used modern building materials. Natural disasters, such as earthquakes or strong ground motions, degrade RC column members. The health of a structure that includes such members must be evaluated immediately following an extreme event to provide fundamental structural information regarding building safety. Throughout the service life of a building, its structural performance must be monitored and its residual seismic or serviceability capacity must be measured. Structural health monitoring (SHM) for RC column members is part of these processes. Generally, confirmation of the safety and integrity of building structures depends on the accuracy and precision of nondestructive testing (NDT) methods, such as visual inspection (VT), acoustic emission (AE), ultrasonic testing (UT), infrared and thermal testing (IR), and others. Although NDT is practical, it has some limitations, such as the impossibility of testing a dangerous structure or one close to failure, dependence on the skills of the operator of the test instruments, and the prohibitive time required for large-scale building evaluations.
In recent decades, piezoelectric sensors have become popular SHM instruments for use in concrete buildings because of their low cost, responsiveness, active/passive sensing, ease of use, and versatility (Liao and Jean [1]). Li et al. [2] grouped piezoelectric materials into four categories based on their structural characteristics: ceramic, single crystal, polymer, and composite (combining a polymer with a single crystal or ceramic). The traditionally used piezoelectric compound is barium titanate (BaTiO3), which has been replaced by PZT (Lead Zirconate Titanate), which have greater sensitivity and a higher operating temperature. An interesting phenomenon that arises from the accumulation of electric charge in certain solid materials under applied mechanical stress is the reversible piezoelectricity. Generally, the piezoelectric effect means that when PZT ceramic is deformed, an internal measurable electric charge is generated. Conversely, the dimensions of this material are changed by applying an external electric field; this behavior is called the inverse piezoelectric effect. Equation (1) describes the positive piezoelectric effect of a sensor and Equation (2) describes the inverse piezo-effect of the actuator. Equations (1) and (2) are the fundamental equations for piezoelectric materials.
where D is the electrical displacement; d is the piezoelectric deformation constant; T is the stress field; εT is the dielectric permittivity; E is the electrical field; S is the strain field; and sE is the elastic coefficient.
D = dT + εTE
S = sET + dE
Gu et al. [3] studied the monitoring of the health of circular concrete columns to determine their structural performance under earthquake loading by analyzing the responses of piezoelectric ceramic transducers. Liao et al. [4] observed the structural damage status, including the degree and location of cracking damage, of in situ SHM using post-embedded piezoelectric sensors on RC bridge piers in Taiwan under reversed cyclic excitation. Chang et al. [5] investigated the effectiveness of piezoceramic transducers for monitoring structural health and developed a damage level index for multi-story RC frame structures in a shake table test. Liao and Jean [1] studied the properties of structurally damaged RC shear walls with shear failure using the receptivity of piezoceramic transducers under reversed cyclic loading. Recently, Liao et al. [6] applied the SHM method to post-installed shear walls in an RC frame under seismic excitation, and they used post-embedded piezoelectric sensors to identify surface deterioration around the boundary connections among structural elements of retrofitted walls, columns, beams, and foundations. Most such uses for column members under dynamic loading have involved the monitoring of structural health using piezoelectric-based sensors. Chiu et al. [7] used pre-embedded and post-embedded piezoceramic transducers to perform crack-based damage quantification in full-size high-strength RC column specimens under cyclic loading. They found that pre-embedded piezoceramic transducers were more sensitive to maximum residual crack width than were the post-embedded piezoceramic transducers, especially for shear cracks. They also found that piezoceramic transducers are not suitable for the SHM of severely damaged RC columns. The values of the damage indices that were obtained using such sensors were more strongly correlated with crack width. Chiu et al. [7] introduced a normalized damage index, which they referred to as the “crack damage index”, and suggested a limiting value of this damage index at each damage level. Their results revealed that the proposed piezoceramic transducer has potential for use in the SHM of an RC column.
In addition to structural health monitoring, the piezoelectric sensors could be used for seismic stress measurements and bond slip of the steel elements of the RC structure, the detection of bolt loosening, pre-load degradation of the bolt connection, etc. Entropy-based active sensing and the genetic algorithm-based least square support vector machine using PZT sensors have been developed by Wang et al. [8] for detecting the looseness of multi-bolt connections. The smart aggregates (SAs)-based active sensing method was adopted by Qin et al. [9] to study the development of bond slip between the steel plate and concrete of the composite structure. Liang et al. [10] and Zeng et al. [11] also investigated the bond slip behaviors of steel–concrete composite structures using different approaches. The piezoelectric transducer also can be utilized as an energy harvester [12,13,14,15] or passive vibration damping controller [16,17].
For earthquake engineering research, it is essential to evaluate the damage states or to validate the analyzed results by monitoring the structural, internal stress responses during an earthquake. The study of stress monitoring with transducers for structural engineering, aerospace engineering, and robotics has drawn increasing interest from academia and industry. Hou et al. [18,19] proposed a seismic stress sensing system by utilizing the PZT-based smart aggregates to measure the compressive seismic stress and shear stress of low-to-middle-rise RC structures under earthquakes. The force/torque sensors using piezoelectric material for the aerospace engineering application have been developed by Li et al. [20]. Noh et al. [21] proposed a force/torque sensor based on beam theory and optoelectronic technology for robotics. Zhang et al. [22] studied the influence of non-uniform stress fields on seismic stress measuring using PZT-based smart aggregates. Hou et al. [23] presented an in-built piezoelectric-based three-direction stress sensor to monitor the internal normal stresses in three directions, and the finite element analysis was performed to investigate the stress transfer inside the sensor. However, research on the internal force detection of RC structures under dynamic loadings is scarce.
To quantify damage to an RC column member after an earthquake and to elucidate crack development in a column member, the maximum force that was applied on it as a result of the earthquake must be known. Since the measurement of maximum loading in an earthquake is difficult, in this work, piezoceramic sensors were used to quantify the force that was applied to an RC column member under dynamic loading. Piezoelectric effects are sensitive to external vibrations, and this fact can be exploited to detect the applied force in an earthquake. Post-embedded piezoceramic sensors were formed into a distributed intelligent sensor network to measure the force that was applied to an RC column member under earthquake excitation. Eight RC column specimens with various failure modes—flexural, flexural-shear, and shear—were tested under dynamic loading. In the experiment, four post-embedded piezoceramic transducers were used as sensors to detect signal waves. The experimental results revealed a strong correlation between the voltage signals from piezoceramic sensors and the applied force that was induced by the dynamic actuator. Based on the experimental results, a method for estimating the maximum applied force on RC column members in an earthquake is proposed. In the future, piezoceramic transducers can be used to measure the maximum applied force on an RC column member in an earthquake and to quantify the maximum crack width following the earthquake. These two pieces of information can be combined to quantify damage and the corresponding reduction factors of strength, stiffness, and energy dissipation capacity.
2. Materials and Work Method
2.1. Materials
Eight RC column specimens with various failure modes, i.e., flexural, flexural-shear, and shear failure modes, were tested under dynamic seismic loading. In general, for an RC column member under an applied lateral loading, its mechanical behavior is dominated by the flexural capacity and shear capacity. If the flexural capacity that is mainly contributed by the main bars dominates the mechanical behavior of the member, the failure pattern is defined as the flexural failure mode. If the shear capacity that is mainly contributed by the transverse reinforcement dominates the mechanical behavior of the member, the failure pattern is defined as the shear failure mode. In addition to the flexural and shear failure modes, for an RC column member, if the yielding point of the main bars exits under an applied lateral loading and its deformation capacity determines the shear failure, it can be classified into the flexural-shear failure mode [24]. The height of the specimens was 180 cm and their cross-sectional area was 40 × 40 cm. The actual compressive strength of the concrete was 22—24 MPa. The main bars were SD420 of D22, and the stirrups were SD280 of D10. The specimens had the same tensile reinforcement ratio. Three stirrup ratios were used to examine the seismic reduction factors of the column specimens with three failure modes, which were flexural failure, flexural-shear failure, and shear failure. Table 1 provides detailed information about each specimen. The naming convention for specimens of this work includes three items. The first item represents the expected failure mode, the middle item represents the stirrup spacing, and the last item represents a specified damage level induced by dynamic loading.
In the experiment, since each specimen was dynamically loaded with displacement control the displacement history of each specimen was obtained from a non-linear analysis of a selected traditional low-rise street house in Taiwan. Therefore, the designed specimens were assumed to be the column members in a selected building structure. Figure 1 shows that the selected building structure had five floors with a horizontal span (four spans in total) of 17.28 m and a longitudinal span (three spans in total) of 13.68 m. The first floor was 3.6 m high, and the other floors were 3 m high. The slab thickness of each floor was 12 cm. The cross-sectional sizes of all columns and the properties of the reinforcement and material in the structure were those of the specimens. These specimens had the same tensile reinforcement ratio. Three stirrup ratios were utilized to distinguish three failure modes, which were flexural failure, flexural-shear failure, and shear failure. Two spacing arrangements of the transverse reinforcement in the specimen section were designed and used in this work, as shown in Figure 2. The building was located on a second-category ordinary site in Jiangjun Dist., Tainan City. Consistent with the seismic design specifications for buildings in Taiwan, the seismic demand of the building was SDS = 0.7 and SD1 = 0.52, and the peak ground acceleration AT was 0.28 g, which are consistent with a design earthquake with a returning period of 475 years.
2.2. Work Method
Figure 3a shows that the dynamic experiment involved a reaction wall, a 50 ton dynamic actuator, and an axial force system. Before the test, a 15 cm × 15 cm grid was painted on the surface of each specimen with white cement. Using an optical measurement system, 34 markers (Figure 3b) were placed on each specimen and the system was set with the three-dimensional coordinates of each marker. The cameras of the 3D measurement system specified a measurement range and captured the marker positions during the loading and unloading process of the specimen. The system transmited the position and orientation data of markers to the application software, and the three-dimensional coordinates of the markers were used to calculate the deformation of each specimen. Displacement gauges were set on the top and bottom of each specimen to measure the displacement of the foundation (Figure 3a). To quantify the damage, the crack widths were measured using a microscope (model: PEAK 2034-100X) with a resolution of 0.01 mm (Figure 3c). Along with the maximum crack width at a specified peak deformation, its corresponding residual crack width at an applied loading of zero was recorded. The crack type and measurement position were determined as described by Chiu et al. [7].
A piezoelectric sensor set consists of a circular piezoceramic disc, a low-frequency paired cable and a BNC (Bayonet Neill-Concelman) connector. Table 2 presents the parameters of the circular piezoelectric transducer, which had a diameter of 20 mm and a thickness of 1 mm. The positive and negative ends of the cable were connected carefully to the sides of a piezoceramic disc electrode and the other free ends were soldered to the BNC adapter (Figure 4). Piezoelectric ceramics are vulnerable to moisture from fresh concrete, so they were sprayed with a thin black layer of waterproof solution. Before the non-shrinkage mortar was sealed, the piezoelectric-based sensor system was inserted into the prepared drill hole at a depth of 80 mm. Figure 5 shows the installation phases and locations of the four sensor units that were embedded in a column specimen. For each specimen under the applied loading system shown in Figure 3d, the moment of a section near the top end of each specimen was relatively lower than that of the other sections. Therefore, in order to avoid the failure of the PZT sensors in the experiment, they were embedded near top end of each specimen.
3. Experiment Results
For each specimen, Figure 6 presents the input displacement signals that were obtained by structural dynamic analysis, and Figure 7 shows the displacement signals that were measured by displacement gauges that were installed on the top part of the specimens under dynamic loading. Since Figure 7 indicates that the measured signals are similar to the input signals, the dynamic loading control satisfies the requirements of the test. Figure 8 plots the relationship between the lateral force and the deformation of each specimen in the experiment under both dynamic and static-cyclic loading. Figure 9 presents the damage pattern of each specimen after dynamic testing.
Figure 8 and Table 3 show the initial yielding point of the reinforcement, the maximum loading point, the concrete falling point, and the final failure point of each specimen under dynamic loading based on experimental data that were obtained using the strain gauges on the reinforcement. According to Table 3, the main bars in all specimens yielded under dynamic loading. In specimens FSF-15S-III, FSF-15S-IV, and SF-30S-III, the transverse reinforcement also yielded under dynamic loading.
In the JBDPA (Japan Building Disaster Prevention Association) guidelines [25,26], the damage levels are clearly defined for vertical members based on the maximum residual crack width and the pattern of damage to the concrete/reinforcement, as shown in Table 4. Figure 10 plots the relationship between the deformation and maximum residual crack width for each specimen. The damage levels defined by the JBDPA guidelines are also indicated in Figure 10.
4. Proposed Method for Detecting Force Applied to a Column Specimen in an Earthquake
4.1. Voltage Signals Generated by Post-Embedded Piezoceramic Sensors under Dynamic Loading
Since the lateral force excitation from the dynamic actuator induced the piezoelectric effect of the post-embedded piezoceramic sensors in each specimen, the sensors produced the voltage signals under the dynamic testing. For Sensor 1 and Sensor 2 in each specimen, charge amplifiers were used to amplify and filter their output signals. Additionally, the charge amplifier was set to a gain of 10 dB, and the frequency range of its band-pass filter was set to between 0.1 Hz and 1 kHz. The data acquisition system with a sampling frequency of 100 Hz was set to record data. The signals that were received by the sensors could not be used directly in the following analysis because the loading machine and the electrical equipment generated noise. Therefore, the frequency ranges of the band-pass filter for the output signal in the analysis was set to the frequency of the input signal 0.5–4 Hz.
Equation (3) was used to calculate the coefficient of correlation between the signals that were obtained using a post-embedded piezoceramic sensor and the force that was applied by the dynamic actuator. As well as the force under dynamic testing, the coefficient of correlation between the voltage signals and the member deformation were evaluated with reference to the same equation (Equation (3)).
where and are the voltage signal from a piezoceramic sensor and its average value, respectively; and and are the force applied by the dynamic actuator and its average value, respectively.
According to Table 5 and Table 6, the voltage signals that were obtained using a post-embedded piezoceramic sensor were more closely correlated with the applied force than with the applied deformation under dynamic testing. Based on these results, the following section examines the relationship between the output signals of a sensor and the applied force under dynamic testing.
4.2. Proposed Method for Estimating Maximum Applied Force under Dynamic Loading
Table 5 provides the coefficients of correlation between the voltage signals that were obtained from a post-embedded piezoceramic sensor and the forces that were applied to a specimen under dynamic loading. According to the table, Sensor 3 and Sensor 4 were more stable than Sensor 1 and Sensor 2 because their voltage signals were not processed by the charge amplifier. Since the charge amplifier in the test had unstable filtering functions, the correlation coefficients of Sensor 1 and Sensor 2 were smaller than those of Sensor 3 and Sensor 4. With respect to all specimens, Figure 11 compares the signals from Sensor 3 and Sensor 4 with the applied forces. When the signals from Sensor 3 and Sensor 4 were normalized using their corresponding maximum values, their waveforms were similar to the normalized applied forces, except for specimen FF-15S-III. For specimens FF-15S-II, FSF-15S-II, FSF-15S-IV, and SF-30S-III, since the coefficients of correlation exceeded 0.9, their normalized signals varied almost exactly with the normalized applied forces. Figure 12 presents a window view of each figure in Figure 11 with a window size set to a period of 60–70 s. Clearly, based on Figure 11 and Figure 12 and Table 5, the post-embedded piezoceramic sensor has the great potential for use in estimating the maximum force applied in an earthquake.
Based on Table 5, specimens with correlation coefficients >0.9 were used to investigate the relationship between the applied force and the voltage signal, as shown in Figure 13. According to that figure, the relationship between the applied force and voltage signal from Sensor 4 was almost linear for each specimen. Furthermore, the regression equation for each specimen is indicated in the corresponding figure and the corresponding slopes were in the range of 357.2–421.1 kN/mV as listed in Table 7. Based on the average measured slope, the applied force on an RC column member in an earthquake can be estimated from the maximum voltage of the signals from the post-embedded piezoceramic sensors. Since limited experimental data were obtained in this work, the proposed method should be confirmed using more full-size specimens.
5. Conclusions
This work investigated the use of post-embedded piezoceramic-based sensors to estimate the applied force on an RC column under seismic loading. Generally, in the damage-controlling design of an RC building structure, the details of the process by which each column member is damaged, including the curves of force vs. deformation, force vs. residual crack width, damage level vs. residual crack width, and damage level vs. deformation relationships, are simulated. In other words, based on the details of the damage process of a column member, post-embedded piezoceramic sensors can be used to detect the maximum force during an earthquake to quantify damage that is caused by the earthquake. The experimental results herein reveal that signal voltages that are measured by piezoceramic sensors are very strongly correlated with the forces that are applied to a specimen. However, since the number of specimens was limited, the issue related to the sensor position was not included in this work. For practical use, how to determine the appropriate sensor position for measuring the maximum applied force under an earthquake should be included in follow-up research.
In the future, piezoceramic transducers can be used to measure the maximum applied force on an RC column member in an earthquake and to determine the maximum crack width following that earthquake. Moreover, these two pieces of information can be used to determine the damage level and the corresponding reduction factors of strength, stiffness, and energy dissipation capacity. For practical use in post-earthquake damage assessment of RC structures, in addition to durability, the wireless transmission and remote data storage of PZT transducers should be developed.
Author Contributions
Conceptualization, C.-K.C. and W.-I.L.; methodology, C.-K.C.; software, C.-H.W.; validation, C.-K.C., W.-I.L., and C.-H.L.; data curation, C.-H.W. and H.-F.S.; writing—original draft preparation, C.-K.C.; writing—review and editing, W.-I.L. All authors have read and agreed to the published version of the manuscript.
Funding
This research was funded by the Minister of Science and Technology (MOST), Taiwan (MOST: 107-2221-E-011 -012 -MY3).
Acknowledgments
The authors gratefully acknowledge the financial support granted by the Minister of Science and Technology (MOST), Taiwan (MOST: 107-2221-E-011 -012 -MY3). The facilities for research provided by the National Center for Research on Earthquake Engineering (NCREE), Taiwan, are also highly appreciated.
Conflicts of Interest
The authors declare no conflict of interest. The funders had no role in the design of the study; in the collection, analyses, or interpretation of data; in the writing of the manuscript, or in the decision to publish the results.
References
- Liao, W.I.; Jean, W.Y. Structural health monitoring for local damages of RC walls using piezoceramic-based sensors under seismic loading. In Proceedings of the Earth and Space 2010: Engineering, Science, Construction, and Operations in Challenging Environments, Honolulu, HI, USA, 14–17 March 2017. [Google Scholar]
- Li, H.; Tian, C.; Deng, Z.D. Energy harvesting from low frequency applications using piezoelectric materials. Appl. Phys. Rev. 2014, 1, 041301. [Google Scholar] [CrossRef] [Green Version]
- Gu, H.; Moslehy, Y.; Sanders, D.; Song, G.; Mo, Y.L. Multi-functional smart aggregate-based structural health monitoring of circular reinforced concrete columns subjected to seismic excitations. Smart Mater. Struct. 2010, 19, 065026. [Google Scholar] [CrossRef]
- Liao, W.I.; Wang, J.X.; Song, G.; Gu, H.; Olmi, C.; Mo, Y.L.; Chang, K.C.; Loh, C.H. Structural health monitoring of concrete columns subjected to seismic excitations using piezoceramic-based sensors. Smart Mater. Struct. 2011, 20, 125015. [Google Scholar] [CrossRef]
- Chang, W.; Chai, J.F.; Liao, W.I. Structural health monitoring of a concrete frame subjected to shake table excitations using smart aggregates. In Proceedings of the Pressure Vessels & Piping Conference, Anaheim, CA, USA, 20–24 July 2014. [Google Scholar]
- Liao, W.I.; Hsiao, F.P.; Chiu, C.K.; Ho, C.E. Structural health monitoring and interface damage detection for infill reinforced concrete walls in seismic retrofit of reinforced concrete frames using piezoceramic-based transducers under the cyclic loading. Appl. Sci. 2019, 9, 312. [Google Scholar] [CrossRef] [Green Version]
- Chiu, C.K.; Sung, H.F.; Chi, K.N.; Hsiao, F.P. Experimental Quantification on the Residual Seismic Capacity of Damaged RC Column Members. Int. J. Concr. Struct. Mater. 2019, 13, 17. [Google Scholar] [CrossRef]
- Wang, F.; Chen, Z.; Song, G. Monitoring of multi-bolt connection looseness using entropy-based active sensing and genetic algorithm-based least square support vector machine. Mech. Syst. Signal Proc. 2020, 136, 106507. [Google Scholar] [CrossRef]
- Qin, F.; Kong, Q.; Li, M.; Mo, Y.L.; Song, G.; Fan, F. Bond slip detection of steel plate and concrete beams using smart aggregates. Smart Mater. Struct. 2015, 24, 115039. [Google Scholar] [CrossRef]
- Liang, Y.; Li, D.; Parvasi, S.M.; Kong, Q.; Lim, I.; Song, G. Bond-slip detection of concrete-encased composite structure using electro-mechanical impedance technique. Smart Mater. Struct. 2016, 25, 095003. [Google Scholar] [CrossRef]
- Zeng, L.; Parvasi, S.M.; Kong, Q.; Huo, L.; Lim, I.; Li, M.; Song, G. Bond slip detection of concrete-encased composite structure using shear wave based active sensing approach. Smart Mater. Struct. 2015, 24, 125026. [Google Scholar] [CrossRef]
- Guyomar, D.; Badel, A.; Lefeuvre, E.; Richard, C. Toward energy harvesting using active materials and conversion improvement by nonlinear processing. IEEE Trans. Ultrason. Ferroelectr. Freq. Control 2005, 52, 584–595. [Google Scholar] [CrossRef] [Green Version]
- Wang, G. Analysis of bimorph piezoelectric beam energy harvesters using Timoshenko and Euler-Bernoulli beam theory. J. Intell. Mater. Syst. Struct. 2013, 24, 226–239. [Google Scholar] [CrossRef]
- Lefeuvre, E.; Badel, A.; Richard, C.; Petit, L.; Guyomar, D. A comparison between several vibration-powered piezoelectric generators for standalone systems. Sensors Actuators A Phys. 2009, 126, 405–416. [Google Scholar] [CrossRef]
- Yan, B.; Zhang, S.W.; Zhang, X.N.; Wang, K.; Wu, C.Y. Self-powered electromagnetic energy harvesting for the low power consumption electronics: Design and experiment. Int. J. Appl. Electromagn. Mech. 2017, 54, 165–175. [Google Scholar] [CrossRef]
- Corr, L.R.; Clark, W.W. A Novel SemiActive Multi-Modal Vibration Control Law for a Piezoceramic Actuator. J. Vib. Acoust. 2003, 125, 214–222. [Google Scholar] [CrossRef]
- Niederberger, D.; Fleming, A.; Moheimani, S.O.R.; Morari, M. Adaptive multi-mode resonant piezoelectric shunt damping. Smart Mater. Struct. 2004, 13, 1025. [Google Scholar] [CrossRef] [Green Version]
- Hou, S.; Zhang, H.B.; Ou, J.P. A PZT-based smart aggregate for compressive seismic stress monitoring. Smart Mater. Struct. 2012, 21, 105035. [Google Scholar] [CrossRef]
- Hou, S.; Zhang, H.B.; Ou, J.P. A PZT-based smart aggregate for seismic shear stress monitoring. Smart Mater. Struct. 2013, 22, 65012. [Google Scholar] [CrossRef]
- Li, Y.; Wang, G.; Yang, X. Research on static decoupling algorithm for piezoelectric six axis force/torque sensor based on LSSVR fusion algorithm. Mech. Syst. Signal Proc. 2018, 110, 509–520. [Google Scholar] [CrossRef]
- Noh, Y.; Bimbo, J.; Sareh, S. Multi-axis force/torque sensor based on simply-supported beam and optoelectro- nics. Sensors 2016, 16, 1936. [Google Scholar] [CrossRef] [PubMed] [Green Version]
- Zhang, H.B.; Hou, S.; Ou, J.P. SA-based concrete seismic stress monitoring: The influence of non-uniform stress fields. Eng. Struct. 2019, 190, 66–75. [Google Scholar] [CrossRef]
- Hou, S.; Cui, L.L.; Xu, X. A piezoelectric-based three-direction normal stress sensor for concrete structures. J. Intell. Mater. Syst. Struct. 2019, 30, 1858–1867. [Google Scholar] [CrossRef]
- ASCE (American Society of Civil Engineers). Seismic Rehabilitation of Existing Buildings (ASEC-41); ASCE: Reston, VA, USA, 2006. [Google Scholar]
- JBDPA (Japan Building Disaster Prevention Association). Guideline for Post-Earthquake Damage Evaluation and Rehabilitation; JBDPA: Tokyo, Japan, 2001. [Google Scholar]
- JBDPA (Japan Building Disaster Prevention Association). Standard for Seismic Evaluation of Existing Reinforced Concrete Buildings, Guidelines for Seismic Retrofit of Existing Reinforced Concrete Buildings, and Technical Manual for Seismic Evaluation and Seismic Retrofit of Existing Reinforced Concrete Buildings; JBDPA: Tokyo, Japan, 2015. [Google Scholar]
Figure 1.
Finite element model and detailed information about the selected building.

Figure 2.
Detailed arrangement of the reinforcements of the specimen in Chiu et al. [7]. (a) Flexural failure (FF) (S = 150 mm); (b) flexural-shear failure (FSF) (S = 150 mm), shear failure (SF) (S = 300 mm).
Figure 2.
Detailed arrangement of the reinforcements of the specimen in Chiu et al. [7]. (a) Flexural failure (FF) (S = 150 mm); (b) flexural-shear failure (FSF) (S = 150 mm), shear failure (SF) (S = 300 mm).
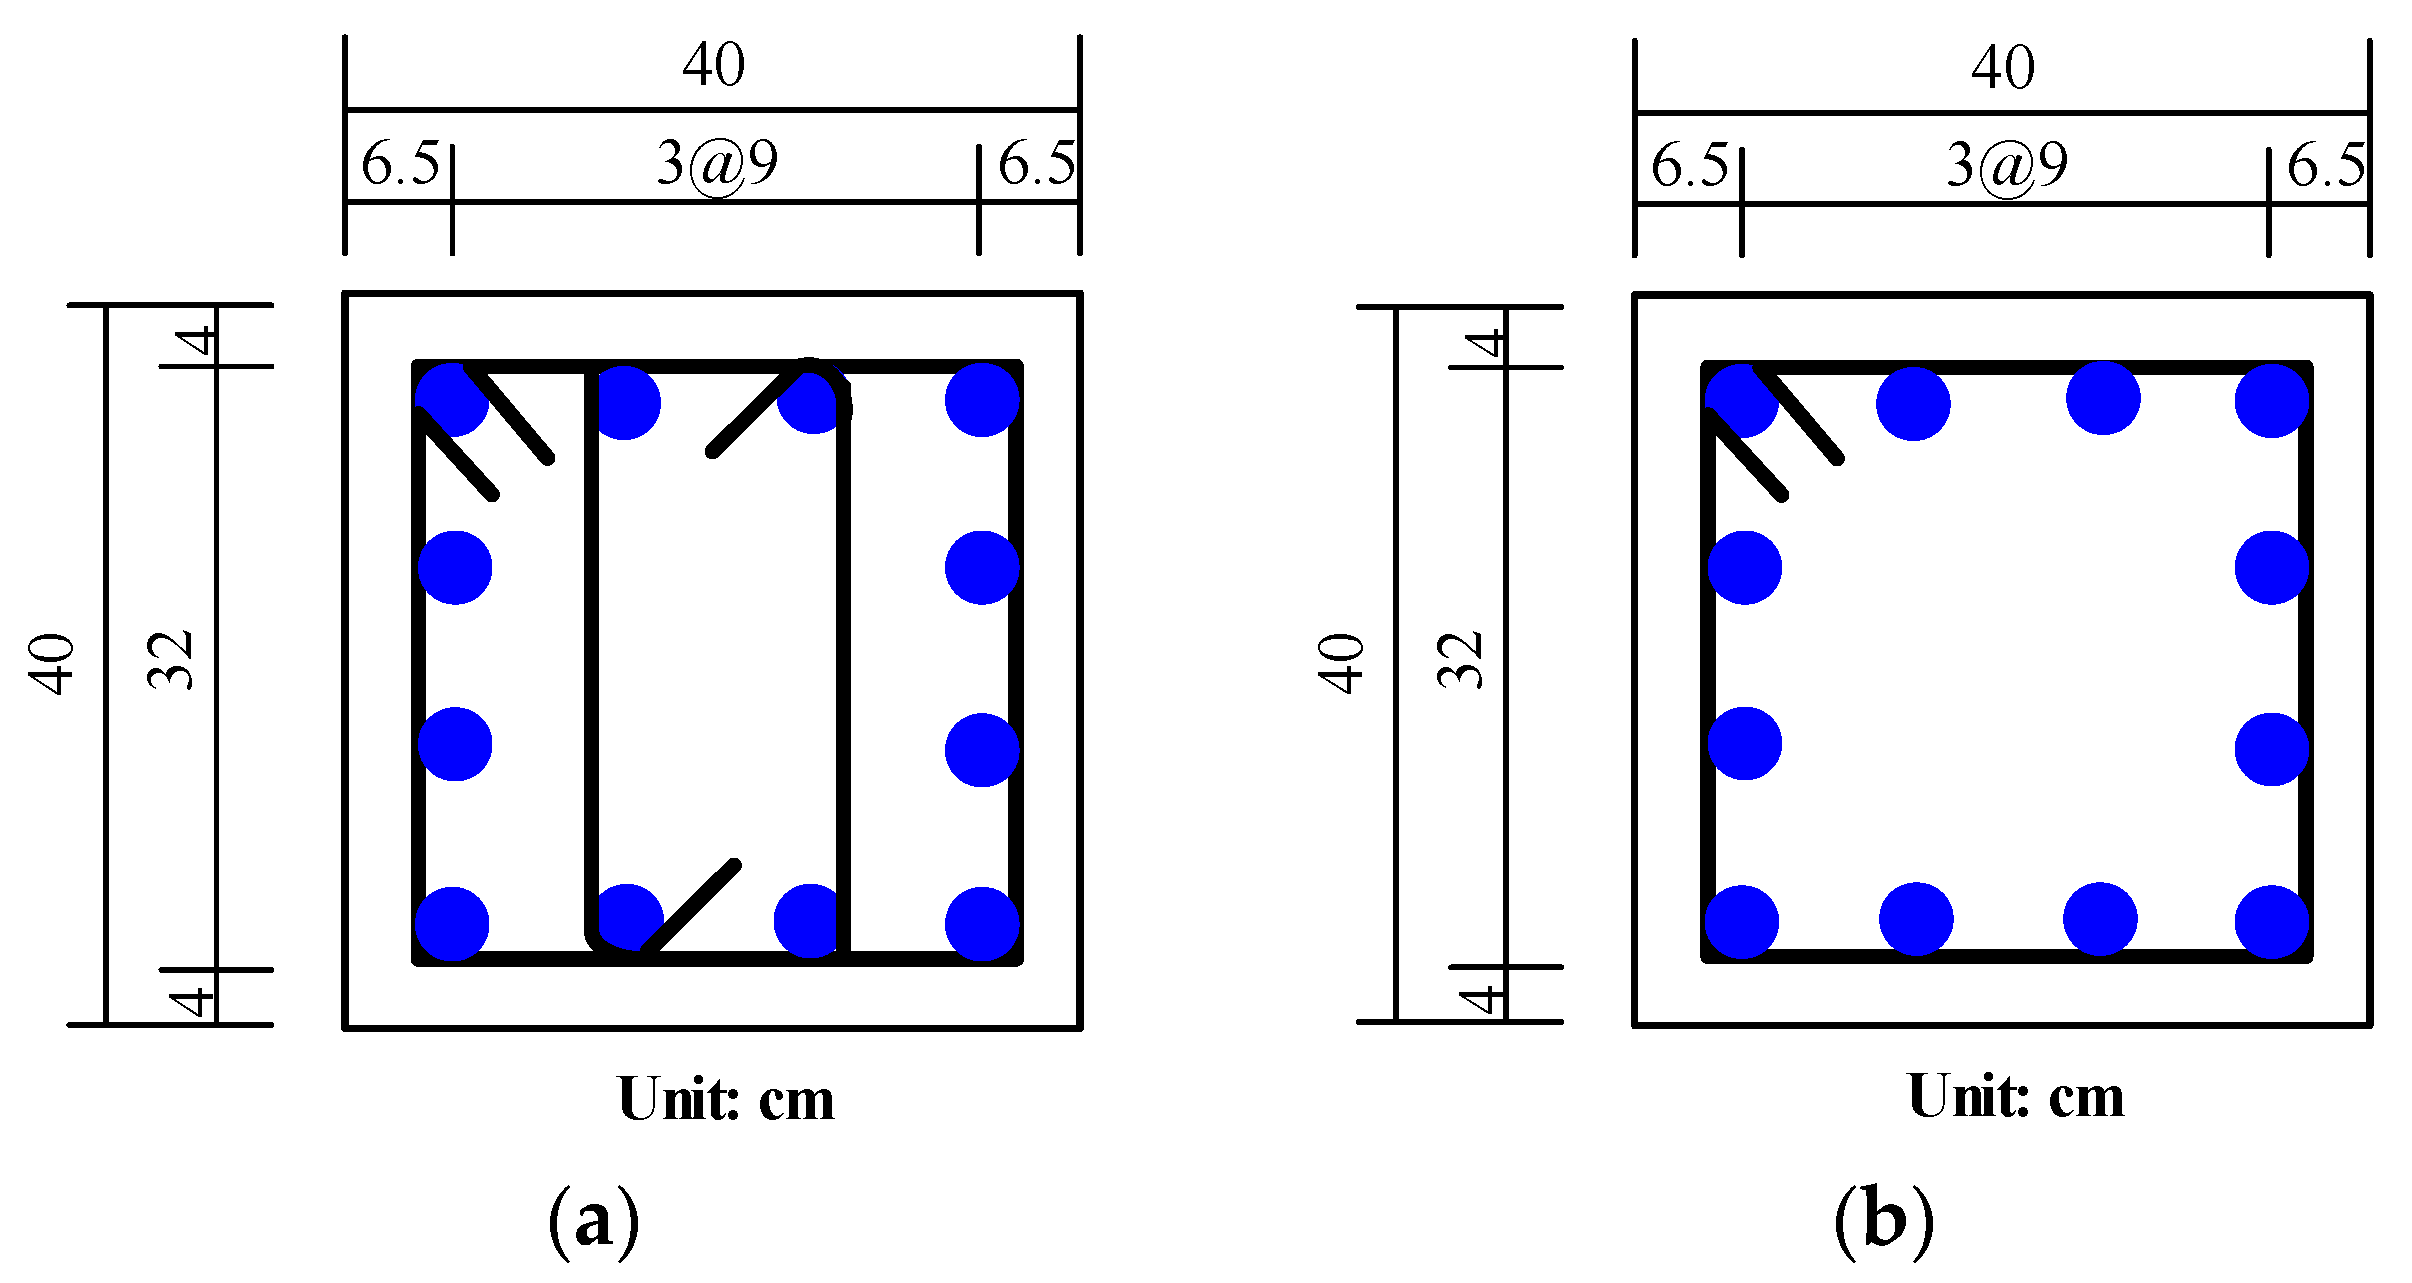
Figure 3.
Experimental set up and positions of markers. (a) Specimen setup; (b) Markers of the optical measuring system; (c) Microscope; (d) Detail of testing setup.
Figure 3.
Experimental set up and positions of markers. (a) Specimen setup; (b) Markers of the optical measuring system; (c) Microscope; (d) Detail of testing setup.
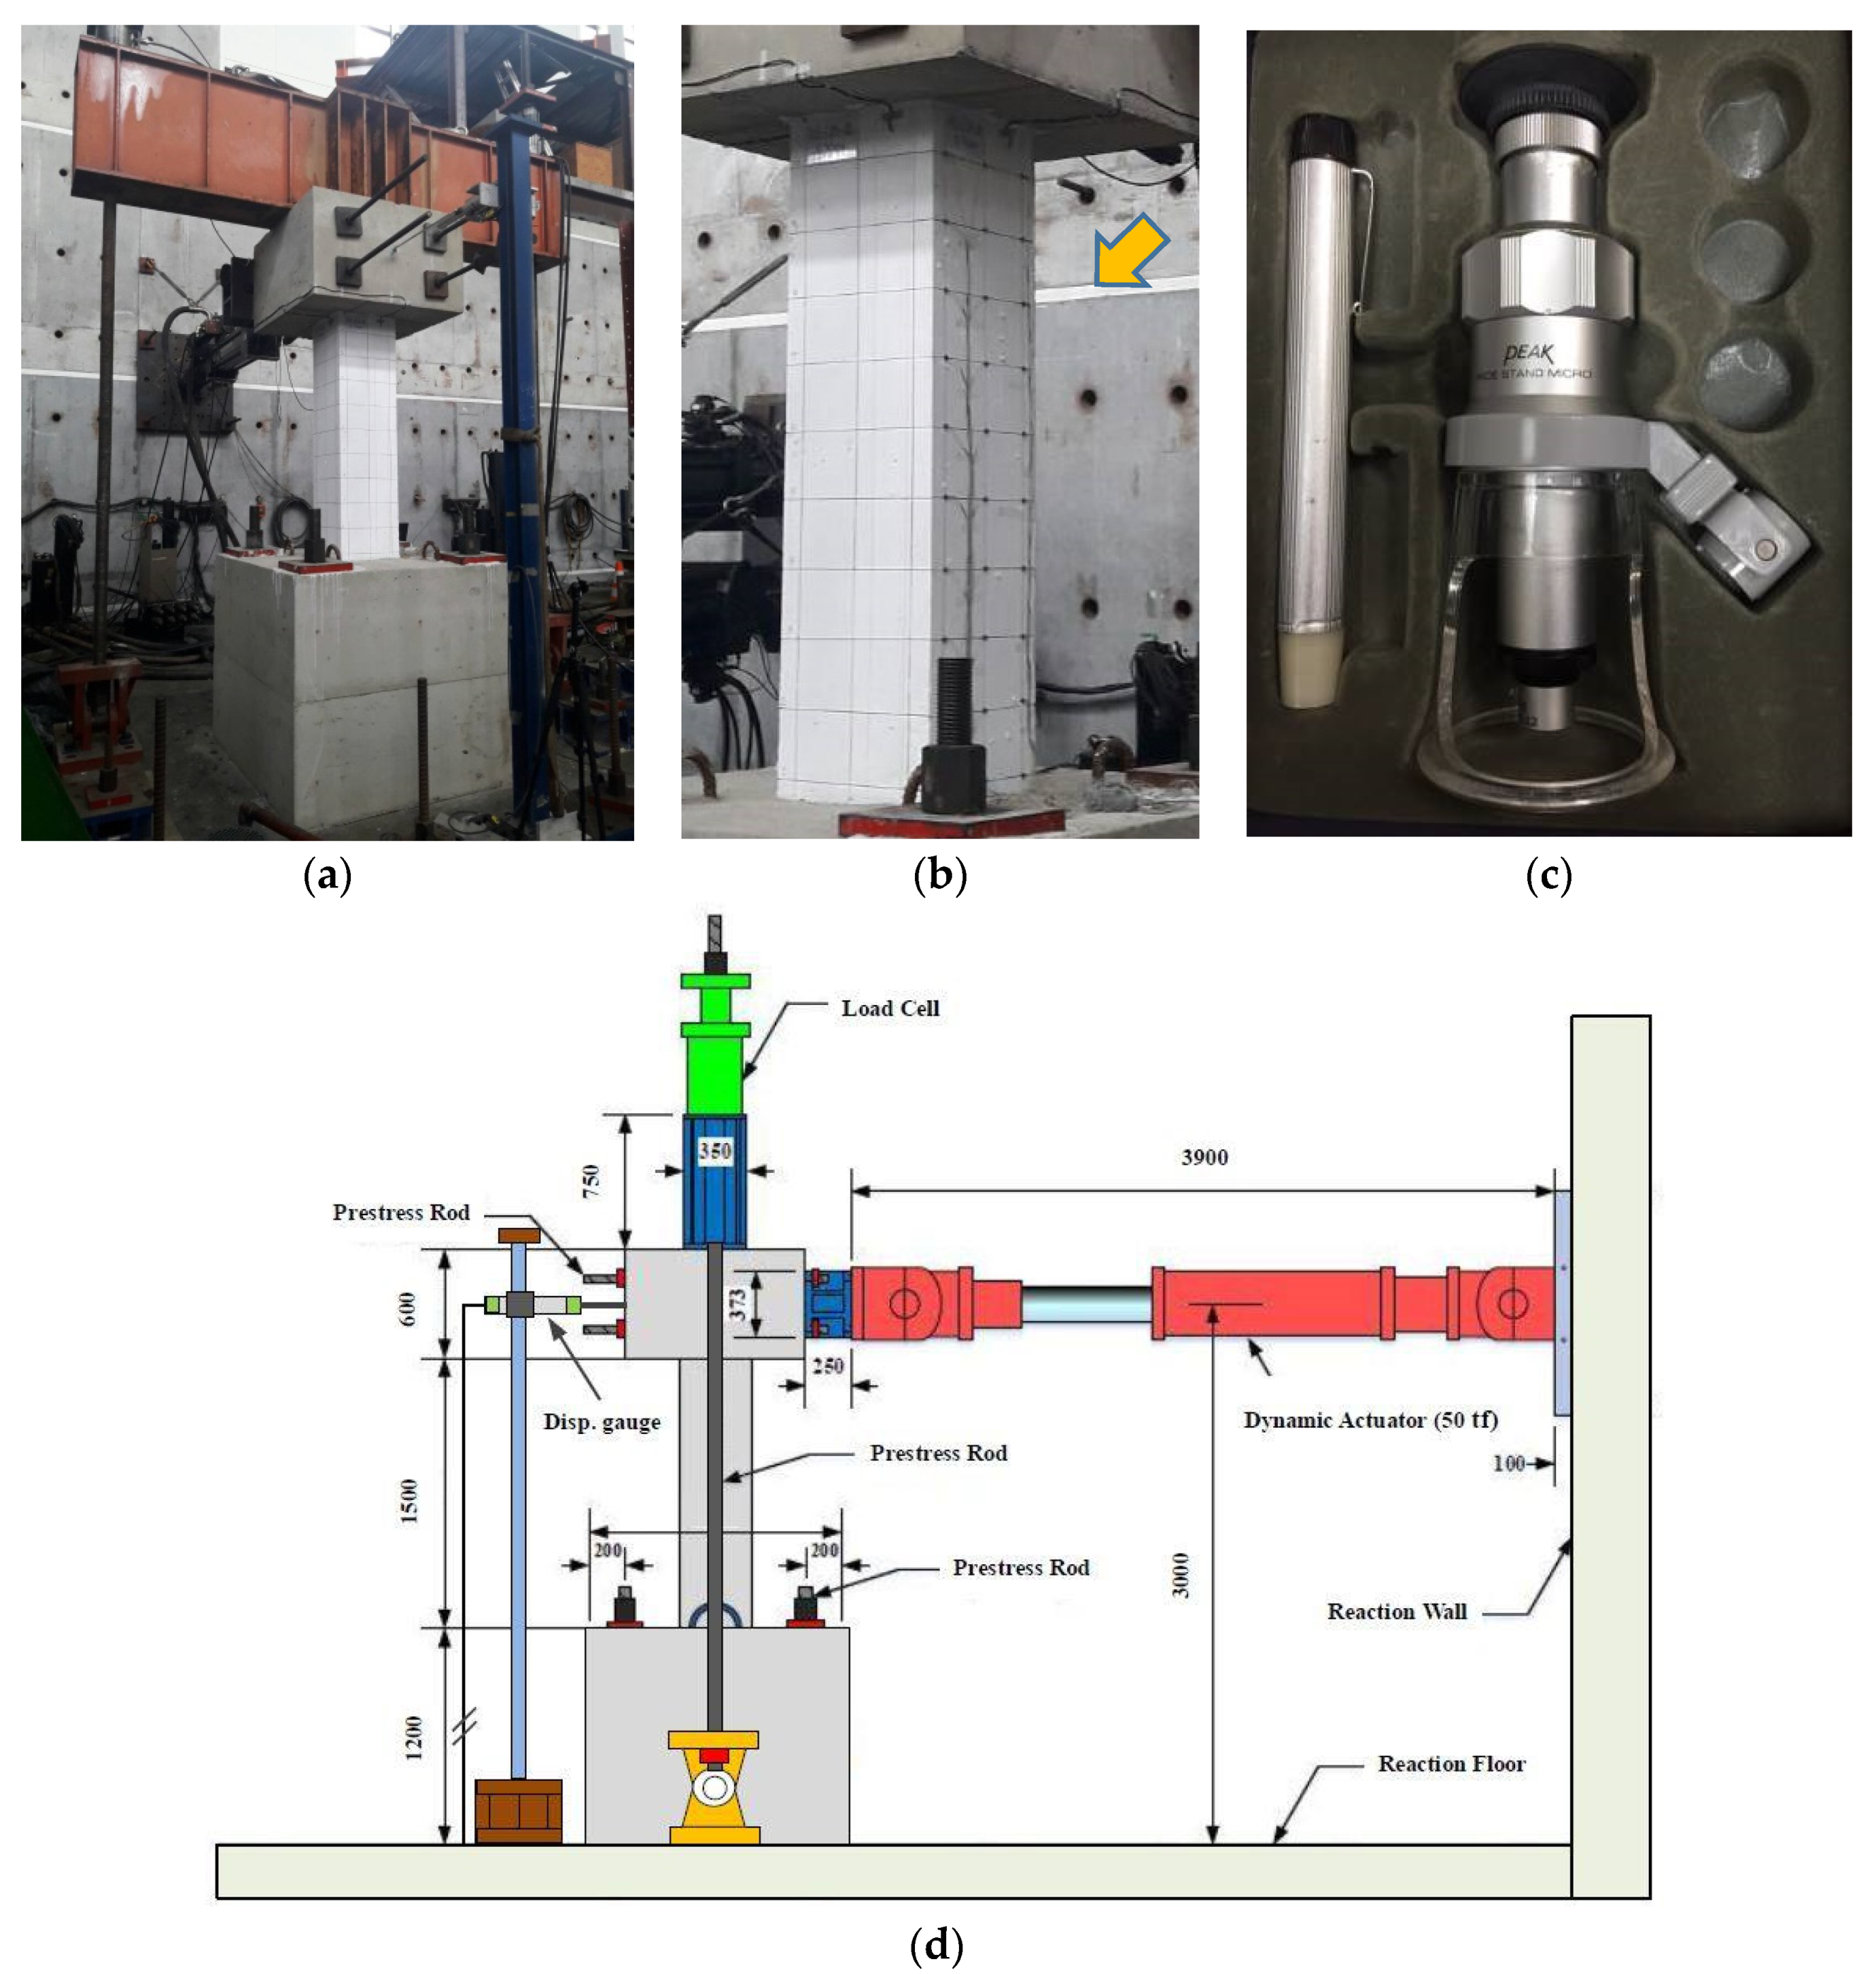
Figure 4.
Piezoelectric sensor and the drilled and post-sealed bore hole.
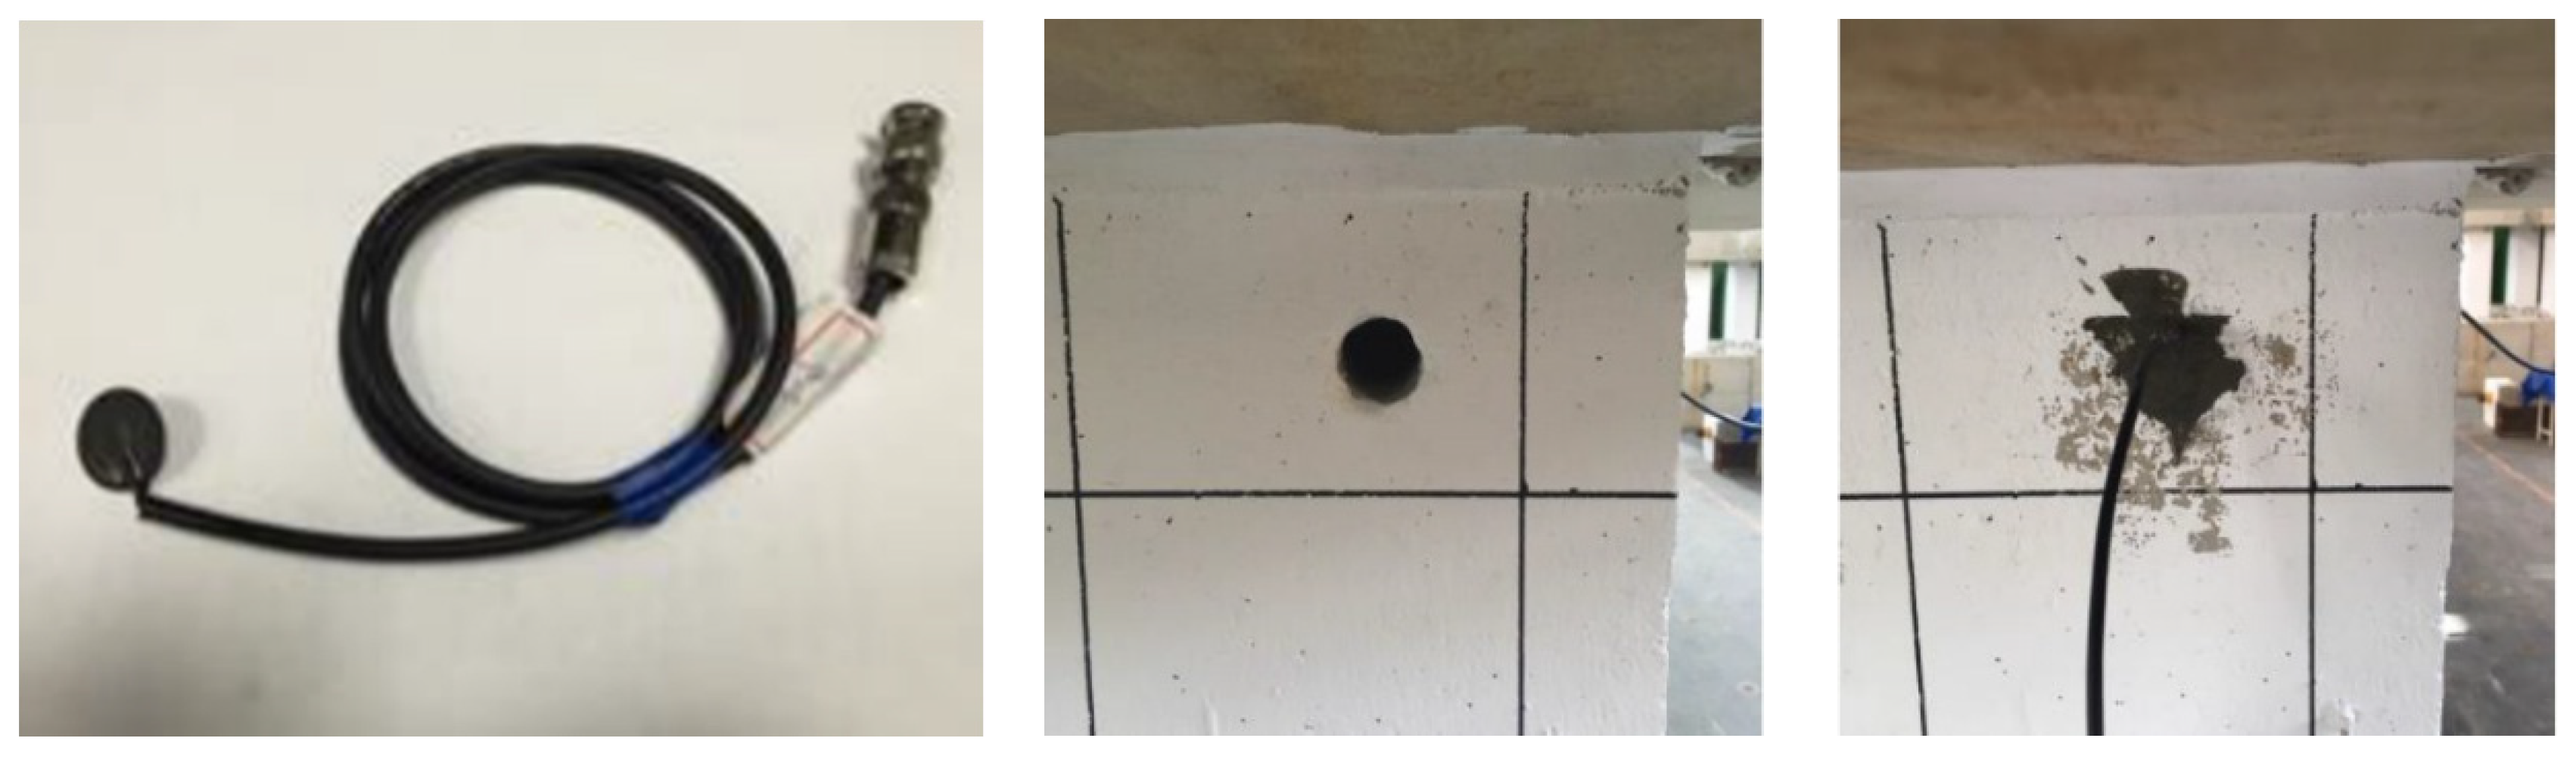
Figure 5.
Locations of sensors and configuration of specimen (unit: cm).
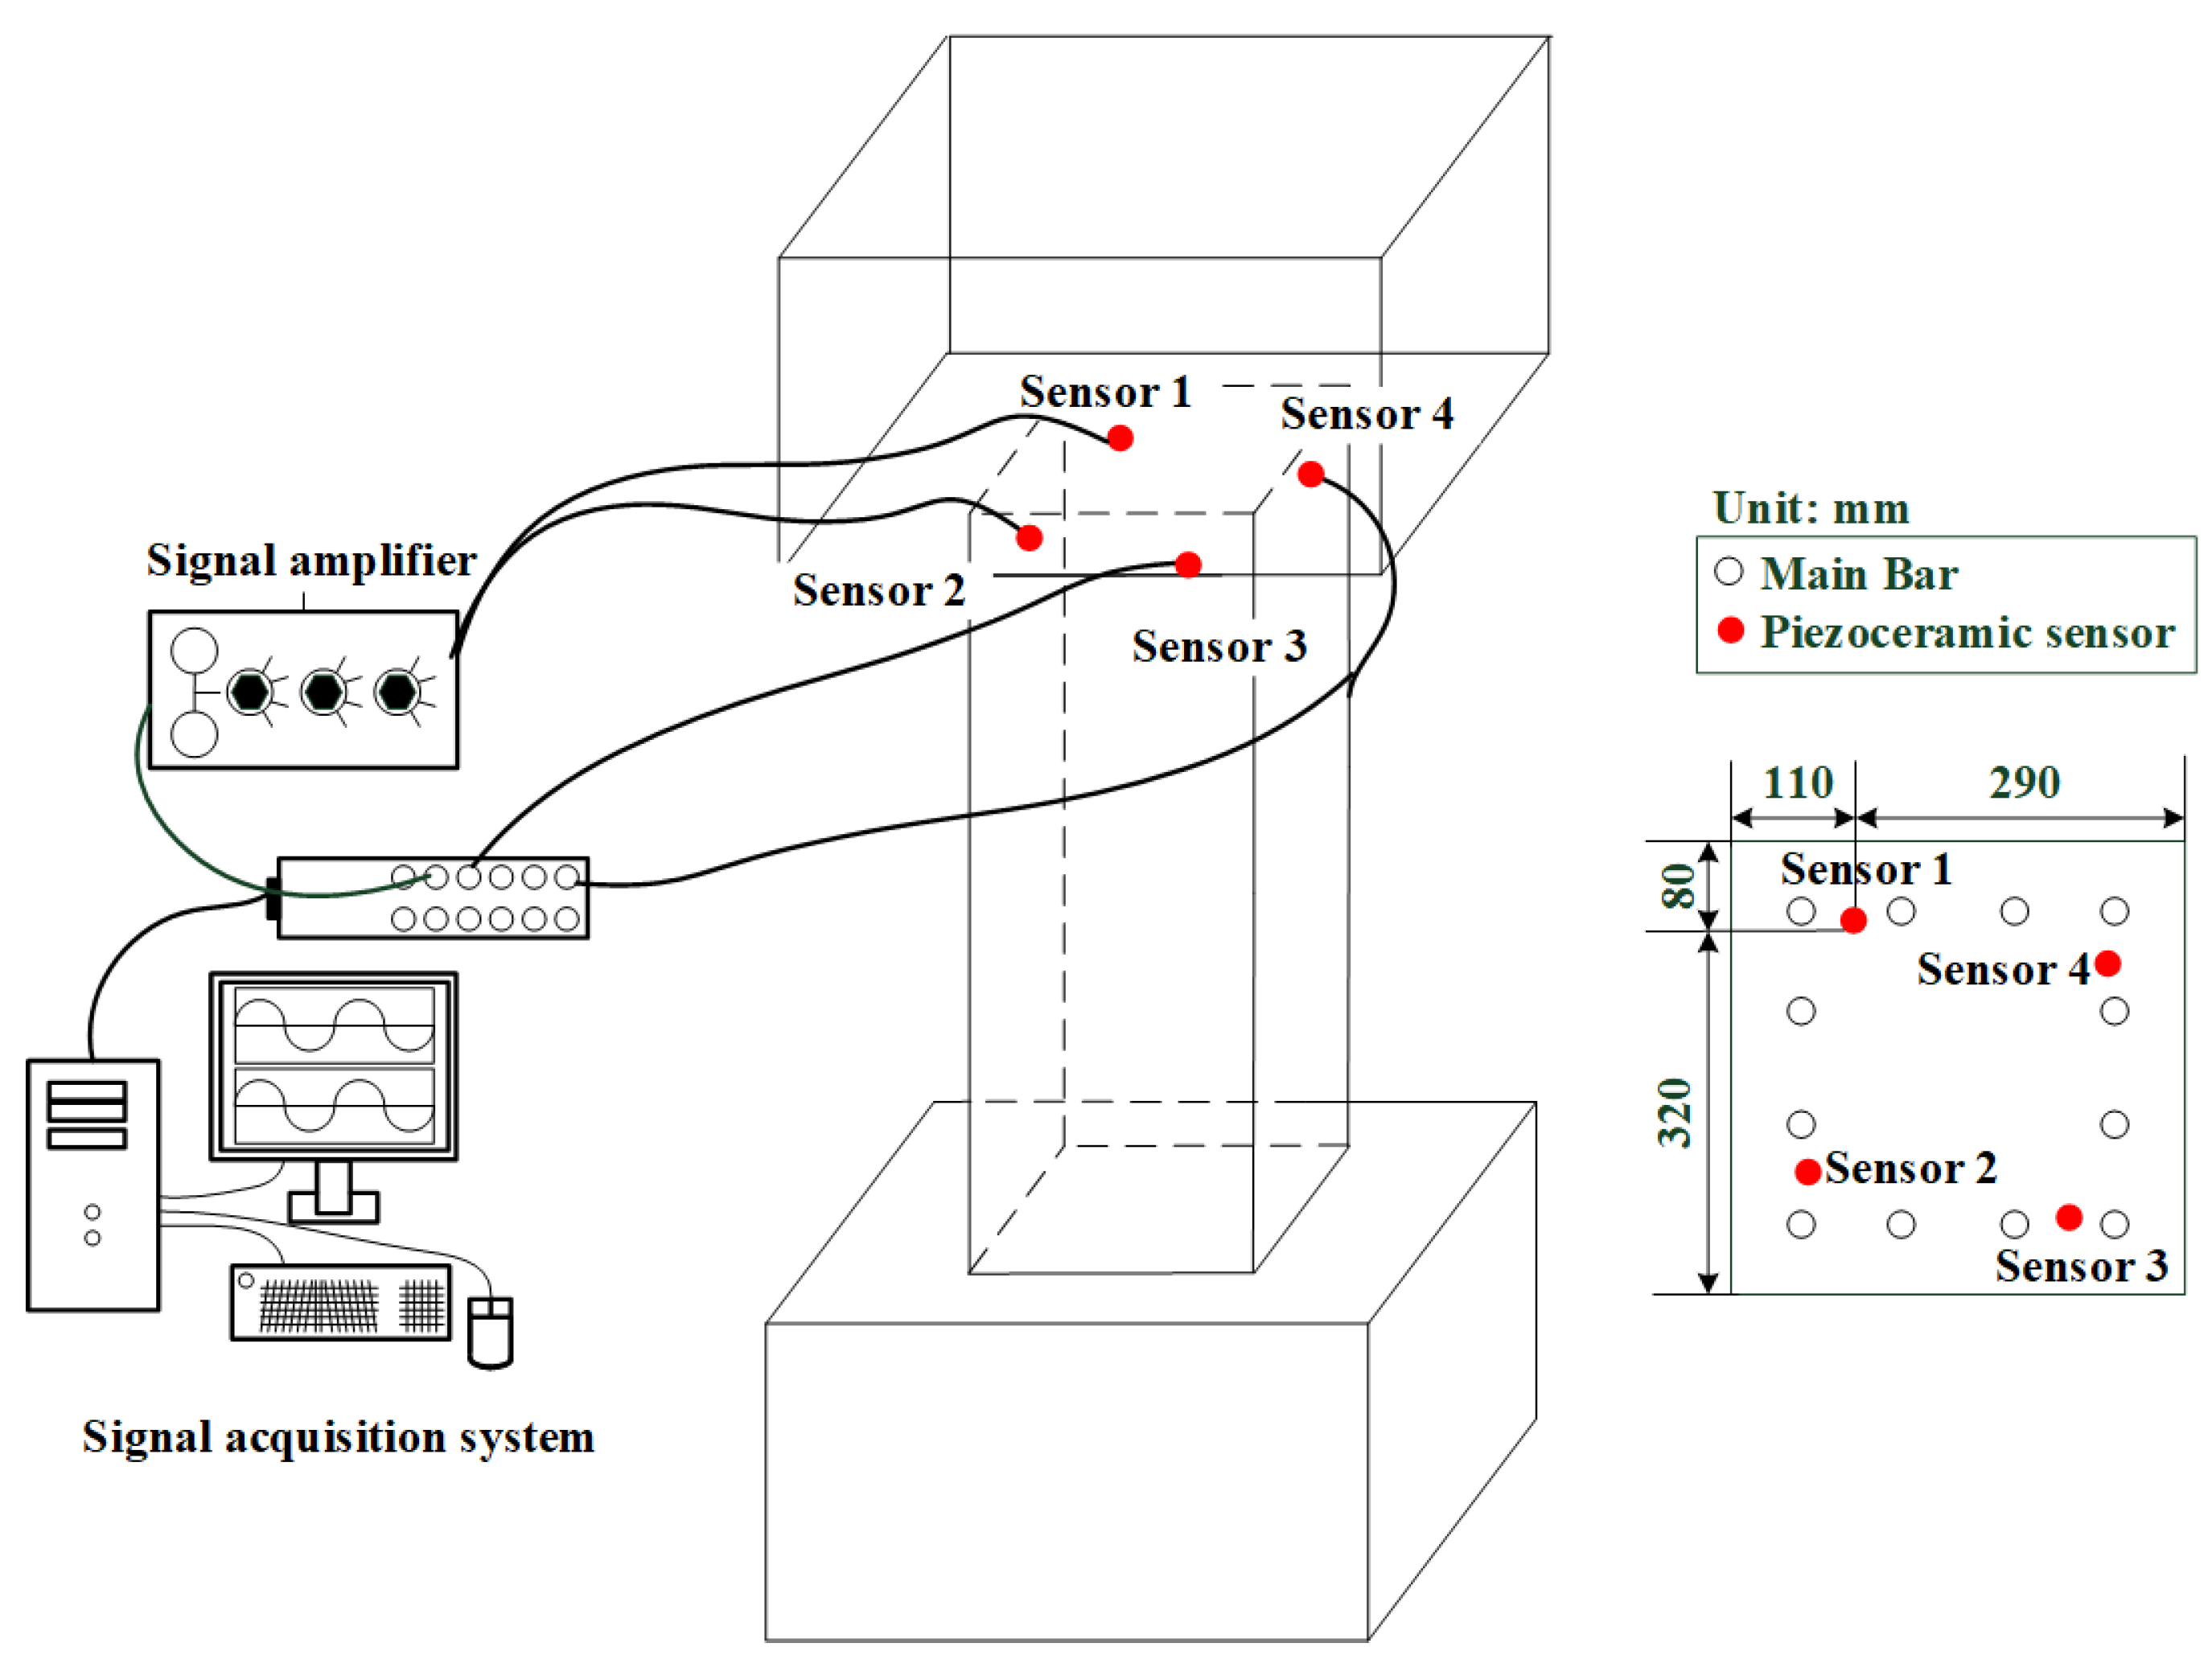
Figure 6.
Seismic displacement control applied to column structures.
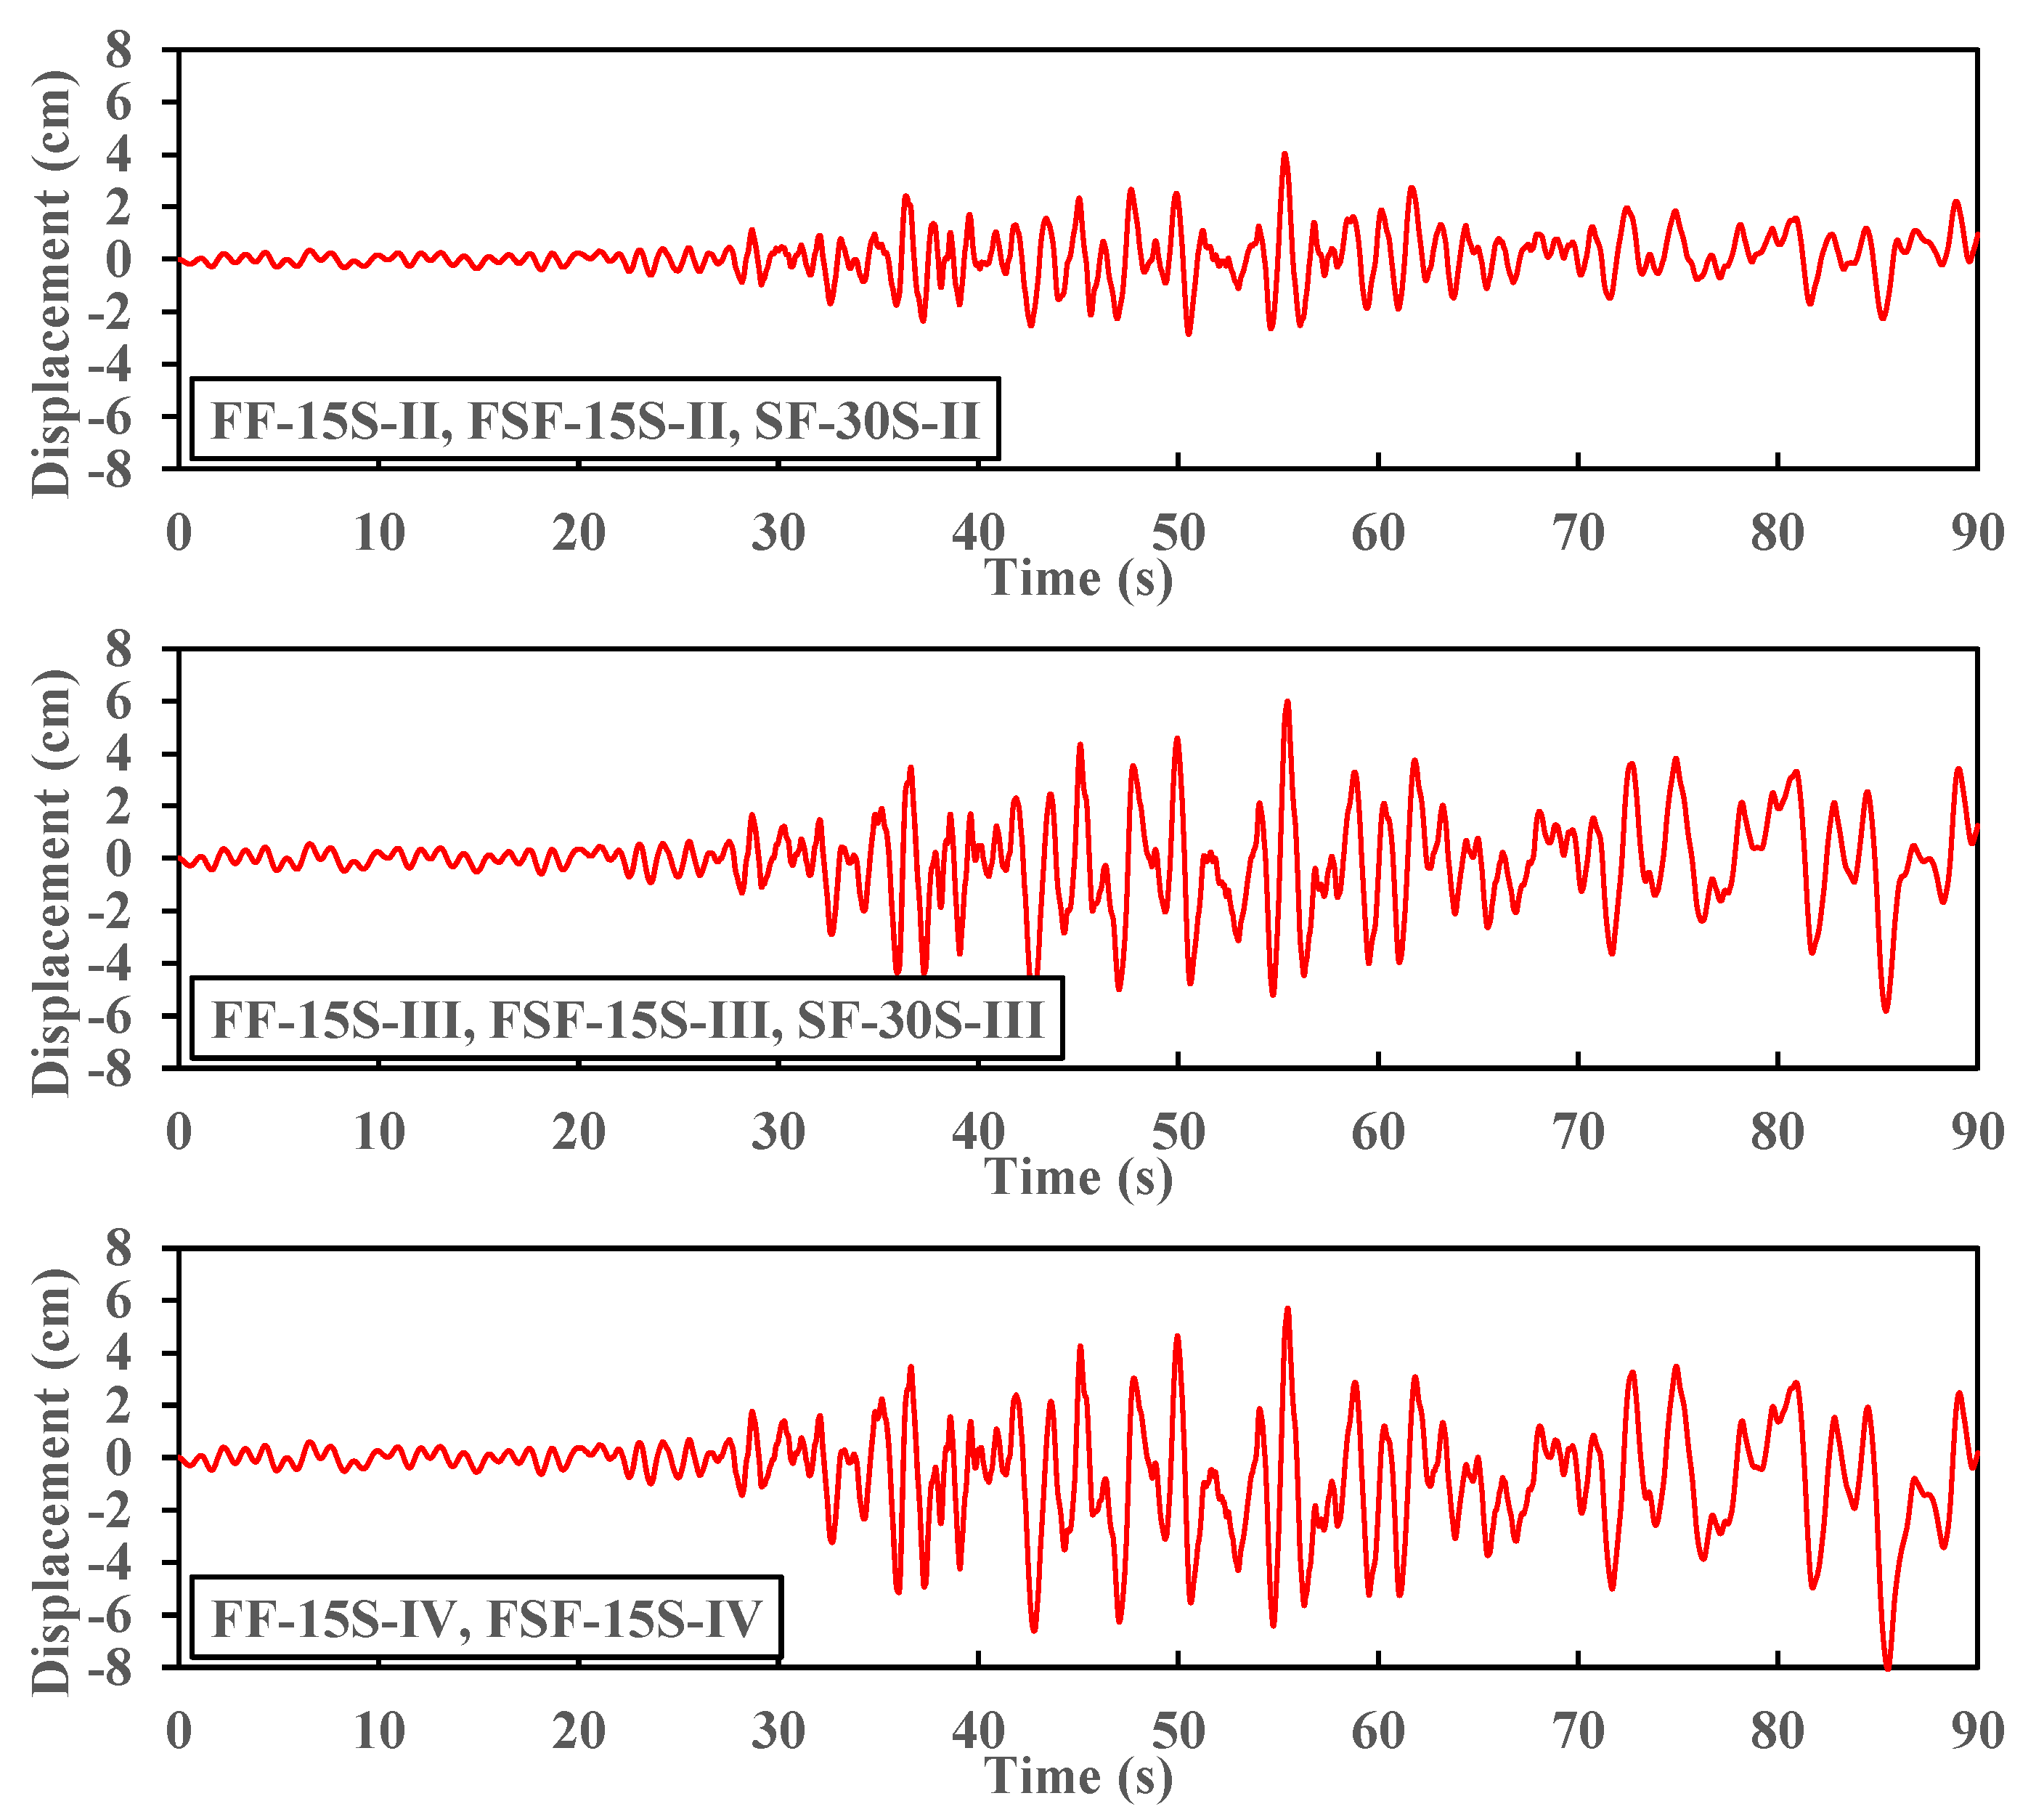
Figure 7.
Comparison of input and output displacement histories. (a) Displacement = 4 cm; (b) Displacement = 6 cm; (c) Displacement = 8 cm.
Figure 7.
Comparison of input and output displacement histories. (a) Displacement = 4 cm; (b) Displacement = 6 cm; (c) Displacement = 8 cm.
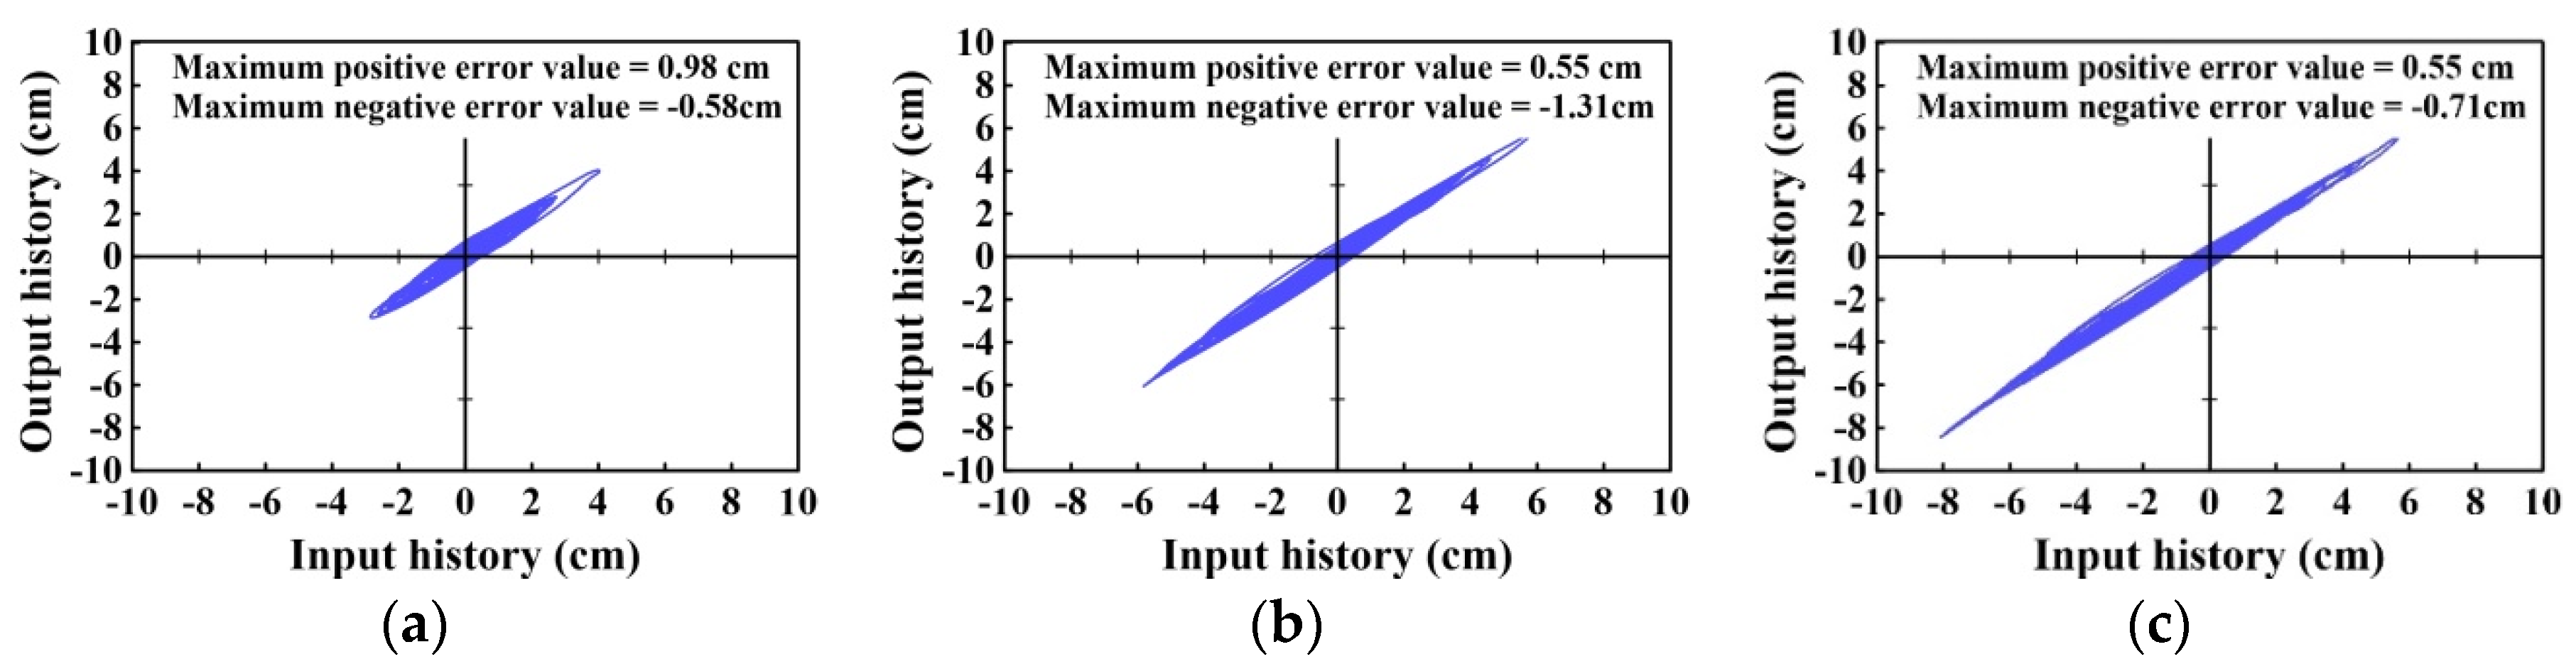
Figure 8.
Relationship between lateral force and deformation of each specimen. (a) FF-15S-II; (b) FF-15S-III; (c) FF-15S-IV; (d) FSF-15S-II; (e) FSF-15S-III; (f) FSF-15S-IV; (g) SF-30S-II; (h) SF-30S-III.
Figure 8.
Relationship between lateral force and deformation of each specimen. (a) FF-15S-II; (b) FF-15S-III; (c) FF-15S-IV; (d) FSF-15S-II; (e) FSF-15S-III; (f) FSF-15S-IV; (g) SF-30S-II; (h) SF-30S-III.
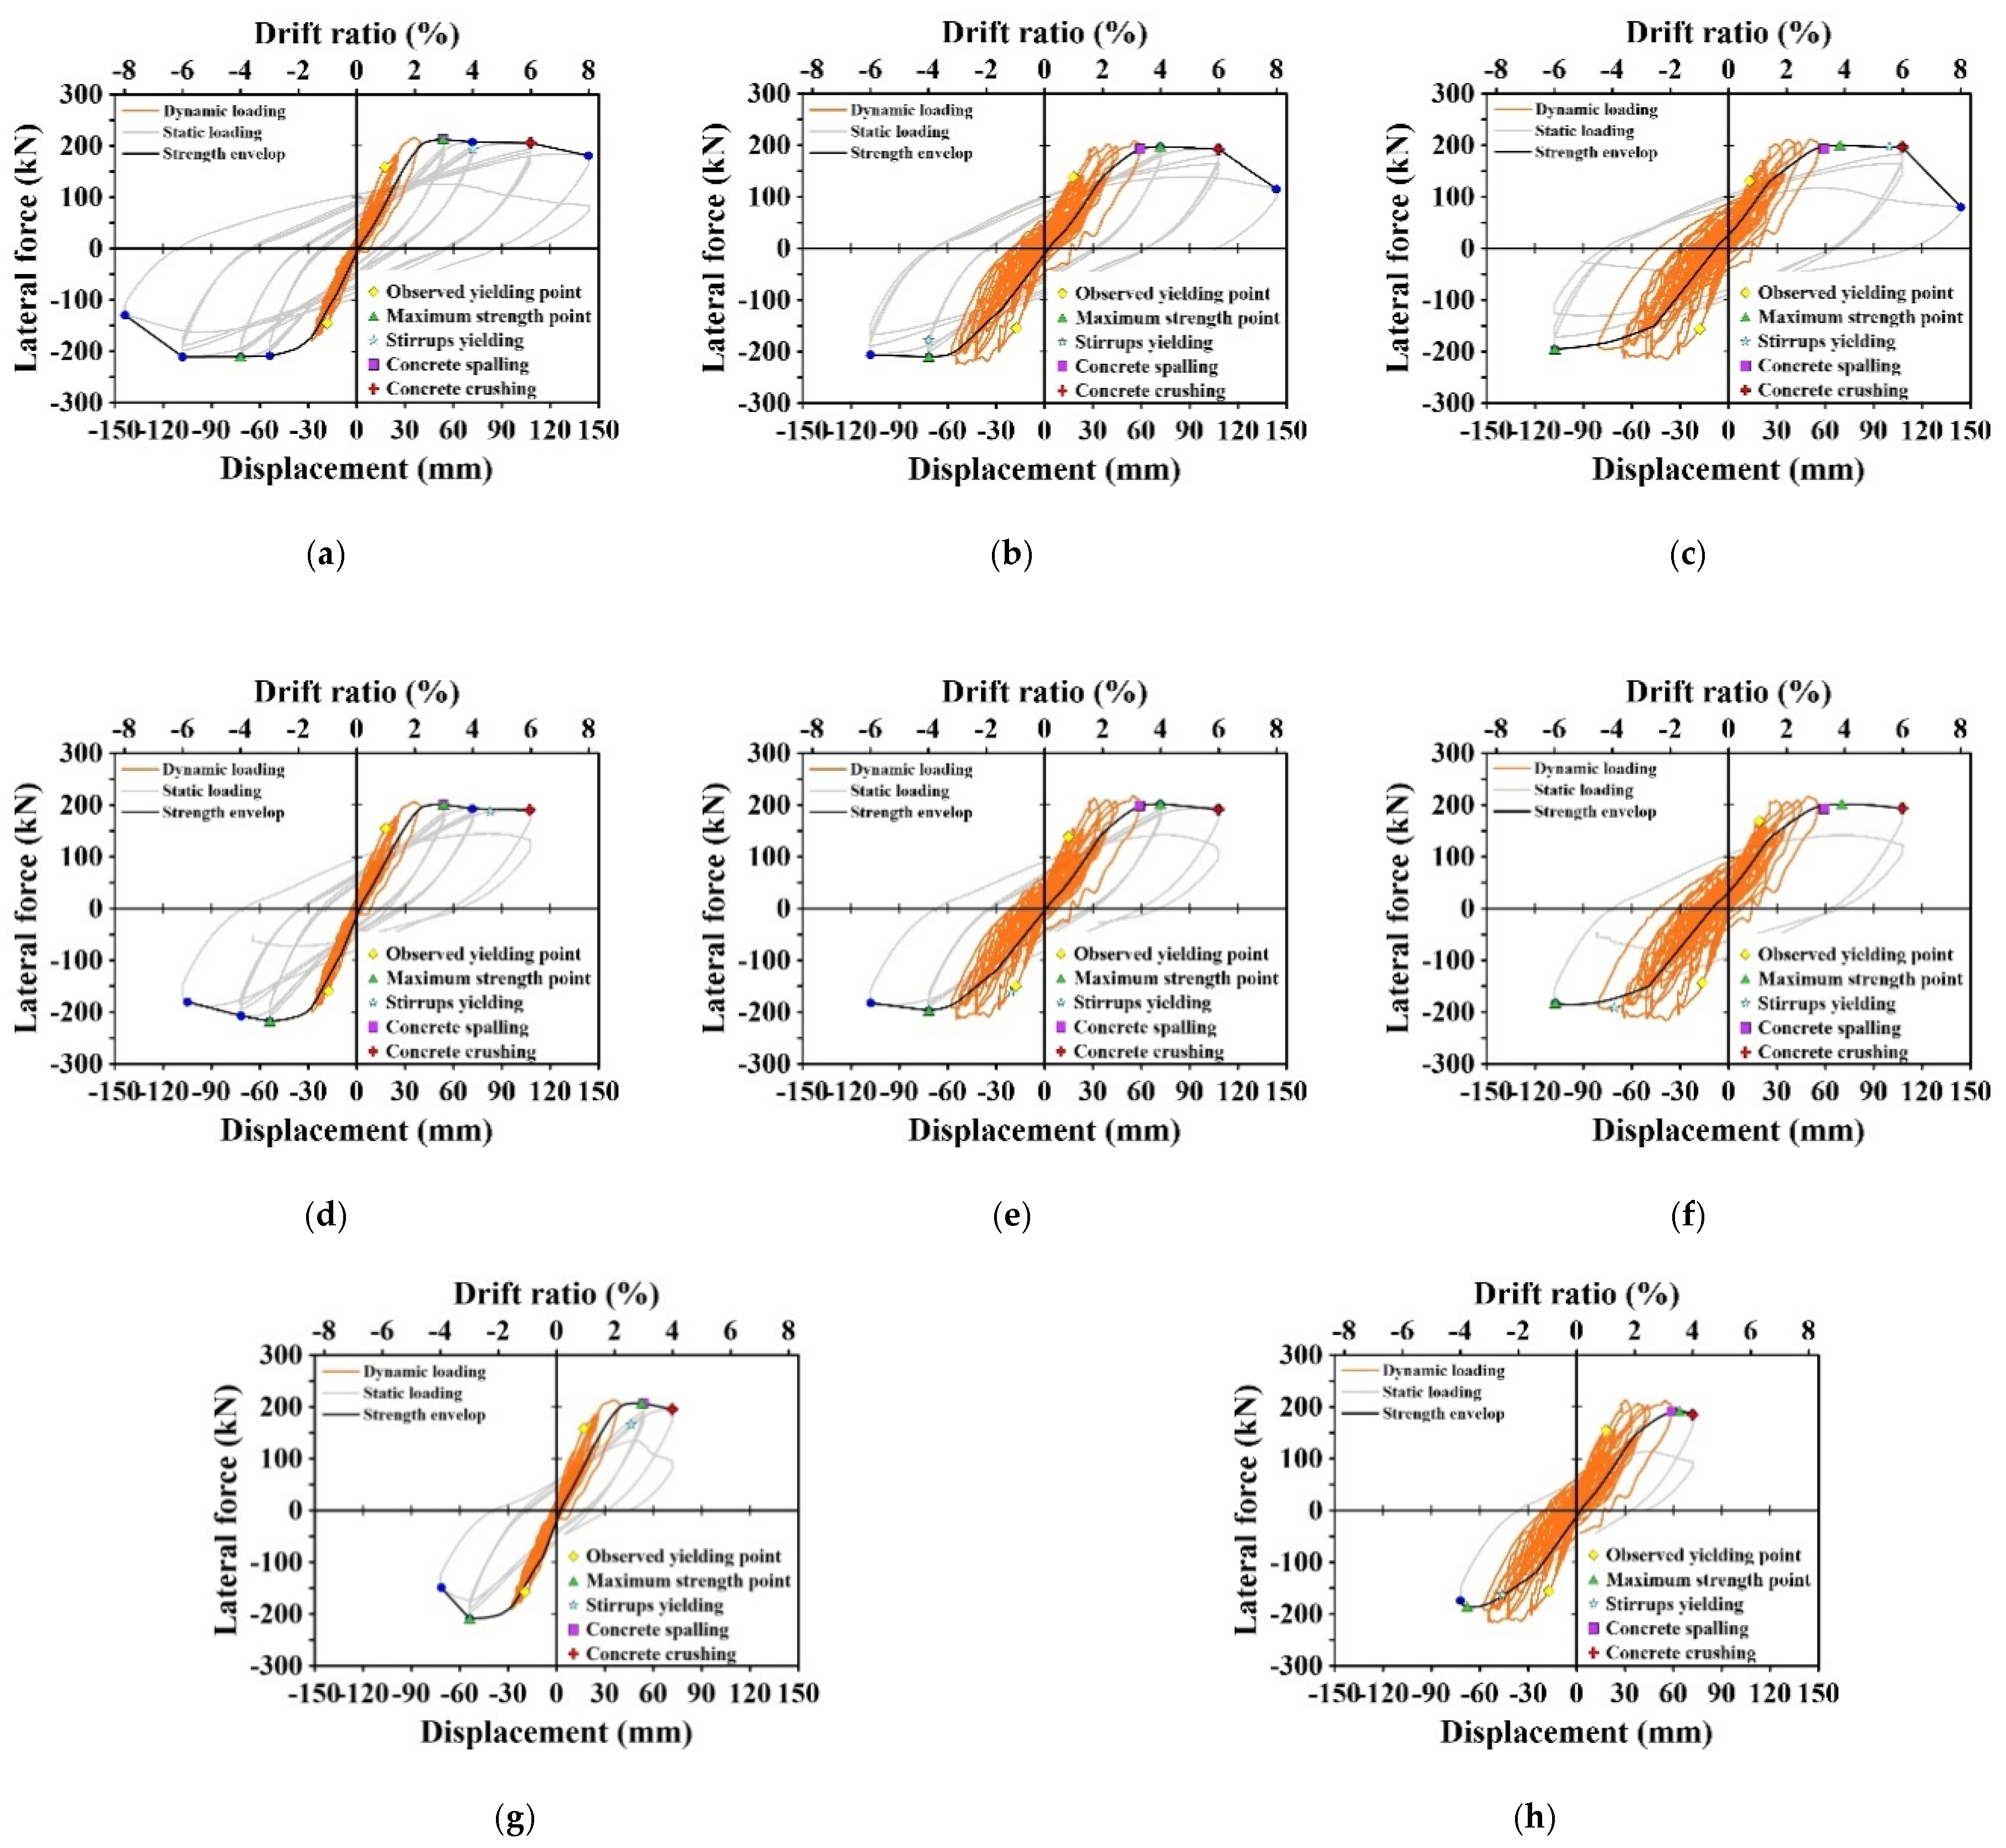
Figure 9.
Damage pattern of each specimen after dynamic testing. (a) FF-15S-II; (b) FF-15S-III; (c) FF-15S-IV; (d) FSF-15S-II; (e) FSF-15S-III; (f) FSF-15S-IV; (g) SF-30S-II; (h) SF-30S-III.
Figure 9.
Damage pattern of each specimen after dynamic testing. (a) FF-15S-II; (b) FF-15S-III; (c) FF-15S-IV; (d) FSF-15S-II; (e) FSF-15S-III; (f) FSF-15S-IV; (g) SF-30S-II; (h) SF-30S-III.
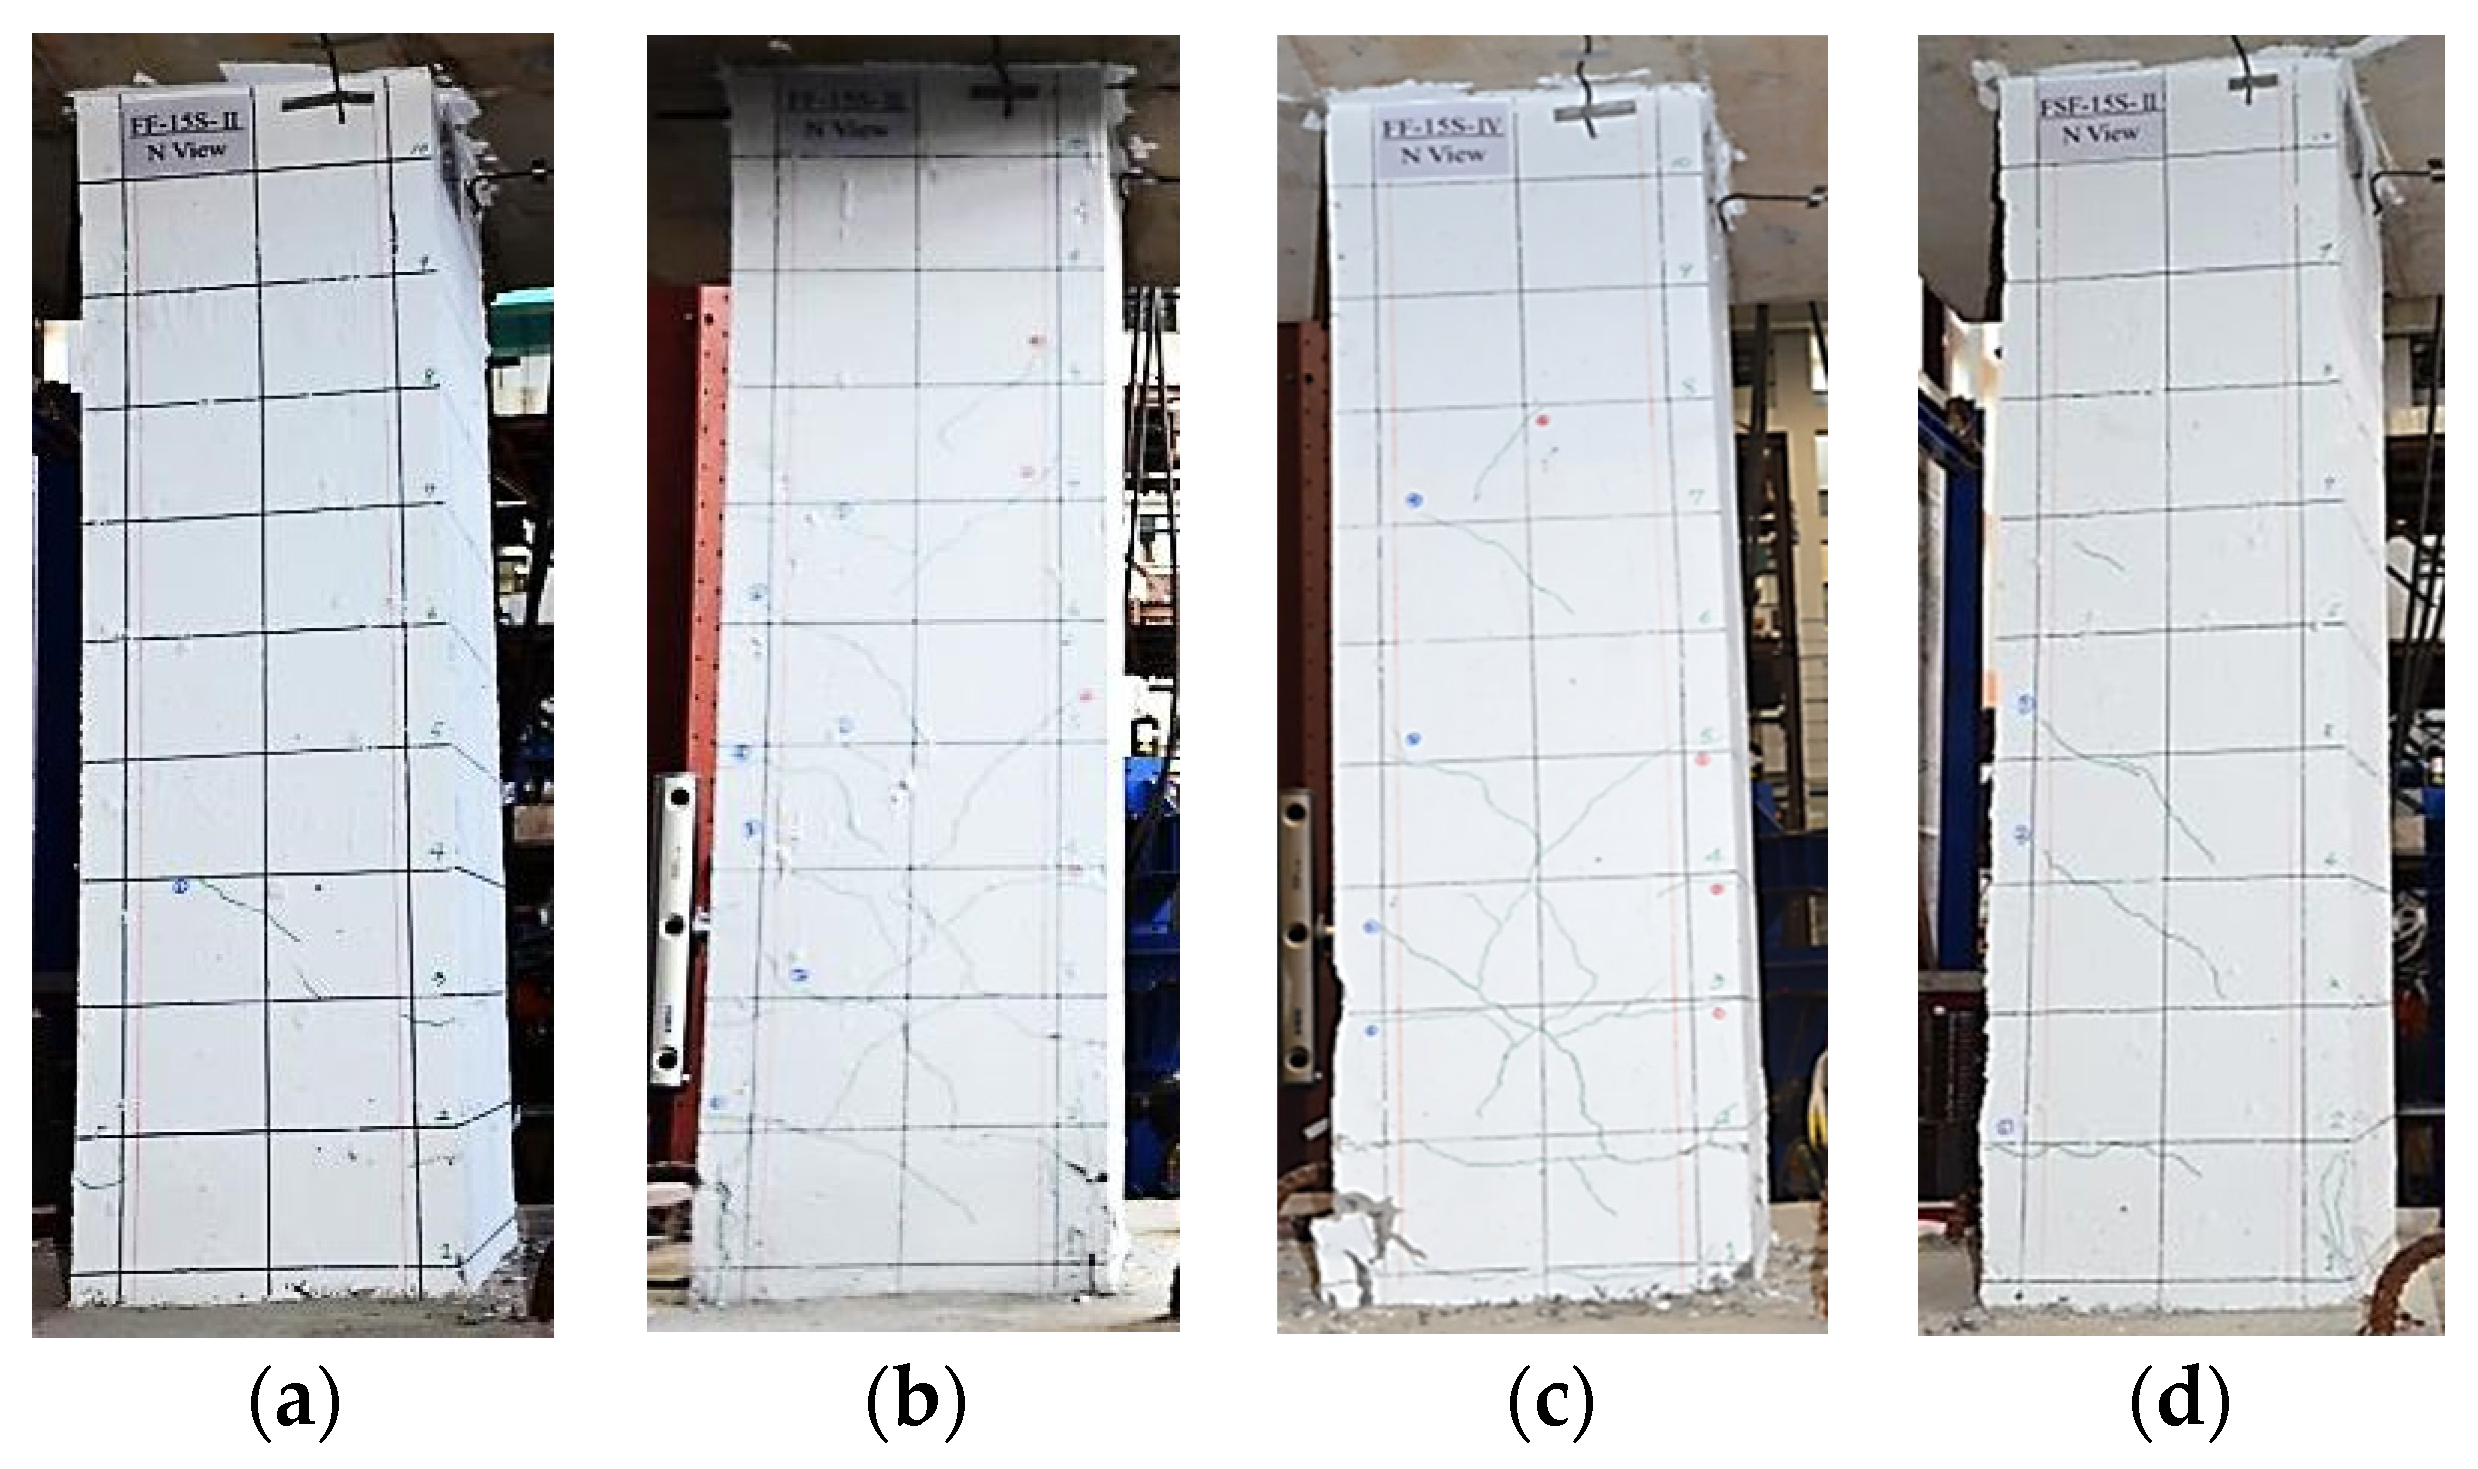
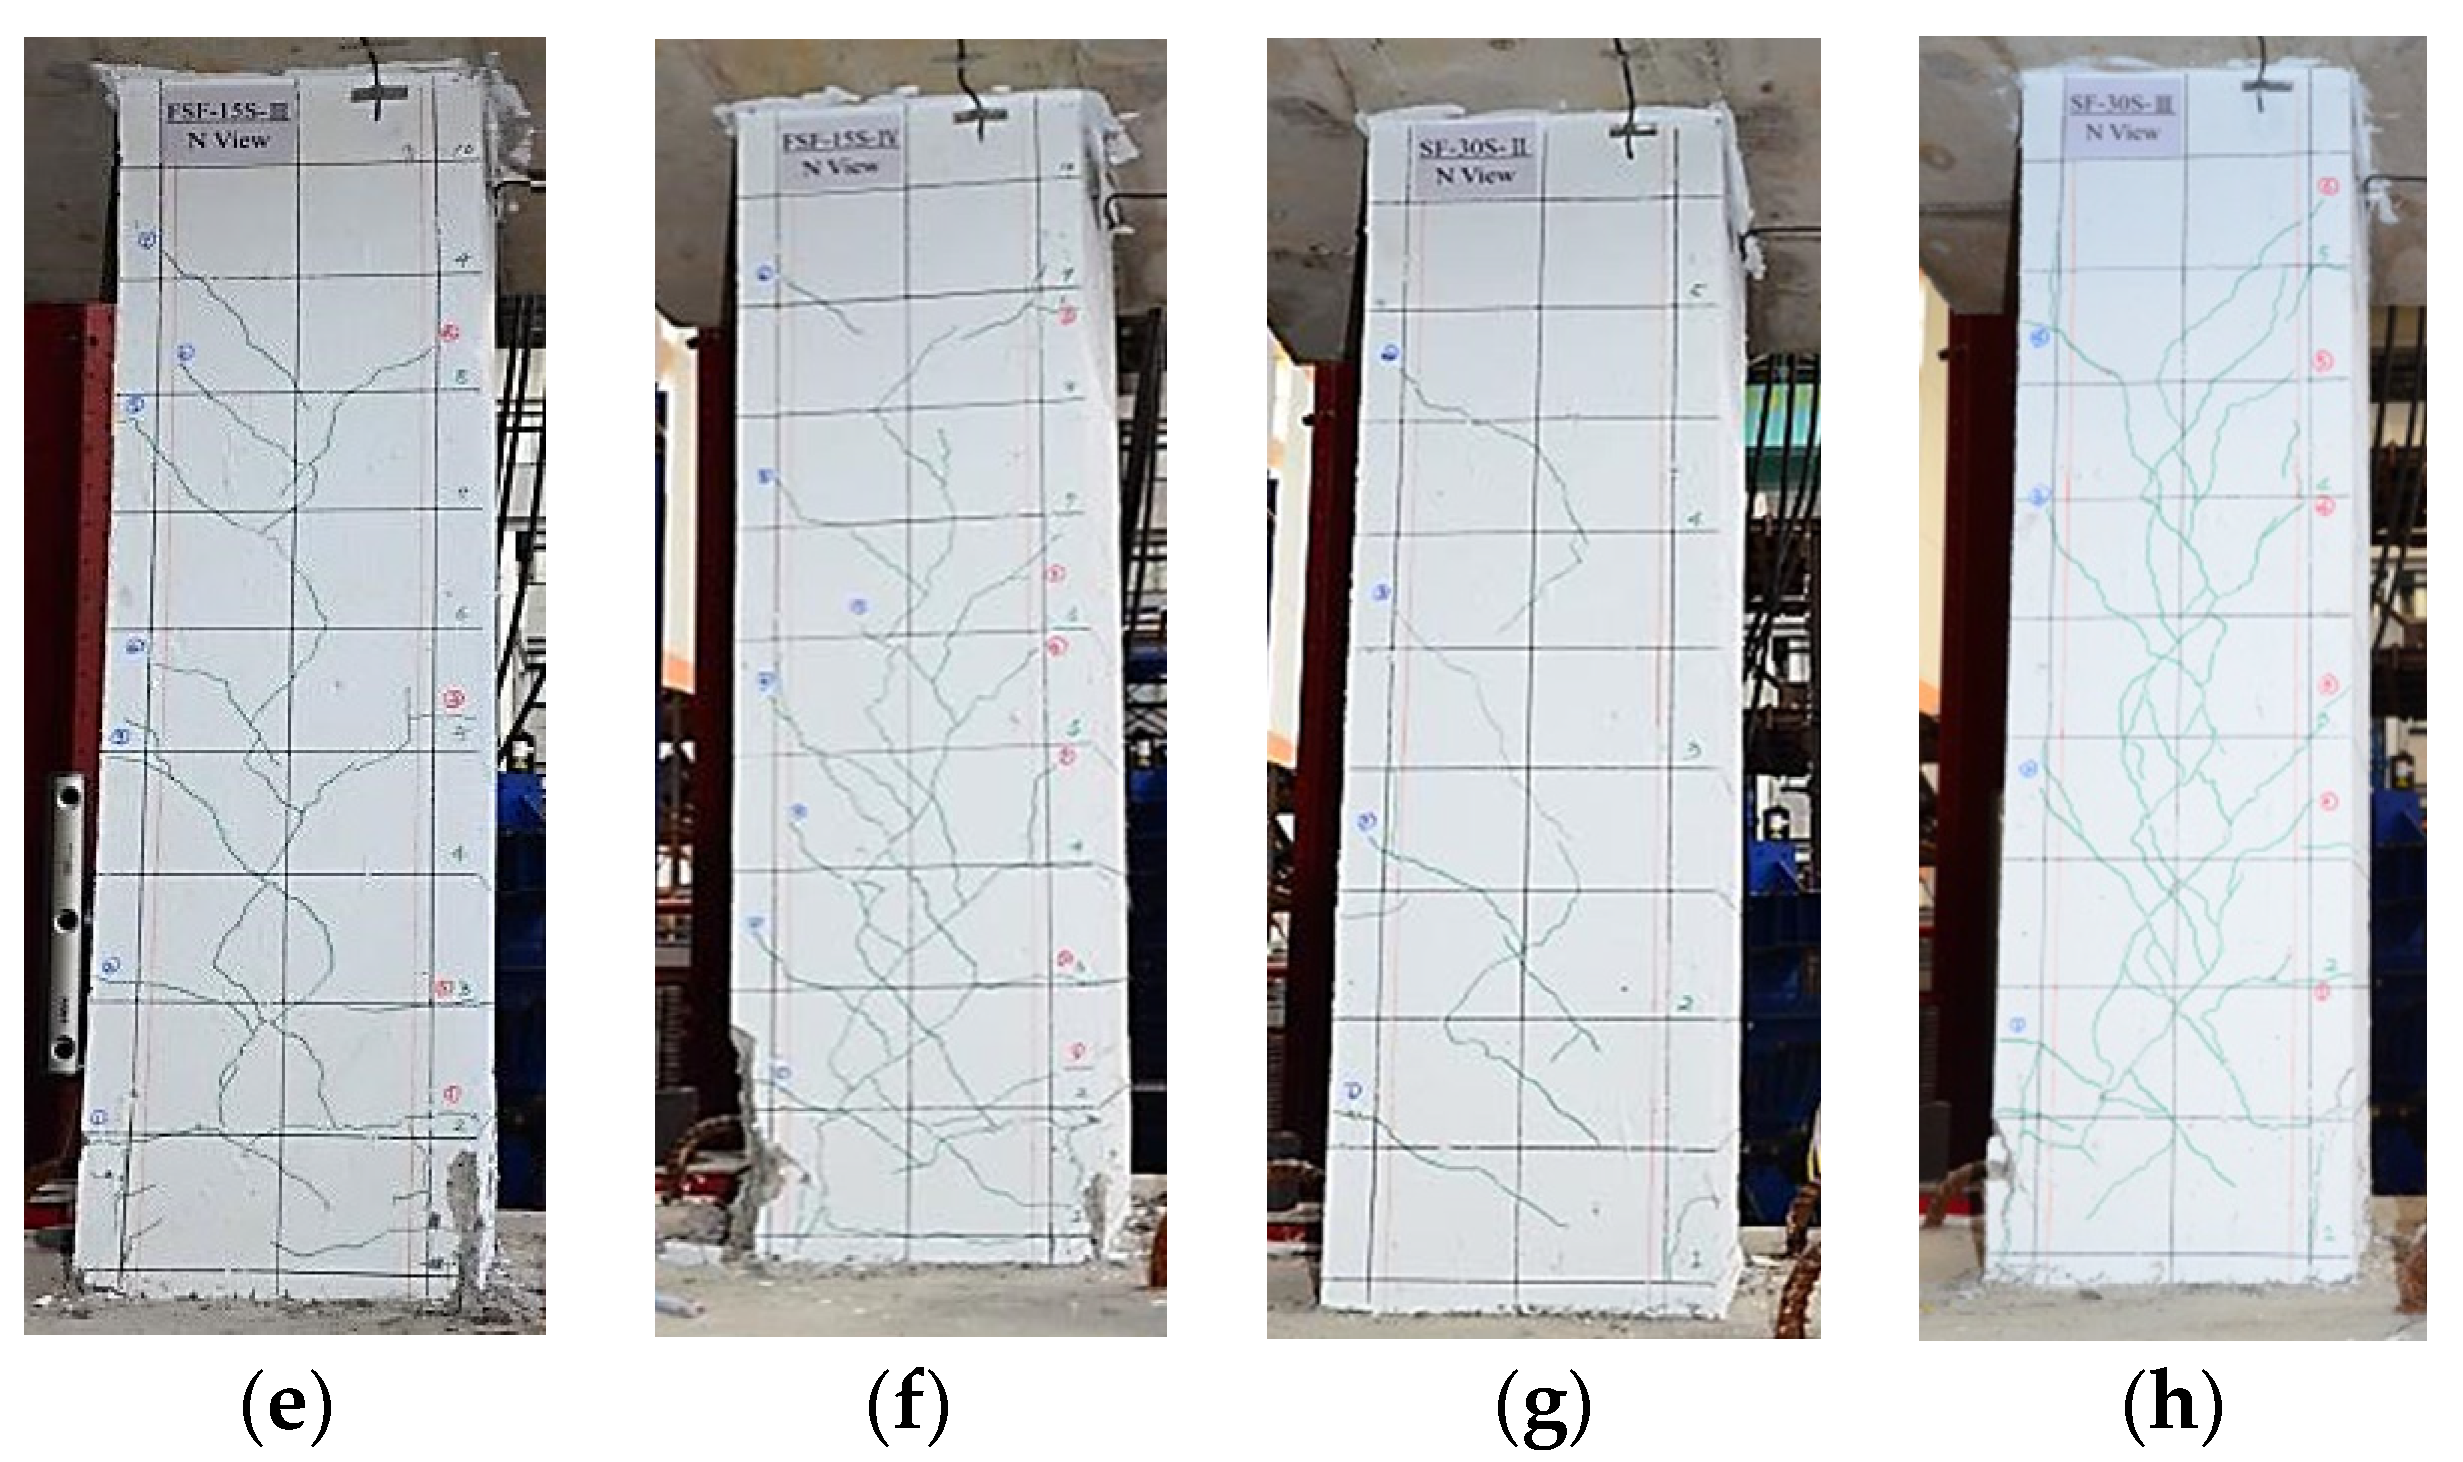
Figure 10.
Maximum residual crack widths for each specimen. (a) FF-15S; (b) FSF-15S; (c) SF-30S.
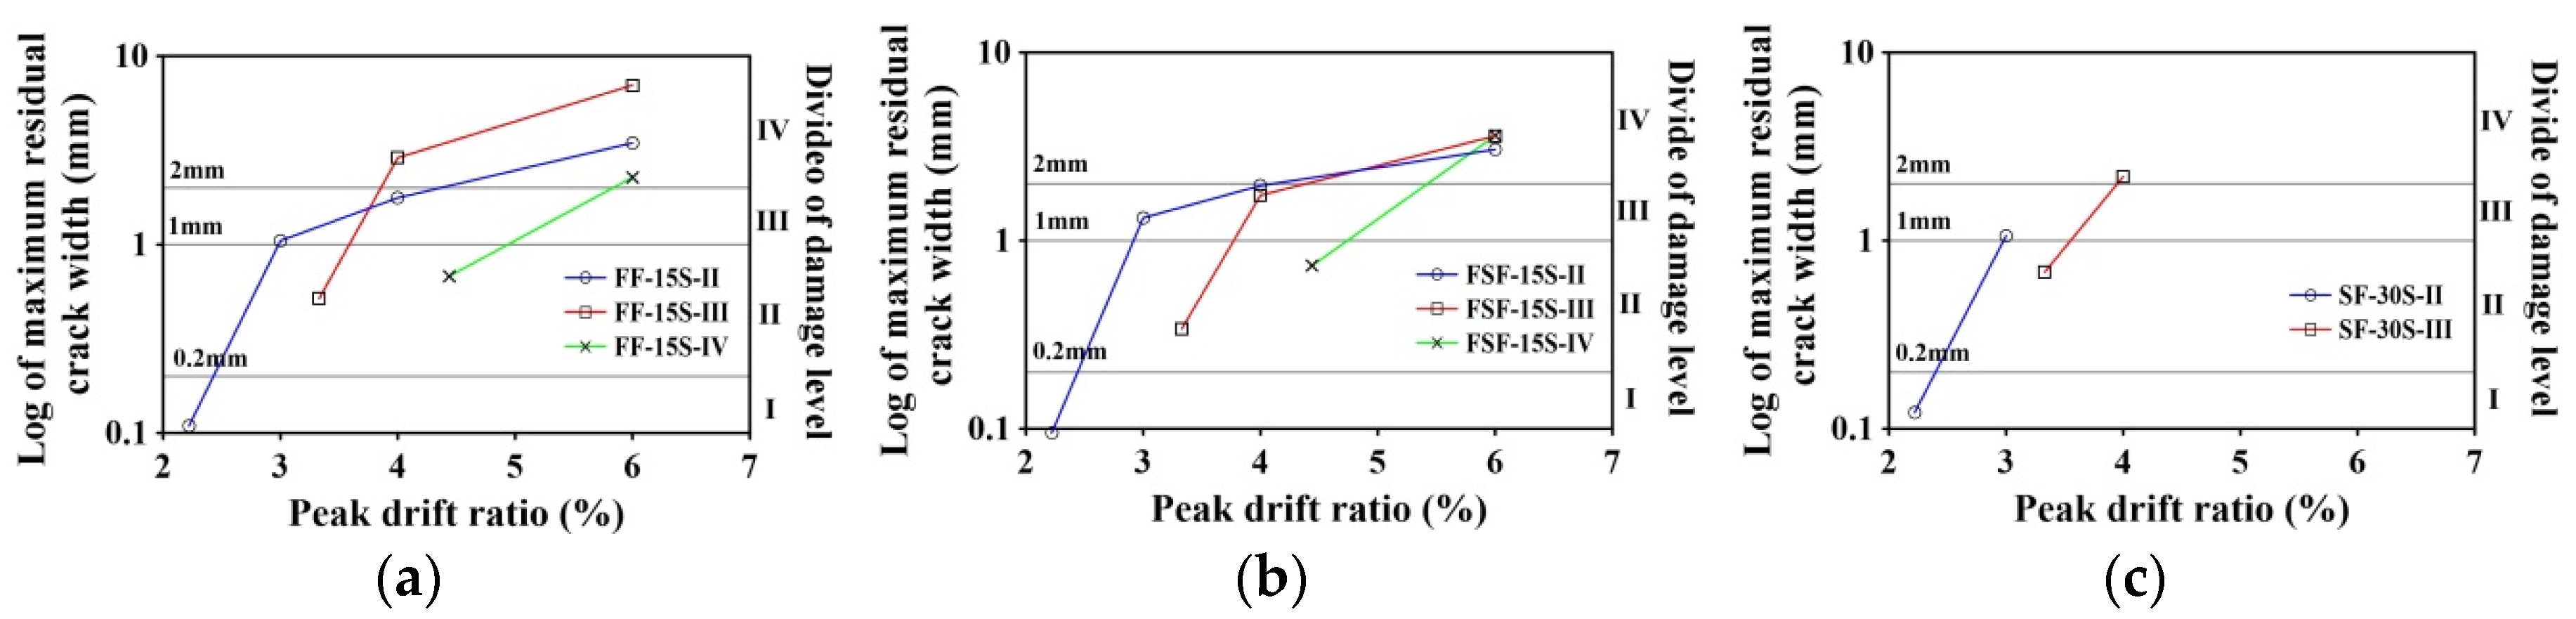
Figure 11.
The waveform comparison between the sensor signals and applied force of specimens. (a) FF-15S-II (Sensor 3 and Sensor 4); (b) FF-15S-III (Sensor 3 and Sensor 4); (c) FF-15S-IV (Sensor 3 and Sensor 4); (d) FSF-15S-II (Sensor 3 and Sensor 4); (e) FSF-15S-III (Sensor 3 and Sensor 4); (f) FSF-15S-IV (Sensor 3 and Sensor 4); (g) SF-30S-II (Sensor 3 and Sensor 4); (h) SF-30S-III (Sensor 3 and Sensor 4).


Figure 12.
Window view (60–70 s) of waveforms of specimens from Figure 11. (a) FF-15S-II (Sensor 3 and Sensor 4); (b) FF-15S-III (Sensor 3 and Sensor 4); (c) FF-15S-IV (Sensor 3 and Sensor 4); (d) FSF-15S-II (Sensor 3 and Sensor 4); (e) FSF-15S-III (Sensor 3 and Sensor 4); (f) FSF-15S-IV (Sensor 3 and Sensor 4); (g) SF-30S-II (Sensor 3 and Sensor 4); (h) SF-30S-III (Sensor 3 and Sensor 4).
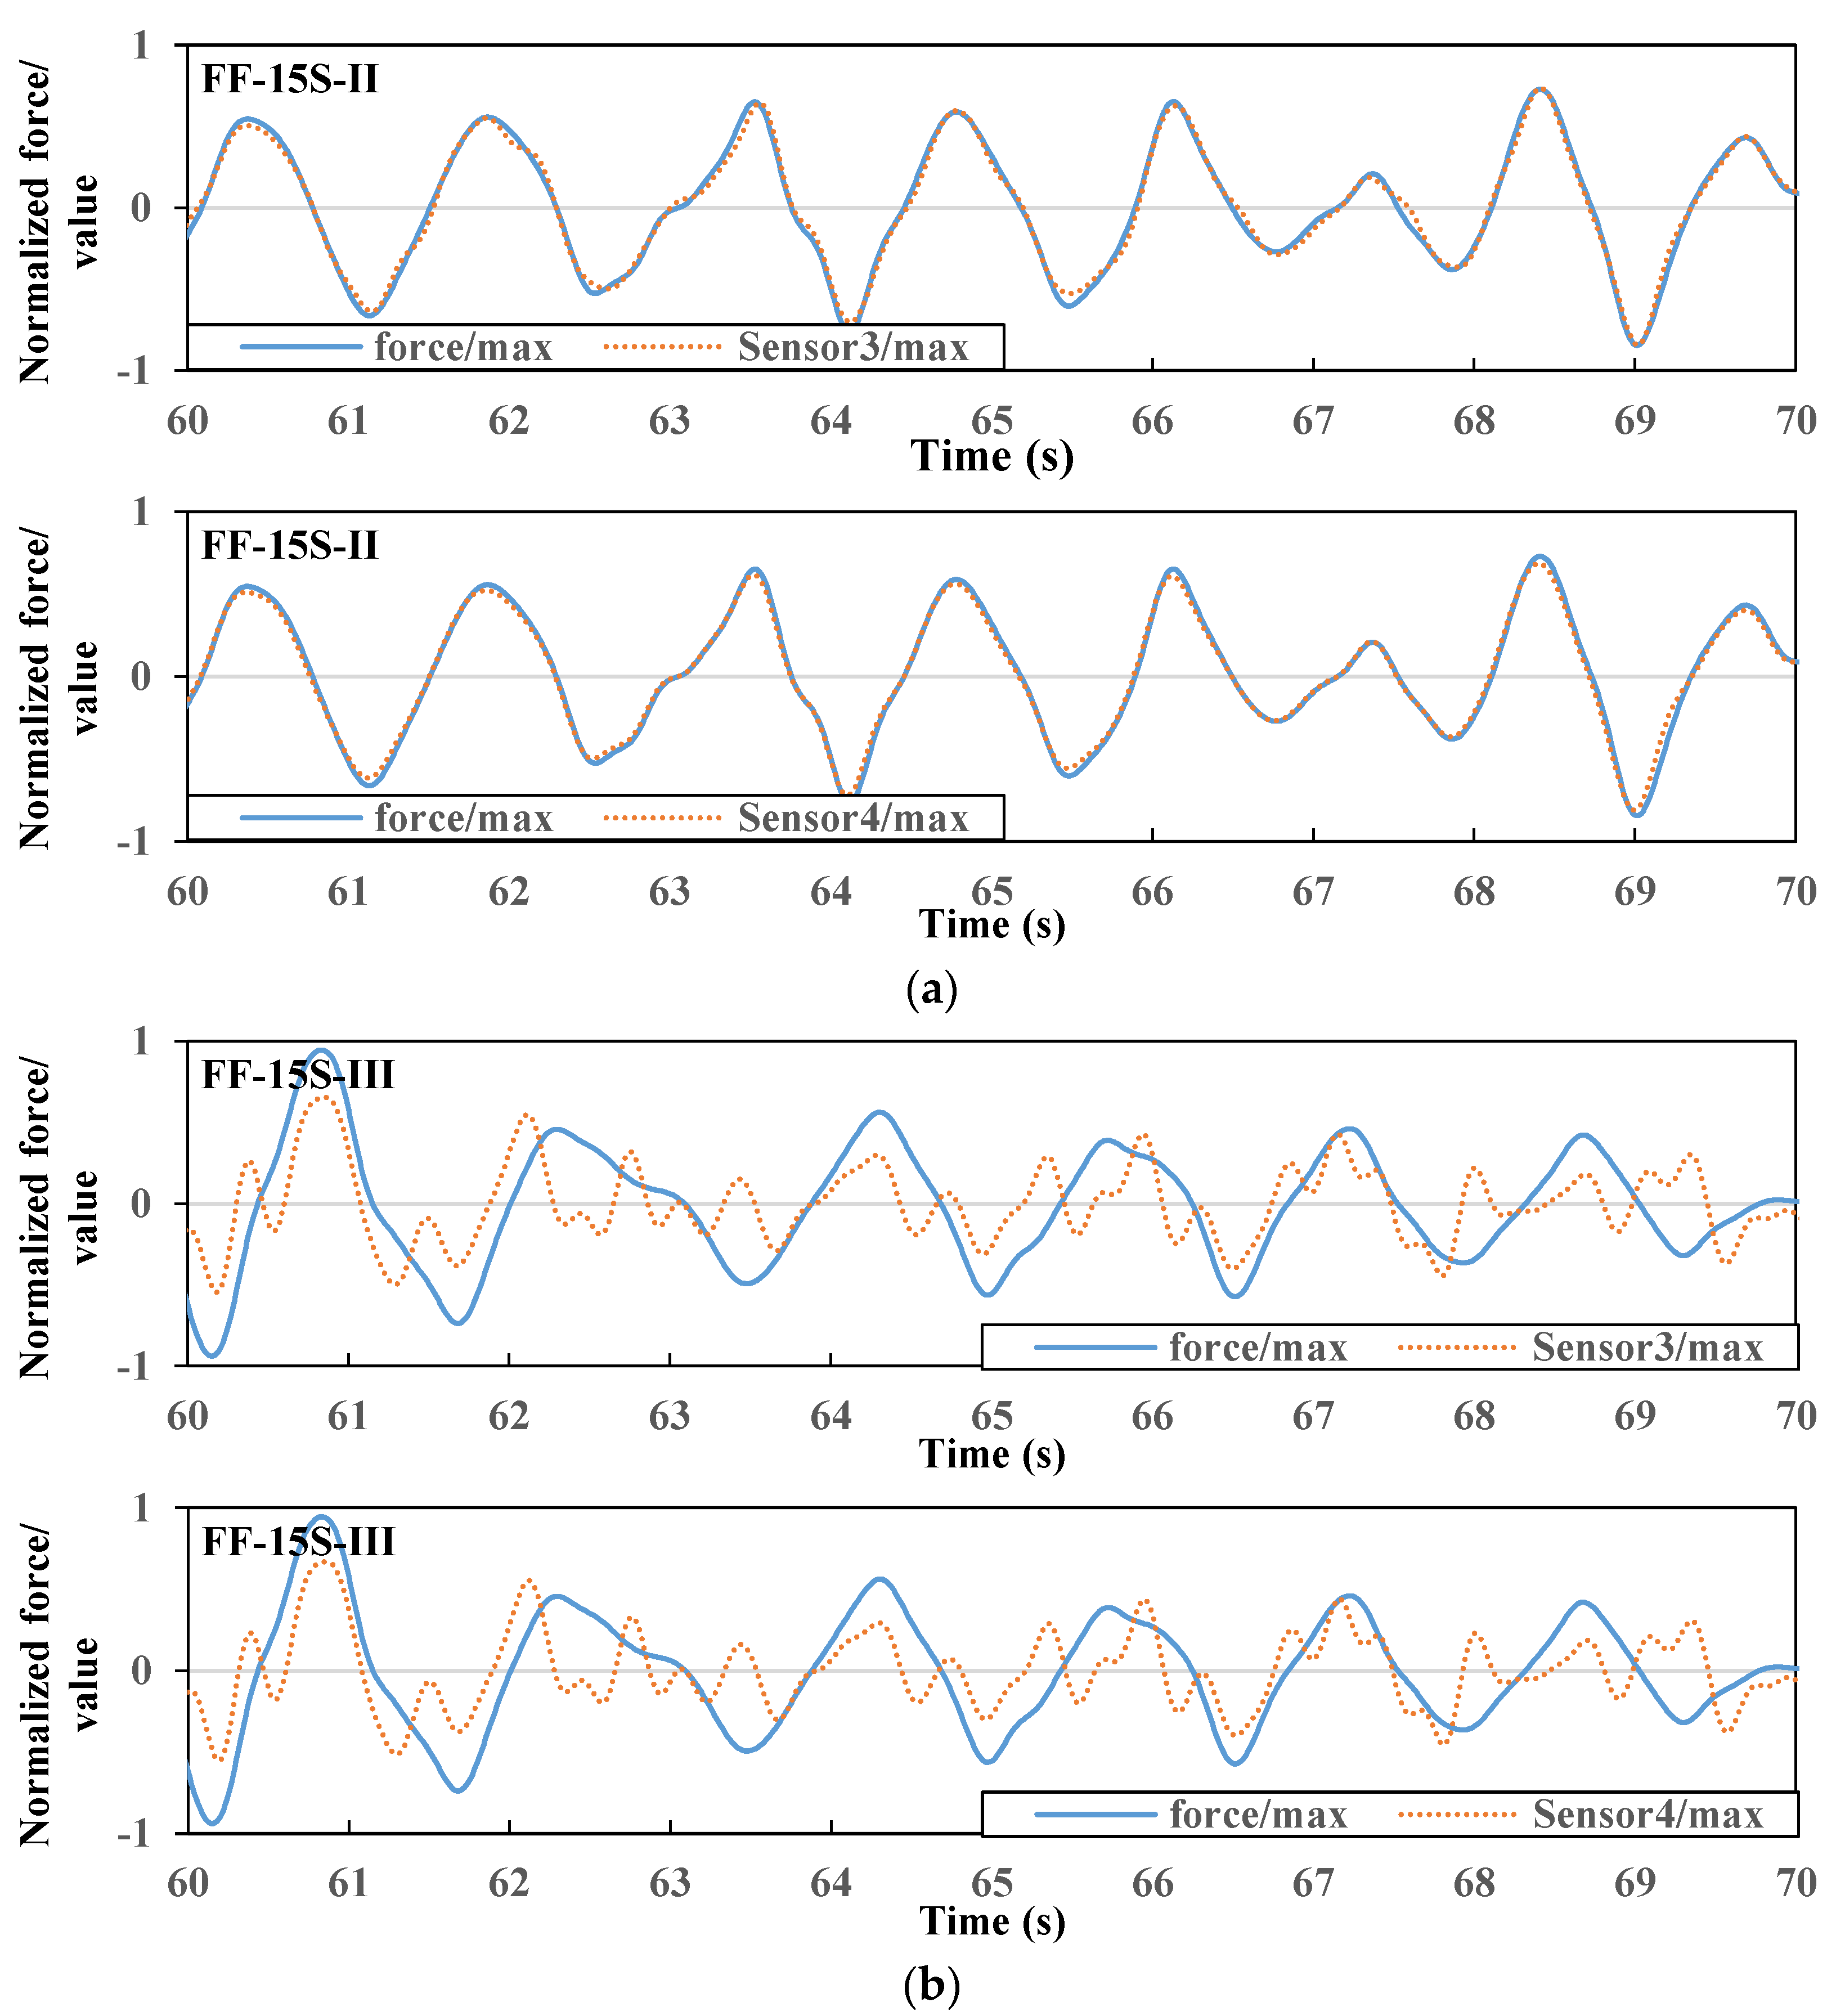
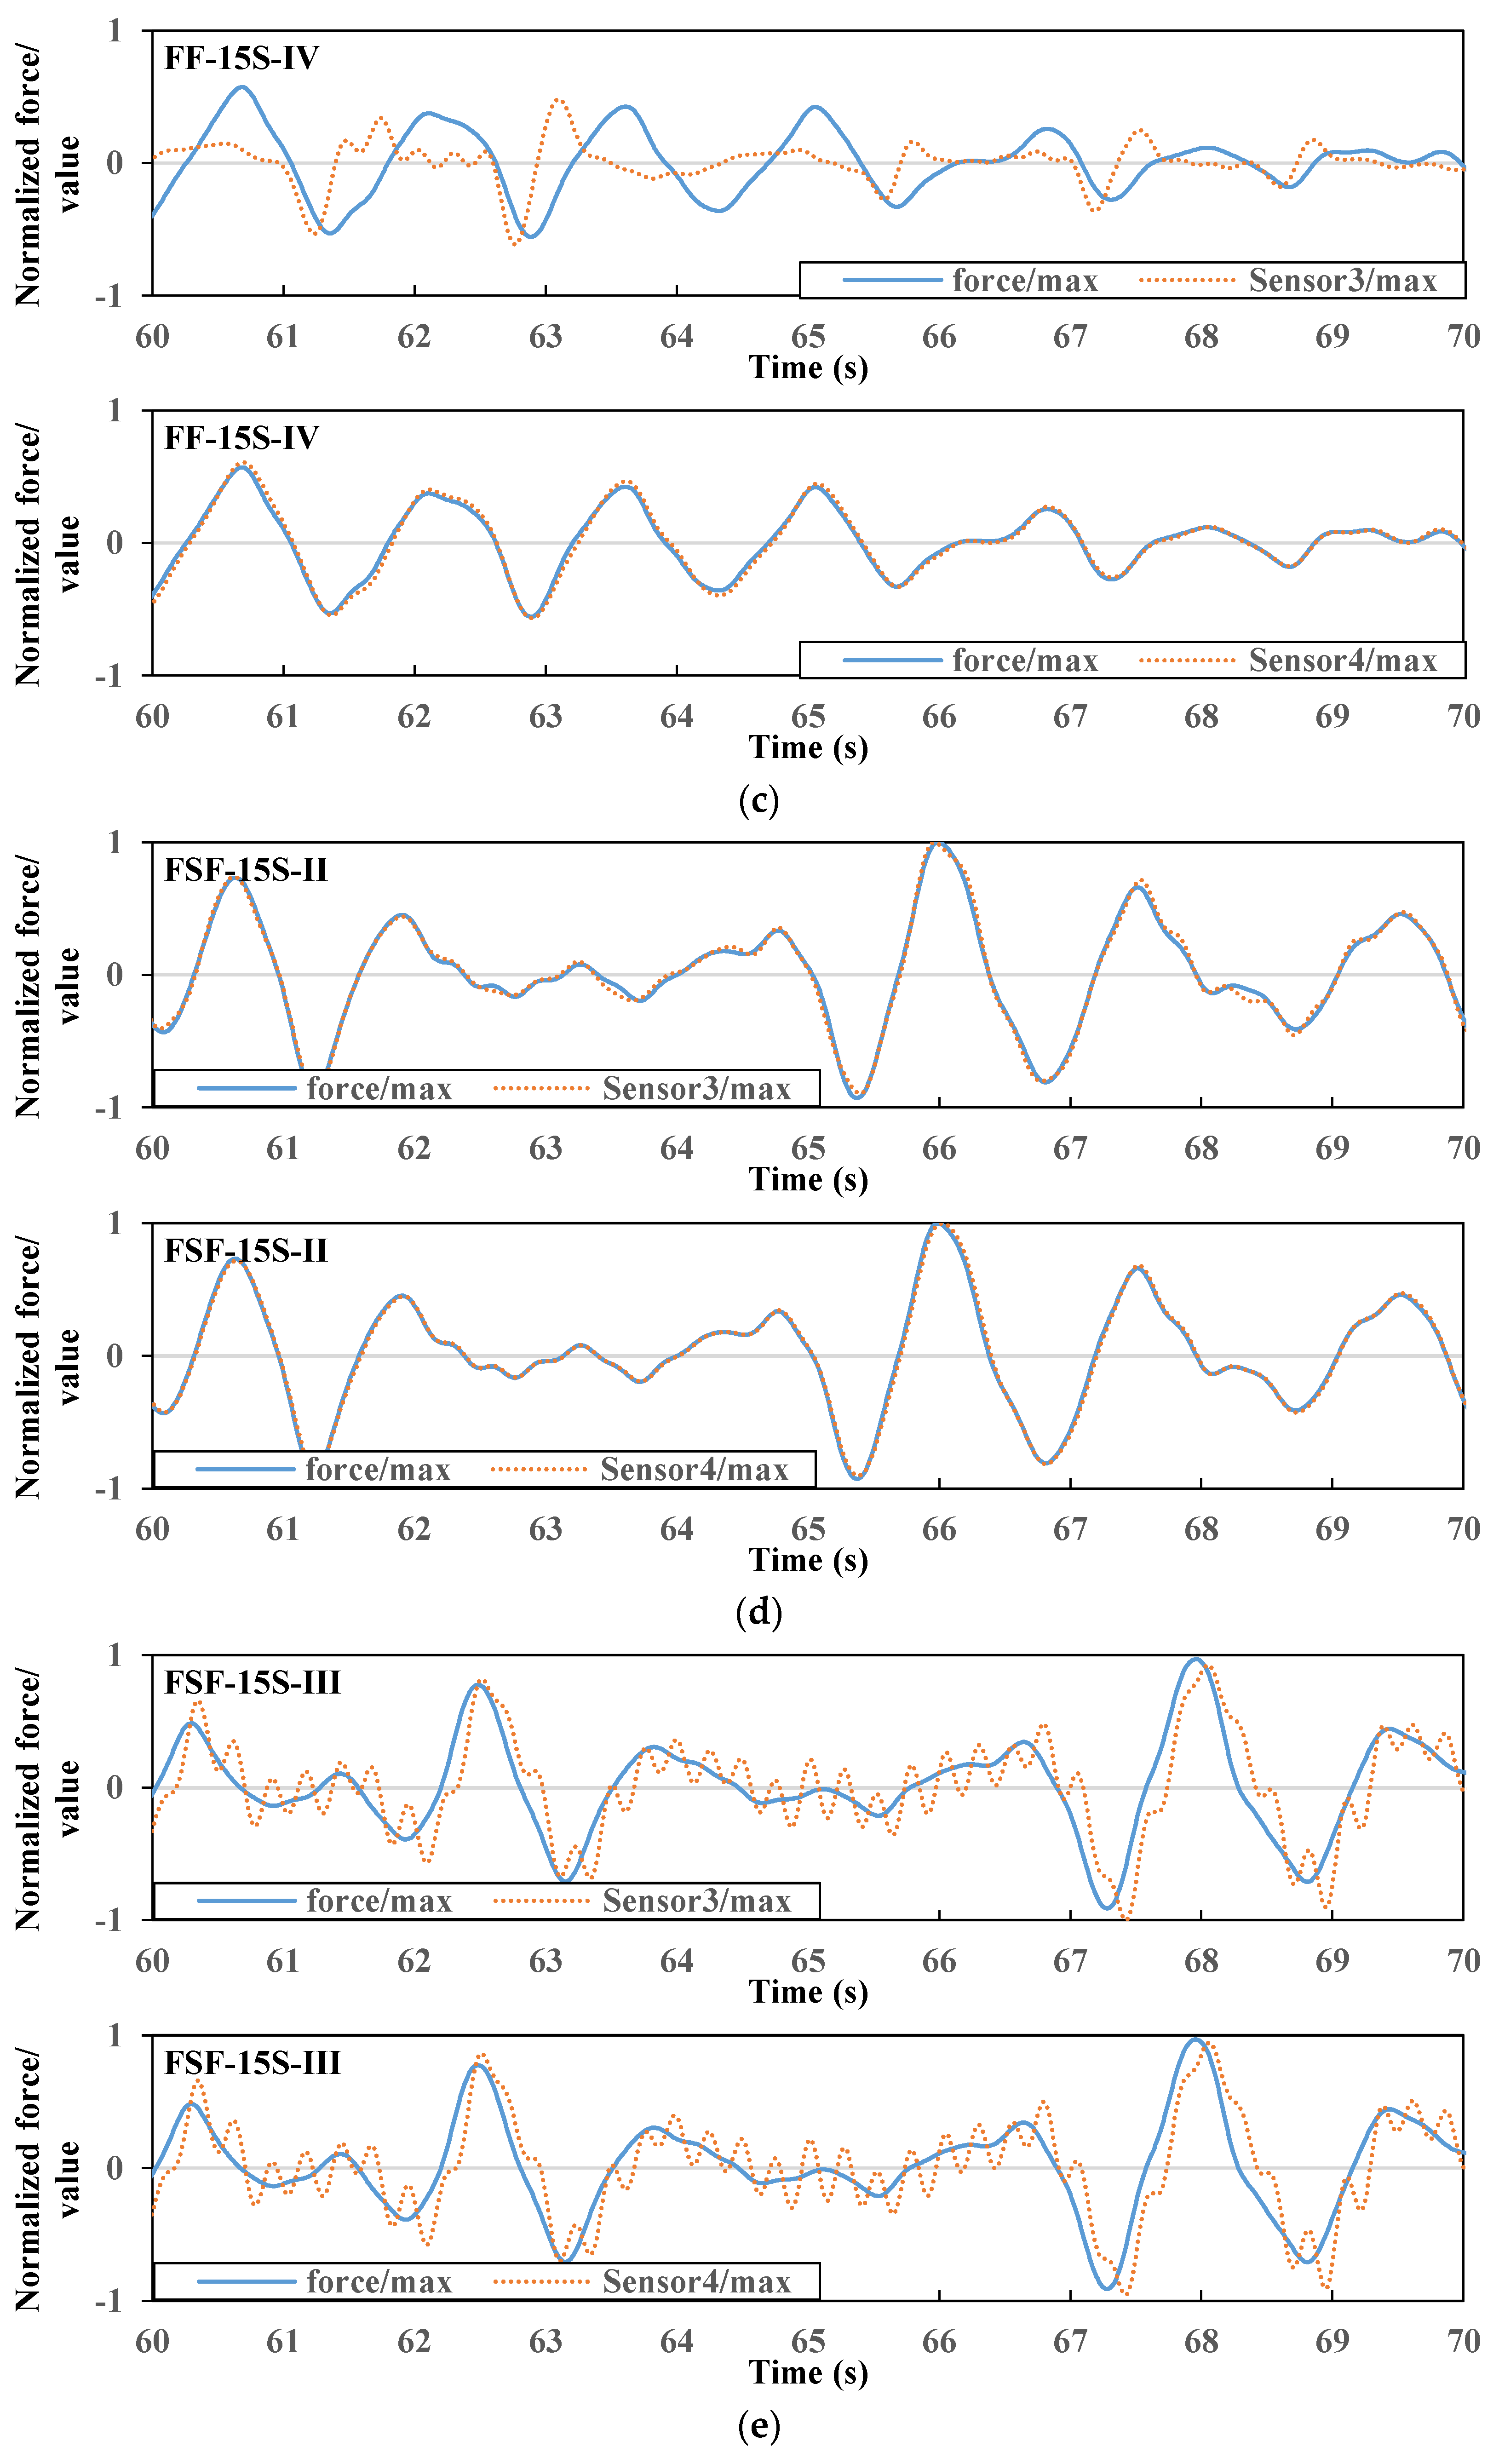
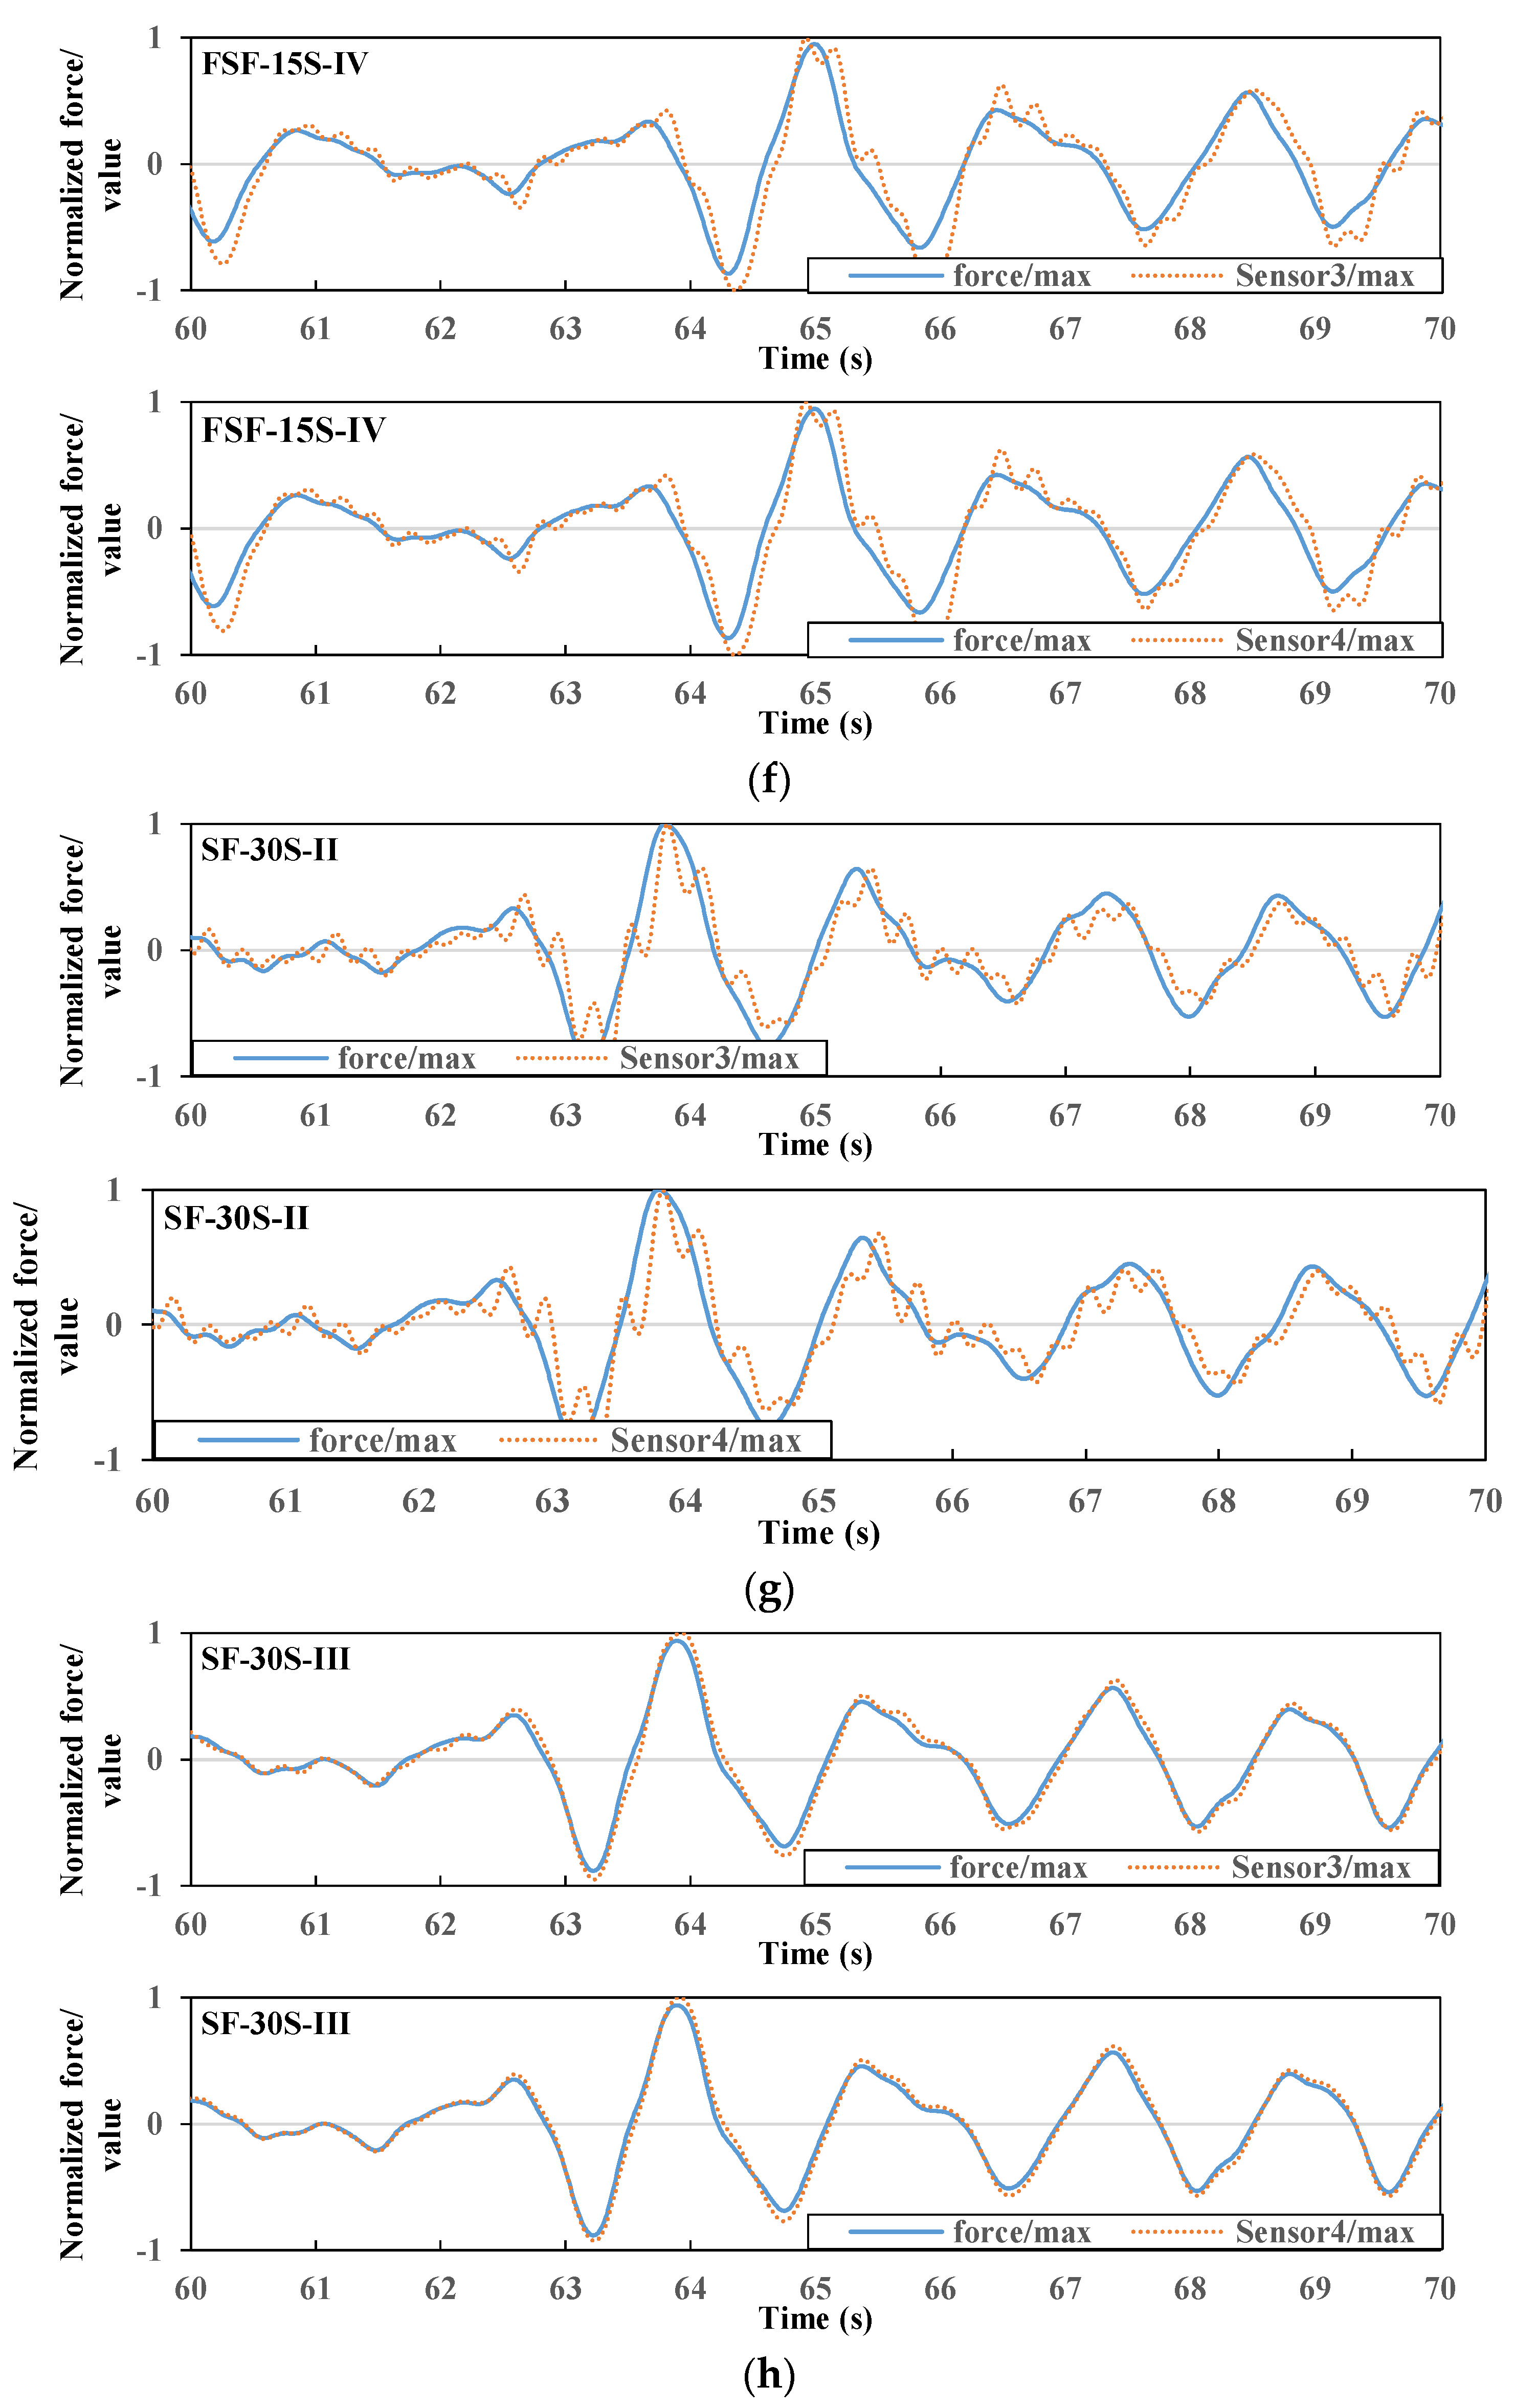
Figure 13.
Regression graphs of normalized force from specimens and normalized signal from sensors. (a) FF-15S-II (Sensor 3 and Sensor 4); (b) FF-15S-IV (Sensor 4); (c) FSF-15S-II (Sensor 3 and Sensor 4); (d) SF-30S-III (Sensor 3 and Sensor 4).
Figure 13.
Regression graphs of normalized force from specimens and normalized signal from sensors. (a) FF-15S-II (Sensor 3 and Sensor 4); (b) FF-15S-IV (Sensor 4); (c) FSF-15S-II (Sensor 3 and Sensor 4); (d) SF-30S-III (Sensor 3 and Sensor 4).


Table 1.
Design details of each column specimen.
| Specimen | L (cm) | Cross Section (cm2) | Concrete Cover (cm) | fc’ (MPa) | fy (MPa) | fyt (MPa) | S (cm) | ρsh (%) | Applied Axial Force |
|---|---|---|---|---|---|---|---|---|---|
| FF-15S-II | 180 | 40 × 40 | 4 | 21 (23.2 *) | 420 | 280 | 15 | 0.61 | 0.1Agfc’ |
| FF-15S-III | 180 | 40 × 40 | 4 | 21 (22.6 *) | 420 | 280 | 15 | 0.61 | 0.1Agfc’ |
| FF-15S-IV | 180 | 40 × 40 | 4 | 21 (22.8 *) | 420 | 280 | 15 | 0.61 | 0.1Agfc’ |
| FSF-15S-II | 180 | 40 × 40 | 4 | 21 (23.9 *) | 420 | 280 | 15 | 0.31 | 0.1Agfc’ |
| FSF-15S-III | 180 | 40 × 40 | 4 | 21 (22.9 *) | 420 | 280 | 15 | 0.31 | 0.1Agfc’ |
| FSF-15S-IV | 180 | 40 × 40 | 4 | 21 (23.4 *) | 420 | 280 | 15 | 0.31 | 0.1Agfc’ |
| SF-30S-II | 180 | 40 × 40 | 4 | 21 (24.4 *) | 420 | 280 | 30 | 0.15 | 0.1Agfc’ |
| SF-30S-III | 180 | 40 × 40 | 4 | 21 (24.4 *) | 420 | 280 | 30 | 0.15 | 0.1Agfc’ |
* The measured compressive strength of the concrete at test time. L is the length of equivalent cantilever, fc’ is the compressive strength, fy is the yield stress of longitudinal reinforcement, fyt is the yield stress of transverse reinforcement, S is the spacing of transverse reinforcement, ρsh is the reinforcement ratio.
Table 2.
Properties of the piezoceramic transducers (Model: ped20t10s-md3 (produced by ELECERAM TECHNOLOGY CO., LTD)).
Table 2.
Properties of the piezoceramic transducers (Model: ped20t10s-md3 (produced by ELECERAM TECHNOLOGY CO., LTD)).
| Mass Density, ρ | Piezoelectric Strain Constant, d11 | Piezoelectric Voltage Constant, g11 | Relative Permittivity,ε11T/ε0 | Piezoelectric Coupling Constant, K11 | Elastic Constant, Y11 |
|---|---|---|---|---|---|
| 7960 kg/m3 | 345 × 10−12 m/V | 9.8 × 10⁻³ V-m/N | 3000 | 0.46 | 6.3 × 10¹⁰ N/m2 |
| Planar coupling factor, Kp | Piezoelectric strain constant, d33 | Piezoelectric voltage constant, g33 | Relative permittivity,ε33T/ε0 | Piezoelectric coupling constant, K33 | Elastic constant, Y33 |
| 0.72 | 700 × 10−12 m/V | 19.5 × 10⁻³ V-m/N | 3500 | 0.76 | 5.2 × 10¹⁰ N/m2 |
Table 3.
Performance points of each specimen under different loading scheme.
| Specimen | Initial Yielding Point of a Main Bar | Initial Yielding Point of Stirrup | Maximum Loading Point (Positive) | Maximum Loading Point (Negative) | Concrete Spalling Point | Final Step (Strength <60%) |
|---|---|---|---|---|---|---|
| FF-15S-II | 1.0 % | 4.0% | 3.0% | −4.0% | 3.0% | 8.0% |
| (Dynamic) | (2nd) | (1st) | (1st) | (1st) | (2nd) | |
| FF-15S-III | −1.0 % | −4.0% | 4.0% | −4.0% | 3.0% | 8.0% |
| (Dynamic) | (3rd) | (1st) | (1st) | (1st) | (1st) | |
| FF-15S-IV | 0.7 % | 5.5% | 4.0% | −6.0% | 3.0% | 8.0% |
| (Dynamic) | (1st) | (1st) | (1st) | (1st) | (1st) | |
| FSF-15S-II | −1.0 % | 4.6% | 3.0% | −3.0% | 3.0% | 6.0% |
| (Dynamic) | (1st) | (1st) | (1st) | (1st) | (2nd) | |
| FSF-15S-III | 0.8 % | −1.2% | 4.0% | −4.0% | 3.0% | 6.0% |
| (Dynamic) | (Dynamic) | (1st) | (1st) | (1st) | (2nd) | |
| FSF-15S-IV | −0.9 % | −4.0% | 4.0% | −6.0% | 3.0% | 6.0% |
| (Dynamic) | (Dynamic) | (1st) | (1st) | (1st) | (2nd) | |
| SF-30S-II | 0.9 % | 2.6% | 3.0% | −3.0% | 3.0% | 4.0% |
| (Dynamic) | (3rd) | (1st) | (1st) | (1st) | (1st) | |
| SF-30S-III | −0.9 % | −2.6% | 3.0% | −3.0% | 3.0% | 4.0% |
| (Dynamic) | (Dynamic) | (1st) | (1st) | (1st) | (1st) |
| Damage Levels | Description of Damage | ||
|---|---|---|---|
| Residual Crack Widths | State of Concrete | State of Rebars | |
| Japan | |||
| I (Slight) | < 0.2 mm | Narrow cracks on concrete surfaces | - |
| II (Light) | 0.2–1.0 mm | Visible cracks on concrete surface | - |
| III (Moderate) | 1.0–2.0 mm | Local crush of covered concrete | - |
| IV (Severe) | > 2.0 mm | Cover concrete spalled off | Crushing of concrete with exposed rebars |
| V (Total damage or collapse) | Core concrete crushed | Rebars buckling | |
Table 5.
Correlation coefficient between signals obtained by a post-embedded piezoceramic sensor and applied force under dynamic testing.
Table 5.
Correlation coefficient between signals obtained by a post-embedded piezoceramic sensor and applied force under dynamic testing.
| Specimen | FF-15S-II | FF-15S-III | FF-15S-IV | FSF-15S-II | FSF-15S-III | FSF-15S-IV | SF-30S-II | SF-30S-III |
|---|---|---|---|---|---|---|---|---|
| Sensor 1 | 0.72 | 0.49 | 0.98 | 0.68 | 0.44 | 0.31 | 0.15 | 0.98 |
| Sensor 2 | 0.52 | 0.43 | 0.95 | 0.74 | 0.39 | 0.34 | 0.40 | 0.43 |
| Sensor 3 | 0.98 | 0.78 | 0.36 | 0.98 | 0.76 | 0.88 | 0.80 | 0.98 |
| Sensor 4 | 0.99 | 0.77 | 0.98 | 0.99 | 0.78 | 0.88 | 0.80 | 0.99 |
Table 6.
Correlation coefficient between signals obtained by a post-embedded piezoceramic sensor and applied deformation under dynamic testing.
Table 6.
Correlation coefficient between signals obtained by a post-embedded piezoceramic sensor and applied deformation under dynamic testing.
| Specimen | FF-15S-II | FF-15S-III | FF-15S-IV | FSF-15S-II | FSF-15S-III | FSF-15S-IV | SF-30S-II | SF-30S-III |
|---|---|---|---|---|---|---|---|---|
| Sensor 1 | 0.63 | 0.33 | 0.92 | 0.60 | 0.36 | 0.20 | 0.05 | 0.94 |
| Sensor 2 | 0.46 | 0.41 | 0.93 | 0.73 | 0.44 | 0.39 | 0.40 | 0.38 |
| Sensor 3 | 0.95 | 0.66 | 0.40 | 0.96 | 0.83 | 0.92 | 0.82 | 0.92 |
| Sensor 4 | 0.97 | 0.66 | 0.93 | 0.97 | 0.84 | 0.92 | 0.82 | 0.93 |
Table 7.
Ratio between maximum force applied to a specimen and maximum voltage signal of Sensor 4.
| Specimen | FF-15S-II | FF-15S-IV | FSF-15S-II | FF-15S-IV | SF-30S-II | SF-30S-III |
|---|---|---|---|---|---|---|
| Fmax | 191.69 kN | 209.44 kN | 193.87 kN | 212.22 kN | 199.31 kN | 210.28 kN |
| (vsi)max | 0.47 mV | 0.59 mV | 0.46 mV | 0.83 mV | 0.73 mV | 0.53 mV |
| Fmax/(vsi)max | 408.25 | 357.27 | 421.05 | 255.32 | 273.51 | 393.09 |
© 2020 by the authors. Licensee MDPI, Basel, Switzerland. This article is an open access article distributed under the terms and conditions of the Creative Commons Attribution (CC BY) license (http://creativecommons.org/licenses/by/4.0/).
Share and Cite
MDPI and ACS Style
Chiu, C.-K.; Wu, C.-H.; Sung, H.-F.; Liao, W.-I.; Lin, C.-H. Application of Post-Embedded Piezoceramic Sensors for Force Detection on RC Columns under Seismic Loading. Appl. Sci. 2020, 10, 5061. https://doi.org/10.3390/app10155061
AMA Style
Chiu C-K, Wu C-H, Sung H-F, Liao W-I, Lin C-H. Application of Post-Embedded Piezoceramic Sensors for Force Detection on RC Columns under Seismic Loading. Applied Sciences. 2020; 10(15):5061. https://doi.org/10.3390/app10155061
Chicago/Turabian StyleChiu, Chien-Kuo, Chia-Hsin Wu, Hsin-Fang Sung, Wen-I Liao, and Chih-Hsien Lin. 2020. "Application of Post-Embedded Piezoceramic Sensors for Force Detection on RC Columns under Seismic Loading" Applied Sciences 10, no. 15: 5061. https://doi.org/10.3390/app10155061
Note that from the first issue of 2016, this journal uses article numbers instead of page numbers. See further details here.