Article

Assessment of the Impact of Electric Vehicles on the Design and Effectiveness of Electric Distribution Grid with Distributed Generation

1
Department of Energy, Politecnico di Milano, via La Masa, 3420156 Milan, Italy
2
CanmetENERGY Research Centre, Natural Resources Canada, 1 Haanel Drive, Ottawa, ON K1A 1M1, Canada
*
Author to whom correspondence should be addressed.
Appl. Sci. 2020, 10(15), 5125; https://doi.org/10.3390/app10155125
Submission received: 28 May 2020 / Revised: 17 July 2020 / Accepted: 24 July 2020 / Published: 26 July 2020
(This article belongs to the Special Issue Renewable Energy Systems 2020)

Abstract

:
The objective of this paper is to assess the probable effect that electric vehicles (EVs), already in wide circulation and likely to increase exponentially in the near future, will have on distribution networks. Analyses are conducted on the necessary interventions and evolutions that the distribution grid will have to undergo in order to manage this new and progressively increasing heavy load of energy. Thus, in order to understand the technical limitations of the current infrastructure and how transformers and lines will be able to withstand the increasing penetration of EVs, urban and rural grid models have been studied, to highlight the differences between the impacts on high- and low-density networks. In addition, an analysis of fast charging station impact has been carried out. MATLAB software was used to perform the simulations for the creation of scripts, which were then exploited within the DIgSILENT PowerFactory software. This allowed evaluation of the networks under examination and verification of the effectiveness of the proposed solutions. In concluding based on findings, some methods of managing the distribution network to optimise the network parameters analysed in the study and a solution involving electric vehicles are recommended.

1. Introduction

Transportation represents a strategic and necessary sector of the world economy that directly affects the daily life of all people. In the last few decades, the volume of goods and passengers moved worldwide has recorded a momentous growth that is expected to continue. Indeed, road transport represents the most popular method of conveying goods and passengers. According to estimates by the European Commission, by 2050 passenger transport will grow by more than 50% and freight transport by 80% compared to growth levels in 2013 [1,2,3].
Regrettably, the transport industry in Europe depends heavily on fossil fuels, which presents a serious challenge to the environment. Oil consumption not only releases greenhouse gases and other pollutants into the atmosphere, contributing negatively to climate change, but also makes the European economy more vulnerable to global fluctuations in prices of energy resources. Lately, technological advancements have made it possible to secure better returns on new electric vehicles (EVs) sold. Vehicular performance has also improved significantly in terms of consumption, energy efficiency and emissions of pollutants into the environment. These gains were the result of the introduction of more restrictive measures [2,3,4].
In this new market framework for the automotive sector, the energy efficiency of the electric car makes it a potentially important tool to reduce the environmental impacts of private mobility. Remarkably, electric motors convert between 59% and 62% of electricity emanating from the network into propulsion power, compared to conventional endothermic engines whose conversion rate from fossil fuel energy to propulsion power is only between 17% and 21% due to significant heat and transmission losses that occur [5,6,7].
As the number of vehicles on the road and the distances travelled continue to grow, it becomes necessary to establish a new clean, intelligent and complete mobility system that meets people’s transportation requirements and guarantees important new services to users. The transfer of some pollutants from the point of generation where the car circulates, to the location of the power plants allows not only a reduction in the subjects exposed to the pollution, but also a minimization of atmospheric pollutants, provided that the electricity used originates from renewable sources or from nuclear installations. This is true if the electricity used to power the car’s electric batteries is generated by systems capable of producing less than 700 g of carbon dioxide per kilowatt-hour, as pointed out by the International Energy Agency [8,9,10,11,12,13,14,15]. Therefore, this highlights the lack of environmental benefits in places where energy production systems depend mainly on coal. However, this transformation is not tied exclusively to technological improvements, but above all to man’s willingness and readiness to change his habits [16,17,18]. The transition is unlikely to happen rapidly. The de-carbonization process definitely requires extended time horizons, given the complexity that the subject presents. A combination of measures is needed, especially better urban planning, technological improvements, a wider use of alternative fuels, the continuous adoption of cutting-edge technologies and a more rigorous application of existing rules [19,20,21,22]. An overview of current and future challenges of the electric distribution system is presented in the next section. It will highlight the innovations that will be needed and constraints that the distribution system will likely encounter in future years in the objective to transform the current electricity grid into a new smart system that is able to tackle and automatically resolve problems. It will include a concise description of the current status, a summary analysis of the electric distribution system in smart grid with distributed generation, an overview of the interaction and synergy between the electric distribution system and ICT (information and communications technology), and finally a concise description of the electric distribution and future smart grids.
As disclosed by a literature survey, many researchers have examined the integration of EVs in smart grid (SG) and EV charging stations [23,24,25,26,27,28,29,30,31], vehicle-to-grid (V2G), renewable energy sources integration and SG operation in view of large-scale integration of EVs enabling V2G systems [32,33,34,35]. There are some works dedicated to electric distribution grids, the integration of distributed generation (DG) in the power distribution network in the framework of SGs [36,37,38,39,40,41,42]. For instance, Jordehi [36] reviewed the existing studies on distribution system optimisation problem from the viewpoint of the optimisation algorithm, objectives, decision variables, load model, case study, planning type and planning period that they used. The review found that although diverse optimisation algorithms have already been applied to distribution system optimisation problems, developing efficient algorithms with the ability of escaping from local optima and finding near-global solutions is required. This review also found that some aspects of distribution systems such as deregulation and demand side management have not been taken into account in modelling distribution system optimisation problem. Crozier et al. [37] quantified the impact that EV charging will have on transmission and distribution systems, and investigated how far smart charging can be used to reduce the impact on both systems. They analysed the effects that charging a large electric vehicle fleet would have on the power network, taking into account the spatial heterogeneity of vehicle use, electricity demand, and network structure. Ramadhania et al. [38] reviewed probabilistic load flow approaches for power distribution systems including photovoltaic generation and electric vehicle charging. Muttaqi et al. [39] assessed the technical challenges for electric power industries with implementation of distribution system automation in smart grids. They discussed switching DG sources, load deferral strategies and direct load control to achieve a reduction in load during peak periods, as well as the load management by load filling during off-peak periods. Tancredo Borges [40] reviewed reliability models and methods for estimating renewable energy resources influence on electrical generation availability. The models and methods may be used to evaluate the impacts on the distribution system’s reliability of distributed generation integration, especially when they are based on renewable energy sources. Results showed that the impact of DG on the reliability of electric distribution systems depends mainly on the operational mode and the energy source in which it is based. Ruiz-Romero et al. [41] developed and implemented in the city of Malaga, Spain, the integration of the applications of a SG and the use cases (UCs) for the different functionalities of SG. The smart city architecture proposed envisioned a hierarchical, distributed, and autonomous structure to address the challenge of smart distribution grids. Their results disclosed that new levels of standardization of languages and protocols and new interconnection functions will be required, allowing smart devices to recognize each other so that they can reconnect in case of failure regardless of the state of the network topology. They also concluded that renewable energy sources can be optimally integrated into the distribution grid. Generation can approach consumption through the installation of photovoltaic panels and mini-wind generators, with the reuse of electrical infrastructure. Worighi et al. [42] assessed the integration of renewable energy in a smart grid system. They developed a model and implemented the virtualised system, integrated solar power generation units, and battery energy storage systems with the proposed grid architecture. The virtualization of the proposed grid architecture addressed issues related to photovoltaic penetration, back-feeding, and irregularity of supply. Their simulation results revealed the effect of renewable energy integration into the grid and highlighted the role of batteries that maintain the stability of the system.
The understanding is that it gives the indication that no feasibility study or other work form have been realised on assessing the impact of EVs on the design and effectiveness of the electric distribution grid with DG including a photovoltaic (PV) system and energy-storage system (ESS) in SGs.
Therefore, considering the EV concerns and challenges in the context of the electric distribution grid, the objective of this work is to determine the likely effect that electric vehicles which are already in circulation, and whose penetration is expected to increase a lot in the future, will have on the distribution network. This study is in two stages: first, an evaluation of the impact of EVs on the already existing distribution networks, and secondly, gathering of the most significant data related to an uncoordinated charging strategy. Finally, a management model of the production and consumption of electricity, which couples a PV system with an ESS, is proposed to improve the critical aspects obtained from the first simulations. This solution is based on an algorithm that controls the charging and discharging of a battery according to the photovoltaic production to which it is coupled.

2. Current and Future Challenges of the Electric Distribution System

2.1. Current Status

Recently, the European Parliament has declared a climate and environmental emergency in Europe and worldwide, approving a climate measure. It is a “climate pact” with European citizens to eliminate polluting emissions by 2050. This is a crucial turning point towards the green economy that puts € 300 billion on the plate for the industrial transition.
Electric mobility is certainly significant with regard to pollutants such as nitrogen oxides and particulates, especially in city areas. The issue concerning greenhouse gas emissions is more complicated. Looking at the options available on the market today, conventional solutions also remain of significant importance. The construction of electric vehicles involves in any case not negligible greenhouse gas emissions.
It should also be underlined that, at present, endothermic engines, in particular the latest generation diesels can have CO2 emissions, in certain contexts, lower than those of electric vehicles.
Therefore, the elimination of diesel engines from the production of car manufacturers cannot be considered a correct and effective solution in environmental terms.
As for the construction of the batteries, the CO2 emissions linked to these productions are to be counted, also considering the electrical park of the country of production, which is usually not the one of use. On this basis, we can evaluate a moderately positive balance for the containment of CO2 in the vast majority of European countries. While for the major Asian market players, India and China, and in part also for the United States, the contribution is likely to become negative if looking at the current technological scenario and electricity generation. It is certain that, also for the production of energy, we are moving towards decarbonisation solutions, but this process will take many decades.
In the meantime, global energy demand will grow but the greatest demand will come up against a substantial decrease in the use of fossil fuels: balancing this change is the most important challenge. Renewable sources will grow but managing any further penetration will become increasingly challenging. Current lithium batteries are a consolidated technology. There may be further improvements, but their state of development is now significantly advanced. With current batteries, the auto industry is able to offer efficient vehicles at prices that we can already define today as of medium economic commitment. Net of technical peculiarities, such as autonomy and recharging times, there is another aspect that must be considered: the impact of electric mobility on the electricity generation and distribution network. This aspect adds to the investments for the creation of a capillary charging infrastructure. When the electric vehicles have a significant diffusion, the powers required for a reasonably fast recharge will be high. To recharge a car with 50 kWh batteries (the accumulated energy typical of a compact vehicle) in one hour 50 kW are needed, in half an hour, the kW becomes 100. Multiplying this quantity for the vehicles in need of a charging can become a huge power, in perspective even up to 50–80% of the current maximum power of the network. The result has a strong impact on the network in terms of power, but on balance, much less in terms of energy. This situation could jeopardize the quality of the electricity supply and the reliability of the infrastructure. Therefore, major investments must be made on the network to deal with power peaks. Moreover, it is important to remember that the cost of the installation depends on the power, while the user pays for the energy he consumes. Therefore, the practical risk is to invest a lot of money with a modest economic return.
As regards the Italian electricity distribution network, at December 2016 there were 391 thousand km of medium voltage network (MV) and 865 thousand km of low voltage network (LV), operated by 154 concessionaires, to supply more than 29 million users domestic and 7.4 million non-domestic users for a total distributed of 264,000 GWh. In the same year, 743,000 plants were connected to the distribution networks, of which 731,000 of the photovoltaic type, for a total of 30.6 GW and a gross production of 62.9 TWh, of which 78.2% RES (renewable energy sources), and a share of average self-consumption of 22.4%. The Italian national transmission network has a network extension of more than 66,000 km of lines and cables and 861 stations. The main problems relating to the network overload risks are known and the interventions are postulated in the plan mentioned several times. The electricity distribution network is made up of 391,000 km of medium voltage network (MV) and 865,000 km of low voltage network (LV), however, operated by 154 service concessionaires that supply about 29 million households and 7.4 million non-domestic users, for a total distributed of 264,000 GWh. The normalisation actions of the distribution networks are, therefore, borne by the various concessionaires, to be implemented through local planning, even if integrated with the national programming. In particular, the issues of congestion and energy storage need to be addressed again, also in consideration of the development of self-production plants. They will, therefore, be called upon to assess the feasibility of developing both rapid charging stations and increasing the power of domestic users. Containment of the impact of the peak demand deriving from the recharge period will, therefore, become a qualifying element of the interventions [43,44,45,46,47,48,49,50,51,52,53].

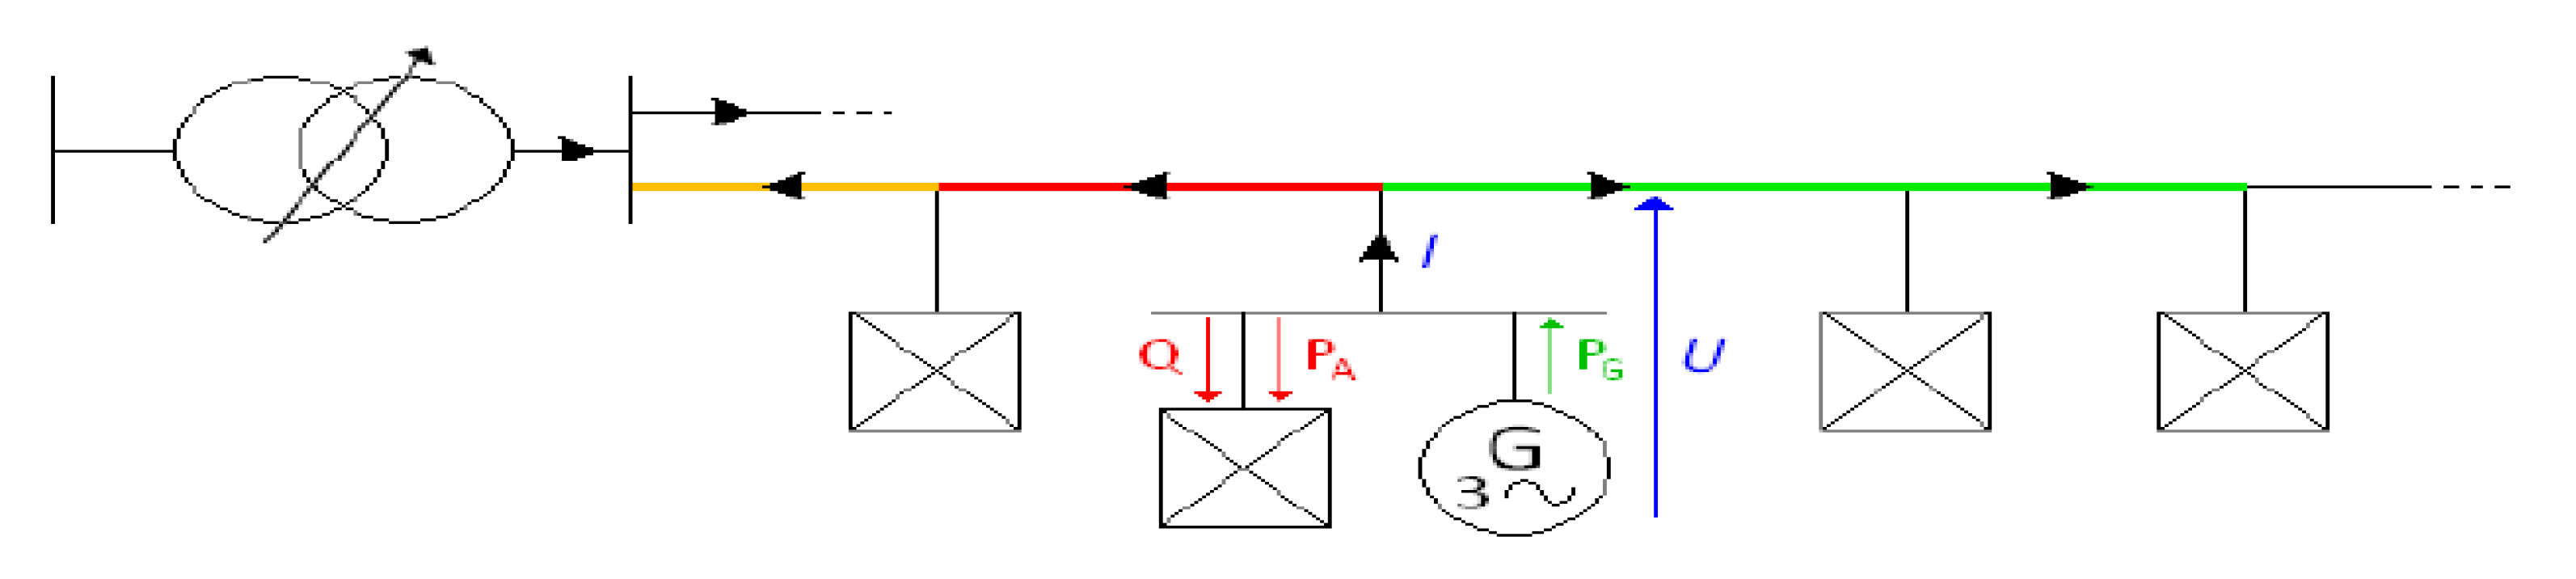
2.2. Electric Distribution System in Smart Grids with Distributed Generation

The overview of the challenges that the distribution system is facing and will have to face in the immediate future allows us to trace the profile of the most suitable technical solution for this purpose: smart grids (SGs). This term refers to an electrical network capable of integrating in a smart way the actions of all connected users in order to distribute energy in an efficient, sustainable, economically advantageous and safe way [52,53,54]. The radial network structure will be forced to face a significant “restructuring” since, so far, it has been studied and used over the years in a passive way and subject to a one-way flow of energy from the plants to the users. In addition, from an economical point of view, the only possible relationship was the one where the manufacturer sold its product to the consumer while now, a two-way relationship is possible, where also the consumer can produce and sell energy. An important aspect of current networks is that power plants, basically of a thermoelectric type, are placed at considerable distances from users, while the new and increasing presence of DGs (distributed generations) ensures that the generation itself is very close to the users, with an inevitable and positive reduction of losses, but an increase of problems from other points of view, which may include, for example the control of the reverse power flow through the transformers. In addition, on the one hand, the DG contributes significantly to achieve the objectives set at European level mainly as regards the achievement of the 20% threshold for the production of energy from renewable sources by 2020, but on the other hand the current distribution network architecture is an obstacle to the spread of distributed generation. Therefore, it is easy to understand that DGs connection to the distribution network is changing the structure of the network itself more and more, mainly that of energy production. This, associated with new demand-side management programs along with a certain evolution from the markets also, made passive users (customer of an energy distributor) much more active, thus bringing to the system producers, consumers and a new figure in the market: the producer/consumer, also known as prosumer. The goals set can only be achieved by evaluating the economic aspect linked to the new markets that will have to arise, in addition to the technological aspect. In fact, it is clear that in the near future the networks will have the task of feeding all consumers with criteria of convenience and at the same time satisfying those requirements for good power quality.

2.3. Electric Distribution Systems and Information and Communications Technology Interactions

The presence in the active networks of the future of the DG with a very high degree of penetration, means that there is an incentive to be able to exploit this characteristic aspect to one’s advantage, trying to make the SG improve the management of the network itself with a high-quality energy product and at the same time allowing a better integration of users who can take decisions based on price signals received. These networks, which are going to take advantage of the latest technologies, make it possible to increase the transfer of power, reduce energy losses and increase the efficiency of the supply, while the new technologies in the electronic and ICT (information and communications technology) field will allow better quality management and supply as well as control.
It is therefore clear that the research and development efforts that must be undertaken must keep in mind the economic, technical and regulatory aspects. The benefits brought by new technologies will have a positive effect for European citizens and for the birth of new businesses in the sector. Then there will be the birth of an even more liberalized market that will allow the user to actively participate in exchanges, with the birth of a new market for ancillary services where the user could for example find fair remuneration if it presents a flat load or generation characteristic curve which can be more easily managed by a distribution system operator (DSO), or if it should “supply” reactive power so as to participate in the voltage regulation. In addition to a bidirectional flow of energy, therefore, the new smart networks will require a bidirectional flow of information. To face the requests that are indirectly made to the networks, it is necessary for them to become “intelligent”. In fact, a smart network can be defined as a power grid that can integrate in a smart way the behaviour and actions typical of producers, consumers and prosumers with the aim of providing an effective sustainable, economic and safe electricity supply.

2.4. Electric Distribution System and Future Smart Grids

How exactly SGs will function is still difficult to say, however an evolution is expected both in terms of electricity generation and distribution, and in terms of system control. They must be able to react to external events and pursue efficiency objectives independently and in real time. The new network will have to allow bi-directional power flows caused by the DG, favouring in particular renewable sources and micro-generation systems. The latter allow increasing efficiency by approaching spatially the production and consumption of energy and reducing the intrinsic losses of the distribution system. The use of renewable sources also poses a problem in terms of control since the micro-generation systems are private, widespread and can belong to very different types; this makes centralized control by the distribution network operator difficult.
Furthermore, the generation capacity is highly variable, it depends on the local atmospheric conditions, and it is difficult to predict. With regard to the control, it must be provided that each device connected to the network is able to communicate and receive data and react in real time to events that come from other devices or from the electrical network itself: the SG will be an energy network dotted with sensors, actuators, communication nodes, control and monitoring systems. Technical objectives to be pursued are the reduction of peak consumption, the flattening of the load curve and the creation, at least theoretically, of a constant profile over time; this would create very high economic and management advantages. In fact, the cost of energy also follows normal economic laws and, when the demand is high, the price of energy increases. A “demand-response” infrastructure would not only enable new pricing schemes, but would also allow, in moments of overload, the shutdown of less priority electrical devices to be requested, avoiding blackouts or total disconnections of energy.
Smart grids must, therefore, be able to provide end customers with real-time information and allow identifying, quantifying and rewarding virtuous choices and behaviour. In other words, users must be directed towards eco-sustainable consumption patterns, behaviours and lifestyles. A great contribution from ICT will be necessary to put the different subjects in communication, in a safe and efficient way. In the scenario outlined, each user can potentially buy, but also sell, energy in a free market. The purchase and sale price will vary over time and will become the main tool capable of balancing the demand and supply of electricity. It is assumed that each user of this market will be represented by a software agent, who will act autonomously towards maximising their profit objectives. All this represents a real revolution compared to the current balancing system based on centralized control and with reactions very often entrusted to the intervention of the human operator. Rather widespread are reference scenarios of price-to-device where the cost of energy varies dynamically over time: the meters communicate any changes to the loads that coordinate to react and consequently adapt the consumption profile. This could be the case with electric vehicle charging: a negotiation between the vehicle and the charging station to choose the best compromise between the power required by the vehicle and the power supplied by the charging station. The latter is dependent not only on the technical characteristics of the station, but also on the technical constraints of the distribution network at that point and on the dynamic state of the network, which varies during the day according to the demand.
On a closer horizon, it is possible to assume that the producers connected to the distribution network will enter into bilateral contracts for the production of energy, which will define the daily production setpoints. These agreements are likely to cover the medium term, for example, annual agreements, in which each producer undertakes to supply power and energy established for the following 365 days. However, the distributor, who does not deal with contracts with manufacturers, may find himself faced with the need to personally provide system services and, therefore, a new and strong regulation has to be put in place. In order to be part of the exchange programs with the transport network or to guarantee the safety of the system, the DSO will be able to ask the generators every day for changes in the active or reactive aspects of the program. In this case, it will choose between the offers made by the producers themselves and the costs for the change of the exchange scheduled with the high voltage network (HV), the most advantageous solutions, which involve the lowest costs for the service. These costs will then be passed on by the distributor to end customers. There is also the possibility that some services are considered mandatory to allow connection to the producers’ network; one of them could be the power production variation. The remuneration of this service could be zero in all cases that does not lead to changes in the production of the established active power (this depends on the capability curves). In other cases, however, only the ΔP resulting from the change could be remunerated. In the current scenario and in the future, the DSO is obliged to allow the connection of generators of all types, making the procedure easier for the final user, allowing the possibility for all subjects to participate in the optimization operations of the system due to the large amount of information that the consumers have the possibility to receive, increasing the possibility of choice regarding the supply.

3. Electric Vehicle Impact Simulations

The following sub-sections will provide details on the case study definition, charging and base load profiles, battery energy storage system (BESS) and PV models and, control strategies. The impact of charging systems for EVs on the distribution networks is considered and described assuming the reference scenario of year 2030. Domestic charging modelled through home stations and the related impact on transformers and feeders will be simulated, considering the circulating electric vehicles will range from 20% to 80% of the total car fleet, as well as fast charging with fast-charging stations.

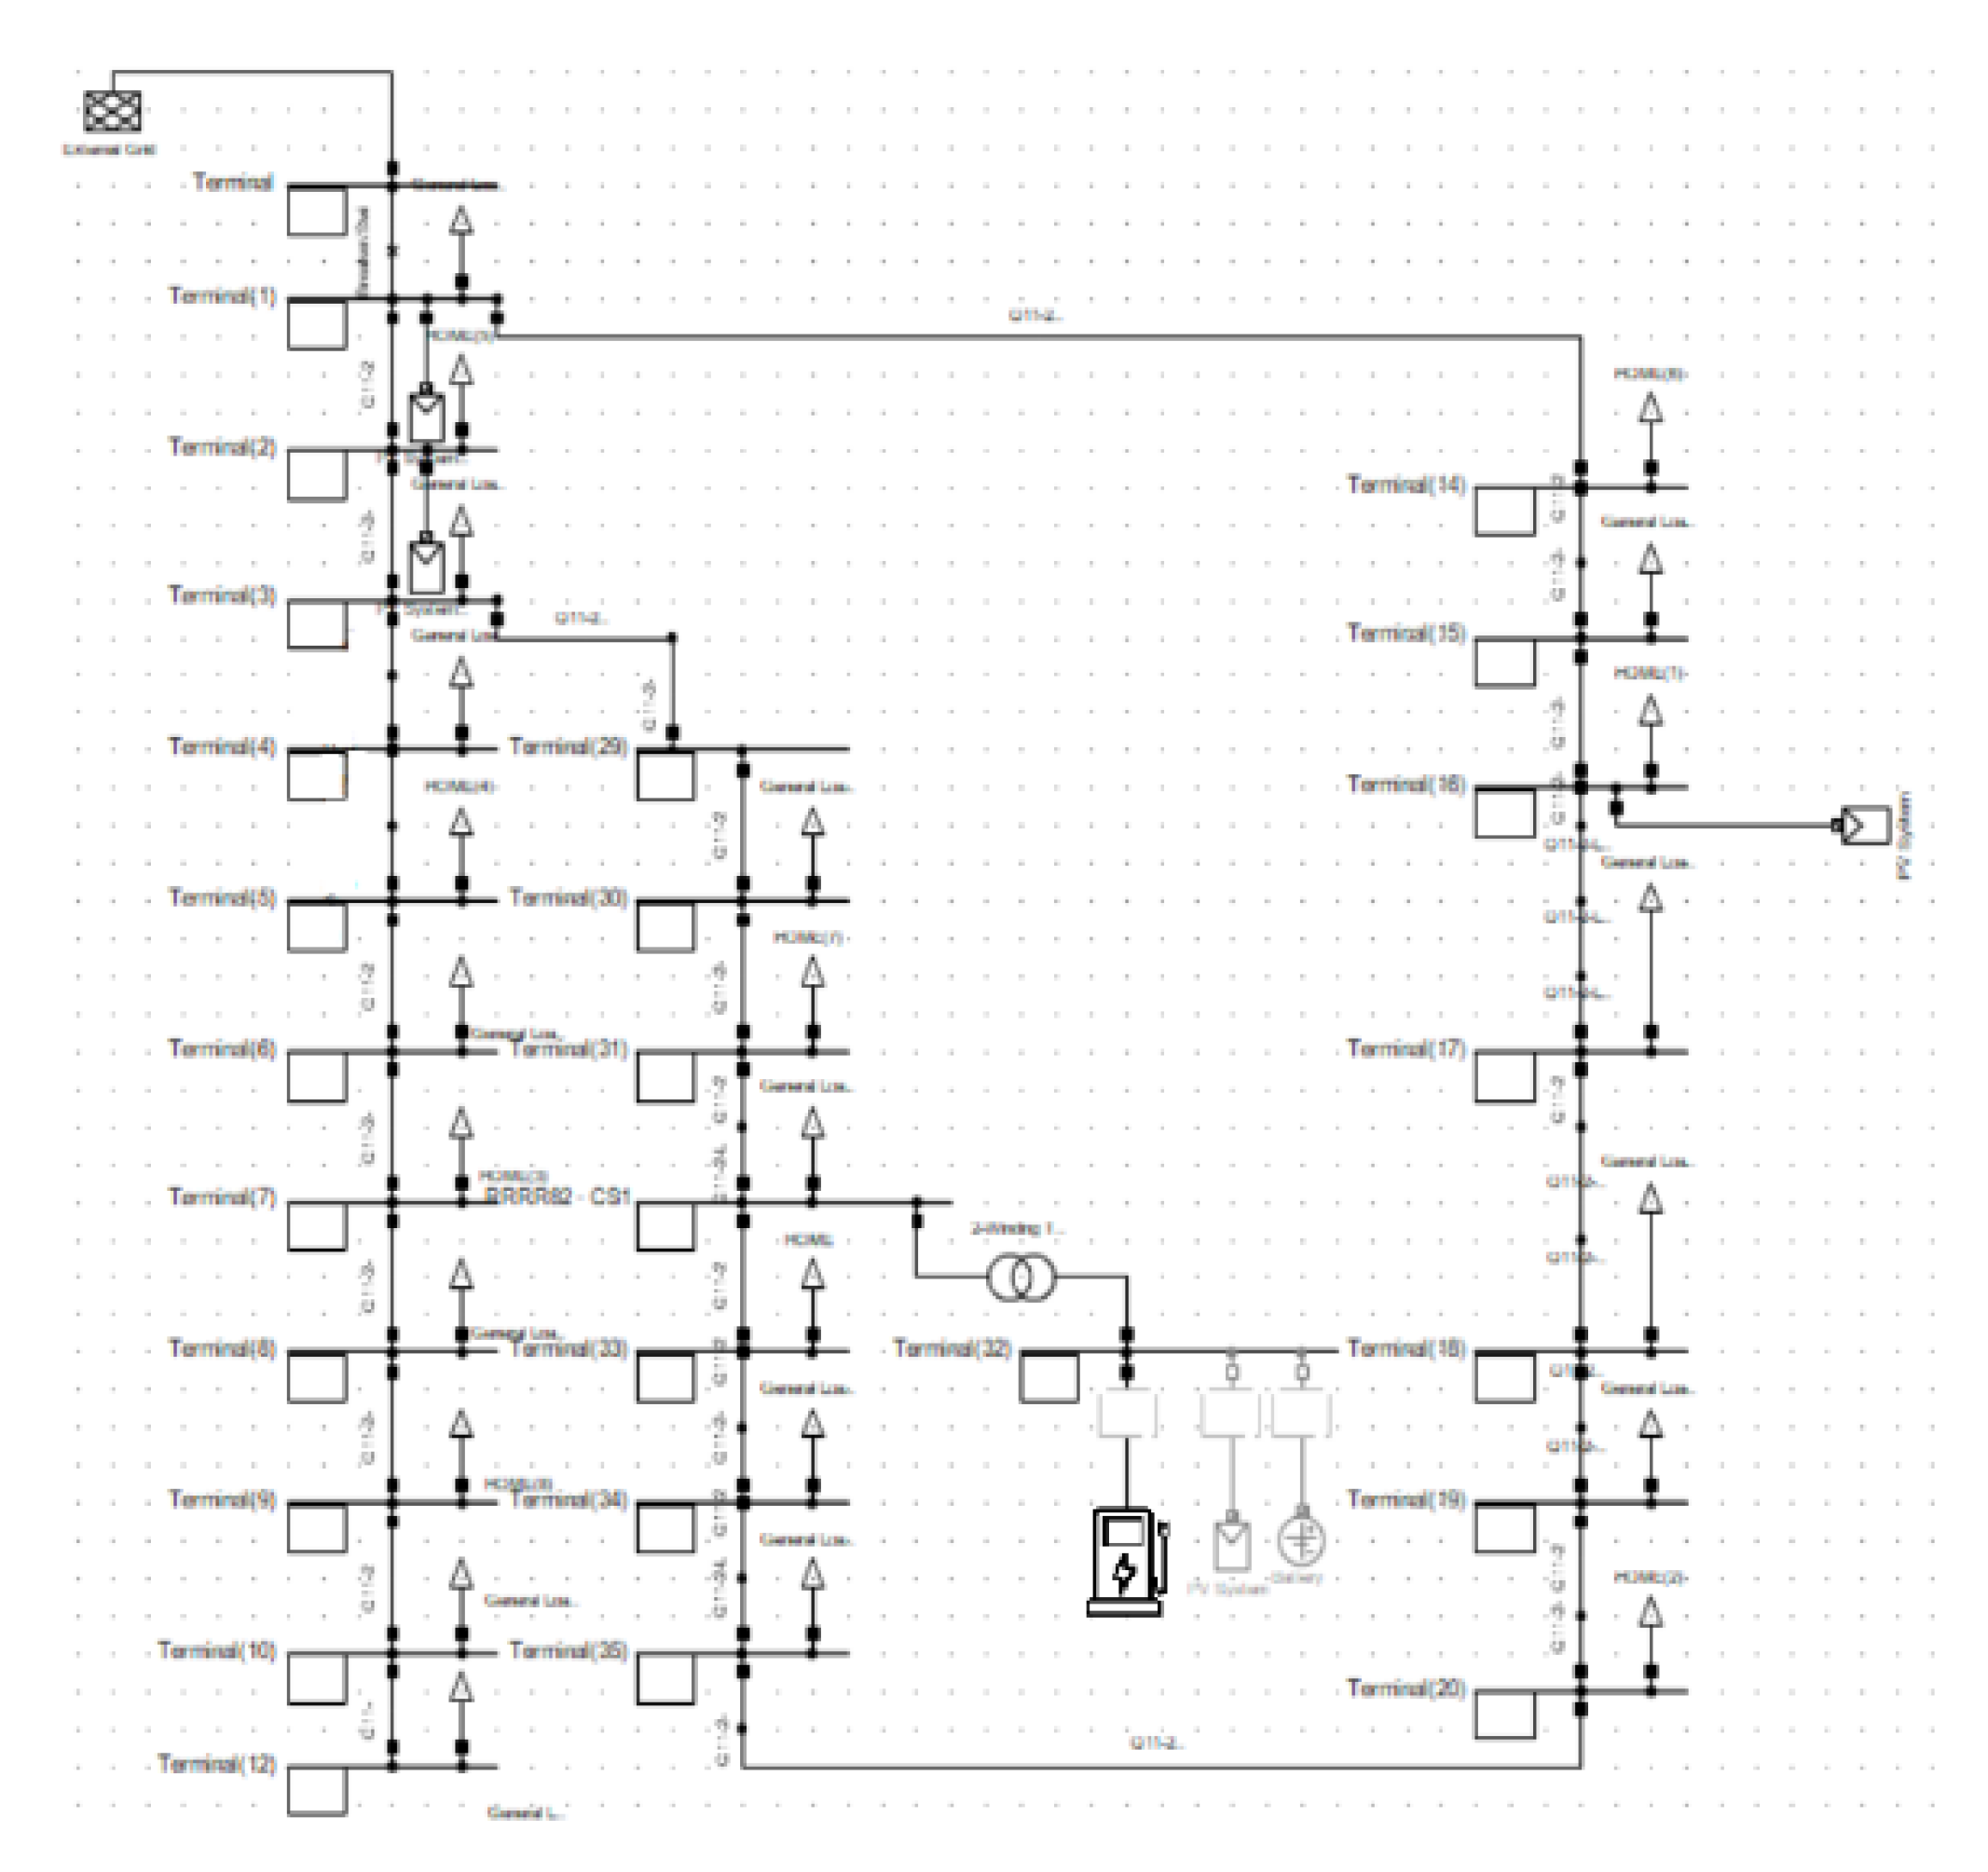
3.1. Case Study Definition

The focus of this analysis is to understand how EVs affect distribution networks and to determine the best intervention that would minimize the detrimental consequences on the network itself by means of smart strategies. The simulations carried out have made it possible to ascertain that the potential problems of the charging stations are not so much in the voltage drop as in the possible power overload of the lines and distribution transformers. The biggest contributor to network overload is determined by the number of EVs present and the energy that these require daily from the network, which depends on the trips made by end users. Finally, the distribution of charges in terms of both time and space also has a strong influence. For this reason, a script was created with MATLAB® (The MathWorks, Inc., Natick, MA, USA) to randomly generate data on user behaviour about travel but on a statistical basis that is typical of the Italian scenario. Data of interest are the four parameters: daily start time of trips; kilometres travelled per day; number of trips per day, and trip duration, presented in Figure 1.
The analysis was carried out on three portions of real networks that were reproduced on the DIgSILENT software. The three networks for each one has its specific characteristics are:
  • urban network,
  • rural network,
  • commercial network.
Both slow charging and fast-charging methods were assessed. The slow charge was expected mainly during the night in the urban and rural area, while fast charging would occur during working hours at points of interest such as shopping centres and parking lots.
The analysis involves examining the impact of both small and large diffusion of EVs by simulating four different scenarios for urban and rural networks as follows:
  • 20% penetration of electric vehicles,
  • 40% penetration of electric vehicles,
  • 60% penetration of electric vehicles,
  • 80% penetration of electric vehicles.
On the other hand, regarding the commercial network, the possible impact of installing super-fast charging stations up to 150 kW at points of interest was analysed.
From the assumptions made in this analysis, only one daily recharge is carried out at constant power in order to guarantee the complete recharge of the vehicle battery.
The simulations were performed using DIgSILENT® PowerFactory (Gomaringen, Germany), which is a calculation program for the analysis of extensive electrical systems, as well as industrial and commercial electrical systems. It has been designed as an integrated software dedicated to the analysis and control of electrical power systems in order to achieve the main objectives of optimising planning and operation [55]. The choice of DIgSILENT software derives from the fact that it enables a faithful reproduction of any type of network with a high degree of detail and also ensures great flexibility. The database used by DIgSILENT contains all the data necessary for all the devices within the electrical system (for example lines, transformers, generators, protection data), which eliminates the need to create specific models for any type of analysis (load flow, dynamic studies).
The three MV network models include the topology of the network, the data related to MV/LV transformers, and the parameters of the distribution lines. Regarding the LV sub-networks, the data provided relates to the number of final customers, the power and energy consumed and the possible presence of photovoltaic producers.
The simplified block diagram of the simulation environment is presented in Figure 2.

3.2. Charging and Base Load Profiles

The basic scenario was created starting from the data obtained by the historical Italian consumption data on the Entso-e platform [56] and scaled to reproduce a typical residential load curve which represents a usual scenario for an urban network. The base case load has the classic working day characteristic, so for simplicity has been assumed as a single profile, without distinctions between working days and holidays, while as regards the distribution of EV connections to the network, it has been assumed that there will be a greater concentration of recharge during the night from 6:00 p.m. and a lower concentration of recharge in the time intervals in which the movements are more common, therefore, between 7:00 a.m. and 9:00 a.m. and between 3:00 p.m. and 5:00 p.m.
To assess the impact of the diffusion of EVs on the electricity distribution networks, the load diagram was added to the average charging profile of the EV fleet. The profile in Figure 3 indicates the power required by the distribution network in percentage terms with respect to the total power of the batteries installed on the EVs, which recharge on the considered LV network.
A first scenario in the absence of EV as in Figure 4 has been simulated to obtain the data relating to the base load curve in order to have a reference to appear with the other simulation results. The load profile begins to rise from 6:00 a.m. to 5:00 p.m. when the peak is reached. The power required is fairly constant, around 40%, during the night, therefore it increases sharply with values that reach 80% during the morning. The highest peak is reached around 5:00 PM, which exceeds 90%, but never reaches 100%. The electricity load decreases at a higher speed than its initial start and between 5:00 p.m. and 8:00 p.m., then the load levels are maintained for a short period.
For each scenario and for each type of network, a Quasi-Dynamic simulation was carried out, which allows an analysis for medium-long term scenarios. From the data obtained, it was possible to investigate the most loaded feeders, which are generally located immediately downstream the Primary Station, being crossed by all the energy necessary to feed the entire network powered by the HV/MV transformer and the load percentage of the MV/LV transformer. In particular, the basic load percentages of MV/LV transformers are reported for both urban and rural networks for the penetration of electric vehicles cases of 20% and 40%.
Assuming for each secondary substation for about 300 customers are powered, it was assumed that a load of 60 EVs and 120 EVs were added to each MV/LV transformer. Considering that domestic charging stations guarantee an efficiency of just over 90% and assuming on average six hours of charging, to cover a daily distance of 15 km each vehicle requires 2.8 kW of power.
If, on the other hand, while maintaining an efficiency of approximately 90%, the vehicle was recharged in just one hour, approximately 17 kW would be required. This value is obtained from the ratio between the energy required by the battery (assumed to be 15 kWh) and the efficiency of the charging station, generating a much heavier impact for the entire network. Therefore, the 2.8 kW obtained previously represents only 16.47% of the maximum power.
The simulation provides graphs that will be presented later on in the next sections. In terms of voltage, no critical impacts were detected on the network to the point of requiring intervention. The installation of photovoltaic systems has contributed to raising the voltage level without, however, going beyond the limits set by the CEI 50,160 standard.

3.3. Battery Energy Storage System (BESS) and Photovoltaic (PV) Models and Control Strategies

Nowadays, Li-ion technology is dominating the market for portable devices, including EVs, but it is also increasingly used to support the RES management, in order to increase the hosting capacity. In case of a high penetration of DGs, it could be tough to properly manage the distribution grid. Therefore, in order to cope with this “new” problem, new solutions are under evaluation. BESSs are pivotal for some of the challenges of the modern society: the transition towards a renewable-based energy system; the rural electrification of developing countries and to facilitate the inclusion and the management of EVs charging processes. What is important is to identify which technology is the most suitable for the different final application, because no BESS is able to fulfil the needs of every possible service. In this case, it is necessary to focus on stationary applications. The higher are the two indicators, the better the performances of the battery will be. Lithium-ion technology has the best combination of energy and power performances, so it appears to be the most suitable chemistry for stationary application. However, lithium ion BESSs cover less than 30% of current stationary installations around the globe. The main reason is represented by the high cost of installation if compared with the other ESS technologies. BESS are well suited for almost all utilizations, but the most appropriate one is with particular tendency for renewable integration, frequency regulation, off-grid systems and peak-shaving. In particular, if the storage is deployed in conjunction with local generation, it ensures reliability by filling the gaps between production and demand. In this case, BESS can range from tens of kW up to tens of MW.
The energy storage system is the component that allows being more flexible in the energy management throughout the day as the photovoltaic energy production is not always available. Lithium-ion battery energy storage systems are typically used for applications related to power plants due to the high energy density and the longer lifecycle compared to other battery technologies.
Three PV alternatives are presented in Figure 5.
For the purpose of selecting the nominal power and energy for the ESS, two parameters were evaluated, depending on the different PV technologies and Self Consumption (SC) thresholds, whenever PPV > PLoad the maximum power difference PPVPLoad throughout a day; the maximum energy excess that could be stored in the typical 12 days of the year.
The CIGS (copper indium gallium (di)-selenide, compound semiconductor) technology allows the lowest power difference and energy excess given a certain self-consumption threshold, which are respectively equal to 23 kW and 150 kWh for a SC = 0.65.
In addition, two further considerations are needed to select the correct storage system size. First, it is necessary to consider the state of charge (SoC) of the energy storage system, computed as:
S o C ( t ) = S o C ( t 1 ) + P t E S S 4 × E n E S S
whose operating window could be limited between 0.2 ≤ SoC ≤ 0.9 following the charging and discharging process.
Then, for simulation purposes, a constraint on the daily operation of the ESS has been added. It is necessary to have the same SoC at the beginning and at the end of the day, in order to replicate the same performance each typical day of the year.
In order to store the greatest amount of energy during the day, the best choice is to set the minimum level of SoC = 0.2. The energy constraint is the most important one to select the size of the ESS. There is a trade-off between a big ESS, which would be too costly and might be used only few hours per year, and a smaller one, which would lead to high amounts of energy sold to the grid instead of being self-consumed. Therefore, a model has been chosen with 300 kWh battery capacity, with 50 kW inverter nominal power that is limited not to oversize the inverter itself and the downstream protections.
The management of the ESS power, and the power from/to the grid, P could be performed in different ways. The load must be matched according to the following power balance as expressed in Equation (2), where the generator convention is adopted:
P = PLPESSPPV
For the periods when P is positive (hence the PV system is generating more power than the load can consume) the battery system may charge to replenish the state of charge.
For the periods when P is negative (hence the load consumes more power than the PV can generate) the battery system may discharge to minimise the power net import from the supply network.
A deadband may also be introduced in order to avoid unwanted behaviour using PStartFeed and PStartStore thresholds, which are parameters embedded in the QDSL model of the battery. Hence, a charging/discharging operation mode can be identified based on the power flow through the supply line. This operation mode, charge P is defined as shown in Equation (3):
c h a r g e P = { b a t t e r y   c h a r g i n g b a t t e r y   i n a c t i v e b a t t e r y   d i s c h a r g i n g
An important parameter of a battery model is the battery’s state of charge SoC (expressed in %) and defined as the percentage fraction of the energy still available in the battery over the total energy when the battery is fully charged (denoted by C). The state of charge is hence a state variable of a battery model, with 0 ≤ SoC ≤ 100. In its most simple representation of a battery, the time dependence of the battery’s state of charge SoC can be defined by the following differential equation:
d d t S o C = P E S S ·   100 C   ·   3600
where PESS is the AC power flowing through the battery branch, under the assumption of a unity transfer efficiency between the alternating current (AC) and direct current (DC) side of the battery converter system.
Further considerations must be taken in the QDSL model in order to limit the charging/discharging modes of the battery depending on the current SoC at any given moment in time. This operation mode, chargeE is defined as indicated in Equation (5):
c h a r g e E = { S o C   S o C m i n S o C m i n   S o C S o C S o C m a x   S o C m a x
where SoCmax and SoCmin are the maximum and the minimum allowed state of charge setpoints respectively, and 0 ≤ SoCminSoCmax ≤ 100.
In this analysis, the ESS is assumed to be continuous in order to recharge it only when PPV > PL and SoC ≤ 0.9.
If the PV production further increases with SoC = 0.9, the energy excess is sold to the grid.
On the other hand, whenever PPV < PL and SoC ≥ 0.2 the ESS is continuously discharged.
If the load demand further increases with SoC = 0.2, the lack of energy is bought from the grid.
In this way, the ESS is never interfaced with the main grid: neither can it sell energy, nor be recharged from it.
On the one hand, this way of operating the ESS is easy to implement and allows a SC = 1: in this case, as all the energy produced by the PV is self-consumed by the load.
On the other hand, it does not provide any optimisation like minimising the cost of the energy bought from the grid. Using the battery with 300 kWh capacity, the trend of the power from/to the grid, during the year, clearly shows the ability of the system to entirely store the energy excess, as it is never sold.
During each typical day there are two power peaks for the requested power, immediately before and after the operation of the PV+ESS system as can be seen in Figure 6. According to the convention used, the negative sign refers to the power flowing into the battery as it is recharging. Therefore, between 10:00 a.m. and 5:00 p.m. the curves are negative, because the little amount of EV charging, allows the battery to be charged by the power produced by photovoltaic panels. The charging interval of EVs starts generally around 6:00 p.m. that is when the first peak occurs. Most of the vehicles are connected to the home stations causing the discharge of the battery. The second peak occurs instead around 1:00 p.m. when just few vehicles are charging, and it represents the maximum level at which the battery can be charged. So, as can be seen, the ESS is never fully charged up to a SoC = 0.9 through all the year, so that lower ESS sizes can be evaluated in order to find the optimal one.
To model the battery in the network, a DIgSILENT tool was used that allows quasi-dynamic models (QDSL Type) to be built and a code was implemented using the DIgSILENT programming language (DPL), which provides an interface for the automation of the activities in PowerFactory.

4. Results and Analysis

This section will provide the results and analysis of the different cases of the EV penetration in urban and rural networks, as well as the results of the effect of the installation of ultra-fast charging infrastructures on the elements of a commercial network.

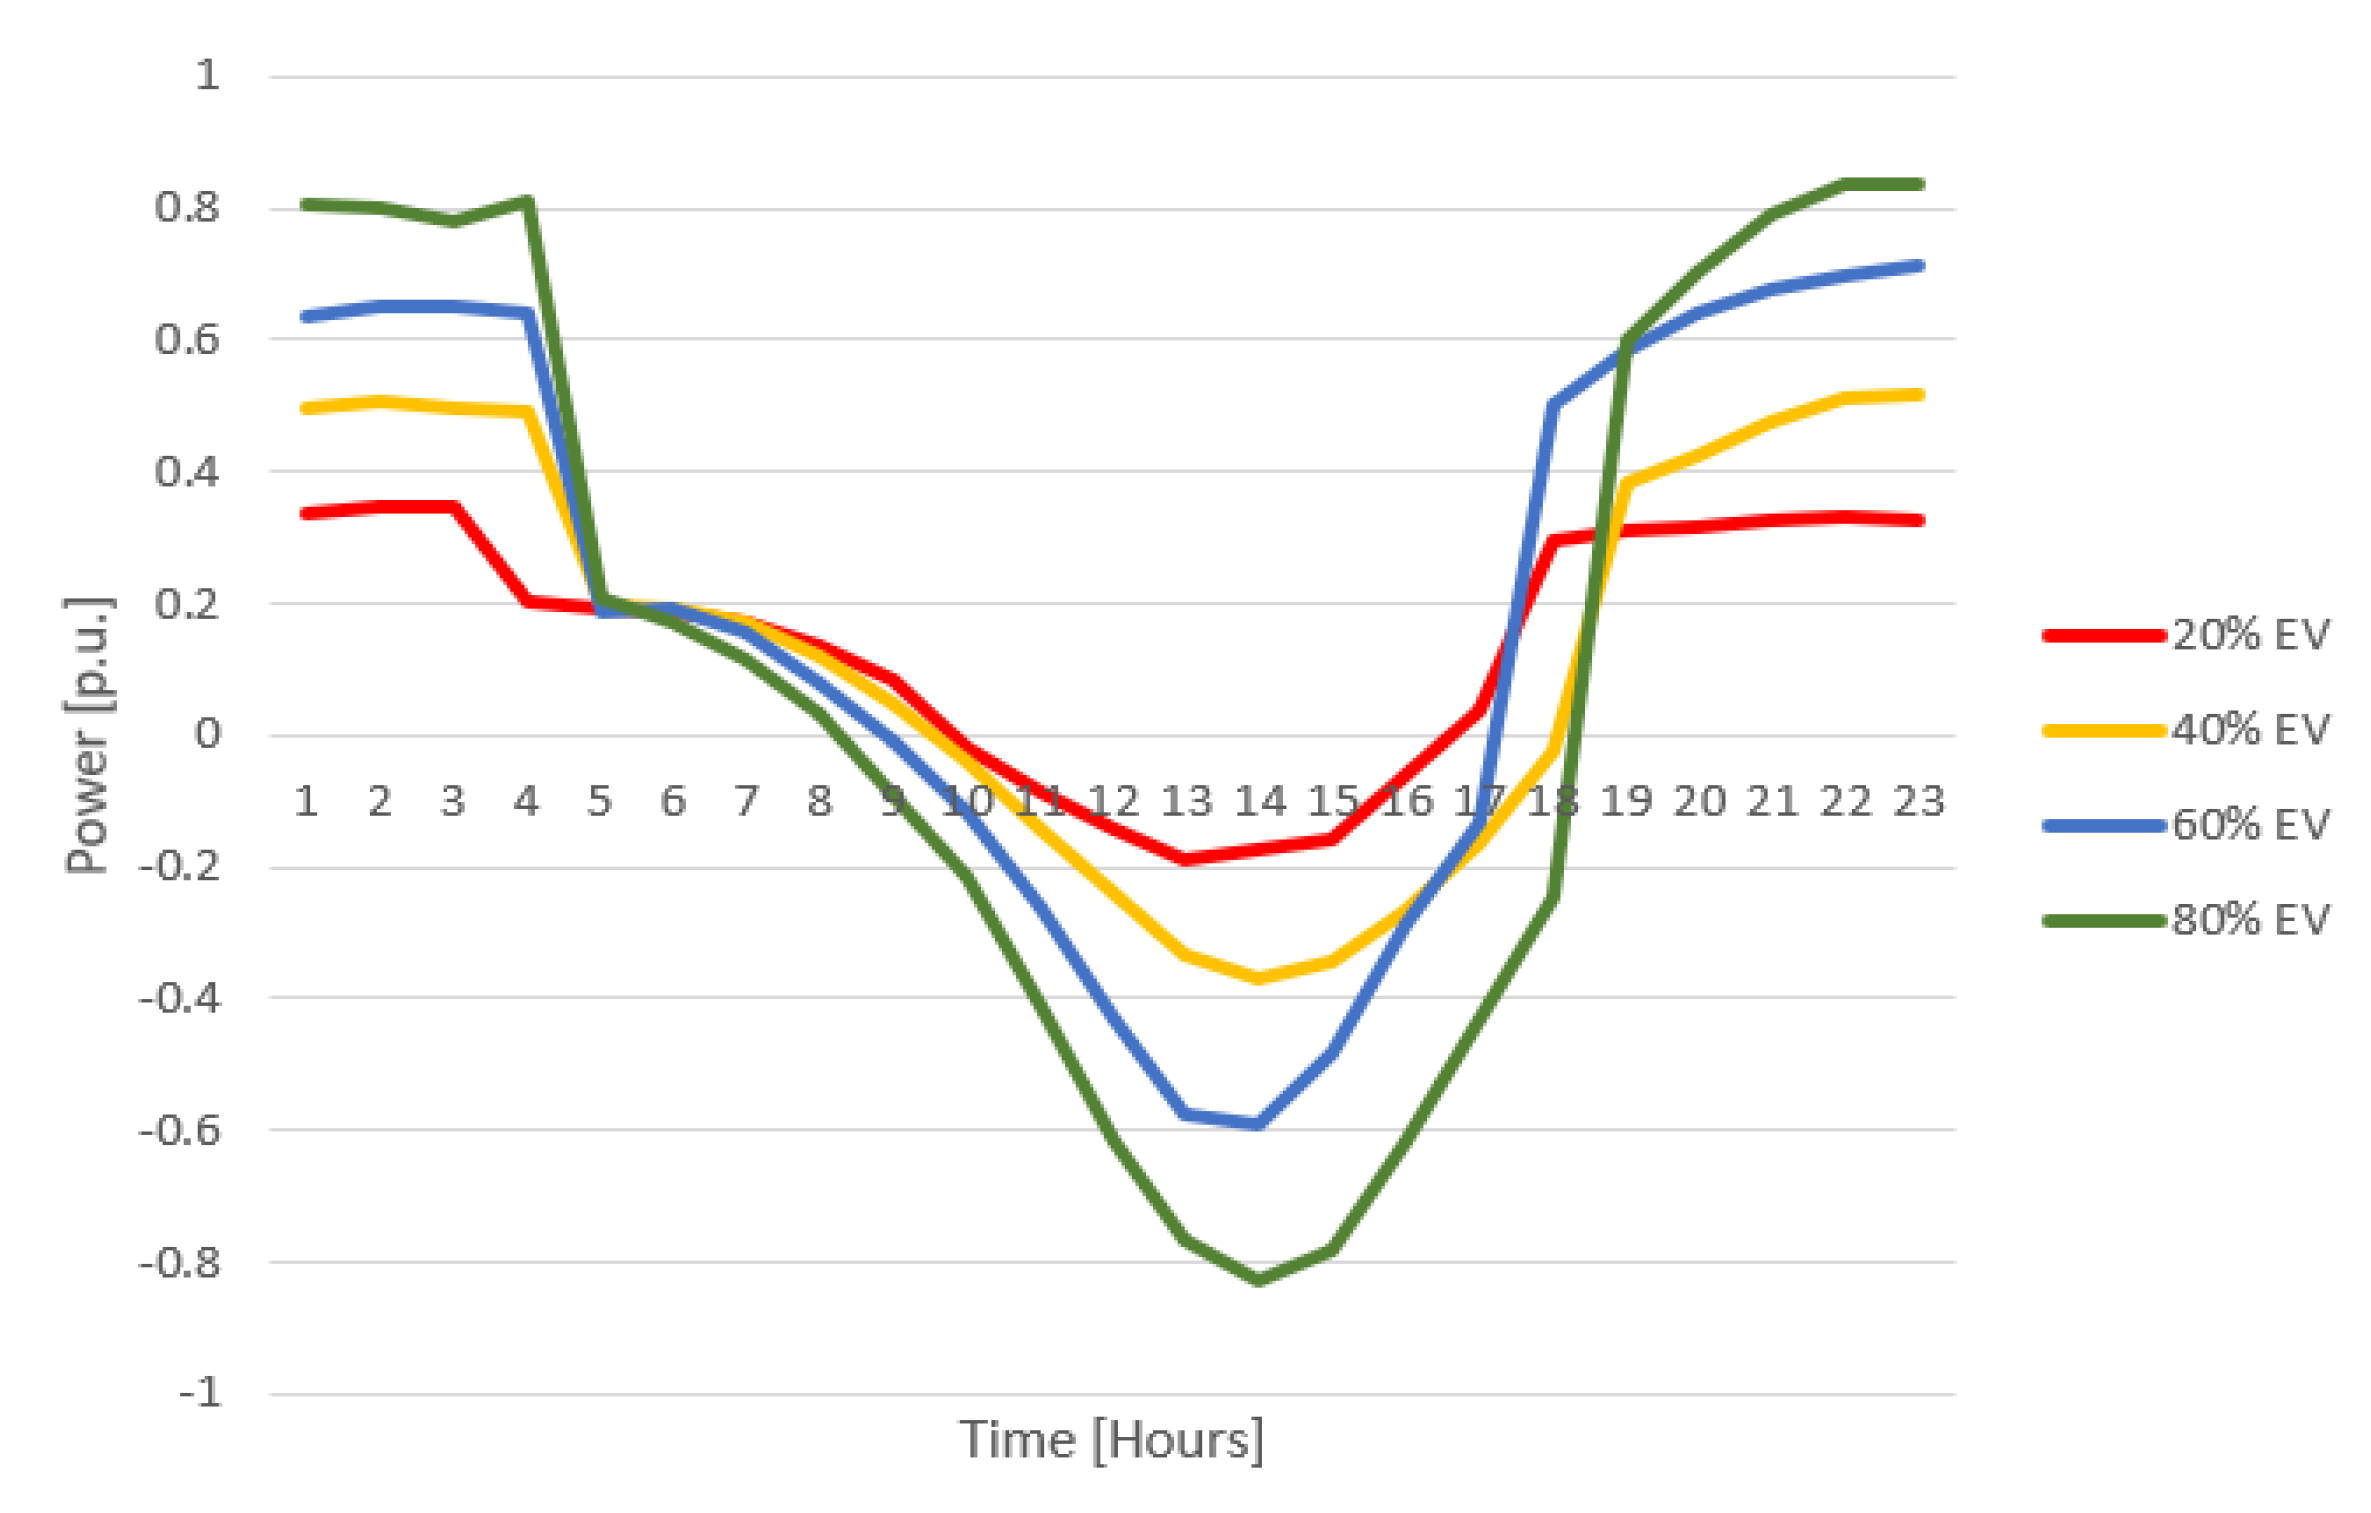
4.1. Electric Vehicle (EV) Penetration in Urban Network

4.1.1. Case 1: 20% EV Penetration in Urban Network

The set of analysis performed on the urban network is based on the grid shown in Figure 7 focusing on the MV/LV transformer feeding LV households aggregated as a unique load. In the evening, the transformer works over 100% of its capacity, reaching 121.81%. As far as transformers are sized to reach 150% of their capacity, it was considered appropriate to evaluate a smart solution, to limit its stress and, therefore, the wear it would have been subject to over the years, reducing its useful life. Alternatively, an infrastructure reinforcement intervention would be needed to bear the extra load, with a consequent significant economical investment.
Figure 8 represents the results of the simulations, highlighting the efficient effectiveness of the coupling between PV and storage system.
This allowed the reduction of the amount of energy through the transformer, granting, in particular during its maximum operating peak, to go from 121.8% to 108.4%.
It can be noted that during the central hours of the day, in correspondence with a massive photovoltaic production, the transformer undergoes a considerable reduction in loading; however, these results depend on the simplified assumptions that consider a high solar production, thus always guaranteeing a sufficient quantity of power. If the photovoltaic production was reduced compared to the case in question, there would be less benefits in terms of limiting the stress on the transformer, which, however, as previously observed, would still be able to withstand the load being sized to reach 150% of the its nominal capacity.

4.1.2. Case 2: 40% EV Penetration in Urban Network

Figure 9a shows how a more massive penetration of electric vehicles on the network being analysed can be tolerated without the need for infrastructural interventions, but that the development of smart techniques for managing voltage profiles and managing loads can help to reduce the stress on the most sensitive network components. The transformer load peak decreases from 132.6% to 119.3%.
Figure 9b shows the voltage profile of the most loaded feeder, which in case of EV penetration without any smart control applied, follows almost entirely the trend of the base case profile, except for the time intervals.

4.1.3. Case 3: 60% EV Penetration in Urban Network

Figure 10 shows that a consistent diffusion of EVs on the urban network is harder to manage because the MV/LV transformer feeding the LV network works for several hours above 120% of its nominal capacity reaching the peak of 138.63%, which is almost 60% higher than the base case peak equal to 82%. Although the voltage profile is still within prescribed limits, the voltage drop almost reached 6% with the effects of the coupling between PV and ESS still mitigating the situation.

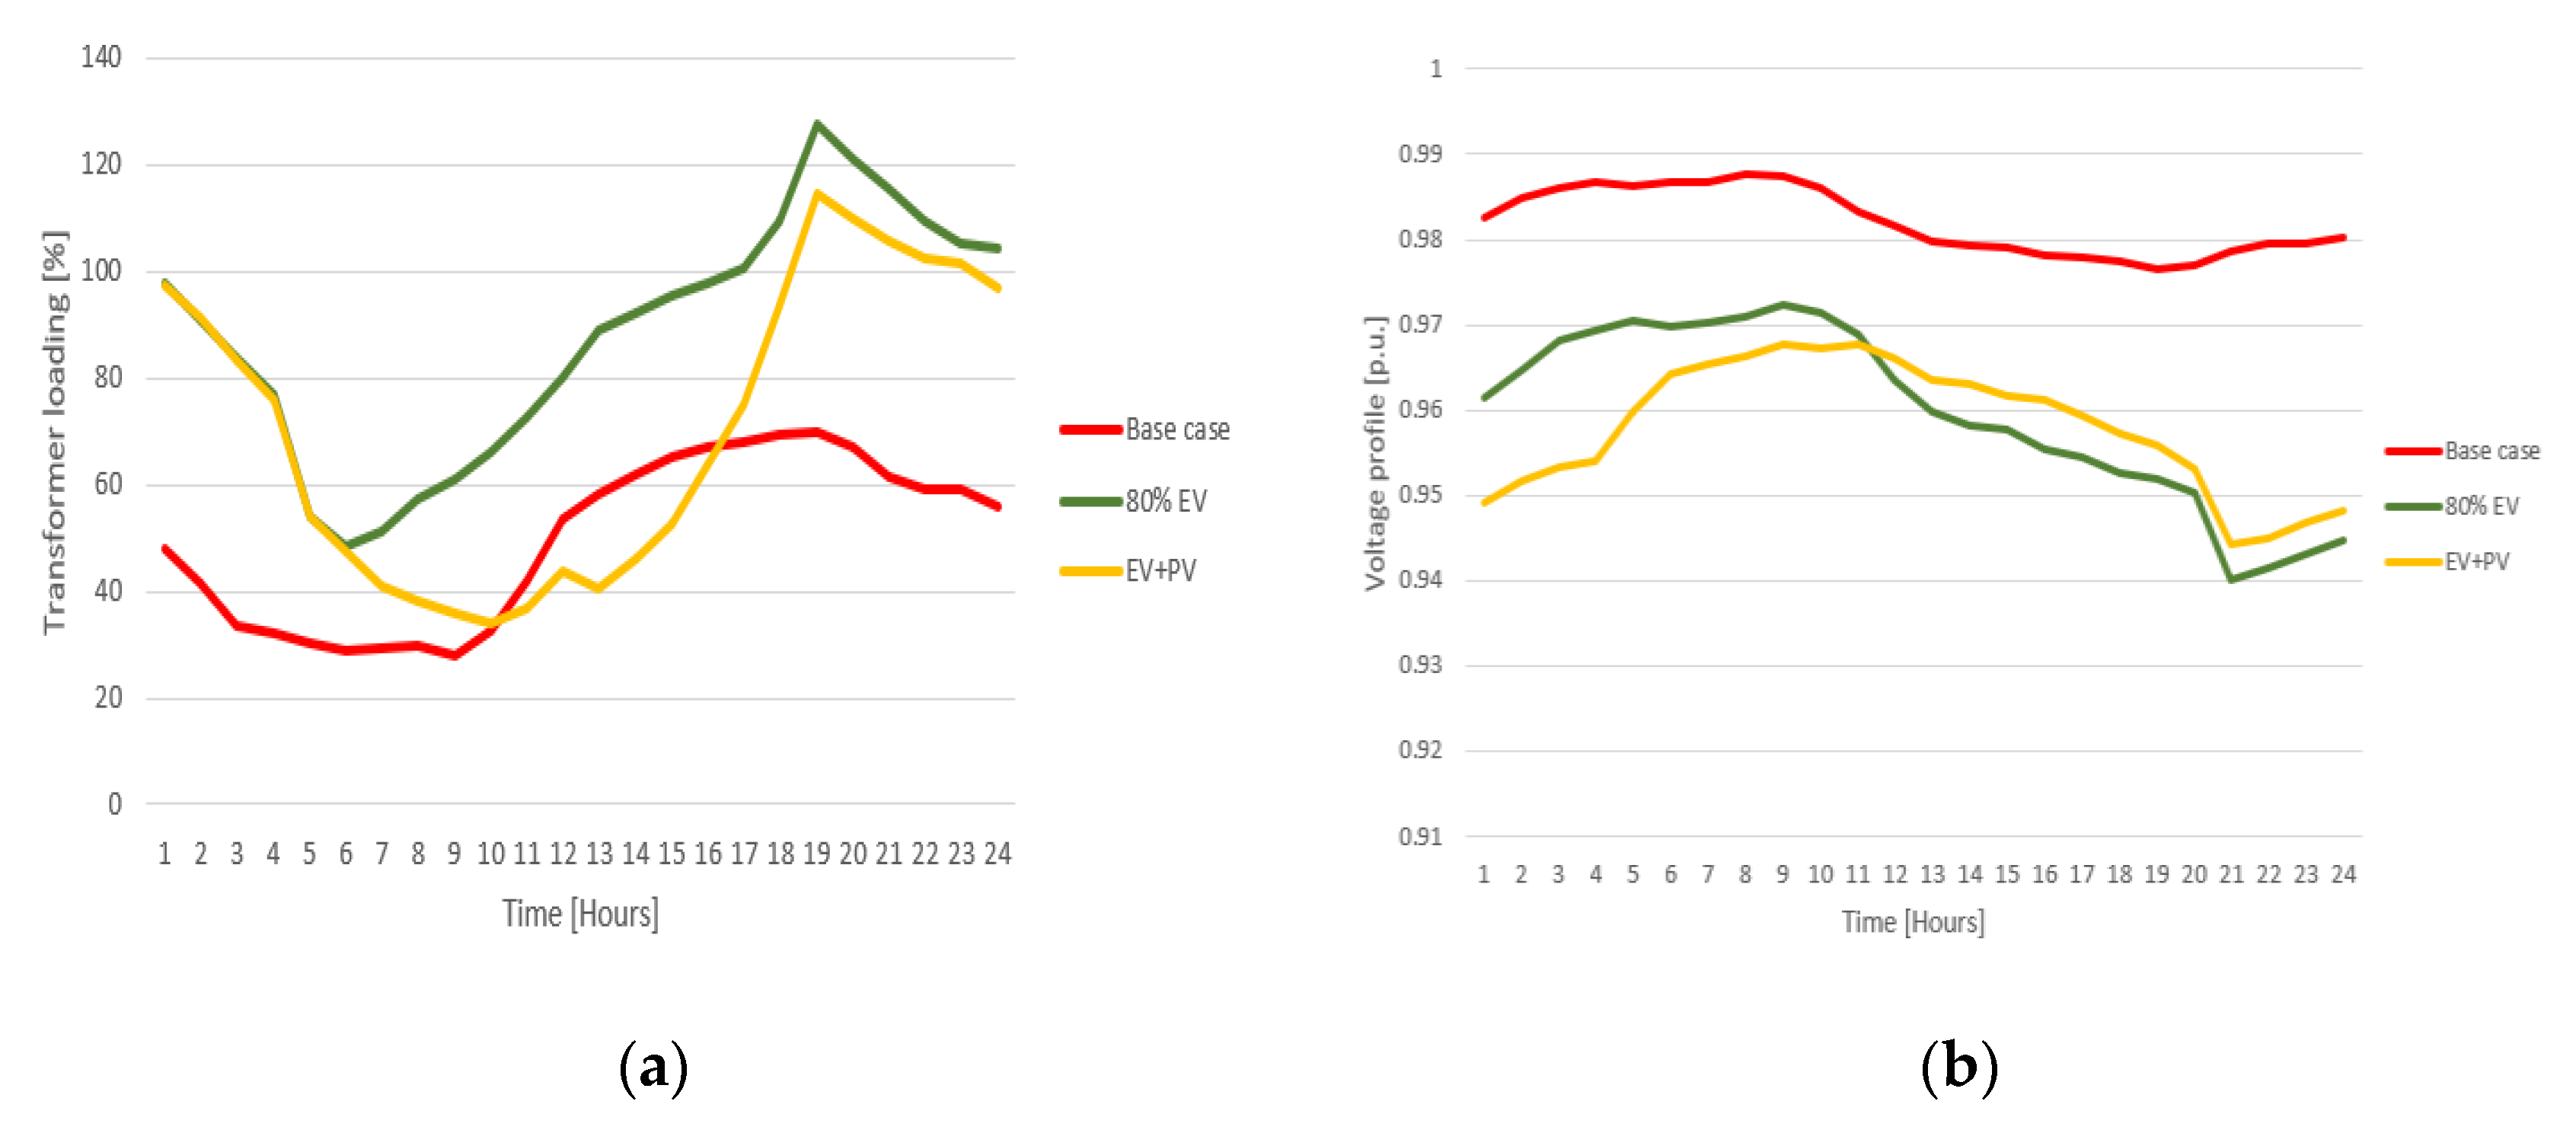
4.1.4. Case 4: 80% EV Penetration in Urban Network

The last set of simulations for the urban network, presented in Figure 11, examine the worst-case scenario in which, in 2030, 80% of the entire car fleet is electric. In this case, the transformer overcomes the 150% peak capacity threshold, and since it will work above 100% of its capacity for almost half of the day, even with smart techniques applied, it should be considered to substitute it with one of a bigger size. The voltage profile is critical since it almost reach the lower value accepted by the norm of 0.9, so an unexpected increase in the residential demand independent from the EVs consumption, can cause a further drop below the minimum threshold. Smart techniques, instead, allow keeping the voltage profile widely within limits.
In Table 1 are summed up the loading data related to the 400 kVA urban transformer for the different scenarios analysed. With respect to the base case peak, which is around 80% of the nominal power of the transformer, the peak values showed in Table 1 are significantly higher. As can be seen, up to 60% EV penetration, the transformer can still withstand the additional load for some hours, even if, in order to prevent it from a reduction of useful life, the application of smart techniques, can improve a lot its working condition. In case of an 80% penetration of EVs, instead the installation of a 630 kVA can be a suggested choice. However, as can be seen from Figure 8, Figure 9 and Figure 10, in fact, the implementation of PV coupled with ESS is capable of reducing the power flowing through the transformer, even in case of maximum EV penetration, and in particular, during the central hours of the day, when the energy production from photovoltaic systems is at its maximum, the minimum loading of the transformer is even below the base case scenario.

4.2. EV Penetration in Rural Network

4.2.1. Case 5: 20% EV Penetration in Rural Network

The set of analysis performed on the rural network, is based on the grid of Figure 12 focusing on the MV/LV transformer feeding 12 LV households.
The results obtained in this scenario, are presented in Figure 13. The base case shows that the MV/LV transformer is less loaded with respect to the case of the urban network, serving a lower number of customers. Thus, the impact of EV in still evident, but even during the peak period, the maximum value of 86.53% is highly tolerable, in fact the increment, with respect to the base case is around 15%. The voltage profile is very similar in each case, meaning that currently this level of diffusion of EVs is acceptable without any interventions.

4.2.2. Case 6: 40% EV Penetration in Rural Network

In addition, in this scenario, the outcomes of which are presented in Figure 14, the results are acceptable, showing that the MV/LV transformer is able to sustain the 40% EV penetration with the maximum peak of 102.2%. The impact of the EV does not require any interventions but the coupling of photovoltaic and battery system can be useful in the future, to face even higher penetration of vehicles. Neither the voltage profile is affected significantly since the variation with respect to the base case is less than 1%.

4.2.3. Case 7: 60% EV Penetration in Rural Network

Increasing diffusion up to 60% of the total car fleet of EVs in a rural network can still be managed without any criticalities as observed in Figure 15 both for the MV/LV transformer and the most loaded feeder voltage profile. In fact, the transformer hardly works above 100% of its nominal capacity, which was overcome only in the peak hour. The voltage profile is never below 0.965 so widely within the limits, with a variation around 1% in the worst case.

4.2.4. Case 8: 80% EV Penetration in Rural Network

The last set of simulations for the rural network as in Figure 16 shows that the impact of a massive penetration of EVs is not producing too many criticalities for the transformer, even if the loading in its peak increased from 66% of the base case to 128%. This value can be reduced to 117%, implementing the PV coupled to the ESS. The voltage profile is not so much affected, since even in the worst case it reaches 0.94, with a voltage drop of 4% from the base case. This means that the rural network analysed is a robust and oversized grid, capable of withstanding a large amount of additional power.
In Table 2 are summarised the loading data related to the rural transformer for the different scenarios analysed. The results are much lower with respect to the ones presented in Table 1, because of the reduced load that the transformer is feeding. In fact, the base case peak, reaches almost 50% of the transformer nominal capacity. The peak hour, in which most of the electric vehicles gets charged, corresponds to the time when people gets back home and shows that the installed 250 kVA transformer is capable of withstanding the additional load, since it is dimensioned to work up to 150% of its nominal power. Even in case of an 80% penetration of EVs, which is an unlikely scenario in 2030, the transformer can work up to 128%, so it will not be necessary to substitute it, but the application of smart measures will help relieve the load in the most congested hours. As can be seen from Figure 11, Figure 12, Figure 13 and Figure 14, in fact, the implementation of PV coupled with ESS is capable of reducing the power flowing through the transformer, even below the base case scenario.

4.3. Fast Charging Station

The latest set of simulations was performed with the aim of assessing how much the installation of ultra-fast charging infrastructures, characterised by a rated power of up to 150 kW, could affect the elements of a commercial network. Figure 17 presents the commercial network on which the simulation has been performed, putting in evidence where the charging stations were installed.
In fact, the installation of this kind of charging station is still mainly located in points of interest such as shopping centres, interchange parking lots and highways. The goal is to allow recharges of up to 80% of the total battery capacity in about half an hour. However, in urban centres, the implementation of this technology is not yet widespread, but several studies [57] assume that service stations within urban centres can be converted into hybrid stations, allowing both the recharging of electric vehicles and the refuelling of those with internal combustion engines. The presence in several points of interest of a high-power multi-standard fast charging station capable of delivering DC power of up to 150 kW DC and additional 65 kW of AC power for vehicles without DC charging option and built in inverters has been assumed. According to the technical documentation of the chosen column [58], the power needed to charge the vehicles is distributed, through the dynamic power management, guaranteeing the first connected vehicle a continuous power of 120 kW, reduced to 60 kW and maintained in case of the connection of additional vehicles.
In the simulation model, an element already present in the DIgSILENT software library was used, which represents a load of MV, since the connection technical standards [59] provide that loads between 100 and 150 kW can be installed either in MV or LV, however, the choice commonly adopted by Enel, foresees the installation in MV.
In a real condition, fast charge stations, if installed on an LV grid, can be powered directly by the transformer of secondary substation, through a dedicated feeder. The simulation predicts the worst-case scenario, in which four vehicles are connected to the charging station at the same time, assuming that the users of the service recharge their vehicle for limited time intervals, compatibly with the staying time. Exploiting an option of the simulation software, a single charging profile was used for simplicity, shifted on different time slots, assuming that in two intervals, between 12:00 a.m. and 1:00 p.m., and between 6:00 and 7:00 p.m., the peak of users could be reached, to simulate random connections of several electric vehicles that connect and disconnect to the station. The results, as depicted in Figure 18, indicate an almost full exploitation for most of the time of the charging station, in particular between 9:00 a.m. and 7:00 p.m. with the assumption that once the vehicle is fully charged in immediately disconnected, to allow the charging of another one. However, the voltage profile is still largely within the limits set by the technical standards, since the voltage drop is less than 5% even at the moment of maximum use of the charging station.

5. Discussion of the Results

The analysis of the results obtained makes it possible to formulate two conclusions related to the consequences that the high penetration of electric cars and the measures taken to mitigate their effects can have on the distribution system.
The transformers analysed are able to withstand the additional loads represented by electric vehicles, even if especially in the evening hours, they are forced to work in overload. The implementation of photovoltaic systems, in the specific cases analysed, had no significant consequences as regards the effects on voltage. However, in older networks and especially in nodes near the distribution stations, high photovoltaic production can contribute to a voltage rise of more than 10% compared to the nominal value. On the other hand, the strong penetration of EV into the farthest nodes, can generate the opposite effect, causing a strong drop in voltage. Keeping the hypothesis of an uncontrolled recharge, the positive and negative impacts of EV and PV systems are balanced with major effects from one or the other depending on the level of penetration. Due to the non-coincidence between the EV recharge time interval and the PV production period, the effectiveness of mitigation is relatively weak; therefore, the implementation of an accumulation system is an ideal solution. The voltage profile has presented a strong dependence on the demand. The voltage drop is stronger as the distance from the primary station increases, even if the feeder length has less influence on the voltage drop, if there is not such a high current.
It is also important to remark that there some voltage profiles are not affected in those hours when the generation is zero or almost zero. The quasi-dynamic load flow of one day has shown this trend. Another important element that influenced strongly the voltage profile is the power injected by a generator. The generator node suffers a strong voltage increase according to the power injected and the line reactance. It is important to underline that reactive power injection or withdrawn can have a positive effect on the voltage, which can be decreased, by absorbing a certain amount of reactive power (inductive behaviour) or increased injecting reactive power (capacitive behaviour).
From the simulations performed, it is possible to confirm that thermal limits affect mainly the buses near to the primary substations. In fact, the first nodes are crossed by a large amount of power, which needs to flow toward the farthest LV users. In addition, a share of the new power injected by DG can flow upstream to the MV busbar. If more load is connected in the same bus where the DG is being connected, the hosting capacity can increase, because the generation can be absorbed by the local load, and there is no need to transport the power through the lines. The ampacity of lines represents the network structural limit, related to the cross sections of MV overhead lines and cables and cannot be solved unless significant investments are put in place. The base case scenario is shown as a low loading in the most part of the grid, resulting in an apparently unnecessary oversize.
However, the loading increase showed an important consequence of the good line sizing to maximize the amount of distributed generation installed in the feeder. It is important to say that these thermal limits are reached for a few hours, so the introduction of elements to shift the power injection in time could result in a hosting capacity increase of the feeder. Moreover, it can be appreciated that the overall hosting capacity in all cases is set by the line thermal limit. Overload of branches is the first limit affected or the most badly impacted. The reverse power flow is a real problem, as the red and yellow lines show in Figure 19, when the generation is higher than the demand, so when current flows from the feeders to the primary station. This power flow change can be a problem if multiple feeders start to have the same behaviour, until a certain point of time where the transformer can reach its capacity limit, since it has not been designed for this purpose.

6. Recommended Solutions

In the following, as a future step in Italy, some solutions will be recommended to be implemented based on existing solutions though the papers analysed for this work.
The demand curve without the EVs is pretty standard and DSOs are able to predict the demand at all times. However, the prices for grid operation and electrical energy on the free market are impacted significantly by the peak loads. In the future, with a high penetration of electric vehicles it will be essential to make sure that the additional load does not come in periods of peak load. So two types of smart charging schemes are proposed, centralized and decentralized. In the decentralised scheme, the schedule is determined by the user itself according to his specific needs. Still, indirect control can be exercised by the DSO with price signals. This would mean that during peak loads, prices of electrical energy would be higher so the EV users would be motivated not to charge their vehicles during those times, instead charging them during off peak times.
It is important to clarify that peak and off-peak loads refer to the so-called “residual” load that is not served by the non-programmable RES. To make it clear if during a peak load a huge number of PV panels reach the maximum production, it might even be beneficial to charge the vehicles in those times, so the tariff would be relatively low even though it is technically a period of peak power.
A centralised smart charging scheme is a system of active management, where a coordinated structure controlled by the DSO is in place. A large number of vehicles would receive demand signals by the DSO and adjust their charging schedules to provide a demand response service to the distribution company. Aggregation of a huge number of electrical vehicles, joined and controlled together as a fleet, is necessary in order to obtain the desired benefits on the grid. The idea is to go beyond just scheduling the charging cycles, but also to provide other services to the grid operator. The aggregated entity would offer services to the grid as a single element but deliver the services with multiple units dispersed in the grid. This activity is usually undertaken by a third party called electric vehicle aggregator, who would be in the middle between the DSO and EV users. Its main task would be to suggest a charging profile to the customers a day in advance, while sticking to their constraints and schedules. By following this charging profile, customers would get discounted prices for electricity, while the aggregator, would profit from the DSO. With this new figure in place, new business solutions can arise and he would need to negotiate the benefits for the users for providing other services, such as cheaper electricity, free battery replacement etc.
Another possibility, which mainly involves public charging stations, is to organize a fleet of EVs and one or more types of RES under one entity. This concept is known as “virtual power plant” and has many benefits, because the combination of more than one technology controlled by the same entity would guarantee more reliable production as well as having storage capabilities within the same virtual plant. The aggregator, who is in charge, will be able to participate in the market and increase the profit of each individual participant.

6.1. Smart Charging

In addition to e-mobility, it is necessary to talk about smart-mobility, which represents all the new possibilities of using the car and its interaction with the network. As mentioned, on average, electric cars, due to their charging and autonomy characteristics, are used for their own movement and transport activities for very short periods, just for 5% of the time while the remaining 95% of time remain stationary and, therefore, unused.
Given their flexible load with electric storage available and the development of communication systems, it would be absurd to view them as just a regular load. Their main function will remain in the transportation sector, but with a high potential in providing services, both to the grid and to the market. The V2G (vehicle-to-grid) mode of operation can be applied, exchanging energy in the system during critical conditions, and since electric vehicles are dispersed by nature, this increases their impact on grid regulation, facilitating the work of the network operator. This application for EVs can reduce the overall costs of purchasing and maintaining storage units in the future, and reduce the need for grid upgrades, which would result in an economic benefit for the DSO. Consumers providing this service through their vehicles, of course, should be properly compensated, with the possible creation of new markets.
However, the management of this resource is extremely complex, with some elements requiring strong regulation. Furthermore, charging and discharging the battery for the V2G increases the cycles carried out causing greater degradation to the battery. The owner must also be paid for this reason and must be informed about the amount of the remaining charge to be sure of being able to use the vehicle after having transferred energy to the network. The fee will depend on the market price and the time in which the vehicle remains available for the service. Finally, vehicles must communicate with the electrical system via a special connection inside the plug. From this analysis was born the idea of a full time use of EVs and to use them not only for traditional activities but also as energy accumulators.
In the energy management process, the role played by storage systems is certainly complementary to renewable generation and contributes in giving stability to the network both as a quick response to the required needs and as a reduction in power fluctuations related to renewable generation produced by other sources such as photovoltaics and wind. The latter, in fact, being dependent on climatic factors and, therefore, not programmable, cannot provide optimal and immediate solutions to sudden requests from the network, so an efficient storage system is essential to manage the differences between production and use. By taking advantage of the charged batteries of electric cars connected to the network, it is possible to offer, in a very short period, an adequate response to a sudden peak in demand. If on one hand the diffusion of electric vehicles could contribute to the stability of the network by regulating the frequency and reducing the power fluctuations linked to renewable generation, on the other hand the uncontrolled growth of electric cars, not adequately supported by an expansion of the distribution network, could produce an opposite effect. According to the simulations performed, the current network infrastructure has the potential to support a medium-low EV penetration (below 50%).
In particular considering the trend of the load in the tertiary sector, the effects of electric vehicles are not very serious since the requests of recharge are concentrated in the morning and are not summed up to the typical afternoon peak. In the residential area, however, the effect of EVs influences more heavily on the network, since the recharges are concentrated mainly in the evening thus producing greater peaks. So it is possible to make the vehicles interact with the grid at different levels with several options such as V2H (vehicle-to-home), V2B (vehicle-to-building) and V2G (vehicle-to-grid). In this way, the bi-directionality of the battery is exploited to allow an energy flow also from the vehicle to the network.
Vehicle batteries store a lot of energy, on average about 25 kWh (but those of the latest generation reach up to 90 kWh), which correspond to about two and a half days of energy required by typical users. It is therefore a big amount of energy that can be used. Taking advantage of this opportunity is not easy, and it is convenient only when large quantities of energy are involved or with many vehicles in the same place, located together as the only source such as in parking lots, near charging stations and in residential areas during the night. V2G can be used to provide power supply at peak demand for an intervention time varying between four and six hours every day, or for ancillary services in order to supply power to support the system occasionally in case of frequency variations, due to loss of generation or problems on transmission lines. In this case, these are single interventions with a limited average duration of ten minutes.
Finally, regulation can also be performed in order to exchange active and reactive power to guarantee the voltage regulation of the system. The amount of operations that can be executed is very high but for a short time interval of a few minutes at a time.

6.2. Peak Shaving and Load Levelling

The management of the electricity grid is very complex, since the power consumption by the users is characterised by very marked fluctuations. Peak production by RES like solar panels does not correspond with the peak loads of the system, so storing that energy in the electrical vehicles would be very good for guaranteeing system adequacy, reducing the need of investments in the generation sector.
Besides, the stability of the system might be endangered due to high percentage of uncontrollable loads. The use of an electrical energy storage system according to the load levelling logic consists in the storage of energy during the low load hours of the electrical system and its subsequent supply during periods of high demand from users as simulated in the QDSL battery model. This operating criterion entails above all technical benefits, in particular by optimising the operation of the thermal plants and the management of the electricity network owing to the peak shaving operation, useful for levelling the peaks of maximum electricity demand. In fact, the intervention of a storage system can satisfy the peak demand while maintaining a more homogeneous generation profile. Thermal plants, in particular those that exploit low-cost primary sources, are not designed to operate at partial load with good efficiencies. By accumulating the surplus of electricity that they generate during periods of low demand, it is possible to allow these systems to always operate near nominal load and efficiency. The stored energy can be subsequently supplied during the hours of maximum demand by reducing the load of expensive peaking systems powered by natural gas.
Higher penetration of EVs means higher electrical energy requirements, as well as bigger stress on the electrical grid. The storage systems can intervene, as previously described, to level the load curve and manage the periods of maximum demand by postponing investments on new network infrastructures and on increasing installed power. This operating strategy also favours the practice of energy price arbitrage. It takes advantage of the price difference of electricity that occurs between two times of the day or week to make an economic profit for the storage system. Electricity is purchased and stored when it costs little due to the low demand from users, and then it is resold during the hours when prices are higher.
From an economic point of view, it is possible to affirm that energy storage systems favour the reduction and stabilization of prices in the electricity market because they release electricity production from speculation and the volatility of prices linked to fossil fuels.

7. Conclusions

This study examined the impact of charging systems for electric vehicles on a real distribution network with reference to various future scenarios of electric mobility, from 20% to 80% of the overall car fleet. The diffusion of domestic recharging systems on the LV network led to critical issues on some transformers of the secondary substations only when there were high penetration levels, while there were no violations of significant operating limits on the MV network. Neither have the fast charging stations caused changes in constraints for the MV network. In future however, it is probable that their more massive installation will generate problems particularly with regard to transformer overloading and expected voltage limits. The critical issues observed occurred more in a purely urban network in which the grid elements are subjected to more use than the rural ones, thus requiring that investments may be necessary in future to ensure the full availability of high-powered charging stations.
The results disclosed that additional power demand from EVs could be a problem for the electric system, mainly because the highest demand from EVs corresponds to the typical consumption peak from the residential customers. However, in strong networks, the additional load does not yet represent a real challenge.
In Italy, the strong presence of renewable resources will encourage the increasing penetration of EVs in the network, from a technical point of view, provided that smart strategies for load control are also implemented, both for private citizens and for public utilities.
In this simulation, the results obtained, although reasonable, are not entirely realistic, because the data related to the load curves are simulated and do not guarantee complete dependability regarding the networks analysed. Even the generation profile of the photovoltaic systems has been simulated and although close to reality, it is a simplification being considered constant for each day of the week. A possible solution, within electric demand-side management strategies, is the active demand response (ADR), which consider a change in the behaviour and use of electricity, dependent on end customers, in response to certain price signals.
This study can, therefore, be considered useful both for purely technical purposes of interest of the DSO, as fully responsible for the management of the network, and for present and future owners of an EV who will be driven to change their energy consumption habits. The scenario envisaged is one in which awareness about energy consumption is increasingly important, and consumers are very conscious of their consumption in real time and well adapted according to market price signals. Each proposed measure can be implemented with positive results in most cases.
However, these interventions are not always sufficient for obvious infrastructural problems, some of which are visible in heavy loads on lines that supply many users. Physical intervention is therefore necessary; this involves replacing the current conductors with those that have larger sections to withstand the thermal limits or by inserting more conductors in parallel in order to decongest the overloaded lines and improve the voltage profile.
Finally, it should be pointed out that the control measures examined so far are local in nature and, therefore, will have to be properly coordinated with one another; the DMS (distribution management system) in the primary station will be tasked with analysing the system’s state, optimizing it and sending the appropriate regulation signals to all devices, i.e., OLTC (on-load tape changer), distributed generation, loads and accumulations.
The electrification of transport and the development of the network towards smart grids constitute the next and imminent evolution of the electricity sector. In addition to guaranteeing the technical advantages listed in this study, the new condition will lead to sustainable mobility and optimal management of the network, with lower power losses and a reduction in costs in a virtuous circle that benefits the environment.

Author Contributions

E.M. and M.L. proposed the core idea, developed the models. E.M. and M.L. performed the simulations, exported the results and analysed the data. W.Y. and D.Z. revised the paper. M.L. and W.Y. contributed to the design of the models and the writing of this manuscript. All authors have read and agreed to the published version of the manuscript.

Funding

This research received no external funding.

Conflicts of Interest

The authors declare no conflict of interest.

References

  1. Anastasiadis, A.G.; Kondylis, G.P.; Polyzakis, A.; Vokas, G. Effects of Increased Electric Vehicles into a Distribution Network. Energy Procedia 2019, 157, 586–593. [Google Scholar] [CrossRef]
  2. Sioshansi, R.; Denholm, P. The Value of Plug-In Hybrid Electric Vehicles as Grid Resources. Energy J. 2010, 31. [Google Scholar] [CrossRef] [Green Version]
  3. Qiu, C.; Wang, G. New evaluation methodology of regenerative braking contribution to energy efficiency improvement of electric vehicles. Energy Convers. Manag. 2016, 119, 389–398. [Google Scholar] [CrossRef]
  4. UE. Available online: https://europa.eu (accessed on 19 June 2020).
  5. Parlemento Europeo E Del Consiglio. Direttiva 2014/94/UE, sulla realizzazione di un infrastruttura per i combustibili salternativi. 2014, pp. 1–20. Available online: https://eur-lex.europa.eu/legal-content/IT/TXT/PDF/?uri=CELEX:32014L0094&from=EN (accessed on 19 June 2020).
  6. Rajakaruna, S.; Shahnia, F.; Ghosh, A. Plug in Electric Vehicles in Smart Grids—Integration Techniques; Springer Science and Business Media: Singapore, 2015; ISBN 978-981-287-298-2. [Google Scholar]
  7. Putrus, G.A.; Suwanapingkarl, P.; Johnston, D.; Bentley, E.C.; Narayana, M. Impact of electric vehicles on power distribution networks. In Proceedings of the 2009 IEEE Vehicle Power and Propulsion Conference, Dearborn, MI, USA, 7–10 September 2009; pp. 827–831. [Google Scholar]
  8. International Energy Agency. World Energy Outlook 2019; International Energy Agency: Paris, France, 2019; Available online: https://www.iea.org/reports/world-energy-outlook-2019 (accessed on 19 June 2020).
  9. Tomić, J.; Kempton, W. Using fleets of electric-drive vehicles for grid support. J. Power Sources 2007, 168, 459–468. [Google Scholar] [CrossRef]
  10. Dyke, K.J.; Schofield, N.; Barnes, M. The Impact of Transport Electrification on Electrical Networks. IEEE Trans. Ind. Electron. 2010, 57, 3917–3926. [Google Scholar] [CrossRef]
  11. Hadley, S.W. Evaluating the impact of Plug-in Hybrid Electric Vehicles on regional electricity supplies. In Proceedings of the 2007 iREP Symposium—Bulk Power System Dynamics and Control—VII. Revitalizing Operational Reliability, Charleston, SC, USA, 19–24 August 2007; pp. 1–12. [Google Scholar]
  12. Anastasiadis, A.G.; Konstantinopoulos, S.; Kondylis, G.; Vokas, G.A. Electric vehicle charging in stochastic smart microgrid operation with fuel cell and RES units. Int. J. Hydrogen Energy 2017, 42, 8242–8254. [Google Scholar] [CrossRef]
  13. Clement-Nyns, K.; Haesen, E.; Driesen, J. The Impact of Charging Plug-In Hybrid Electric Vehicles on a Residential Distribution Grid. IEEE Trans. Power Syst. 2009, 25, 371–380. [Google Scholar] [CrossRef] [Green Version]
  14. Hua, L.; Wang, J.; Zhou, C. Adaptive Electric Vehicle Charging Coordination on Distribution Network. IEEE Trans. Smart Grid 2014, 5, 2666–2675. [Google Scholar] [CrossRef]
  15. Voumvoulakis, E.; Leonidaki, E.; Papoutsis, G.; Hatziargyriou, N. Evaluation of the impact of plug-in electric vehicles in Greek distribution network. CIRED—Open Access Proc. J. 2017, 2017, 2270–2274. [Google Scholar] [CrossRef] [Green Version]
  16. European Environment Agency. Available online: https://www.eea.europa.eu/highlights/towards-clean-and-smart-mobility (accessed on 19 June 2020).
  17. Anastasiadis, A.G.; Kondylis, G.; Vokas, G.A.; Konstantinopoulos, S.A.; Salame, C.-T.; Polyzakis, A.; Tsatsakis, K. Economic benefits from the coordinated control of Distributed Energy Resources and different Charging Technologies of Electric Vehicles in a Smart Microgrid. Energy Procedia 2017, 119, 417–425. [Google Scholar] [CrossRef]
  18. De Nigris, M.; Gianinoni, I.; Grillo, S.; Massucco, S.; Silvestro, F. Impact evaluation of plug-in electric vehicles (PEV) on electric distribution networks. In Proceedings of the 14th International Conference on Harmonics and Quality of Power—ICHQP 2010, Bergamo, Italy, 26–29 September 2010; pp. 1–6. [Google Scholar]
  19. Anastasiadis, A.G.; Polyzakis, A.; Vokas, G.A. Economic impact of V2G technology in a smart microgrid. AIP Conf. Proc. 2018, 1968, 020028. [Google Scholar] [CrossRef]
  20. Available online: http://ec.europa.eu/transport/road_safety/vehicles/categories_en.htm (accessed on 19 June 2020).
  21. Abul’Wafa, A.R. A network-topology-based load flow for radial distribution networks with composite and exponential load. Electr. Power Syst. Res. 2012, 91, 37–43. [Google Scholar] [CrossRef]
  22. Anastasiadis, A.G.; Konstantinopoulos, S.; Kondylis, G.; Vokas, G.A.; Salame, M.J. Carbon tax, system marginal price and environmental policies on Smart Microgrid operation. Manag. Environ. Qual. Int. J. 2018, 29, 76–88. [Google Scholar] [CrossRef]
  23. Tan, K.M.; Ramachandaramurthy, V.K.; Yong, J.Y. Integration of electric vehicles in smart grid: A review on vehicle to grid technologies and optimization techniques. Renew. Sustain. Energy Rev. 2016, 53, 720–732. [Google Scholar] [CrossRef]
  24. Brenna, M.; Longo, M.; Yaïci, W. Modelling and Simulation of Electric Vehicle Fast Charging Stations Driven by High Speed Railway Systems. Energies 2017, 10, 1268. [Google Scholar] [CrossRef] [Green Version]
  25. Bryden, T.S.; Hilton, G.; Cruden, A.; Holton, T. Electric vehicle fast charging station usage and power requirements. Energy 2018, 152, 322–332. [Google Scholar] [CrossRef]
  26. Liu, J.-P.; Zhang, T.-X.; Zhu, J.; Ma, T.-N. Allocation optimization of electric vehicle charging station (EVCS) considering with charging satisfaction and distributed renewables integration. Energy 2018, 164, 560–574. [Google Scholar] [CrossRef]
  27. Luo, L.; Gu, W.; Zhou, S.; Huang, H.; Gao, S.; Han, J.; Wu, Z.; Dou, X. Optimal planning of electric vehicle charging stations comprising multi-types of charging facilities. Appl. Energy 2018, 226, 1087–1099. [Google Scholar] [CrossRef]
  28. Diaz-Londono, C.; Colangelo, L.; Ruiz, F.; Patino, D.; Novara, C.; Chicco, G. Optimal Strategy to Exploit the Flexibility of an Electric Vehicle Charging Station. Energies 2019, 12, 3834. [Google Scholar] [CrossRef] [Green Version]
  29. Domínguez-Navarro, J.A.; Dufo-López, R.; Yusta, J.; Sevil, J.S.A.; Bernal-Agustín, J.L. Design of an electric vehicle fast-charging station with integration of renewable energy and storage systems. Int. J. Electr. Power Energy Syst. 2019, 105, 46–58. [Google Scholar] [CrossRef]
  30. Ma, C.-T. System Planning of Grid-Connected Electric Vehicle Charging Stations and Key Technologies: A Review. Energies 2019, 12, 4201. [Google Scholar] [CrossRef] [Green Version]
  31. Khalid, M.R.; Alam, M.S.; Sarwar, A.; Asghar, M.J. A Comprehensive review on electric vehicles charging infrastructures and their impacts on power-quality of the utility grid. eTransportation 2019, 1, 100006. [Google Scholar] [CrossRef]
  32. Mwasilu, F.; Justo, J.J.; Kim, E.-K.; Do, T.D.; Jung, J.-W. Electric vehicles and smart grid interaction: A review on vehicle to grid and renewable energy sources integration. Renew. Sustain. Energy Rev. 2014, 34, 501–516. [Google Scholar] [CrossRef]
  33. Habib, S.; Kamran, M.; Rashid, U. Impact analysis of vehicle-to-grid technology and charging strategies of electric vehicles on distribution networks—A review. J. Power Sources 2015, 277, 205–214. [Google Scholar] [CrossRef]
  34. Van der Kam, M.; Van Sark, W. Smart charging of electric vehicles with photovoltaic power and vehicle-to-grid technology in a microgrid; a case study. Appl. Energy 2015, 152, 20–30. [Google Scholar] [CrossRef] [Green Version]
  35. Mozafar, M.R.; Amini, M.H.; Moradi, M.H. Innovative appraisement of smart grid operation considering large-scale integration of electric vehicles enabling V2G and G2V systems. Electr. Power Syst. Res. 2018, 154, 245–256. [Google Scholar] [CrossRef]
  36. Jordehi, A.R. Optimisation of electric distribution systems: A review. Renew. Sustain. Energy Rev. 2015, 51, 1088–1100. [Google Scholar] [CrossRef]
  37. Crozier, C.; Morstyn, T.; McCulloch, M. The opportunity for smart charging to mitigate the impact of electric vehicles on transmission and distribution systems. Appl. Energy 2020, 268, 114973. [Google Scholar] [CrossRef]
  38. Ramadhani, U.H.; Shepero, M.; Munkhammar, J.; Widén, J.; Etherden, N. Review of probabilistic load flow approaches for power distribution systems with photovoltaic generation and electric vehicle charging. Electr. Power Energy Syst. 2020, 120, 106003. [Google Scholar] [CrossRef]
  39. Muttaqi, K.M.; Aghaei, J.; Ganapathy, V.; Nezhad, A.E. Technical challenges for electric power industries with implementation of distribution system automation in smart grids. Renew. Sustain. Energy Rev. 2015, 46, 129–142. [Google Scholar] [CrossRef]
  40. Borges, C.L.T. An overview of reliability models and methods for distribution systems with renewable energy distributed generation. Renew. Sustain. Energy Rev. 2012, 16, 4008–4015. [Google Scholar] [CrossRef]
  41. Ruiz-Romero, S.; Colmenar-Santos, A.; Perez, F.M.; López-Rey, Á. Integration of distributed generation in the power distribution network: The need for smart grid control systems, communication and equipment for a smart city—Use cases. Renew. Sustain. Energy Rev. 2014, 38, 223–234. [Google Scholar] [CrossRef]
  42. Worighi, I.; Maach, A.; Hafid, A.; Hegazy, O.; Van Mierlo, J. Integrating renewable energy in smart grid system: Architecture, virtualization and analysis. Sustain. Energy Grids Netw. 2019, 18, 100226. [Google Scholar] [CrossRef]
  43. Salihi, J. Energy Requirements for Electric Cars and Their Impact on Electric Power Generation and Distribution Systems. IEEE Trans. Ind. Appl. 1973, 9, 516–532. [Google Scholar] [CrossRef]
  44. Tao, M.; Sarfi, R.; Gemoets, L. Assessing the Impact of Electric Vehicles to the Distribution Infrastucture. In Proceedings of the Power Grid 2009 Conference, Cologne, Germany, 1 May 2009. [Google Scholar]
  45. Jenkins, N.; Allan, R.; Crossley, P.; Kirschen, D.; Strbac, G. Embedded Generation; IEE Power and Energy Series; Institution of Engineering and Technology: London, UK, 2000; Volume 31. [Google Scholar]
  46. Barbier, C.; Maloyd, A.; Putrus, G. Embedded Controller for LV Network with Distributed Generation; DTI Project, Contract Number: K/El/00334/00/Rep; Department of Trade and Industry: London, UK, May 2007.
  47. ARERA. Indagine Annuale sui Settori Regolati. 2019. Available online: https://www.arera.it/it/comunicati/19/indagine2019.htm (accessed on 19 June 2020).
  48. A2A. Italian Energy Market Overview, 2015 & 2016 Market Analysis & Price Forecasting. March 2017. Available online: https://s3-eu-west-1.amazonaws.com/a2a-be/a2a/2017-03/Overview-Italian-Energy-Market-2015-2016.pdf (accessed on 20 June 2020).
  49. Lyons, P.; Taylor, P.; Cipcigan, L.; Trichakis, P.; Wilson, A. Small Scale Energy Zones and the Impacts of High Concentrations of Small Scale Embedded Generators. In Proceedings of the 41st International Universities Power Engineering Conference, Newcastle-upon-Tyne, UK, 6–8 September 2006; Volume 1, pp. 128–132. [Google Scholar]
  50. Ingram, S.; Probert, S.; Jackson, K. The Impact of Small Scale Embedded Generation on the Operating Parameters of Distribution Networks; Report Number: K/EL/00303/04/01; Department of Trade and Industry: London, UK, 2003.
  51. European Commission. European Smart Grids Technology Platform: Vision and Strategy for Europe’s Electricity Networks of the Future. EUR22040. 2006. Available online: https://ec.europa.eu/research/energy/pdf/smartgrids_en.pdf (accessed on 19 June 2020).
  52. Harris, A. Charge of the Electric Car, IET. Eng. Technol. 2009, 4, 52–53. [Google Scholar] [CrossRef]
  53. The Stationary Office Limited. The Electricity Safety, Quality and Continuity Regulations 2002; The Stationary Office Limited: London, UK, 2002; ISBN 0 11 042920 6. [Google Scholar]
  54. Engineering Recommendation P29. Planning Limits for Voltage Unbalance in the United Kingdom; Electricity Association, Engineering and Safety Publications, 1990. Available online: https://www.nienetworks.co.uk/documents/d-code/distribution-system-security-and-planning-standard/ena_er_p29.aspx (accessed on 19 June 2020).
  55. DIgSILENT PowerFactory 2018, User Manual. Available online: https://www.digsilent.de/en/newsreader/digsilent-releases-powerfactory-2018.html (accessed on 19 June 2020).
  56. ENTSO-E. Available online: https://www.entsoe.eu/data/power-stats/hourly_load/ (accessed on 19 June 2020).
  57. Mauri, G.; Bertini, D.; Fasciolo, E.; Fratti, S. The impact of EV’s fast charging stations on the MV distribution grids of the Milan metropolitan area. In Proceedings of the 22nd International Conference and Exhibition on Electricity Distribution (CIRED 2013), Stockholm, Sweden, 10–13 June 2013; pp. 1–3. [Google Scholar]
  58. Evtech. 2020. Available online: https://www.evtec.ch/en/products/espressoandcharge-usp/ (accessed on 20 June 2020).
  59. CEI. 2019. Available online: https://www.ceinorme.it/doc/norme/016021_2019/0-16_2019.pdf (accessed on 20 June 2020).
Figure 1. Travel behaviour: (a) daily starting trip time; (b) kilometres travelled per day; (c) number of trips per day; (d) trip duration.
Applsci 10 05125 g001
Figure 2. Simplified block diagram of the simulation procedure.
Applsci 10 05125 g002
Figure 3. Hourly charging profile.
Applsci 10 05125 g003
Figure 4. Typical base load curve.
Applsci 10 05125 g004
Figure 5. Maximum (a) power and (b) energy of the different photovoltaic (PV) technologies (a-Si: amorphous silicon; CIGS: copper indium gallium (di)-selenide; mc-Si: multi-crystalline silicon).
Applsci 10 05125 g005
Figure 6. Battery charging and discharging process.
Applsci 10 05125 g006
Figure 7. Urban 20 kV distribution network.
Applsci 10 05125 g007
Figure 8. Comparison of urban (a) transformer loadings and (b) most loaded feeder voltage profiles with 20% electric vehicle (EV) penetration.
Applsci 10 05125 g008
Figure 9. Comparison of urban (a) transformer loadings and (b) most loaded feeder voltage profiles with 40% EV penetration.
Applsci 10 05125 g009
Figure 10. Comparison of urban (a) transformer loadings and (b) most loaded feeder voltage profiles with 60% EV penetration.
Applsci 10 05125 g010
Figure 11. Comparison of urban (a) transformer loadings and (b) most loaded feeder voltage profiles with 80% EV penetration.
Applsci 10 05125 g011
Figure 12. 15 kV rural distribution network.
Applsci 10 05125 g012
Figure 13. Comparison of rural (a) transformer loadings and (b) most loaded feeder voltage profiles with 20% EV penetration.
Applsci 10 05125 g013
Figure 14. Comparison of rural (a) transformer loadings and (b) most loaded feeder voltage profiles with 40% EV penetration.
Applsci 10 05125 g014
Figure 15. Comparison of rural (a) transformer loadings and (b) most loaded feeder voltage profiles with 60% EV penetration.
Applsci 10 05125 g015
Figure 16. Comparison of rural (a) transformer loadings and (b) most loaded feeder voltage profiles with 80% EV penetration.
Applsci 10 05125 g016
Figure 17. Commercial 20 kV distribution network.
Applsci 10 05125 g017
Figure 18. (a) Power requested from the fast charging station and (b) voltage profile along the medium voltage (MV) feeder.
Applsci 10 05125 g018
Figure 19. Reverse power flow issue.
Applsci 10 05125 g019
Table 1. Urban transformer loading data.
EV PenetrationMax. Loading (%)Time Point Max.Min. Loading (%)Time Point Min.
20%121.81119:00:0018.47113:00:00
40%132.56119:00:0023.25214:00:00
60%139.56119:00:0028.95214:00:00
80%152.56119:00:0029.74207:00:00
Table 2. Rural transformer loading data.
EV PenetrationMax. Loading (%)Time Point Max.Min. Loading (%)Time Point Min.
20%86.53119:00:0024.48408:00:00
40%102.21319:00:0020.96110:00:00
60%111.56319:00:0022.18811:00:00
80%128.34419:00:0033.99709:00:00

