Quantitative Investigation of Surface Charge Distribution and Point Probing Characteristics of Spherical Scattering Electrical Field Probe for Precision Measurement of Miniature Internal Structures with High Aspect Ratios

Abstract
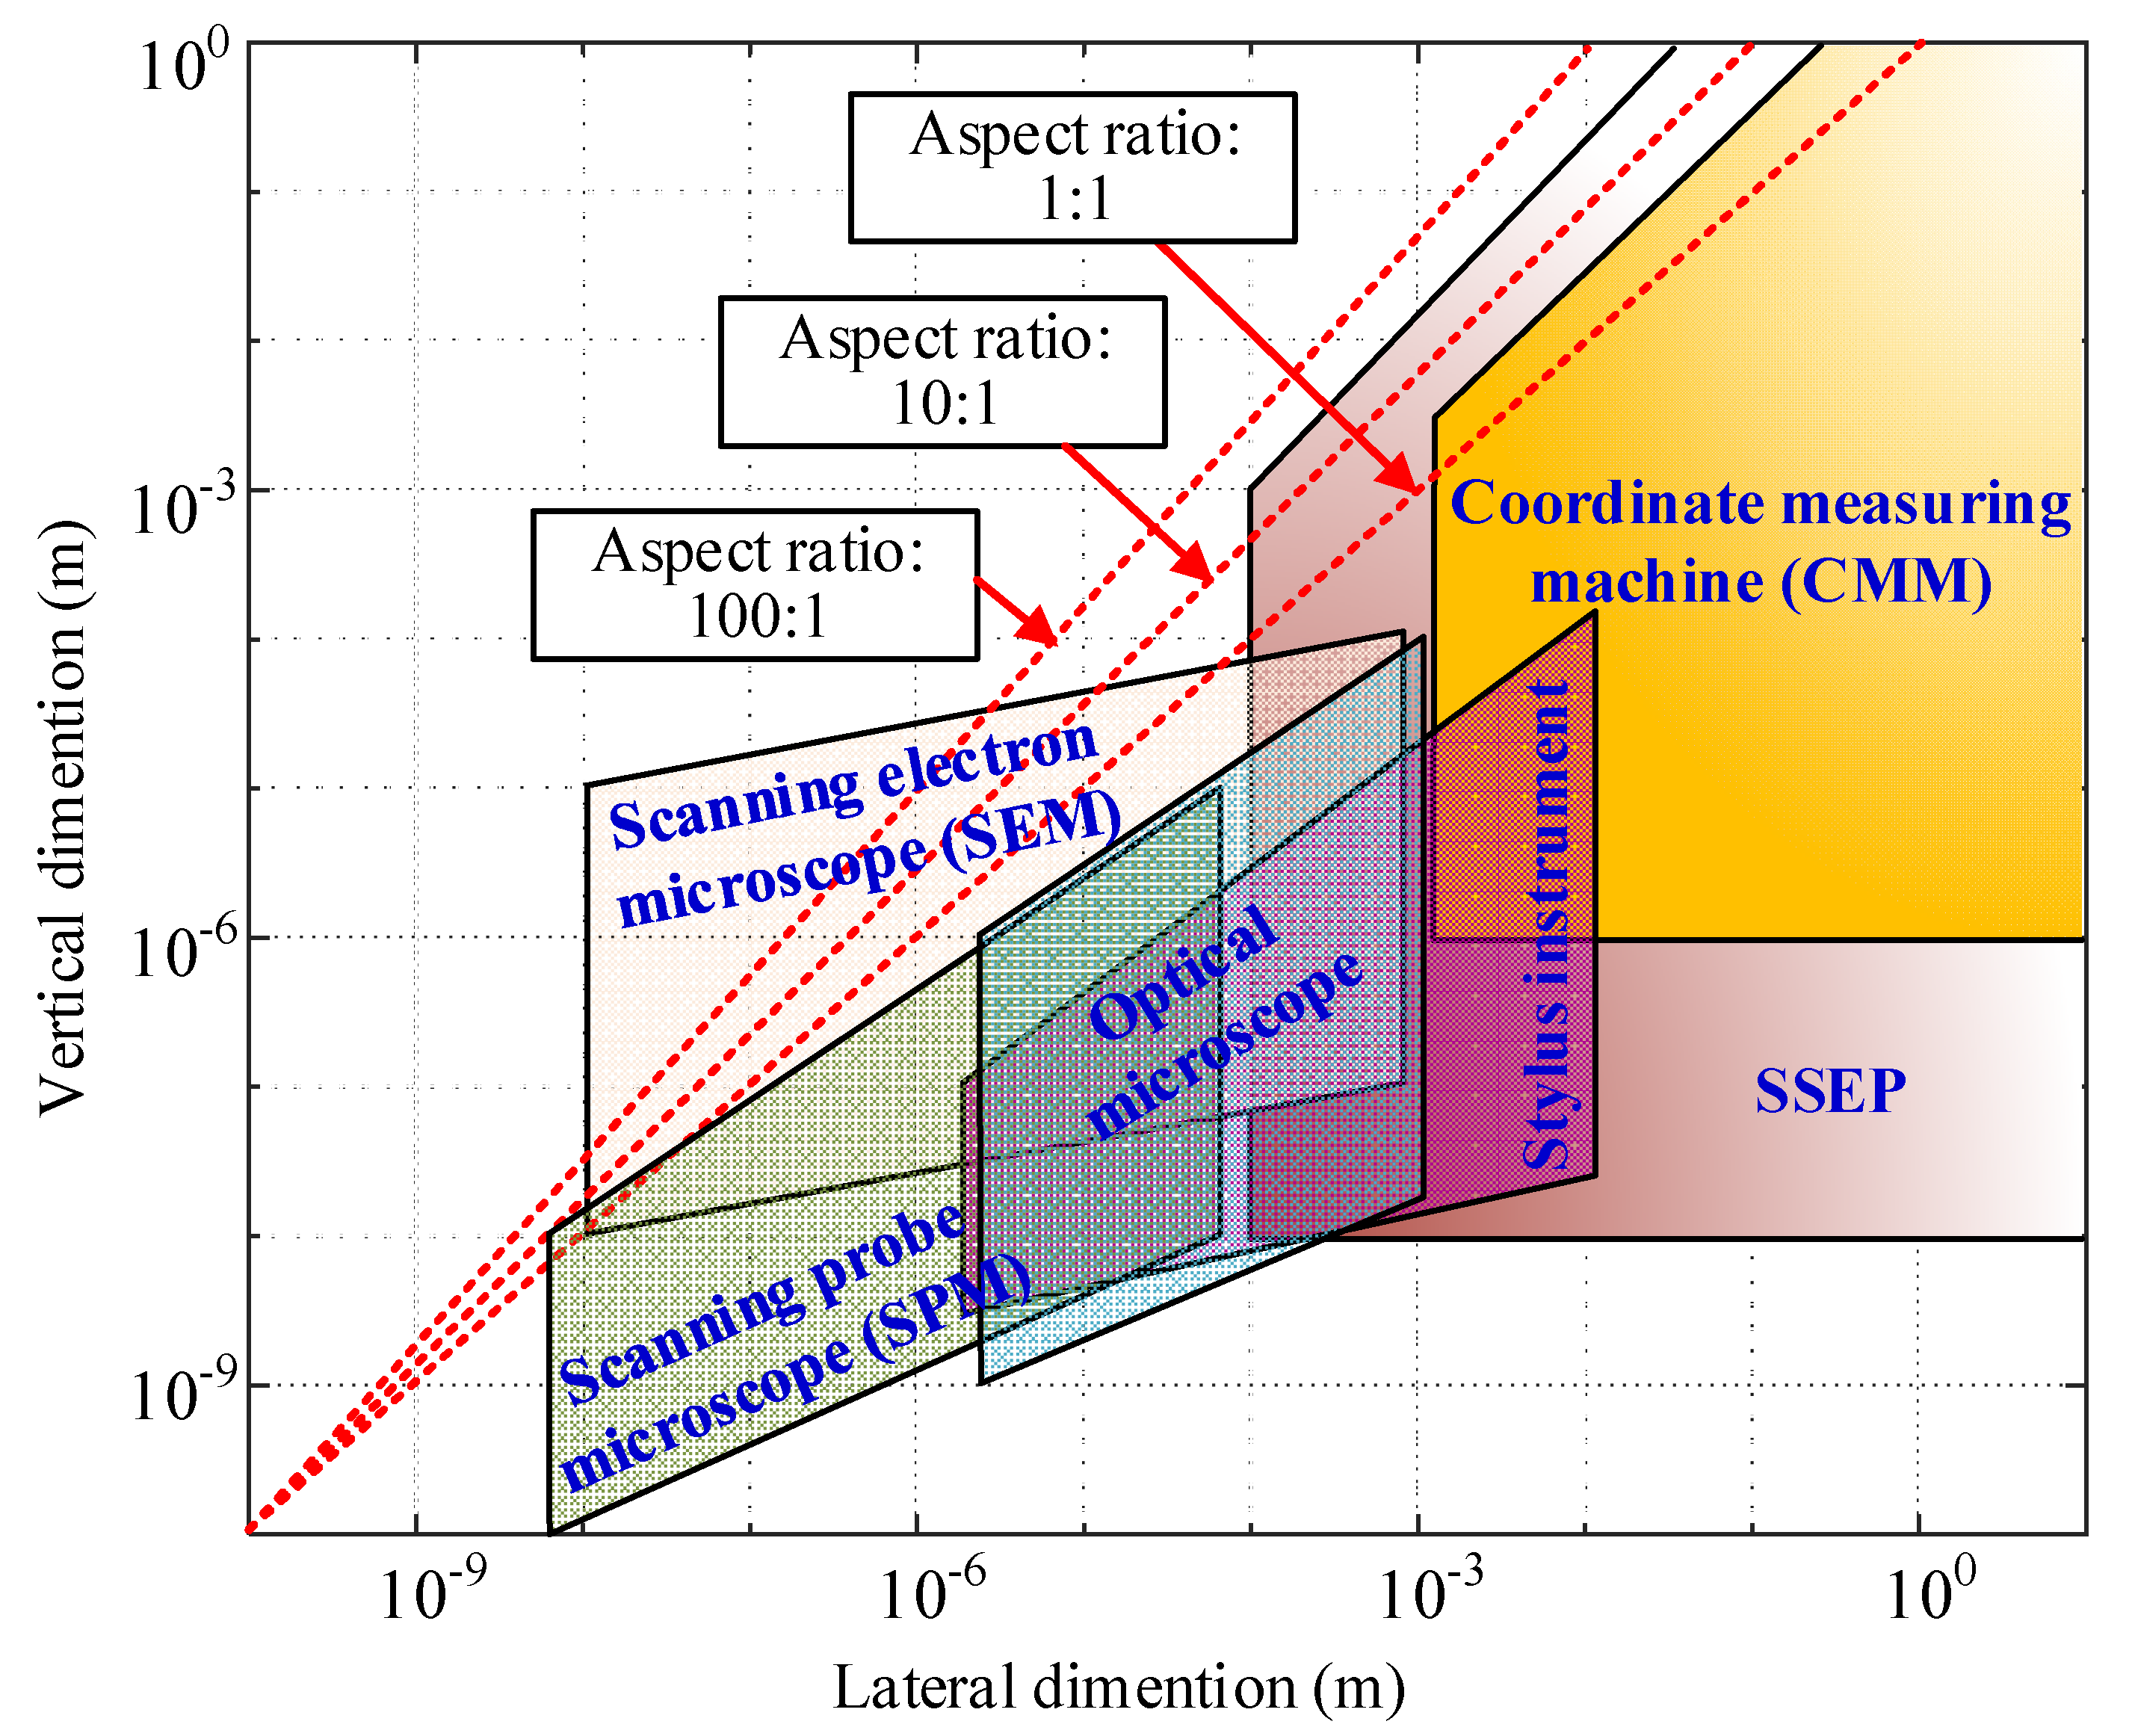
:1. Introduction
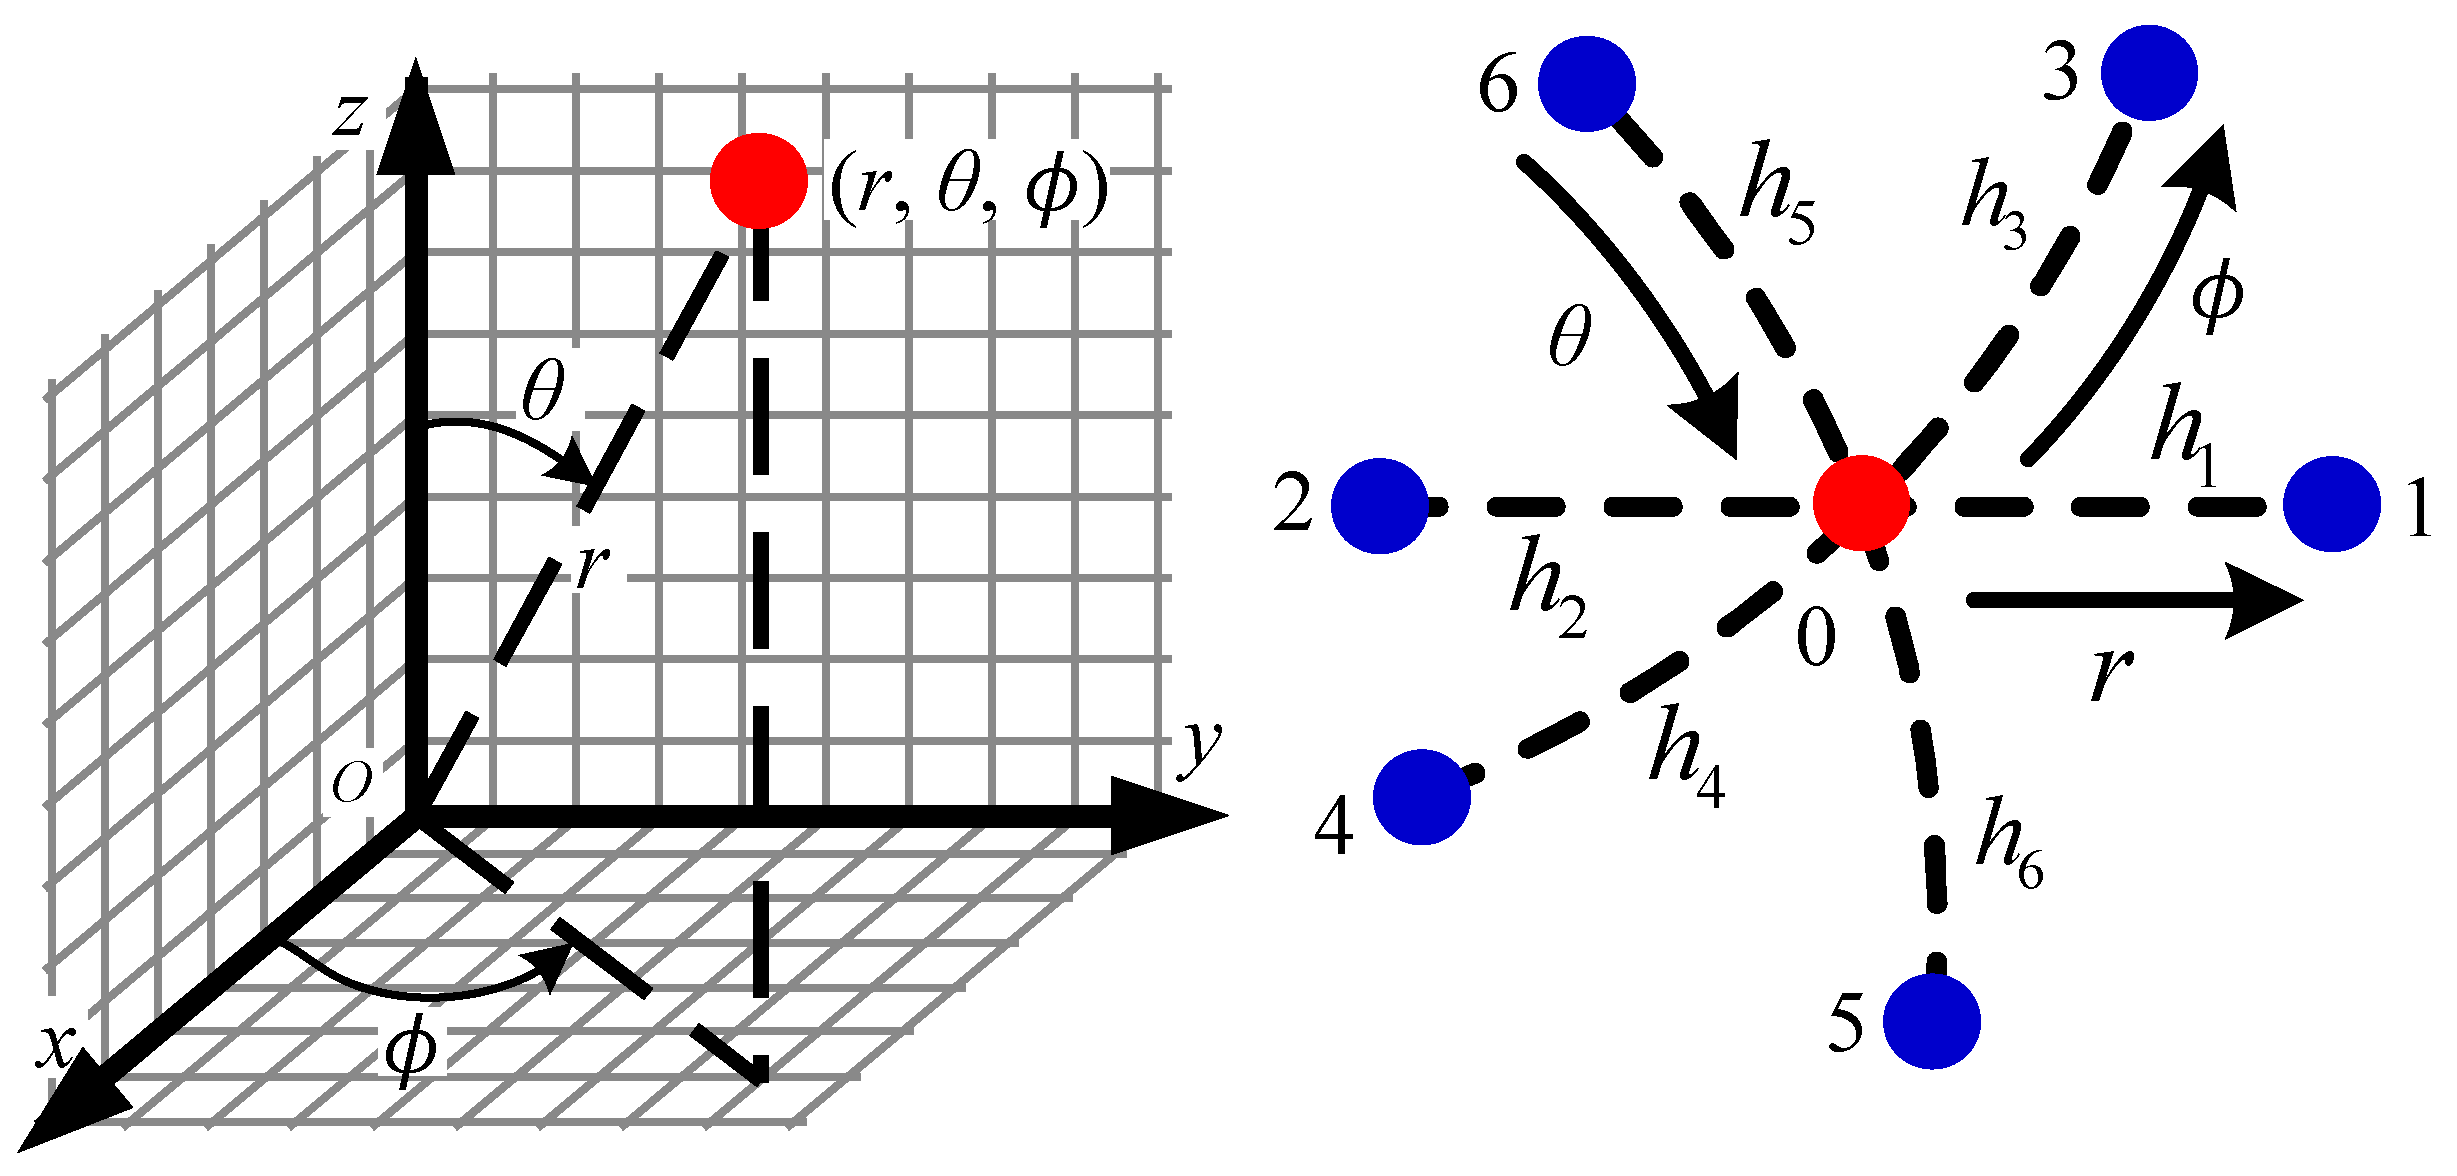
2. Principle of SSEP
3. Surface Charge Distribution Modeling
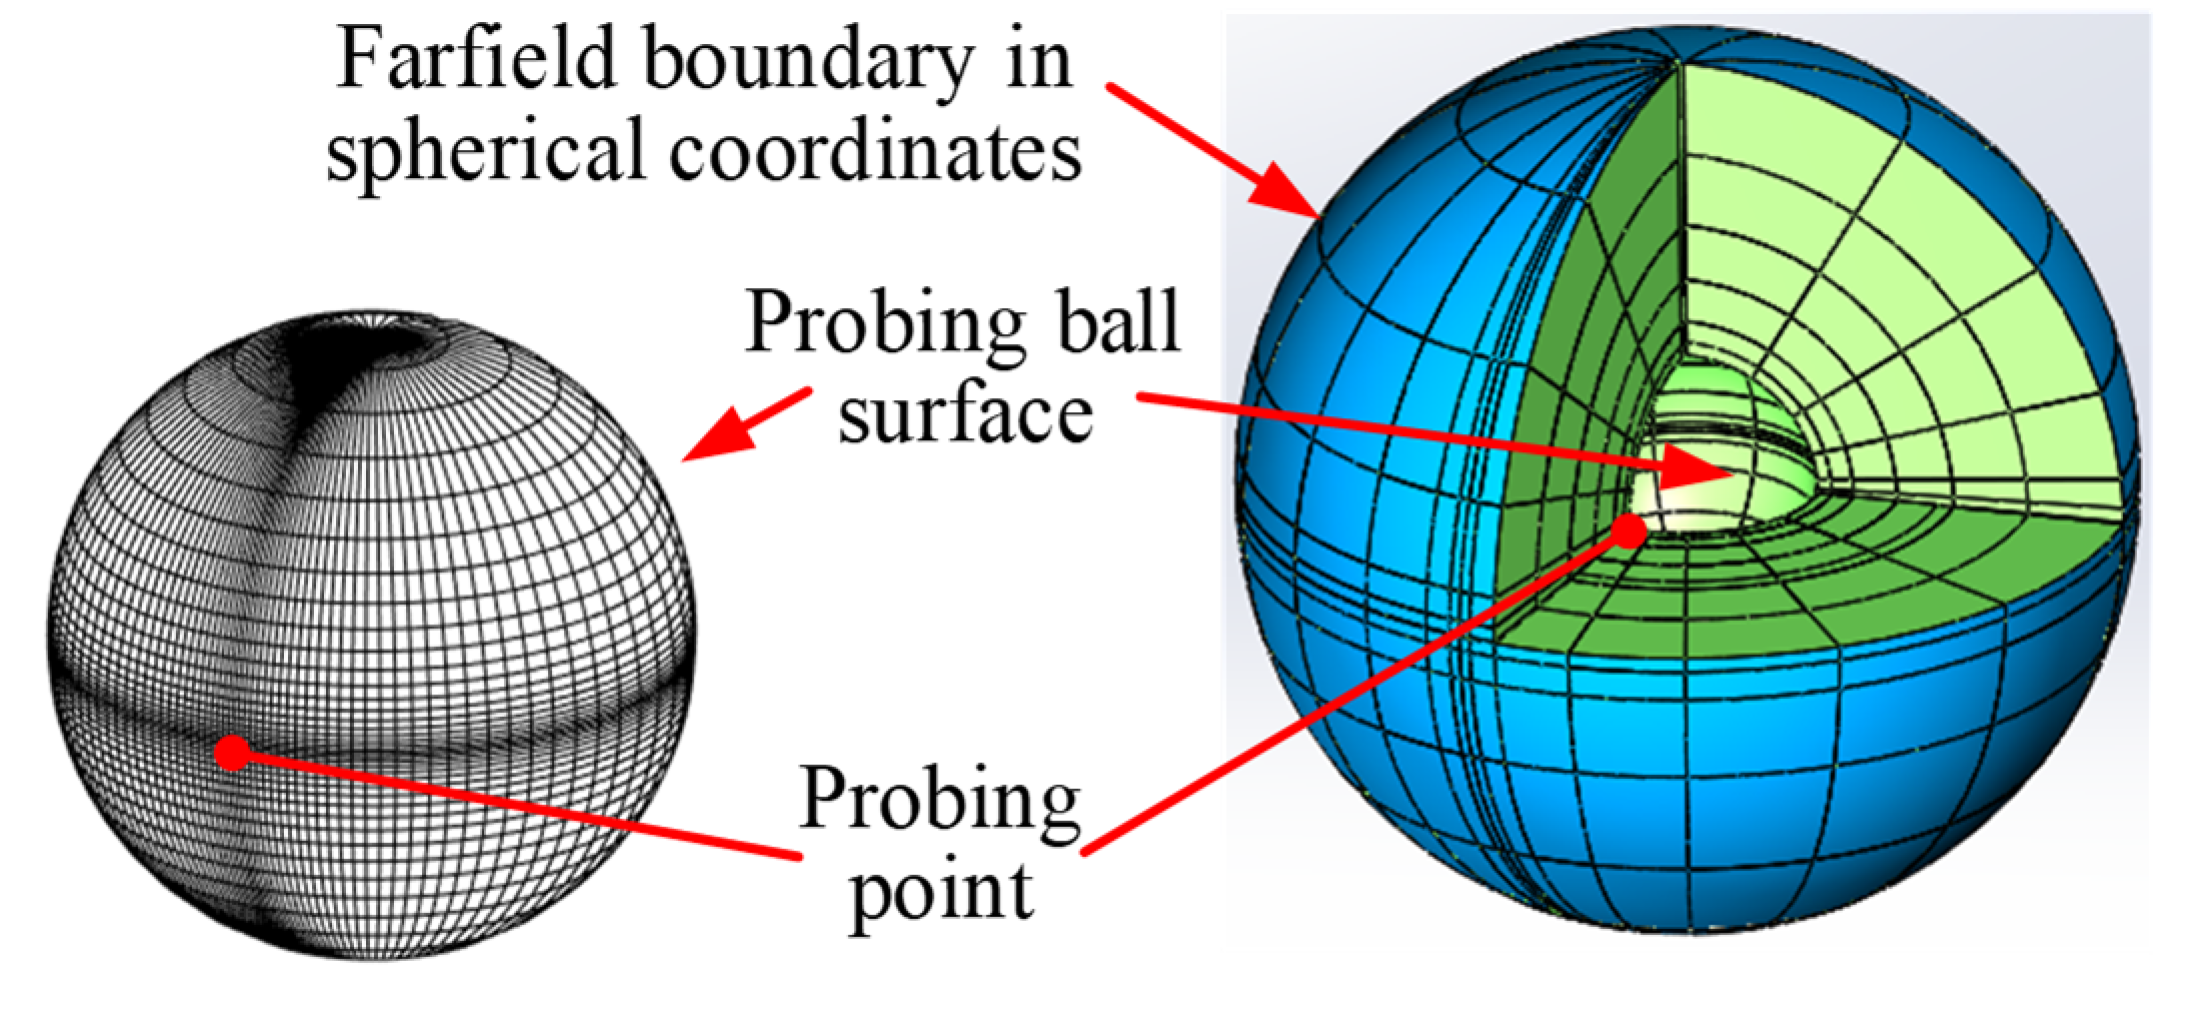
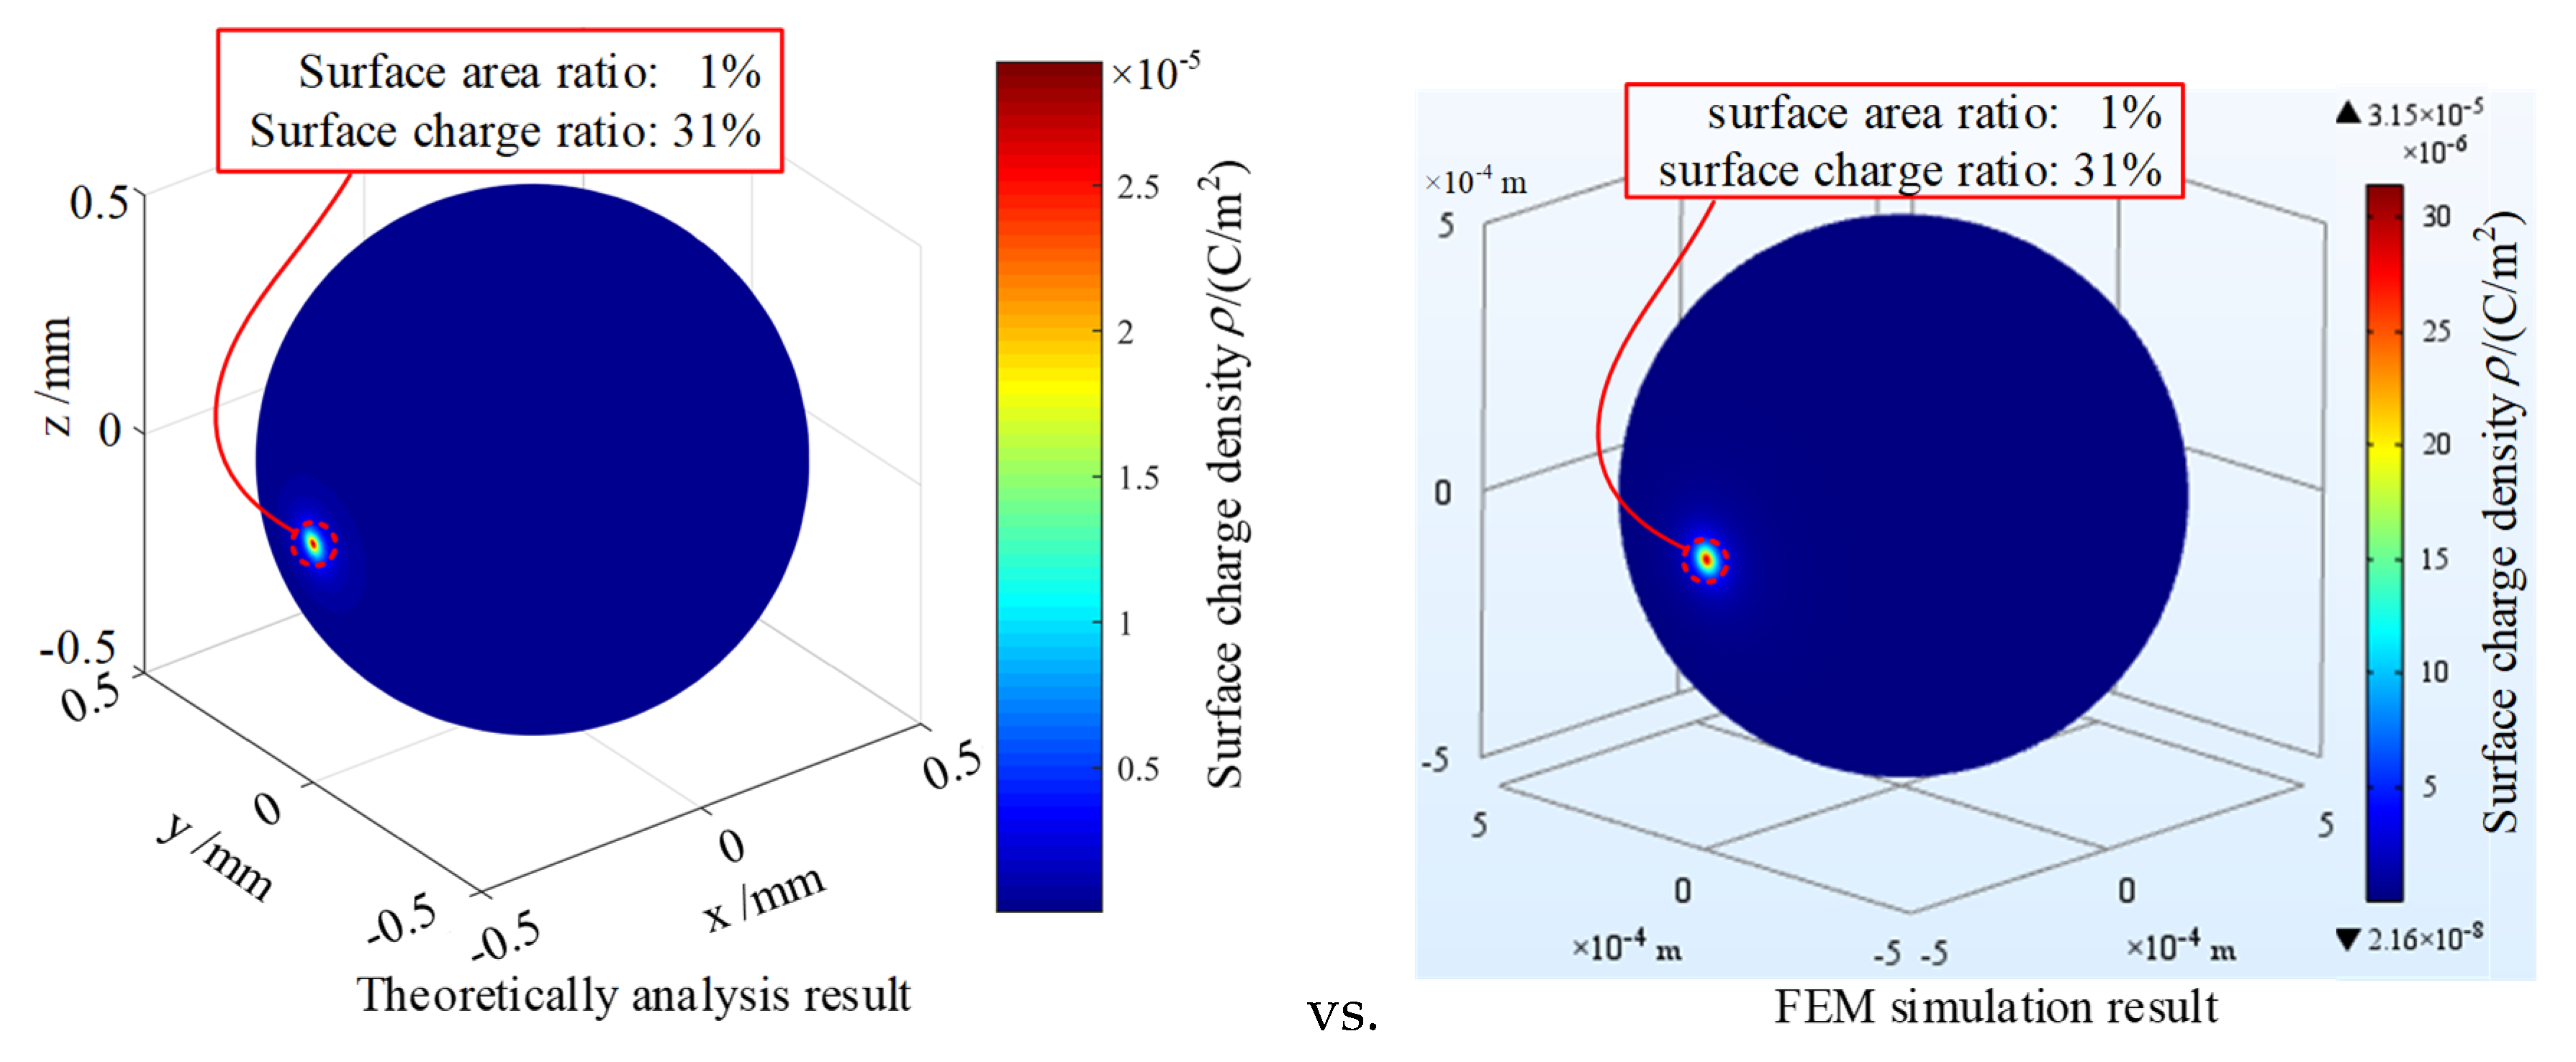
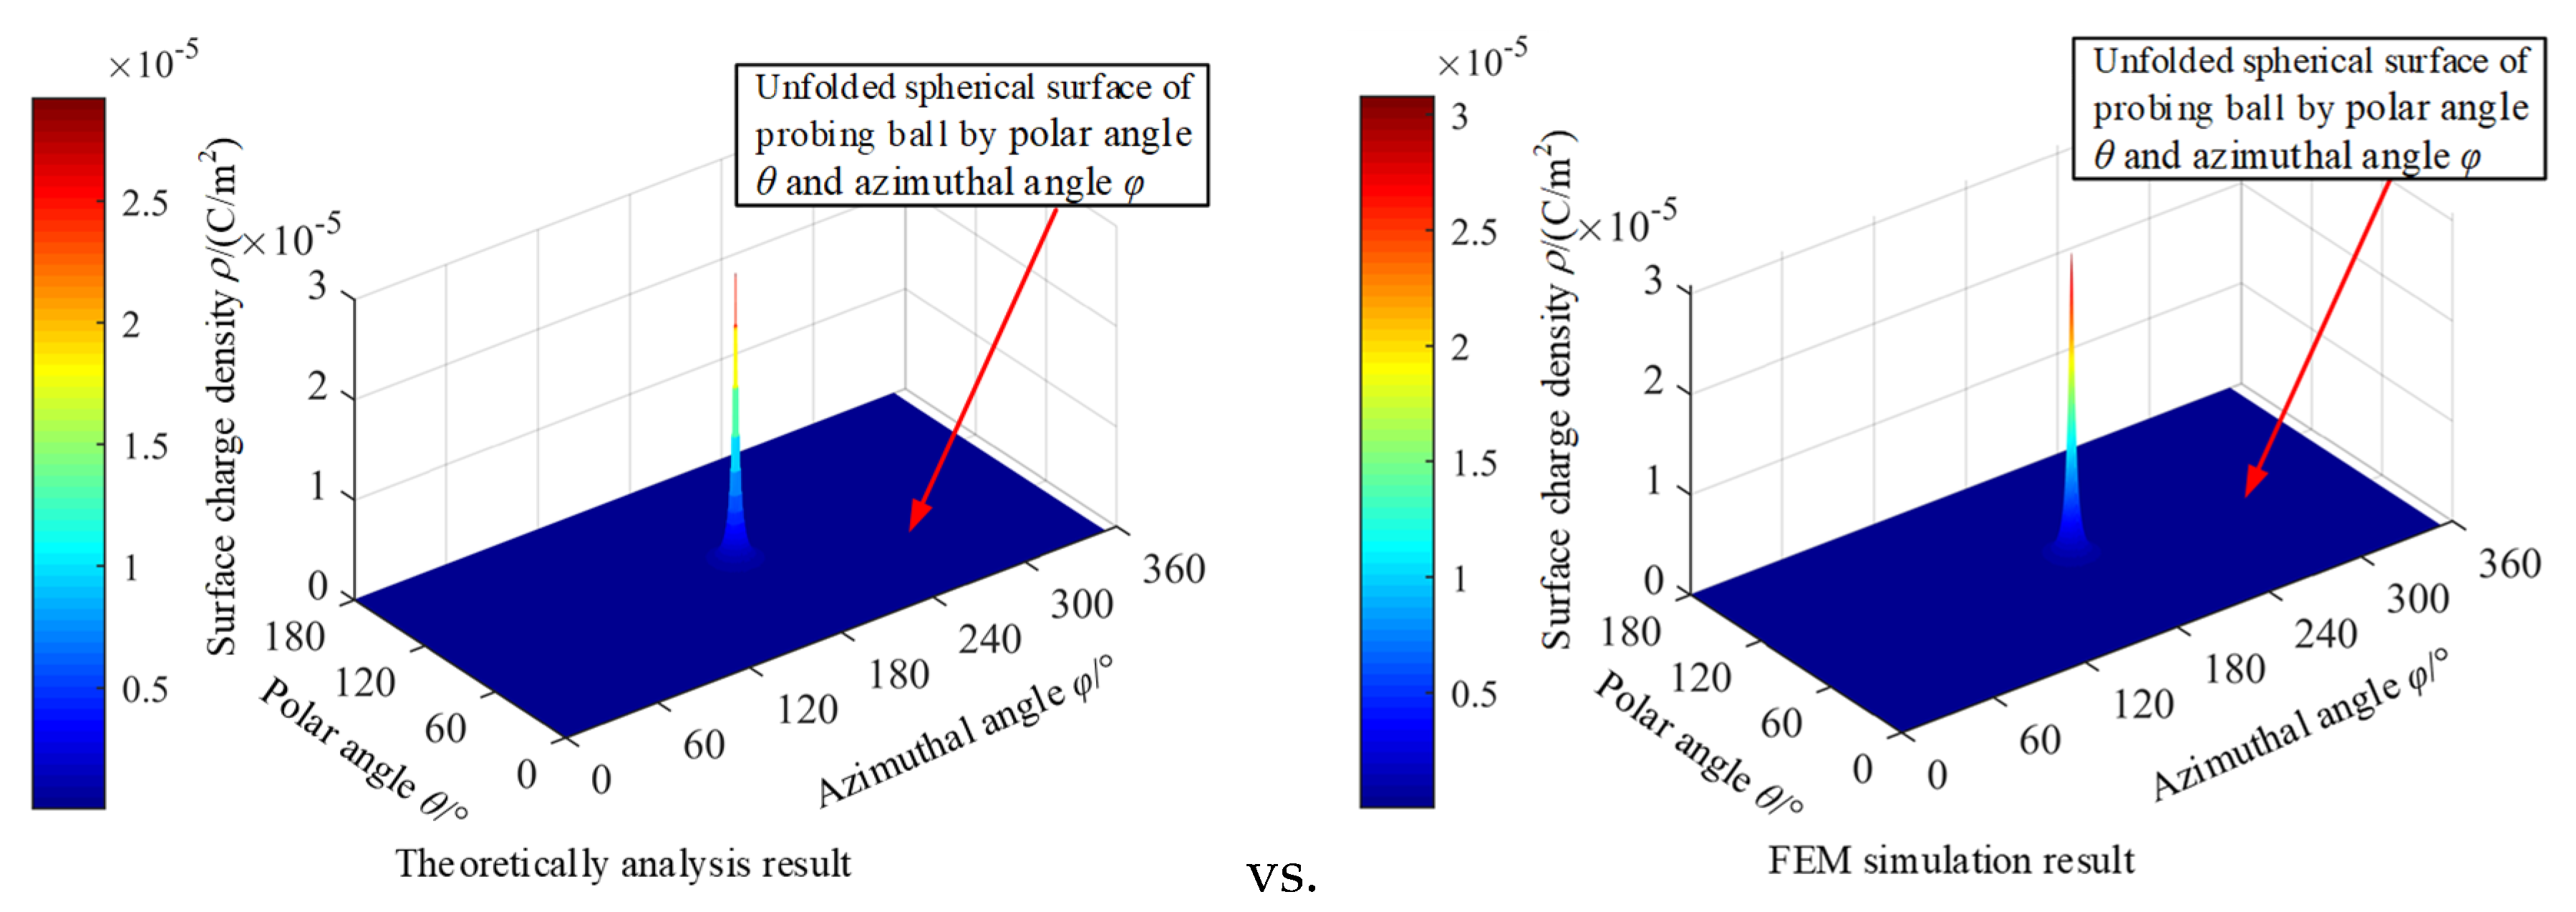
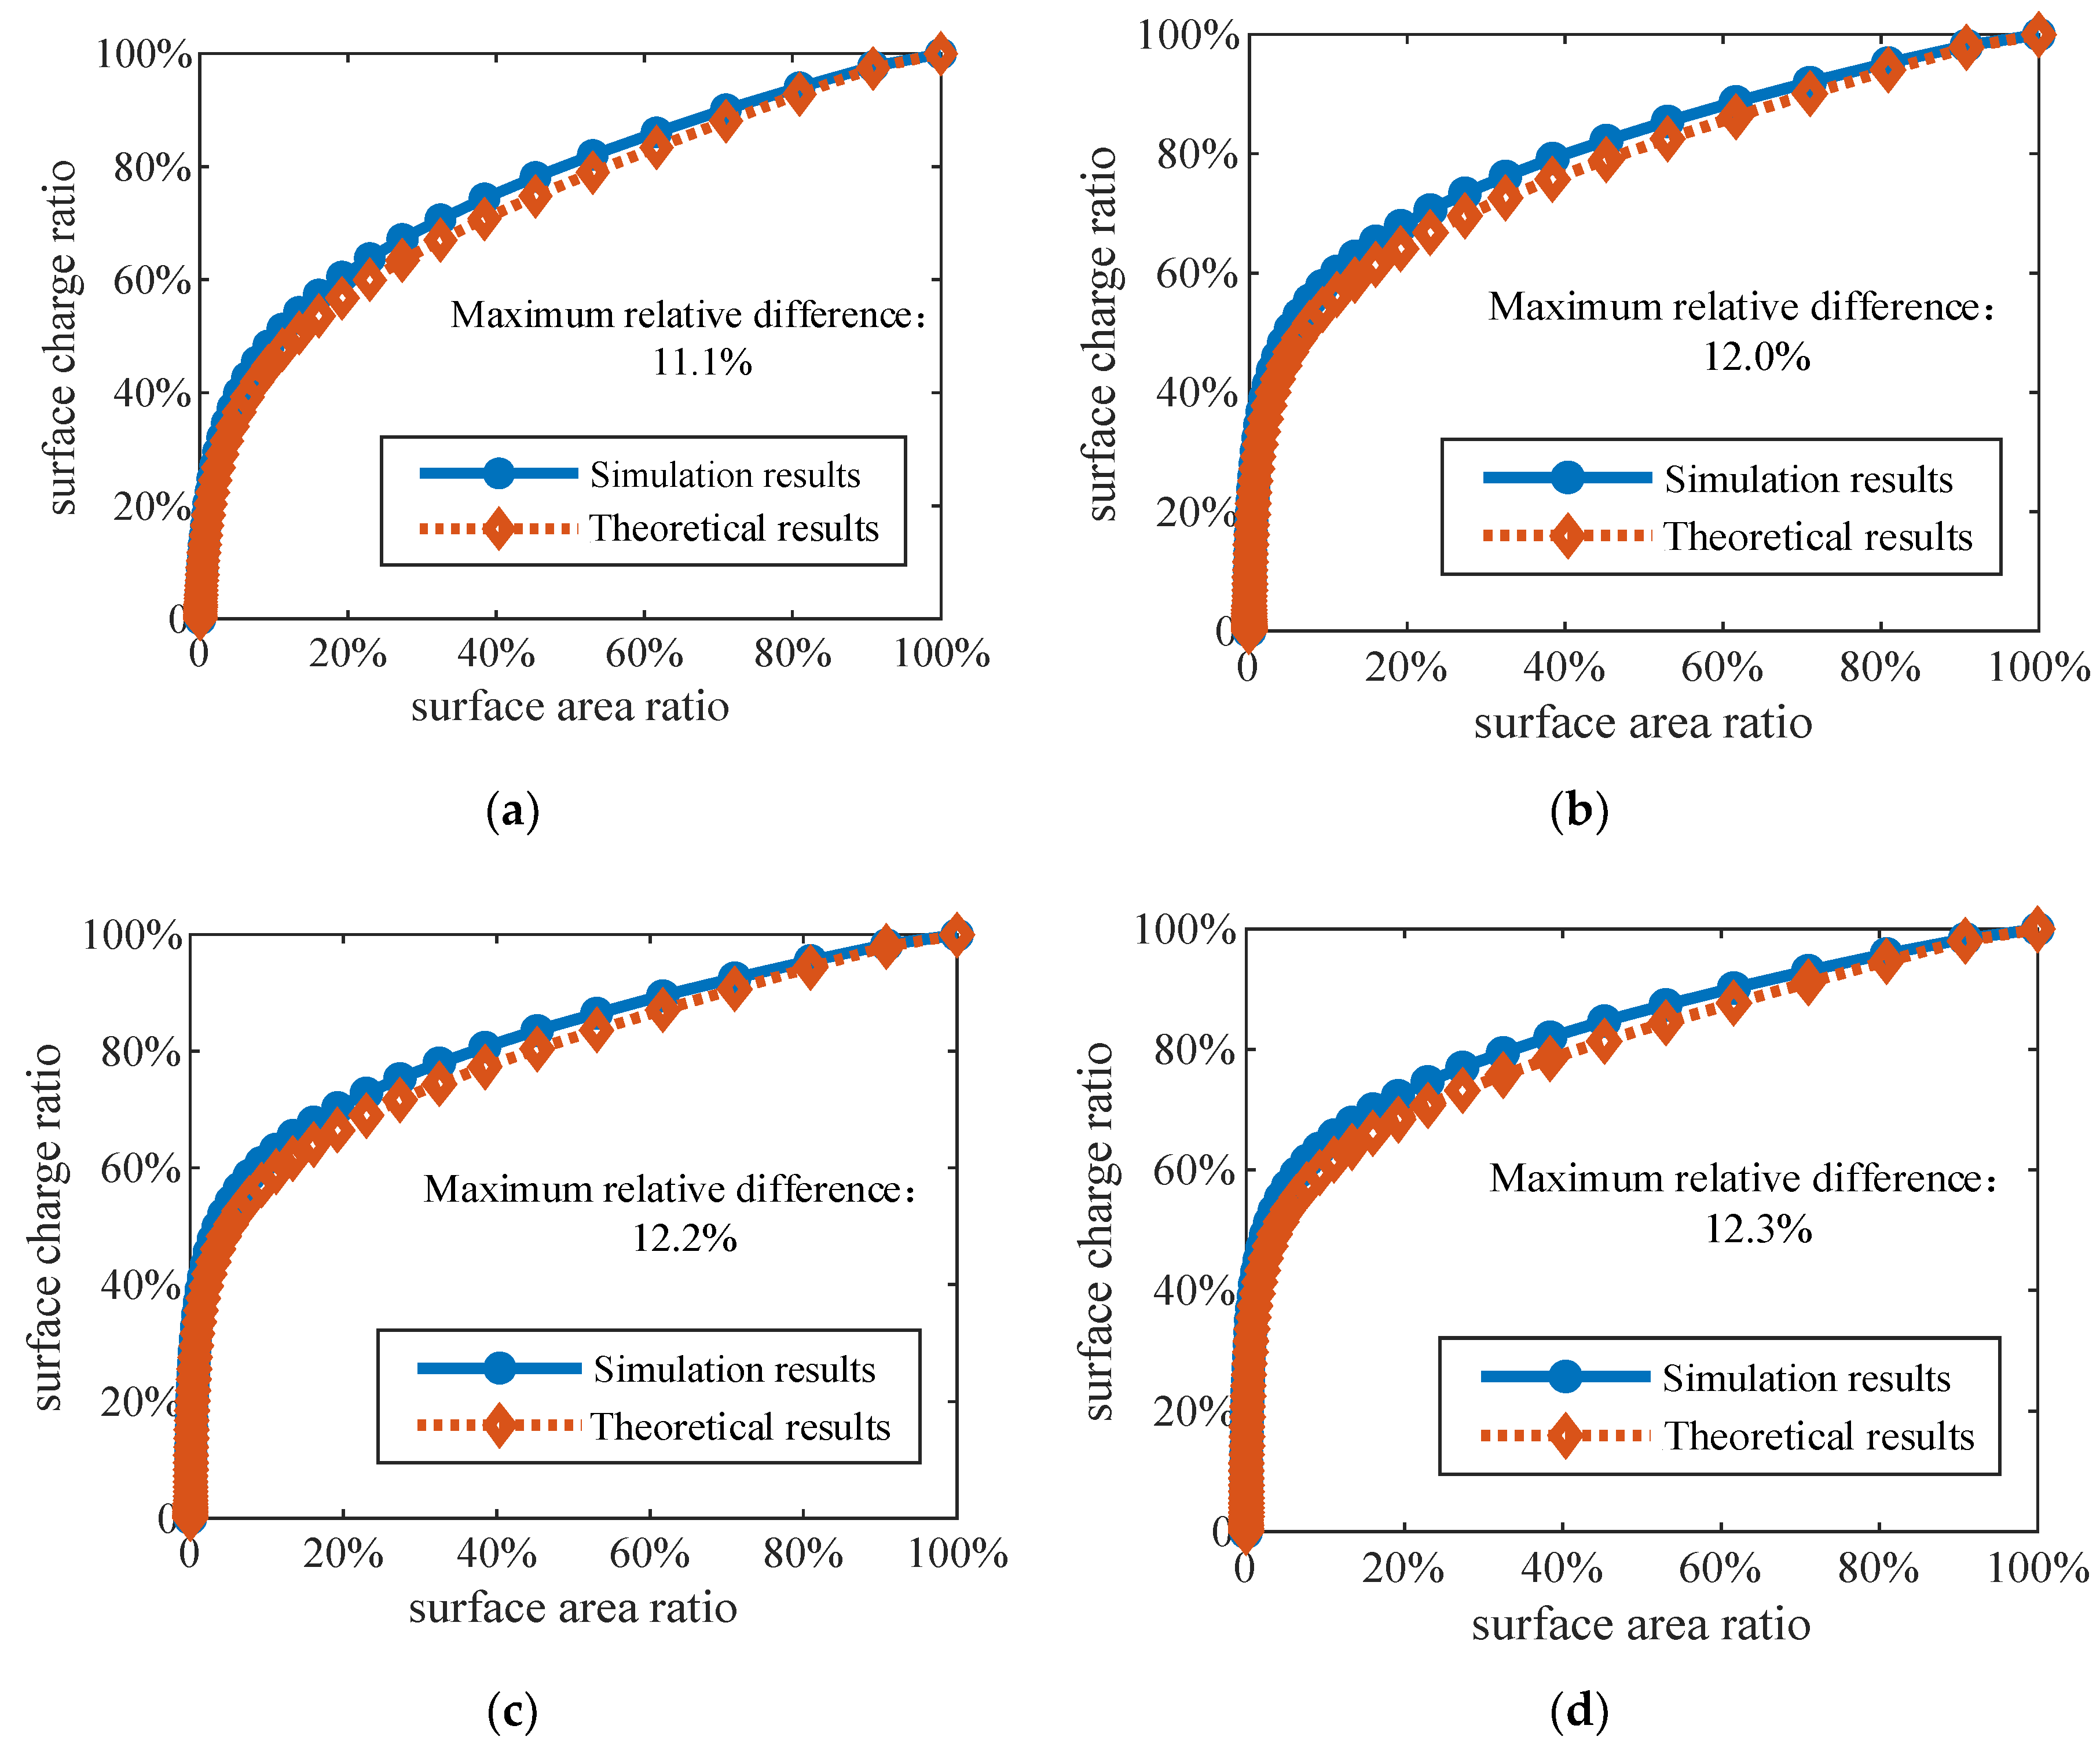
4. FEM Simulation Verification
5. Surface Charge Concentration Analysis
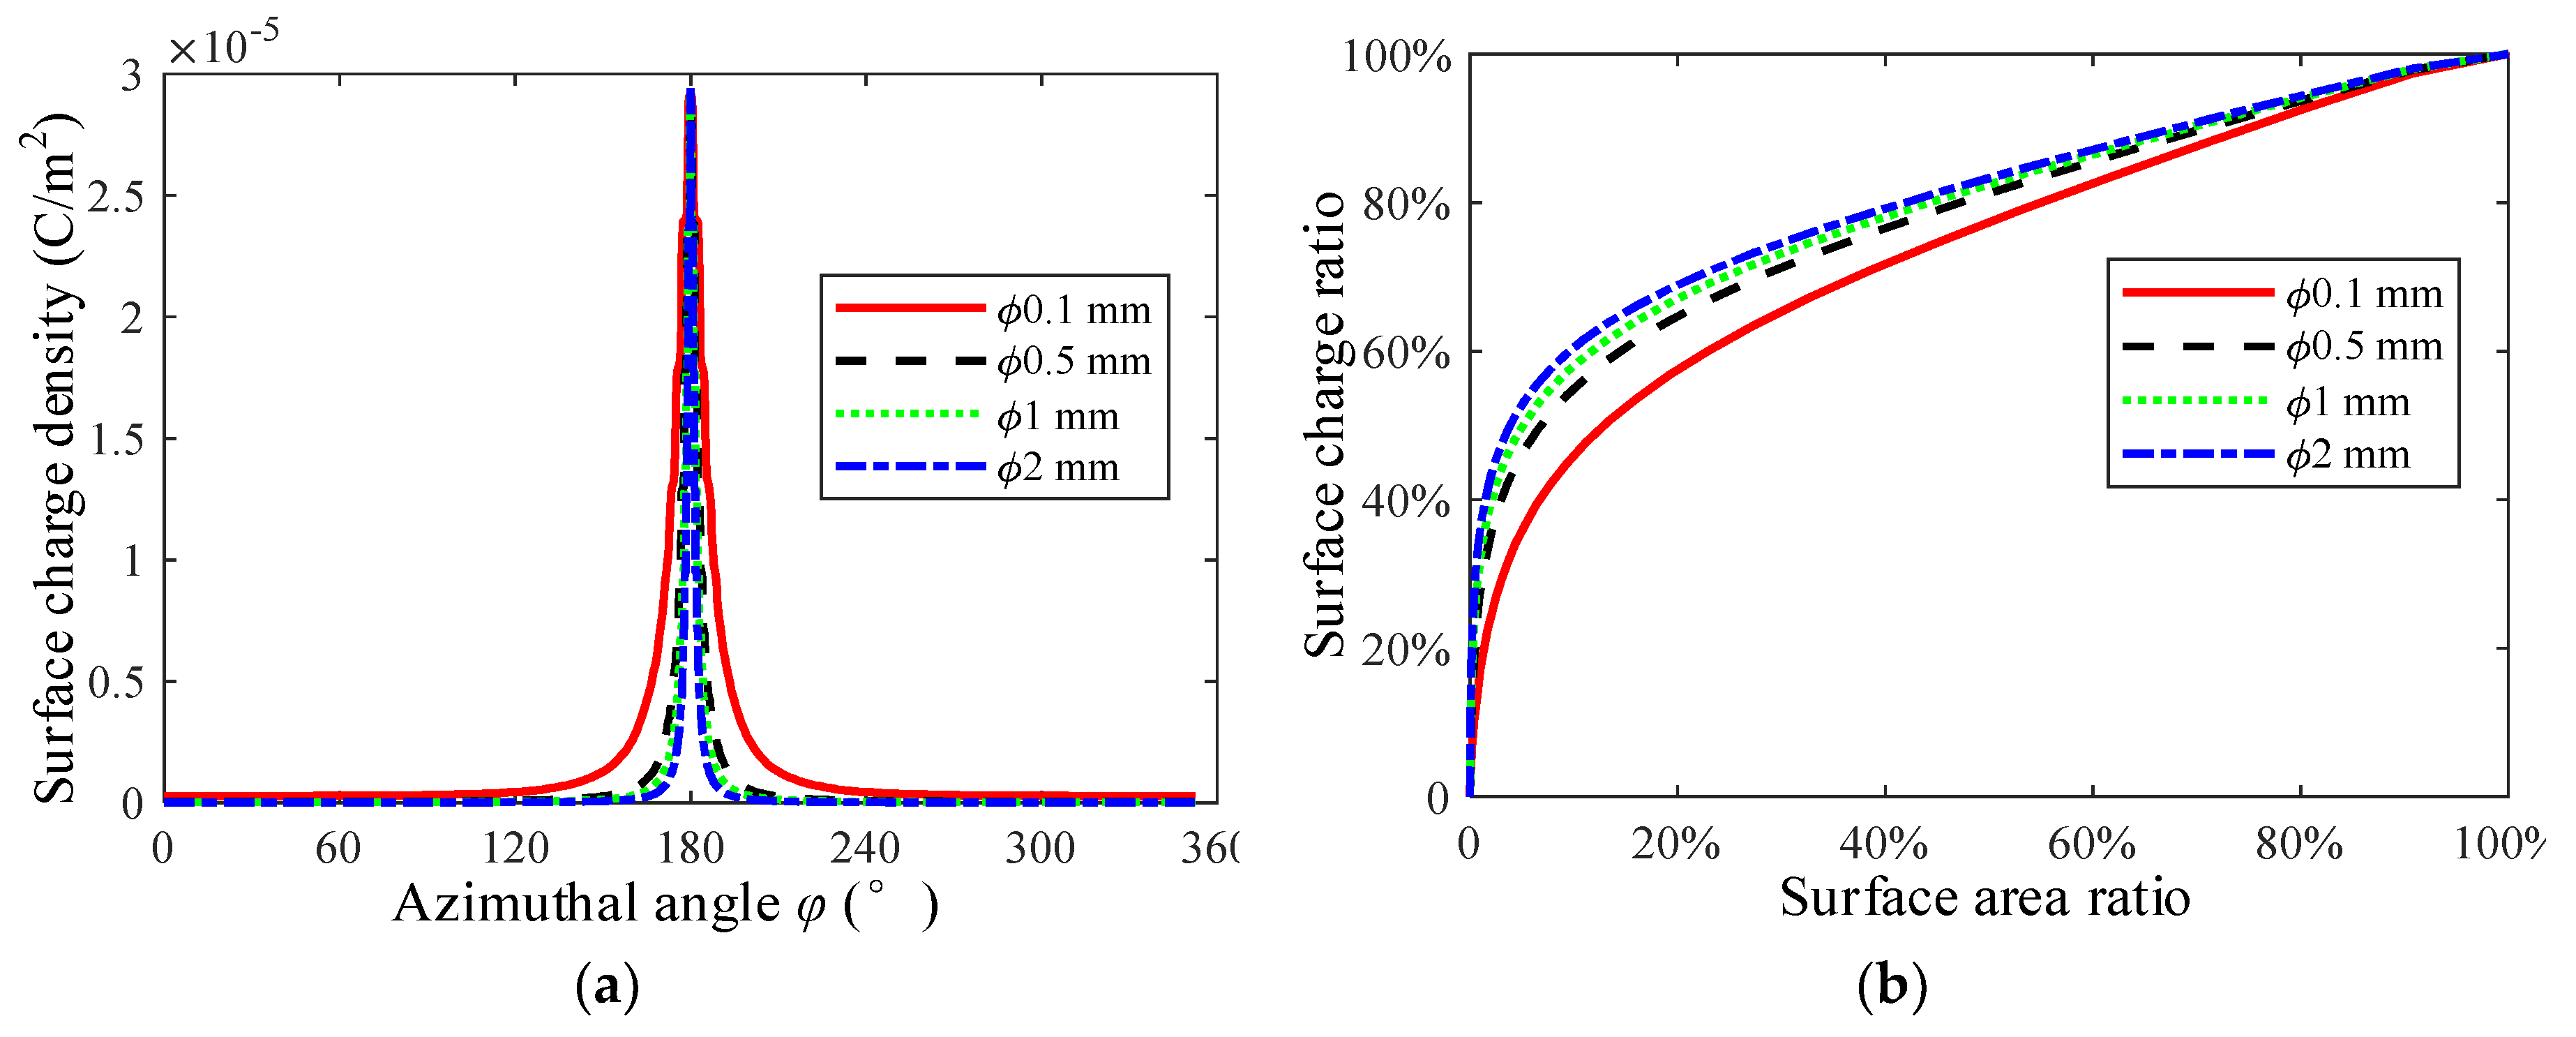
5.1. Surface Charge Concentration
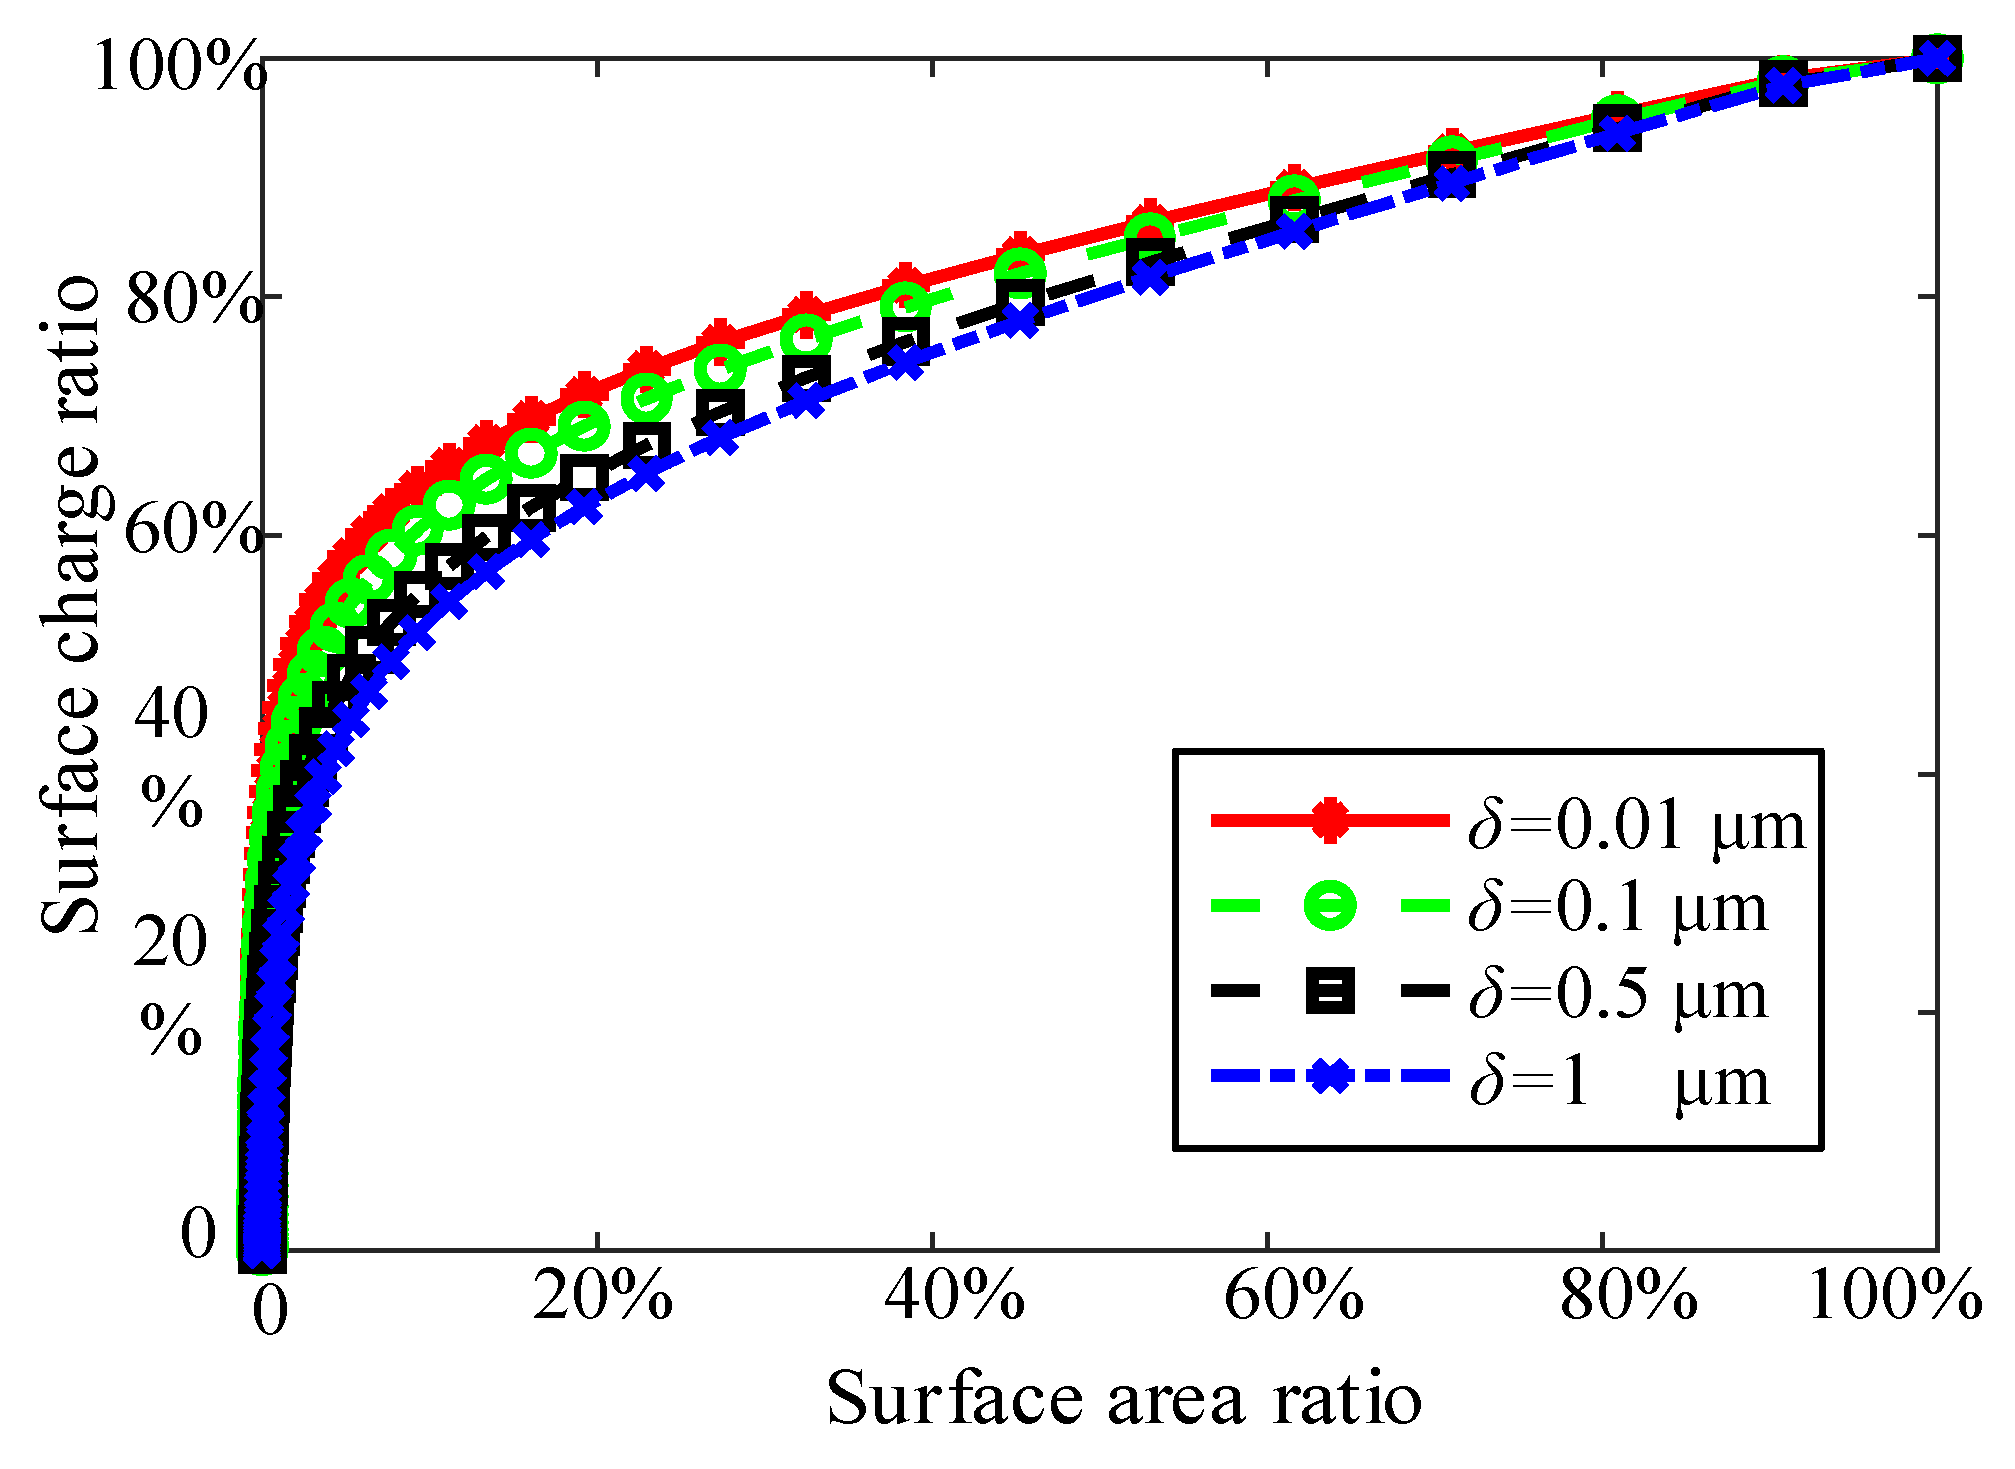
5.2. Effect of the Probing Gap
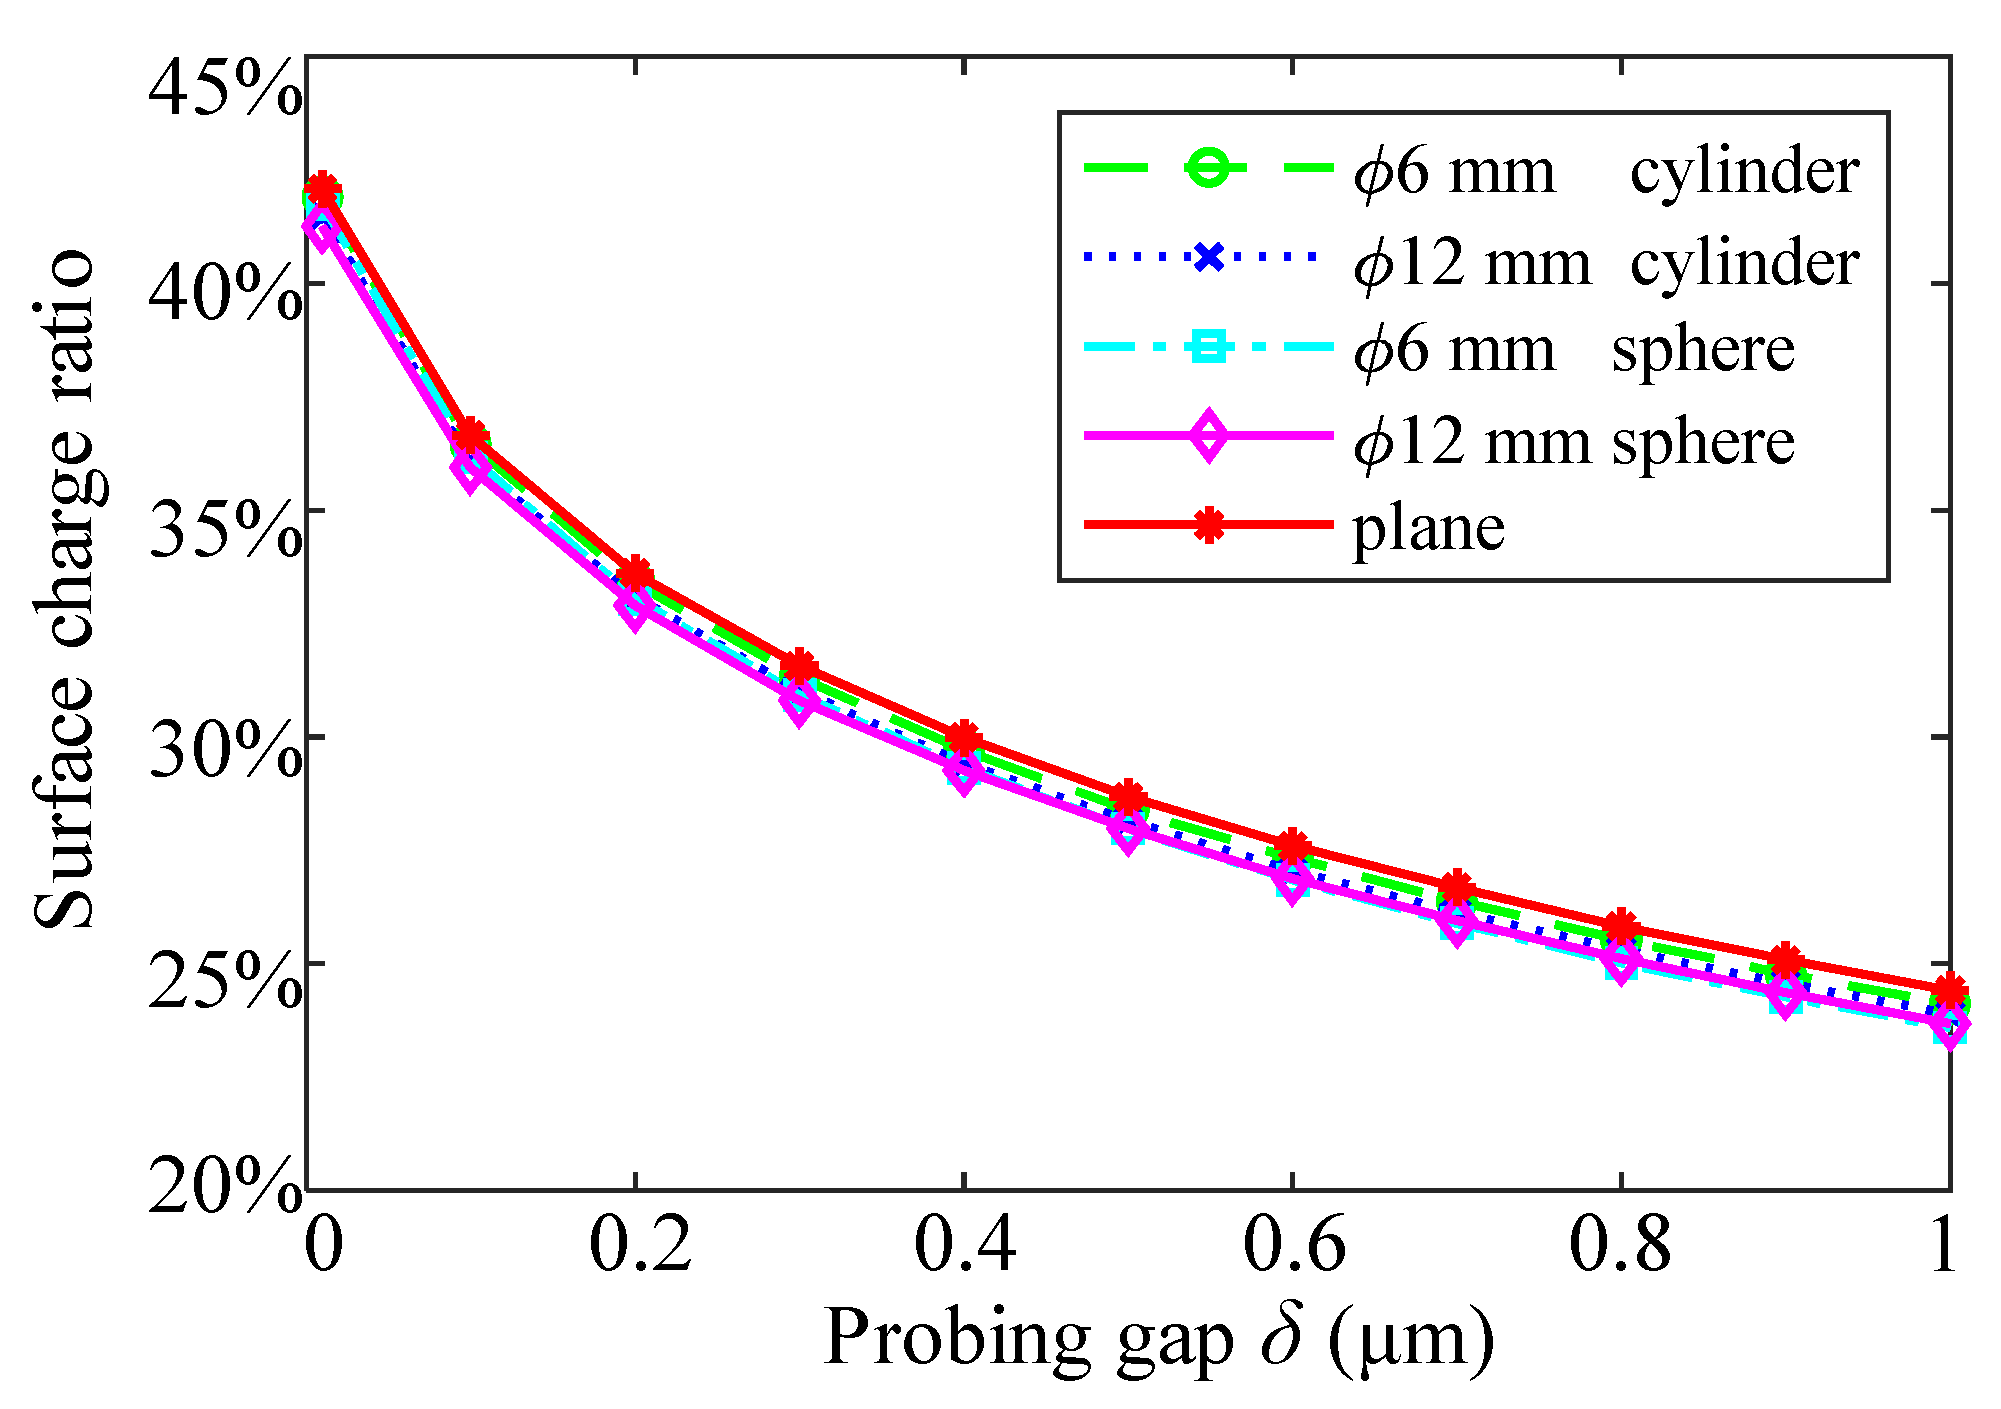
5.3. Effect of Surface Geometry
5.4. Point Probing Characteristics
6. Conclusions
Author Contributions
Funding
Conflicts of Interest
References
- Tan, J.B.; Cui, J.N. Ultraprecision 3d probing system based on spherical capacitive plate. Sens. Actuator A Phys. 2010, 159, 1–6. [Google Scholar] [CrossRef]
- Bian, X.; Cui, J.; Lu, Y.; Tan, J. Ultraprecision diameter measurement of small holes with large depth-to-diameter ratios based on spherical scattering electrical-field probing. Appl. Sci. 2019, 9, 242. [Google Scholar] [CrossRef] [Green Version]
- Bos, E.J.C. Aspects of tactile probing on the micro scale. Precis. Eng. J. Int. Soc. Precis. Eng. Nanotechnol. 2011, 35, 228–240. [Google Scholar] [CrossRef]
- Bauza, M.B.; Woody, S.C.; Woody, B.A.; Smith, S.T. Surface profilometry of high aspect ratio features. Wear 2011, 271, 519–522. [Google Scholar] [CrossRef]
- Hansen, H.N.; Carneiro, K.; Haitjema, H.; De Chiffre, L. Dimensional micro and nano metrology. CIRP Ann. Manuf. Technol. 2006, 55, 721–743. [Google Scholar] [CrossRef]
- Neugebauer, M.; Lüdicke, F.; Bastam, D.; Bosse, H.; Reimann, H.; Töpperwien, C. A new comparator for measurement of diameter and form of cylinders, spheres and cubes under clean-room conditions. Meas. Sci. Technol. 1997, 8, 849–856. [Google Scholar] [CrossRef]
- Thalmann, R. A New High Precision Length Measuring Machine. In Proceedings of the 8th International Metrology Congress, Besançon, France, 20–23 October 1997; pp. 1–4. [Google Scholar]
- Weckenmann, A.; Estler, T.; Peggs, G.; McMurtry, D. Probing systems in dimensional metrology. CIRP Ann. Manuf. Technol. 2004, 53, 657–684. [Google Scholar] [CrossRef]
- Zhao, Y.; Li, P.; Wang, C.; Pu, Z. A novel fiber-optic sensor used for small internal curved surface measurement. Sens. Actuator A Phys. 2000, 86, 211–215. [Google Scholar] [CrossRef]
- Weiqian, Z.; Jiubin, T.; Lirong, Q.; Limin, Z. A new laser heterodyne confocal probe for ultraprecision measurement of discontinuous contours. Meas. Sci. Technol. 2005, 16, 497. [Google Scholar]
- Schmitt, R.; Mallmann, G. Evaluation of the usage of a fiber optic low-coherence interferometer for surface profile measurements using speckles analysis. In Proceedings of the Speckle 2010: Optical Metrology, Florianapolis, Brazil, 13–15 September 2010; p. 73870N. [Google Scholar]
- Depiereux, F.; Konig, N.; Pfeifer, T.; Schmitt, R. Fiber-based white-light interferometer with improved sensor tip and stepped mirror. IEEE Trans. Instrum. Meas. 2007, 56, 2279–2283. [Google Scholar] [CrossRef]
- Cui, J.; Li, L.; Li, J.; Tan, J.B. Fiber probe for micro-hole measurement based on detection of returning light energy. Sens. Actuator A Phys. 2013, 190, 13–18. [Google Scholar] [CrossRef]
- Shiramatsu, T.; Kitano, K.; Kawada, M.; Mitsui, K. Development of measurement method for shape and dimension of micro-components. JSME Int. J. Ser. C 2004, 47, 369–376. [Google Scholar] [CrossRef] [Green Version]
- McMurtry, D. The development of sensors for cmms. Laser Metrol. Mach. Perform. VI 2003, 44, 205–220. [Google Scholar]
- Oiwa, T.; Nishitani, H. Three-dimensional touch probe using three fibre optic displacement sensors. Meas. Sci. Technol. 2004, 15, 84. [Google Scholar] [CrossRef]
- Takamasu, K.; Chih-Che, K.; Suzuki, A.; Hiraki, M.; Furutani, R.; Ozono, S. Development of pneumatic ball probe for measuring small hole. In Proceedings of the International Conference on Precision Engineerin, Taipei, Taiwan, 20–22 November 1997. [Google Scholar]
- Bowers, W.J.; Olson, D.A. A capacitive probe for measuring the clearance between the piston and the cylinder of a gas piston gauge. Rev. Sci. Instrum. 2010, 81, 035102. [Google Scholar] [CrossRef] [PubMed] [Green Version]
- Dai, G.; Heidelmann, M.; Kübel, C.; Prang, R.; Fluegge, J.; Bosse, H. Reference nano-dimensional metrology by scanning transmission electron microscopy. Meas. Sci. Technol. 2013, 24, 085001. [Google Scholar] [CrossRef]
- Peiner, E.; Doering, L. Nondestructive evaluation of diesel spray holes using piezoresistive sensors. IEEE Sens. J. 2013, 13, 701–708. [Google Scholar] [CrossRef]
- Kang, H.; Lim, M.; Yun, K. Characterization of the electric field concentration between two adjacent spherical perfect conductors. SIAM J. Appl. Math. 2014, 74, 125–146. [Google Scholar] [CrossRef]
- Morales, M.; Diaz, R.A.; Herrera, W.J. Solutions of laplace’s equation with simple boundary conditions, and their applications for capacitors with multiple symmetries. J. Electrost. 2015, 78, 31–45. [Google Scholar] [CrossRef] [Green Version]
- Johann, F.; Soergel, E. Quantitative measurement of the surface charge density. Appl. Phys. Lett. 2009, 95, 232906. [Google Scholar] [CrossRef] [Green Version]
- Villeneuve-Faure, C.; Boudou, L.; Makasheva, K.; Teyssedre, G. Methodology for extraction of space charge density profiles at nanoscale from kelvin probe force microscopy measurements. Nanotechnology 2017, 28, 505701. [Google Scholar] [CrossRef] [PubMed]
- Kumada, A.; Shimizu, Y.; Chiba, M.; Hidaka, K. Pockels surface potential probe and surface charge density measurement. J. Electrost. 2003, 58, 45–58. [Google Scholar] [CrossRef]
- Deng, J.; Kumada, A.; Hidaka, K.; Zhang, G.; Mu, H. Residual charge density distribution measurement of surface leader with feedback electrostatic probe. Appl. Phys. Lett. 2012, 100, 192906. [Google Scholar] [CrossRef]
- Okamoto, T.; Kitagawa, S.; Inoue, N.; Ando, A. Electric field concentration in the vicinity of the interface between anode and degraded BaTiO3-based ceramics in multilayer ceramic capacitor. Appl. Phys. Lett. 2011, 98, 072905. [Google Scholar] [CrossRef]
- De Chiffre, L.; Kunzmann, H.; Peggs, G.N.; Lucca, D.A. Surfaces in precision engineering, microengineering and nanotechnology. CIRP Ann. 2003, 52, 561–577. [Google Scholar] [CrossRef]


| Diameter of Probing Ball ϕ /mm | 0.1 | 0.5 | 1 | 2 |
|---|---|---|---|---|
| Maximum relative differences of surface charge density on probing ball | 2.2% | 5.9% | 5.3% | 4.2% |
© 2020 by the authors. Licensee MDPI, Basel, Switzerland. This article is an open access article distributed under the terms and conditions of the Creative Commons Attribution (CC BY) license (http://creativecommons.org/licenses/by/4.0/).
Share and Cite
Bian, X.; Cui, J.; Lu, Y.; Zhao, Y.; Cheng, Z.; Tan, J. Quantitative Investigation of Surface Charge Distribution and Point Probing Characteristics of Spherical Scattering Electrical Field Probe for Precision Measurement of Miniature Internal Structures with High Aspect Ratios. Appl. Sci. 2020, 10, 5268. https://doi.org/10.3390/app10155268
Bian X, Cui J, Lu Y, Zhao Y, Cheng Z, Tan J. Quantitative Investigation of Surface Charge Distribution and Point Probing Characteristics of Spherical Scattering Electrical Field Probe for Precision Measurement of Miniature Internal Structures with High Aspect Ratios. Applied Sciences. 2020; 10(15):5268. https://doi.org/10.3390/app10155268
Chicago/Turabian StyleBian, Xingyuan, Junning Cui, Yesheng Lu, Yamin Zhao, Zhongyi Cheng, and Jiubin Tan. 2020. "Quantitative Investigation of Surface Charge Distribution and Point Probing Characteristics of Spherical Scattering Electrical Field Probe for Precision Measurement of Miniature Internal Structures with High Aspect Ratios" Applied Sciences 10, no. 15: 5268. https://doi.org/10.3390/app10155268