Article

Temporal Trend of PM10 and Associated Human Health Risk over the Past Decade in Cluj-Napoca City, Romania

1
Research Institute for Analytical Instrumentation Subsidiary, National Institute of Research and Development for Optoelectronics INOE 2000, 400293 Cluj-Napoca, Romania
2
Faculty of Environmental Sciences and Engineering, Babes-Bolyai University, 400294 Cluj-Napoca, Romania
3
Remote Sensing Department, National Institute of Research and Development for Optoelectronics INOE 2000, 077125 Magurele, Romania
4
Department of Pharmacy, Medicine and Pharmacy Faculty, University of Oradea, 410028 Oradea, Romania
5
DIMTEC, University of the Free State, Bloemfontein 9300, South Africa
*
Author to whom correspondence should be addressed.
Appl. Sci. 2020, 10(15), 5331; https://doi.org/10.3390/app10155331
Submission received: 6 July 2020 / Revised: 24 July 2020 / Accepted: 30 July 2020 / Published: 1 August 2020
(This article belongs to the Section Environmental Sciences)

Abstract

:
The human health risk associated with PM10 exposure was assessed for the residents of Cluj-Napoca city, Romania, for a best case-scenario based on the monthly average PM10 and for a worst-case scenario based on the monthly 90th percentile of PM10 concentration. As no toxicity value for PM10 was available, for the calculation of the hazard quotient, the toxicity value was considered to be equal to the annual limit value (40 µm/m3) set in the European Union (EU), and to air quality guidelines (20 µm/m3) set by the World Health Organization (WHO). The daily PM10 concentrations for the period 2009–2019, at the four monitoring stations existing in Cluj-Napoca, were obtained from the National Air Quality Monitoring Network. The annual PM10 values ranged between 20.3 and 29.5 µg/m3, and were below the annual limit value (40 µg/m3) set by European and national legislation, but above the annual air quality guideline (20 µg/m3) set by WHO. Generally, the monthly PM10 concentrations were higher from October to March than in the rest of the year. The monthly air quality index (AQI) showed the good to moderate quality of the air during the whole decade; however, there were days when the air quality was unhealthy for sensitive population groups. The air quality was more or less constant during the warm months, and improved significantly for the cold months from 2009 to 2019. In the best-case scenario, calculated using the EU annual limit value for PM10, the potential non-carcinogenic chronic health risk was present only in 2009 and 2010, but in the worst-case scenario, in each year there were periods, especially in the cold months, in which health risk was present. When considering the WHO air quality guidelines in the calculation of the health risk, the potential non-carcinogenic chronic health risk was present between October and March in each year in the best-case scenario, and in most of the months in the worst-case scenario.

1. Introduction

Despite the important measures taken to reduce pollutant emissions in the last few decades, air quality remains a major issue of concern all over the world [1,2]. Exposure to air pollution may cause acute and chronic health effects, determining increased mortality and morbidity in the exposed population [3]. In Europe, air pollution is considered the most important environmental risk to human health, and one of the biggest environmental concerns [4]. In this sense, the EU air quality policy was revised based on the research data obtained through several international research projects [5]. At European level, the major sources of outdoor air pollution, with particulate matter with a diameter below 10 µm (PM10), are road transport and space heating, followed by shipping, energy production and distribution, and agriculture and industry [5]. Waste burning, a common practice especially in developing countries, was found to have a high impact on the PM10 concentration [6]. In Romania, the main pollution source of PM10 is space heating (62%), followed by agriculture (11.5%), industrial processes and product use (10.3%), energy use in industry (4.5%), road transport (3.8%), energy production (3.9%) and waste (0.8%) [7]. Previous studies made for Romania concerning the PM1 non-refractory fraction, done through receptor-oriented models, reveal season-dependent sources. The receptor-oriented models used were based on the assessment of sources’ contributions to pollutants concentration, measured at a specific point [8]. In winter, the dominant sources are related to road transport, wood combustion associated with residential heating and coal combustion, while during the summer the main sources are traffic. biomass-burning associated with agricultural activities and long-range transport. Agricultural and industry tracers such are ammonia, and sulphate, are present all over the year [9]. Due to high population density, high energy demand and large number of vehicles, cities are facing more intense air pollution than rural areas [4,10,11].
Particulate matter (PM) is a complex mixture of solid particles and liquid droplets suspended in the atmosphere, that varies in concentration, size, shape, chemical composition, surface area, acidity, solubility, reactivity and origin. Exposure to high PM levels is a potential health risk for humans, as inhaled particulates may reach different depths of the lungs, according to their size, causing severe adverse health effects. Several studies revealed the association of high PM levels with the increase of respiratory and cardiovascular pathology incidences [12,13,14,15,16]. Generally, natural sources emit particles with diameters above 2.5 µm, while anthropogenic sources emit fine and ultrafine particles. As PM10 contains the fine and ultrafine fraction, the health risk calculated based on PM10 concentration may be slightly overestimated. Other studies revealed that a decrease in PM2.5 of 10% may determine an increase in life expectancy of more than a half year [17,18,19,20,21]. Vaduganathan et al. reported that PM10 levels below the daily limit (50 µg/m3) set by the EU Directive 2008/50/EC are associated with excess risk for acute cardiovascular events [22,23]. To reduce the health impacts of air pollution, the World Health Organization (WHO) developed Air Quality Guidelines (AQG) for several pollutants, among them also for PM10. This AQG are independent from any policy restrictions or local consideration, and are neither standards nor legally binding criteria, but they offer guidance for governmental authorities in developing health-based national air quality management strategies. Moreover, outdoor air pollution and particulate matter were included on the list of carcinogens by the International Agency for Research on Cancer [24]. Although air pollution with PM10 affects the whole population, it was found that certain groups of workers (professional drivers, urban traffic police, street vendors, etc.) or age groups such as children, older adults and those with pre-existing health problems are more vulnerable to developing specific pathologies [4,5,24,25]. Furthermore, population groups with low socio-economic status tend to be more exposed to PM10, as they most probably live in highly polluted areas, use low quality fuels for heating and have deficient waste management practices [4]. Besides the health effects on humans and the environmental impact, considerable economic impacts are attributed to air pollution, as it reduces life expectancy, increases medical costs and reduces productivity through working days lost [4].
To estimate the health risk resulting from exposure to a specific pollutant, the United States Environmental Protection Agency (US EPA) risk assessment methodology is frequently used [26]. Another tool that allows assessing the relationship between pollutant concentration and health impacts is the Air Quality Health Impact Assessment software [11]. The importance of conducting human health risk assessments is confirmed by the fact that in 2017, concentrations of PM10 above the EU daily limit value (50 µm/m3) were measured by 22% of the monitoring stations in 17 out the 28 EU member states, while levels above WHO AQG (20 µm/m3) were measured by 51% of the monitoring stations in the majority of the countries [4]. Furthermore, around one fifth of the European urban population was exposed to PM10 levels above the EU daily limit value, and half of it to PM10 above AQG [4]. Air quality in Romania represents a European and national concern. In this regard, the EU opened the infringement procedure against Romania in 2018 for not taking measures to reduce atmospheric pollution in the major cities. Bucharest, the capital city of Romania, received penalties for PM10 levels exceedance, while Cluj-Napoca city received the same for NO2. In 2015, the European Environmental Agency estimated 27,280 premature deaths in Romania associated with PM, ozone and nitrogen dioxide, out of which 25,400 were attributed to PM concentrations [27]. The urban population of Romania exposed to PM10 values above the EU daily limit values decreased from 53.1% in 2013 to 21.4% in 2017 [28]. This decrease could be the consequence of the initiation of air monitoring and pollution abatement measures requested by Law 104/2011, which transpose into the national legislation the Directive 2008/50/EC ambient air quality and cleaner air for Europe [29]. Numerous studies reported the level of PM in cities all over the world [1,30,31,32,33]. Human health risk assessment studies regarding PM10 and toxic elements in PM10 were also carried out in several cities [34,35,36,37,38,39]. These studies revealed that although PM concentrations do not exceed air quality standards, the health impacts associated to air pollution exposure are still important [40]. Therefore, the assessment of the human health risks caused by exposure to airborne PM is an important step in order to control and mitigate urban air pollution. As the chemical composition of PM depends on a high number of factors, such as geography, season, climate and combustion sources, and differs from region to region, the health risk assessment in different cities could give a better insight into the population exposure and health risks [18]. In Romania, Leitte et al. presented the adverse effects of air pollution on the respiratory tract for the inhabitants of Drobeta Turnu Severin [39], while Dunea et al. showed the impact of PM2.5 and associated metals on the health of children in the industrial area of Targoviste [40]. However, to the best of our knowledge, no health risk assessment associated with PM10 has been conducted in Romania.
This research aimed to assess the health risks associated with PM10 for the residents living in one of the largest urban agglomerations in Romania. The air quality index (AQI) was applied in the urban agglomeration of Cluj-Napoca, in order to analyze the temporal variation of the pollution level of PM10 from 2009 to 2019, and to identify the seasons when air quality can become an issue for the local population. The health risk assessment, according to EU and WHO recommendations, was conducted for the first time in a Romanian city. The health risk assessment will offer information to local governments regarding the efficiency of air quality management. The results of this study can support decision-makers in implementing and developing better strategies and regulations to improve air quality and to mitigate the effects on human health.

2. Materials and Methods

2.1. Study Area and Population

Cluj-Napoca city represents the fourth most populated city in Romania, with 326,687 inhabitants (47.1% men and 52.9% women) in the city and 420,000 in the metropolitan area. According to the 2011 Population and Housing Census reported by the National Institute of Statistics and the Statistical Division of the Cluj County, the population is 4.3% children (age under 5), 12.9% pupils and students (age 5–19), 70.3% adults (age 20–64) and 12.5% elders (age > 65) [41].
Located in the Somes Mic river valley, surrounded by forests and grasslands, Cluj-Napoca has a continental climate characterized by warm, dry summers and cold winters. The city is an important trade and tourist center and a hub of the European network roads, connecting the country with Western Europe. It has a large industrial park with modern facilities, and the second main airport in Romania, after Bucharest, is located 9 km east of the center of the city. The local topography, mainly the Somes Mic River that crosses the city, influences the dominant NW (~15%), NE (~12%), W (~10%) and SW (~10%) wind direction [42]. Further, the dominant wind direction can favor the accumulation processes or the upwind emissions.
The Integrated Air Quality Plan for Cluj-Napoca city for 2019–2023 identified five primary PM10 pollution sources that account for 89% of the total PM10 emission in the city, as follows: household heating (32%), road reconstructions (18%), traffic (16%), industrial activities (12%) and construction/demolition sites (11%) [43].

2.2. Air Quality Data

Cluj-Napoca has 4 stations belonging to the National Air Quality Monitoring Network that monitors the traffic (CJ-1), urban (CJ-2), suburban (CJ-3) and industrial (CJ-4) influences on the air pollution (Figure 1).
At the CJ-1, CJ-2 and CJ-3 stations, the PM10 concentration is measured gravimetrically using Skypost Tecora (Cogliate, Italy) low volume samplers, while at the CJ-4 station it is done by optic measurements using an LSPM10 (Unitec, Veggiano, Italy) analyzer. In this study, the assessment of PM10 air pollution in Cluj-Napoca was carried out using the daily PM10 concentrations provided by the operational monitoring stations. The daily PM10 was further aggregated to monthly and annual concentrations for the period 2009–2019. Data are publicly available on the National Air Quality Monitoring Network website [44].

2.3. Air Quality Index

The air quality can be comprehensively presented to citizens using the AQI, calculated according to Equation (1). While the AQI is normally used to report the daily air quality at each monitoring station, in this study it was used to assess the monthly variability and to underline the multi-annual trends using all four operational stations in Cluj-Napoca city, considering that a single monitoring station is not representative for a city and did not reflect spatial variations of PM10. Therefore, the daily AQI was calculated based on the average PM10 concentration obtained for the operational stations and the EU daily limit value (50 µg/m3) [45,46]. The daily AQI was further aggregated to obtain the monthly AQI.
A Q I = P M 10   c o n c e n t r a t i o n t h r e s h o l d   c o n c e n t r a t i o n × 100
According to AQI, the air quality is classified as good (0–50), moderate (51–100), unhealthy for sensitive groups (101–150), unhealthy (151–200), very unhealthy (201–300) and hazardous (301–500). High AQI values indicate a high level of air pollution with PM10. The AQI values below 100 are considered satisfactory, while values above 100 are considered to pose health risks [45].

2.4. Human Health Risk Assessment

To estimate the human health risk related to PM10 exposure by inhalation, the hazard quotient (HQ) was calculated according to Equation (2) [26]:
HQ = EC/TV
where EC is the exposure concentration of PM10 (µg/m3) calculated according to Equation (3), and TV is the toxicity value [26]. As no toxicity value for PM10 was found in the literature, the calculations were made assuming that the TV was equal to the EU annual limit value of 40 µm/m3 (HQ1), and to the WHO AQG of 20 µm/m3 (HQ2).
EC = (CA × ET × EF × ED)/AT
where CA is the monthly average PM10 concentration (µg/m3) for the best-case scenario and the monthly 90th quartile for the worst-case scenario, ET is the exposure time (hours/day), EF is the exposure frequency (days/year), ED is the exposure duration (year) and AT is the averaging time calculated as ED × 365 days/year × 24 h/day. For the exposure of residents, ET was considered 24 h/day, EF was 350 days/year and ED was 30 years for adults [26].
Non-carcinogenic risk includes all the adverse health effects in the organism, excluding cancer caused by exposure factors. The used safety benchmark level for HQ is 1. Thus, the exposure to PM10 could induce non-carcinogenic chronic effects if HQ > 1, while no non-carcinogenic health risk is expected if HQ < 1 [47].

3. Results and Discussion
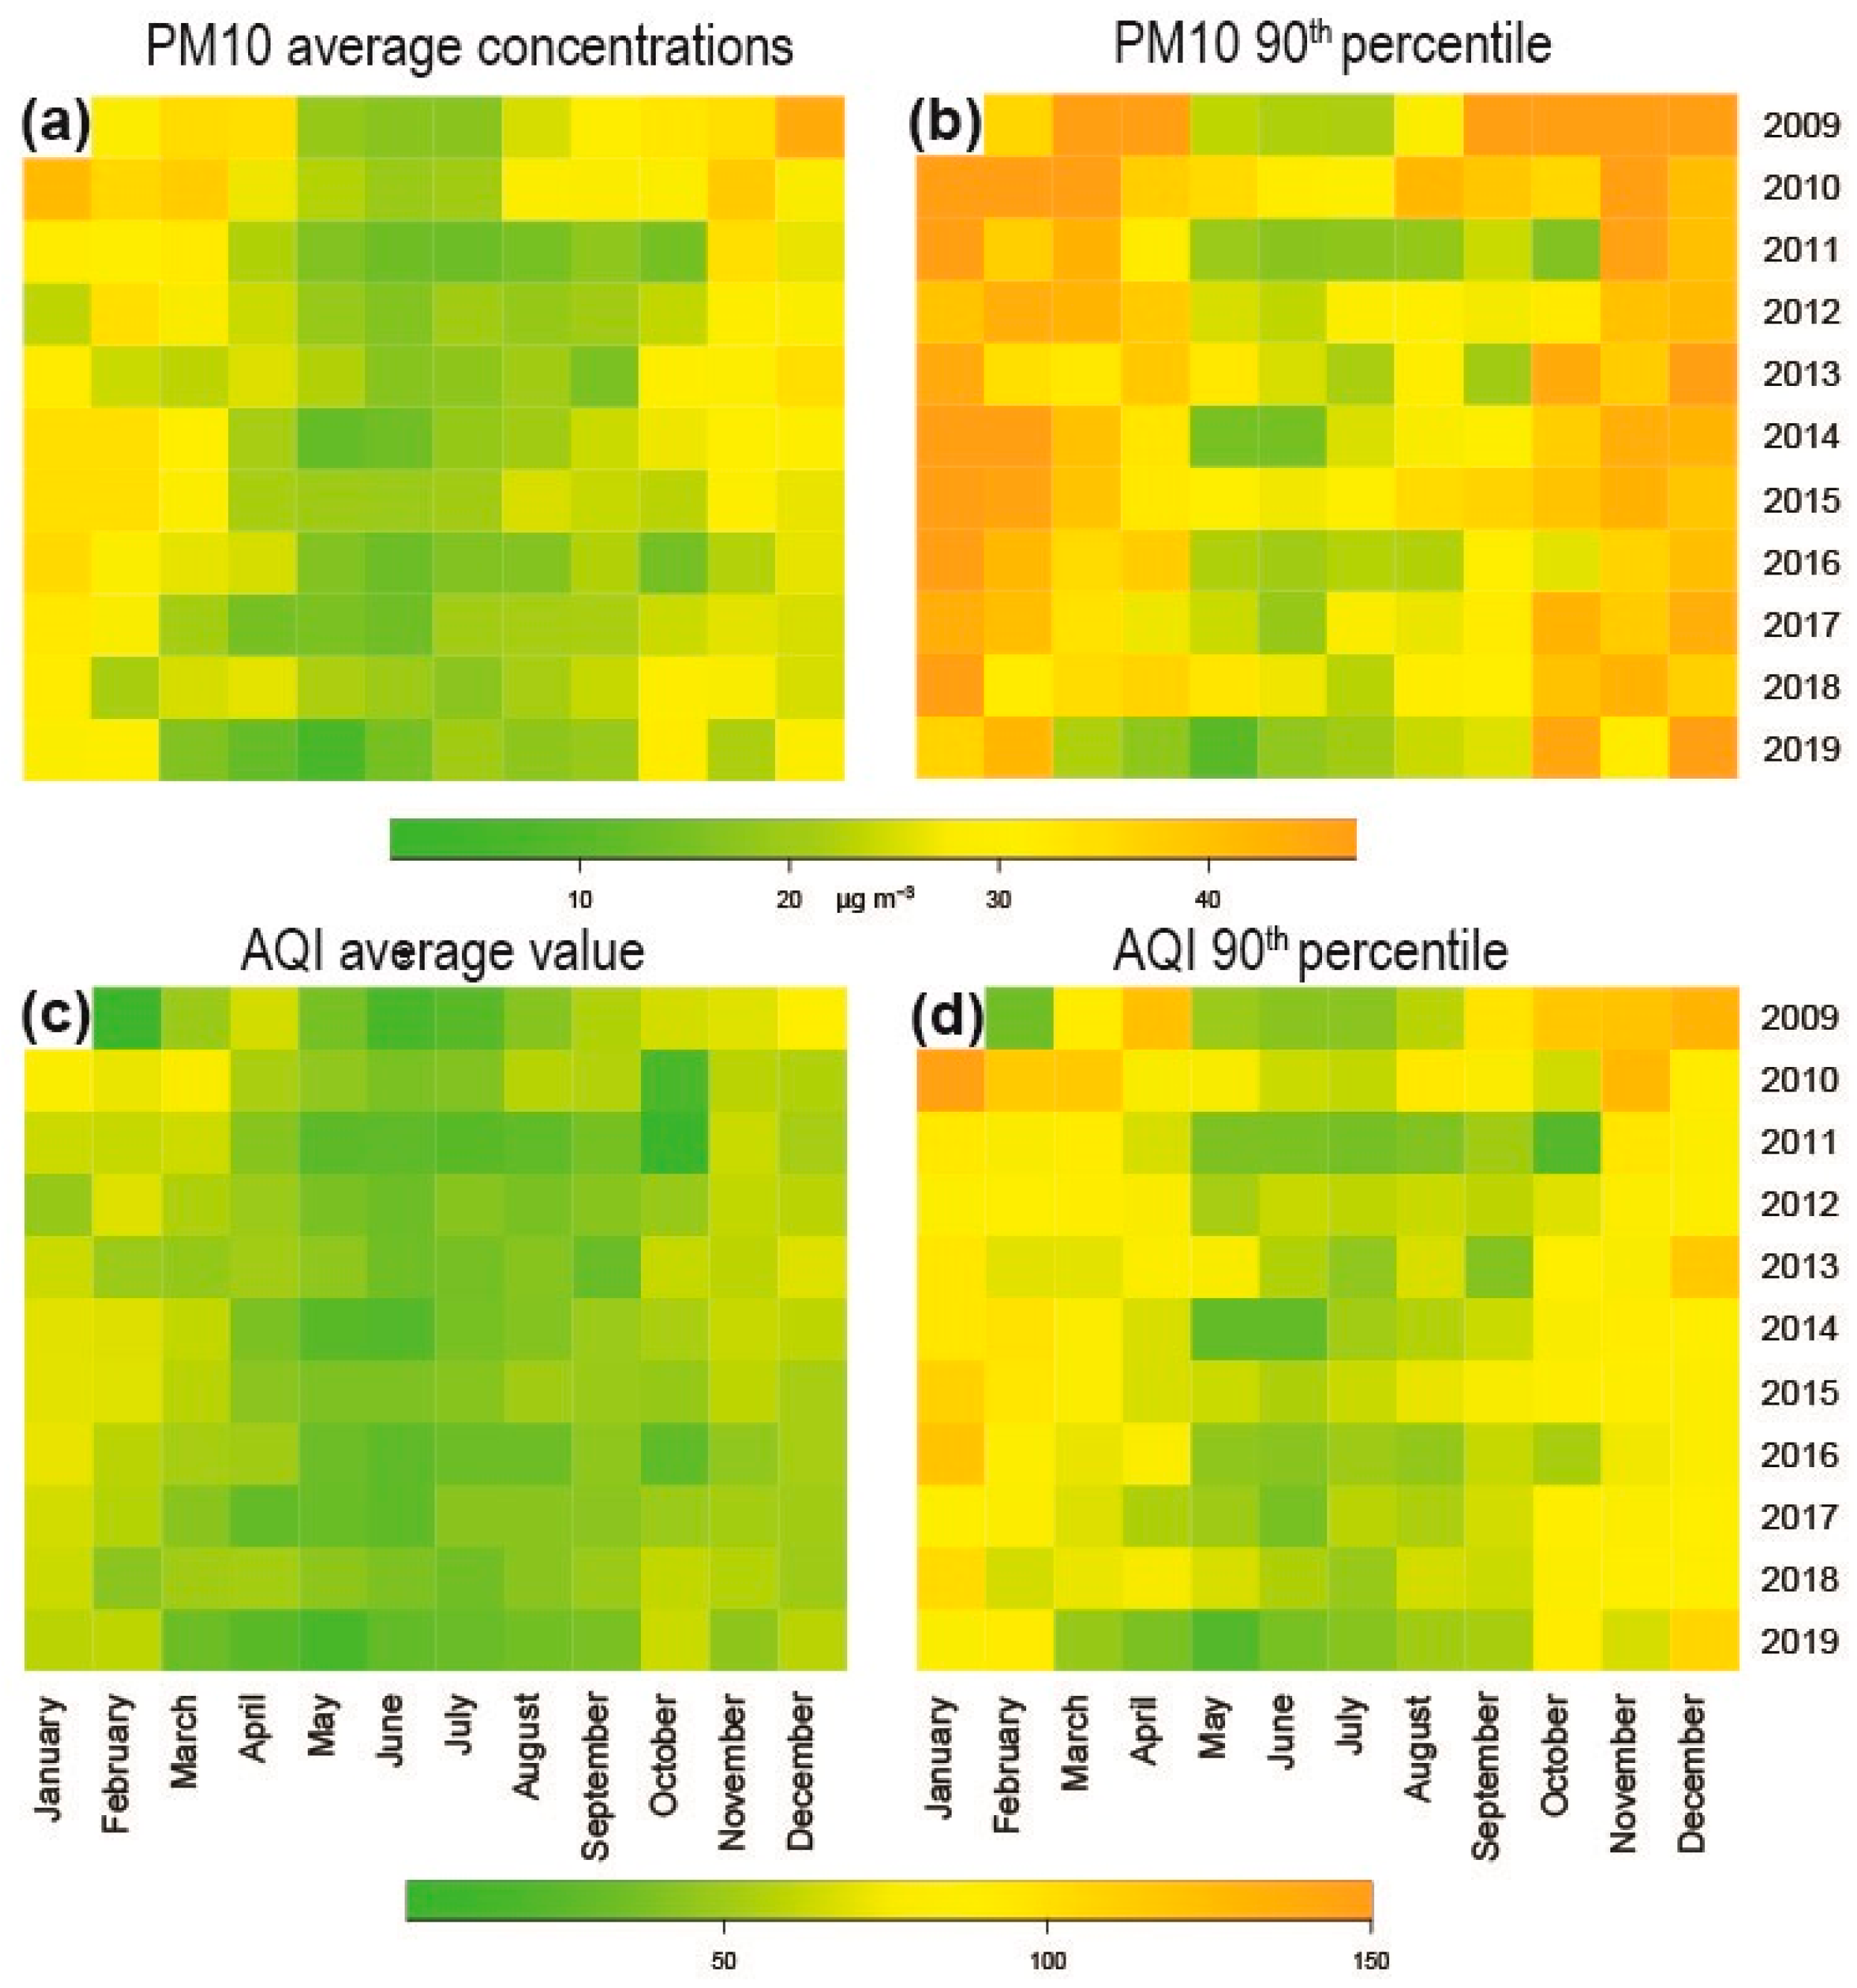
3.1. Air Quality

The basic statistics for PM10 for the period 2009–2019, calculated based on the daily values of the operational monitoring stations, are presented in Table 1. The annual average, calculated based on daily values, ranged between 20.3 and 29.5 µg/m3, this being below the annual limit value set by the EU legislation (40 µg/m3), but above the AQG set by the WHO (20 µg/m3) [4,29].
The highest annual maximum was measured in 2010 (111 µg/m3), while the lowest annual maximum in 2012 (54.8 µg/m3). During the monitoring period, the annual average concentration was comparable, ranging between 20.3 and 29.5 µg/m3, but the annual maximum almost halved from 111 µg/m3 in 2010 to 62.6 µg/m3 in 2019. The difference between the average and median annual PM10 value decreased from 2009 to 2019, indicating a reduction of the days with high PM10 values in favor of days with low PM10 values. The positive skewness of the data also confirms this decrease. Highly skewed data were obtained for 2009, 2010 and 2019, the years that also have the highest numbers of days with PM10 exceeding the daily limit value. The daily maximum PM10 threshold value (50 µg/m3) was not exceeded more than 35 times in the studied years. The highest number (29) of breaches occurred in 2009, of which 20 breaches occurred during October–December. With few exceptions, in each year, the majority of breaches occurred between October and March.
The observed decreasing trend could be explained by the existence of some pollution reduction measures related to traffic restriction in the city center, and to the decrease of emissions from domestic heating following the increase in ambient temperatures and reduction of the number of frost days in Cluj-Napoca during the winters. Temperature fluctuation is the main factor that favors the increase in PM10 concentrations, while the wind speed influences the dispersion of pollutants (Figure 2). Both temperature (r = −0.68) and wind speed (r = −0.44) are negatively correlated with the PM10 concentration. The highest monthly average wind speed was recorded in spring (4.51 m/s), while the lowest monthly average wind speed was recorded in December (3.13 m/s). Generally, the highest PM10 concentrations were recorded when the average monthly temperature was below 0 °C and the intensity of wind was low.
The heavy traffic from the city center was redirected to the city outskirts, starting in 2011, when the ring road became functional. The decrease in traffic was noticed, especially at the CJ-1 traffic station, where a constant reduction in PM10 concentrations was recorded. In CJ-1, the PM10 levels decreased from 38.6 µg/m3 in 2009 to 32.1 µg/m3 in 2019. A constant decrease was also remarked at the CJ-4 industrial station, where the annual average concentrations reduced from 28.4 µg/m3 in 2009 to 15.7 µg/m3 in 2019; a possible explanation could be the decrease in economic activities after the 2008 recession.
The monthly PM10 (Figure 3a) was the highest in December 2009 (44.4 µg/m3) and the lowest in May 2019 (7.4 µg/m3). Generally, the monthly PM10 concentrations were higher in the cold seasons than in the warm seasons. A possible explanation for high PM10 levels in winter could be the accumulation of PM in the low atmosphere due to the reduction of mixing layer thickness, determined by meteorological conditions. Household heating and the use of solid road deicing products during winter could also have increased the PM10 emissions [1]. Both the maximum and the 90th percentile of monthly PM10 (Figure 3b) showed decreasing trends, confirming the lowering of the value and frequency of high concentrations. In the case of the 90th percentile, the higher values were measured between October and March, and a decreasing trend in monthly PM10 from 2009 to 2019 was observed.
To assess the spatial variability of PM10 concentration in Cluj-Napoca, the average PM10 for each monitoring station was calculated for the periods in which all four stations functioned. The average PM10 concentrations were comparable for the CJ-2 (urban) and CJ-3 (suburban) stations, with values of 26.8 µg/m3 and 26.7 µg/m3, respectively. These values were almost two times higher than the average PM10 concentrations found for the CJ-1 (traffic, 13.6 µg/m3) and CJ-4 (industrial, 15.1 µg/m3) stations. The low PM10 values were measured by the industrial and traffic background stations, which confirms that industry and traffic are responsible for a lower share of PM10 pollution than the other urban pollution sources, such as heating and constructions/demolitions.
The obtained annual PM10 values were comparable to those reported by Kassomenos et al. (2014) in London (26–44 µg/m3), Athens (23–51 µg/m3) and Madrid (29–39 µg/m3) [31]. Slightly lower PM10 multiannual (2000–2006) average values were obtained by Pascal et al. (2014) in nine French cities [35]. The PM10 values measured in Cluj-Napoca were lower than those from Bucharest [48,49].
The average monthly AQI (Figure 3c) ranged between 15 (May 2019) and 87 (December 2009), indicating good to moderate air quality. However, the 90th percentile (Figure 3d) ranged between 22 (May 2019) and 147 (January 2010), indicating that there were months when the air quality was unhealthy for sensitive population groups. Similar to the PM10 values, good air quality was found in the warm months, the air quality decreasing in the cold months. Furthermore, an air quality improvement from 2009 to 2019 was observed, especially for the cold months. The number of months with average AQI above 50 decreased from eight months in 2010 to four months in 2019, while instances of 90th percentile of AQI above 100 were identified in four months in 2010, but in only one month between 2011 and the present.
The high PM10 levels reported all over Europe indicate that despite the progress made toward meeting the air quality standards, air pollution is still a critical issue. Even though Cluj-Napoca is not included in the top most polluted cities across Europe, there are still concerns about the air quality, especially during the cold season. In order to reduce the health risk associated with air pollution, effective air quality policies and tailored pollution abatement measures are needed, especially in cases of high urban agglomerations. In urban areas, most of the measures address the transport sector by encouraging the use of public transport or low pollution vehicles, such as electric cars or bicycles, and by limiting heavy vehicles’ access to the city center and enhancing road infrastructures. The reduction of waste burning together with the shift towards low emission fuel-use for residential heating, along with emission-control and -law enforcing, could further reduce PM10 emissions.

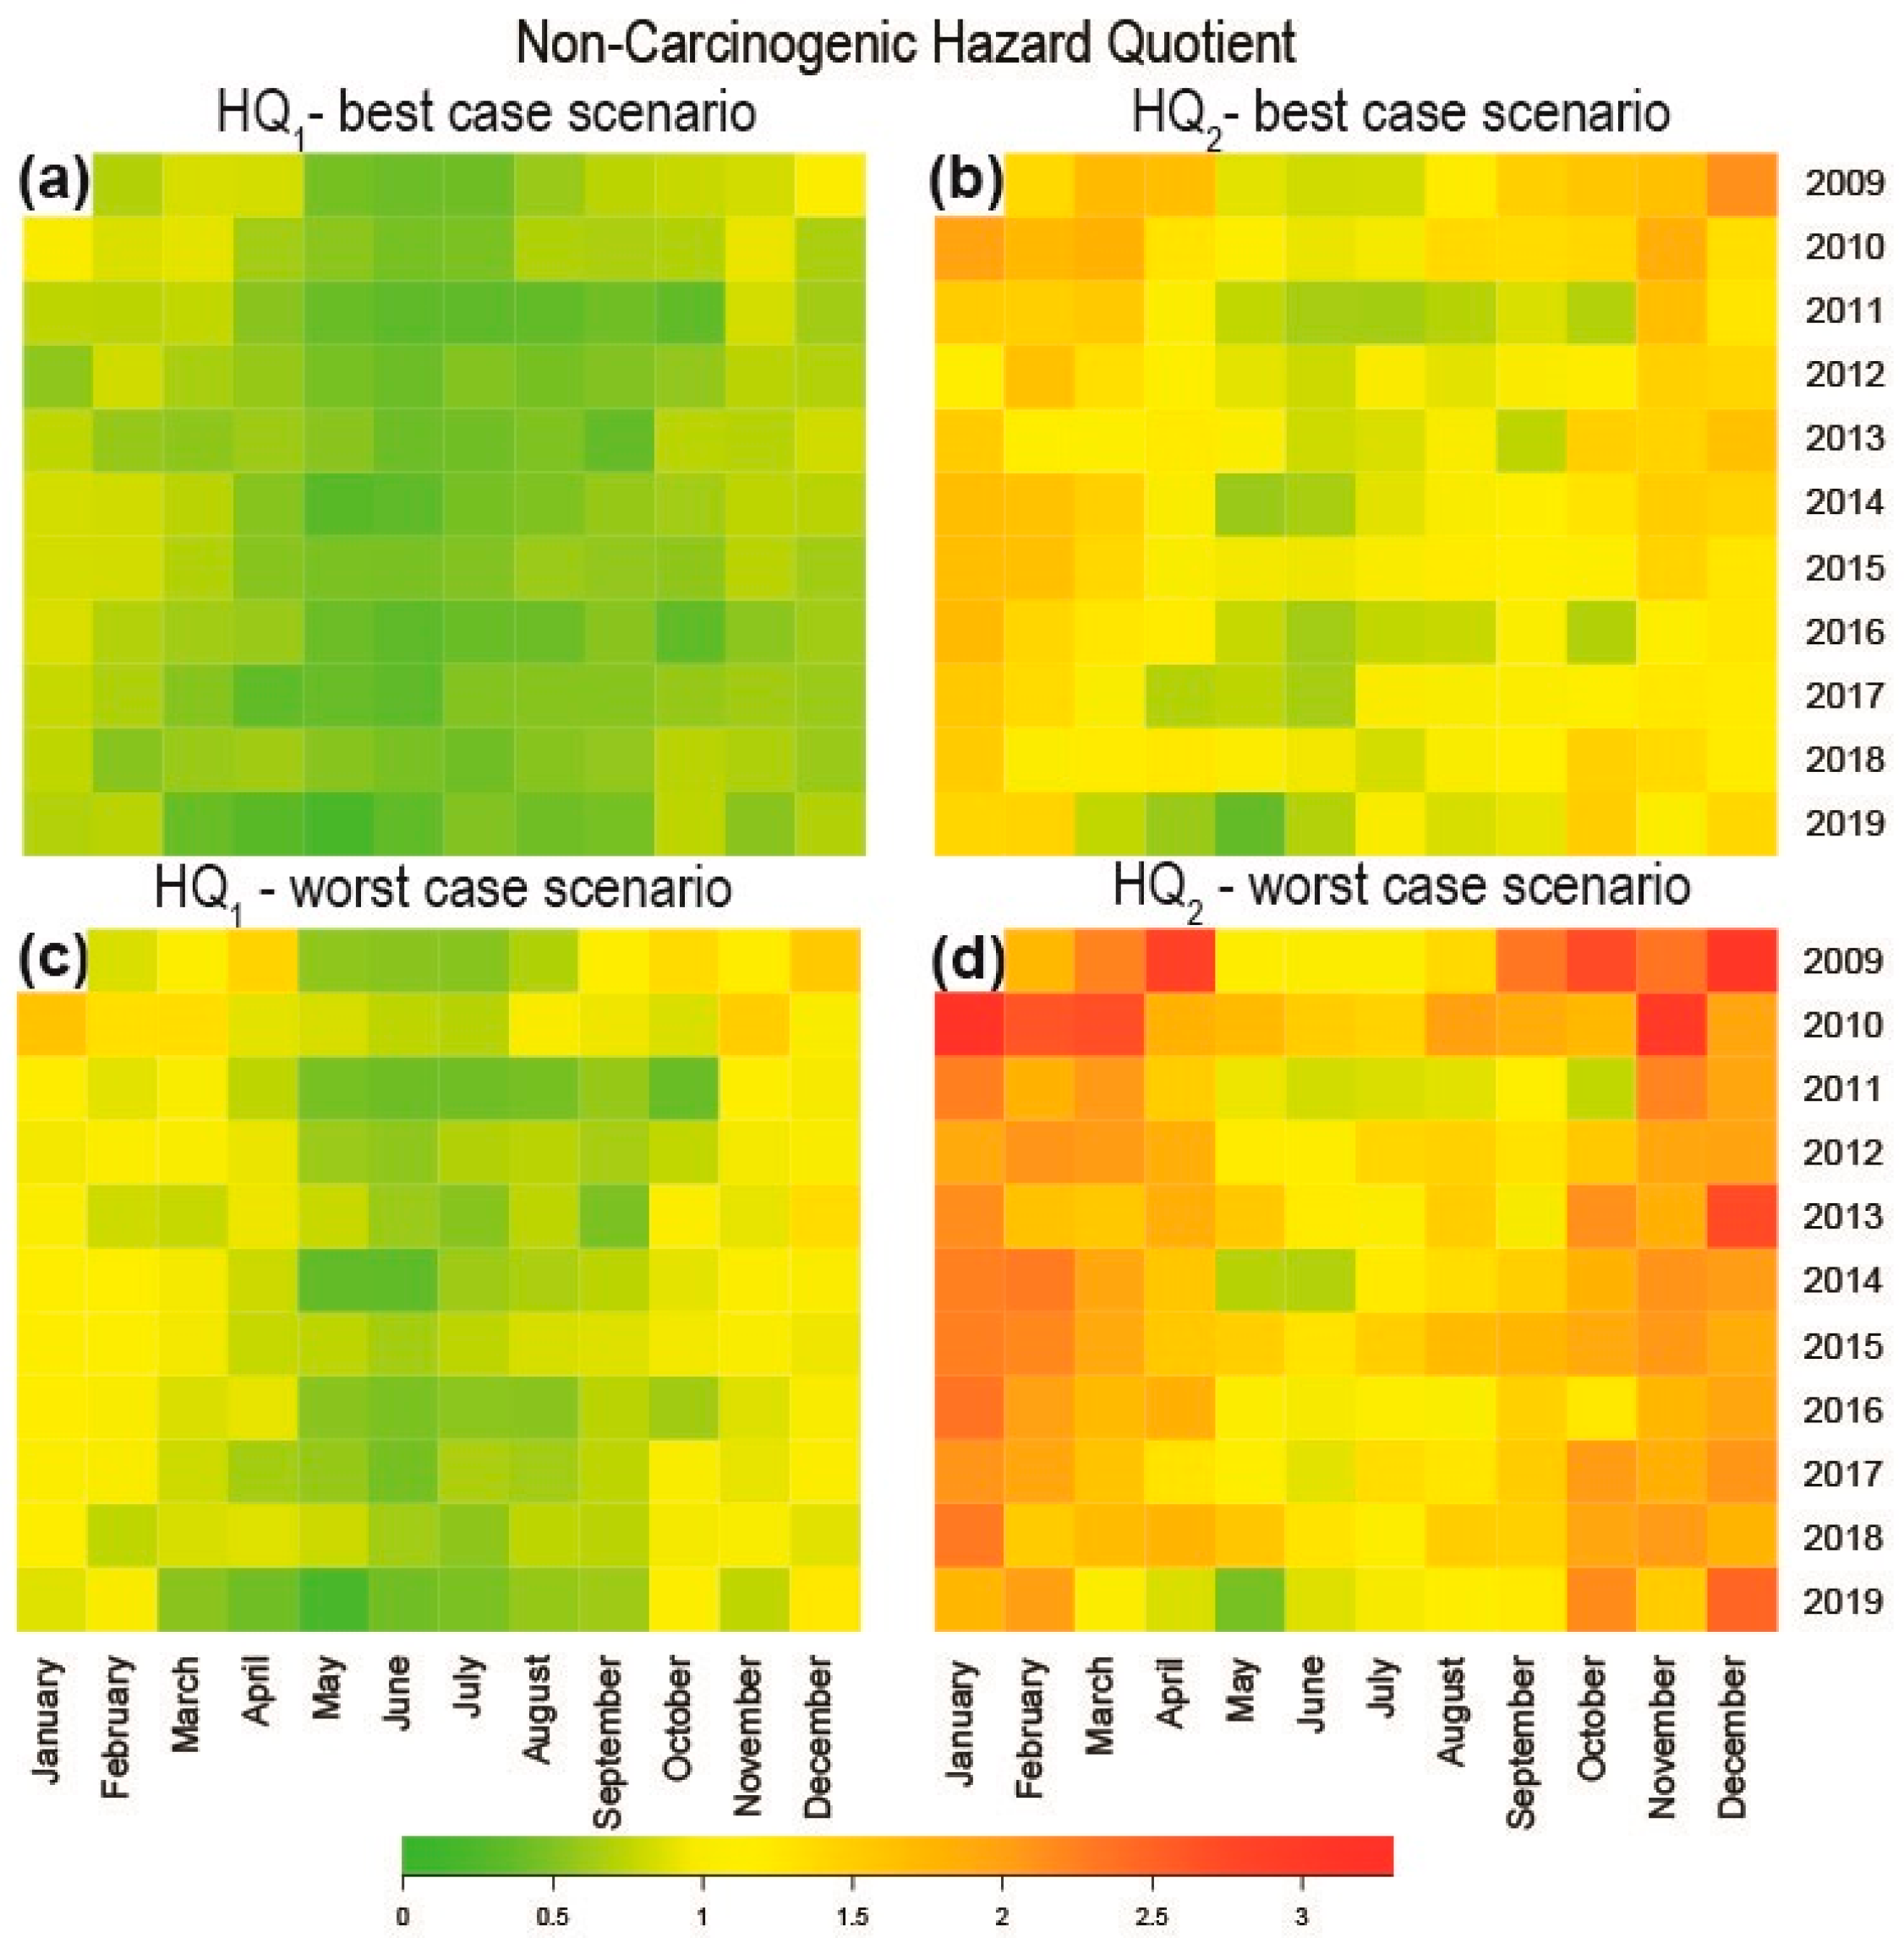
3.2. Human Health Risk Assessment

The exposure concentrations (EC) for the study periods, calculated based on monthly average PM10 concentration, ranged from 7.1 µg/m3 (May 2019) to 44.7 µg/m3 (December 2009), while the EC calculated based on monthly 90th percentile of PM10 ranged from 9.3 µg/m3 (May 2019) to 64.2 µg/m3 (January 2010). This data shows that the EC gradually decreased from 2010 to 2019.
The non-carcinogenic chronic HQ1 calculated based on the EU limit value obtained for the residential best-case scenario ranged between 0.2 and 1.1 in all studied years, indicating potential non-carcinogenic chronic health risk in the first years of the study (2009 and 2010), and no health risks for the other study years (2011–2019). However, for the worst-case scenario, the HQ1 values were higher (0.2–1.6), with monthly peaks with values above the safety benchmark being found in each year. The monthly variation of HQ1 in the best-case (Figure 4a) and worst-case scenarios (Figure 4c) was similar to that in the PM10 concentration, being higher in the cold months than in the warm months. In the best-case scenario, non-carcinogenic health risk was identified only in December 2009, while in the worst-case scenario, non-carcinogenic health risk was identified in each year, mainly in the winter seasons. In both exposure scenarios, over the years, a clear decreasing trend from 2009 to 2019 was observed.
The non-carcinogenic chronic HQ2 calculated based on the WHO AQG obtained for the best-case scenario ranged between 0.4 and 2.1 in all studied years, indicating a potential non-carcinogenic chronic health risk between October and March in each year, while for the worst-case scenario, the HQ2 values were higher (0.5–3.2), exceeding the security benchmark in most of the months. The monthly HQ2 values, both in the best-case (Figure 4b) and worst-case scenarios (Figure 4d), were higher in the cold months than in the warm months, but slightly decreased from 2009 up to the present, without frequently falling below the security benchmark, indicating a non-carcinogenic risk for almost the whole period. The high HQ values suggest that environmental PM10 levels, although below the legislative thresholds, are likely to induce various chronic pathologies.
The differences between the human health risk measurements from the air quality monitoring stations for the period 2009–2019, in Cluj-Napoca city, were observed both for the best-case and worst-case scenarios (Figure 5). Thus, HQ1 values, calculated based on the EU limit values, did not exceeded the unity threshold at any of the monitoring sites, suggesting no potential health risk, but they were higher at the urban (CJ-1) and suburban (CJ-3) background monitoring stations than at the traffic (CJ-1) and industrial (CJ-4) stations. Similarly, in the case of HQ2, the health risk was higher at the urban and suburban stations than at those monitoring the traffic and industrial background, but in this case potential non-carcinogenic risk might possibly appear. A similar pattern was observed for the worst-case scenario, both for HQ1 and HQ2 when the unity threshold was above 1, indicating the presence of potential non-carcinogenic risk.
Similar to Cluj-Napoca, a non-carcinogenic risk associated with PM10 exposure was reported in Krakow, Poland and Shanghai, China [10,50]. Opposite to Cluj-Napoca, no human health risk associated with exposure to PM10 for the general population, and a low risk for the sensitive population groups, were found for Pretoria West, South Africa [51].
Generally, during the warm months, the average HQ1 and HQ2 values were more or less constant, while during the cold months they varied widely. The obtained data suggest that, under the best-case scenario, presently, the inhabitants of Cluj-Napoca are unlikely to develop adverse health effects after PM10 exposure. However, in the worst-case scenario, the occurrence of adverse chronic health effects is still possible. The cumulative effects of PM10 with other air pollutants could increase the probability of manifesting adverse chronic non-carcinogenic health effects, although the additivity or synergism of the air pollutants is not clearly elucidated, and is influenced by the meteorological conditions [52,53,54]. A possible mitigation measure could be the reduction in the hours spent in urban environments with high levels of PM10 or other pollutants, and an increase in time spent in clean outdoor environments such as parks and green areas.
The obtained results highlighted the contribution of local meteorology and winter sources to the PM10 concentration. Although the PM10 concentrations for Cluj-Napoca city generally did not exceed air quality standards, this study reveals that the human health risks resulting from exposure to air pollution are still possible. The health risk assessment method used in this study has a number of limitations, some of which are due to the fact that this approach focuses only on PM10 without considering simultaneous exposure to other air pollutants, and thus underestimates the risk. The interactions between different pollutants were also neglected. The non-carcinogenic health risk was calculated based on several assumptions regarding the exposure time, exposure frequency and exposure duration that are not specific for the studied population, and neglects the different behaviors of individuals inside the studied population. Furthermore, we assumed that the average daily PM10 concentrations measured by the for air quality monitoring stations are representative for the whole city. Despite these limitations, the findings may contribute to a better understanding of the potential health risks associated with human exposure to PM10 in urban areas, providing valuable information for air quality managers and specialists. The next steps should include sources apportionment and the assessment of their contribution to PM10 concentration, as well as assessing the carcinogenic human health risk of toxic compounds associated with PM10.

4. Conclusions

The average annual PM10 level in Cluj-Napoca city, ranging between 20.3 and 29.5 µg/m3, was below the legislative threshold, and had a decreasing trend from 2009 to 2019, while the annual maximum almost halved from 111 µg/m3 (2010) to 62.6 µg/m3 (2019). Generally, the monthly PM10 concentrations were higher in the cold seasons compared with the warm seasons. The average monthly AQI ranged between 15 (May 2019) and 87 (December 2009), indicating good to moderate air quality. However, the 90th percentile indicated several months when the air quality was unhealthy for sensitive population groups. The non-carcinogenic chronic risk, calculated based on the EU limit value, obtained for the best-case scenario ranged between 0.2 and 1.1, indicating potential non-carcinogenic chronic health risk for 2009 and 2010, and no health risks for 2011–2019, while for the worst-case scenario, monthly values above the safety benchmark were found in each year. The non-carcinogenic chronic risk calculated based on the WHO AQG for the best-case scenario was higher, indicating a potential non-carcinogenic chronic health risk between October and March in each year, while for the worst-case scenario this exceeded the security benchmark in most of the months. The decreasing trend of the HQ values in the last decade could indicate the existence of air quality improvement measures; however, the implementation of more mitigation measures could further reduce the health risk, especially in the case of sensitive population groups. The measures must mainly target heating systems, taking into account the high concentrations of PM10 during the winter, and in particular the type of fuel and its quality.

Author Contributions

L.L., A.O. and O.C. designed the study; L.L., M.-A.H., M.R., C.M., E.A.L., L.M. and O.C. performed data analysis and interpretation; L.L., M.-A.H., L.M., E.A.L. and O.C. wrote the paper. All authors have read and agreed to the published version of the manuscript.

Funding

The Competitiveness Operational Programme of the Ministry of European Funds, code MY SMIS 107874 funded this research. The APC was funded by the Romanian Research and Innovation Ministry, grant number 19PFE/2018 PROINSTITUTIO.

Conflicts of Interest

The authors declare no conflict of interest. The funders had no role in the design of the study; in the collection, analyses, or interpretation of data; in the writing of the manuscript, or in the decision to publish the results.

References

  1. Malandrino, M.; Di Martino, M.; Ghiotti, G.; Geobaldo, F.; Grosa, M.M.; Giacomino, A. Abollino OInter-annual seasonal variability in PM10 samples monitored in the city of Turin (Italy) from 2002 to, 2005. Microchem. J. 2013, 107, 76–85. [Google Scholar] [CrossRef]
  2. Zhong, S.; Yu, Z.; Zhu, W. Study of the effects of air pollutants on human health based on Baidu indices of disease symptoms and air quality monitoring data in Beijing, China. Int. J. Environ. Res. Public Health 2019, 16, 1014. [Google Scholar] [CrossRef] [Green Version]
  3. Hassanvand, M.S.; Naddafi, K.; Faridi, S.; Sowlat, M.H.; Momeniha, F.; Gholampour, A.; Arhami, M.; Kashani, H.; Zare, A.; Niazi, S.; et al. Characterization of PAHs and metals in indoor/outdoor PM10/PM2.5/PM1 in a retirement home and a school dormitory. Sci. Total Environ. 2015, 527, 100–110. [Google Scholar] [CrossRef]
  4. EEA (European Environment Agency). Air Quality in Europe—2019 Report European Environment Agency; Publications Office of the European Union: Luxembourg, 2019; Available online: https://www.eea.europa.eu/publications/air-quality-in-europe-2019 (accessed on 2 July 2020).
  5. Henschel, S.; Chan, G. Health Risks of Air Pollution in Europe, HRAPIE Project: New Emerging Risks to Health from Air Pollution—Results from the Survey of Experts; World Health Organization, Regional Office for Europe: Copenhagen, Denmark, 2013; Available online: http://www.euro.who.int/__data/assets/pdf_file/0017/234026/e96933.pdf?ua=1 (accessed on 3 July 2020).
  6. Hoffer, A.; Jancsek-Turóczi, B.; Tóth, Á.; Kiss, G.; Naghiu, A.; Levei, E.A.; Marmureanu, L.; Machon, A.; Gelencsér, A. Emission factors for PM10 and PAHs from illegal burning of different types of municipal waste in households. Atmos. Chem. Phys. Discuss. 2020, 1–18. [Google Scholar] [CrossRef]
  7. Air Pollutant Emissions Data Viewer (Gothenburg Protocol, LRTAP Convention) 1990–2017. Available online: https://www.eea.europa.eu/data-and-maps/dashboards/air-pollutant-emissions-data-viewer-2 (accessed on 30 June 2020).
  8. Belis, C.A.; Larsen, B.; Fulvio, A.; El Haddad, I.; Favez, O.; Harrison, R.M.; Hopke, P.; Nava, S.; Paatero, P.; Prevot, A.; et al. European Guide on with Receptor Models Air Pollution Source Apportionment; Joint Research Centre of the European Commission: Luxemburg, 2014; pp. 1–88. [Google Scholar]
  9. Marmureanu, L.; Vasilescu, J.; Slowik, J.; Prevot, A.S.H.; Marin, C.A.; Antonescu, B.; Vlachou, A.; Nemuc, A.; Dandocsi, A.; Szidat, S. Online chemical characterization and source identification of summer and winter aerosols in Magurele, Romania. Atmosphere 2020, 11, 385. [Google Scholar] [CrossRef] [Green Version]
  10. Gruszecka-Kosowska, A. Assessment of the Krakow inhabitants’ health risk caused by the exposure to inhalation of outdoor air contaminants. Stoch. Environ. Res. Risk Assess. 2018, 32, 485–499. [Google Scholar] [CrossRef] [Green Version]
  11. Khaniabadi, Y.O.; Polosa, R.; Chuturkova, R.Z.; Daryanoosh, M.; Goudarzi, G.; Borgini, A.; Tittarelli, A.; Basiri, H.; Armin, H.; Nourmoradi, H.; et al. Human health risk assessment due to ambient PM10 and SO2 by an air quality modeling technique. Process. Saf. Environ. 2017, 111, 346–354. [Google Scholar] [CrossRef]
  12. Kelly, F.J.; Fussell, J.C. Size, source and chemical composition as determinants of toxicity attributable to ambient particulate matter. Atmos. Environ. 2012, 60, 504–526. [Google Scholar] [CrossRef]
  13. Dehghani, M.; Keshtgar, L.; Javaheri, M.R.; Derakhshan, Z.; Oliveri Conti, G.; Zuccarello, P.; Ferrante, M. The effects of air pollutants on the mortality rate of lung cancer and leukemia. Mol. Med. Rep. 2017, 15, 3390–3397. [Google Scholar] [CrossRef] [PubMed] [Green Version]
  14. Khaniabadi, Y.O.; Goudarzi, G.; Daryanoosh, S.M.; Borgini, A.; Tittarelli, A.; De Marco, A. Exposure to PM10, NO2, and O3 and impacts on human health. Environ. Sci. Pollut. Res. 2017, 24, 2781–2789. [Google Scholar] [CrossRef] [PubMed]
  15. De Donno, A.; De Giorgi, M.; Bagordo, F.; Grassi, T.; Idolo, A.; Serios, F.; Ceretti, E.; Ferretti, D.; Villarini, M.; Moretti, M.; et al. Health risk associated with exposure to PM10 and benzene in three Italian towns. Int. J. Environ. Res. Public Health 2018, 15, 1672. [Google Scholar] [CrossRef] [PubMed] [Green Version]
  16. Kliengchuay, W.; Cooper Meeyai, A.; Worakhunpiset, S.; Tantrakarnapa, K. Relationships between meteorological parameters and particulate matter in Mae Hong Son Province. Thailand. Int. J. Environ. Res. Public Health 2018, 15, 2801. [Google Scholar] [CrossRef] [PubMed] [Green Version]
  17. Pope, C.A.; Ezzati, M.; Dockery, D.W. Fine-particulate air pollution and life expectancy in the United States. N. Engl. J. Med. 2009, 360, 376–386. [Google Scholar] [CrossRef] [PubMed] [Green Version]
  18. Chalvatzaki, E.; Chatoutsidou, S.E.; Lehtomaki, H.; Almeida, S.M.; Eleftheriadis, K.; Hanninen, O.; Lazaridis, M. Characterization of human health risks from particulate air pollution in selected European cities. Atmosphere 2019, 10, 96. [Google Scholar] [CrossRef] [Green Version]
  19. Yin, F.; Ma, Y.; Zhao, X.; Lv, Q.; Liu, Y.; Li, X.; Zhang, T. Analysis of the effect of PM10 on hand, foot and mouth disease in a basin terrain city. Sci. Rep. 2019, 98, 3233. [Google Scholar] [CrossRef] [Green Version]
  20. Riojas-Rodriguez, H.; Alamo-Hernandez, U.; Texcalac-Sangrador, J.L.; Romieu, I. Health impact assessment of decreases in PM10 and ozone concentrations in the Mexico City metropolitan area. A basis for a new air quality management program. Salud. Publica Mex. 2014, 56, 579–591. [Google Scholar] [CrossRef]
  21. Romanazzi, V.; Casazza, M.; Malandrino, M.; Maurino, V.; Piano, A.; Schiliro, T.G.; Gilli, G. PM10 size distribution of metals and environmental-sanitary risk analysis in the city of Torino. Chemosphere 2014, 112, 210–216. [Google Scholar] [CrossRef] [Green Version]
  22. Vaduganathan, M.; De Palma, G.; Manerba, A.; Goldoni, M.; Triggiani, M.; Apostoli, P.; Cas, L.D.; Nodari, S. Risk of cardiovascular hospitalizations from exposure to coarse particulate matter (PM10) below the European Union safety threshold. Am. J. Cardiol. 2016, 117, 123–135. [Google Scholar] [CrossRef]
  23. European Parliament, Council of the European Union. Directive 2008/50/EC of the European Parliament and of the Council of 21 May 2008 on ambient air quality and cleaner air for Europe. Off. J. Eur. Union 2008, L152, 1–44. Available online: https://eur-lex.europa.eu/legal-content/en/ALL/?uri=CELEX%3A32008L0050 (accessed on 18 June 2020).
  24. Outdoor Air Pollution, IARC Monographs on the Evaluation of Carcinogenic Risks to Humans; No. 109, ARC Working Group on the Evaluation of Carcinogenic Risk to Humans; International Agency for Research on Cancer, WHO Press: Lyon, France, 2016; Available online: https://publications.iarc.fr/Book-And-Report-Series/Iarc-Monographs-On-The-Identification-Of-Carcinogenic-Hazards-To-Humans/Outdoor-Air-Pollution-2015 (accessed on 2 June 2020).
  25. Kan, H.; London, S.J.; Chen, G.; Zhang, Y.; Song, G.; Zhao, N.; Jiang, L.; Chen, B. Season, sex, age, and education as modifiers of the effects of outdoor air pollution on daily mortality in Shanghai, China: The Public Health and Air Pollution in Asia (PAPA) Study. Environ. Health Perspect. 2008, 116, 1183–1188. [Google Scholar] [CrossRef]
  26. US Environmental Protection Agency. Risk Assessment Guidance for Superfund Volume I, Human Health Evaluation Manual, Part F, Supplement Guidance for Inhalation Risk Assessment; Office of Emergency and Remedial Response: Washington, DC, USA, 2011. Available online: https://www.epa.gov/sites/production/files/2015-09/documents/partf_200901_final.pdf (accessed on 2 June 2020).
  27. Air Quality in Europe-2018 Report. Available online: https://op.europa.eu/en/publication-detail/-/publication/223e663b-1340-11e9-81b4-01aa75ed71a1 (accessed on 4 June 2020).
  28. Romania-Air Pollution Country Fact Sheet. Available online: https://www.eea.europa.eu/themes/air/country-fact-sheets/2019-country-fact-sheets/romania (accessed on 23 June 2020).
  29. Law 104 from 15 June 2011, Regarding the Environmental Air Quality. Official Monitor, No. 452 from 28 June 2011. Available online: http://www.calitateaer.ro/export/sites/default/.galleries/Legislation/national/Lege-nr.-104_2011-calitatea-aerului-inconjurator.pdf_2063068895.pdf (accessed on 2 June 2020).
  30. Hu, X.; Zhang, Y.; Ding, Z.H.; Wang, T.; Lian, H.; Sun, Y.; Wu, J. Bio-accessibility and health risk of arsenic and heavy metals (Cd, Co, Cr, Cu, Ni, Pb, Zn and Mn) in TSP and PM2.5 in Nanjing, China. Atmos. Environ. 2012, 57, 146–152. [Google Scholar] [CrossRef]
  31. Kassomenos, P.A.; Vardoulakis, S.; Chaloulakou, A.; Paschalidou, A.K.; Grivas, G.; Borge, R.; Lumbreras, J. Study of PM10 and PM2.5 levels in three European cities: Analysis of intra and inter urban variations. Atmos. Environ. 2014, 87, 153–163. [Google Scholar] [CrossRef] [Green Version]
  32. Xie, Y.; Zhao, B.; Zhang, L.; Luo, R. Department spatiotemporal variations of PM2.5 and PM10 concentrations between 31 Chinese cities and their relationships with SO2, NO2, CO and O3. Particuology 2015, 20, 141–149. [Google Scholar] [CrossRef]
  33. Madureira, J.; Paciencia, I.; Cavaleiro Rufo, J.; Severo, M.; Ramos, E.; Barros, H.; De Oliveira Fernandes, E. Source apportionment of CO2, PM10 and VOCs levels and health risk assessment in naturally ventilated primary schools in Porto, Portugal. Build. Environ. 2016, 96, 198–205. [Google Scholar] [CrossRef] [Green Version]
  34. Rumana, H.S.; Sharma, R.C.; Beniwal, V.; Sharma, A.K. A retrospective approach to assess human health risks associated with growing air pollution in urbanized area of Thar Desert, western Rajasthan, India. J. Environ. Health Sci. 2014, 12, 23–32. [Google Scholar] [CrossRef] [Green Version]
  35. Pascal, M.; Falq, G.; Wagner, V.; Chatignoux, E.; Corso, M.; Blanchard, M.; Host, S.; Pascal, L.; Larrieu, S. A short-term impact of particulate matter (PM10, PM10-2.5, PM2.5) on mortality in nine French cities. Atmos. Environ. 2014, 95, 175–184. [Google Scholar] [CrossRef]
  36. Maji, K.J.; Dikshit, A.K.; Deshpande, A. Human health risk assessment due to air pollution in 10 urban cities in Maharashtra India. Cogent Environ. Sci. 2016, 2, 1193110. [Google Scholar]
  37. Bulejko, P.; Adamec, V.; Skeril, R.; Schüllerová, B.; Bencko, V. Levels health risk assessment of PM10 aerosol in Brno Czech Republic. Cent. Eur. J. Public Health 2017, 25, 129–134. [Google Scholar] [CrossRef]
  38. Megido, L.; Suarez-Pena, B.; Negral, L.; Castrillon, L.; Fernandez-Nava, Y. Suburban air quality: Human health hazard assessment of potentially toxic elements in PM10. Chemosphere 2017, 177, 284–291. [Google Scholar] [CrossRef]
  39. Leitte, A.M.; Petrescu, C.; Franck, U.; Richter, M.; Suciu, O.; Ionovici, R.; Herbarth, O.; Schlink, U. Respiratory health effects of ambient air pollution its modification by air humidity in Drobeta-Turnu Severin Romania. Sci. Total Environ. 2009, 407, 4004–4011. [Google Scholar] [CrossRef]
  40. Dunea, D.; Iordache, S.; Liu, H.Y.; Bøhler, T.; Pohoata, A.; Radulescu, C. Quantifying the impact of, P.M.2.5.; associated heavy metals on respiratory health of children near metallurgical facilities. Environ. Sci. Pollut. Res. 2016, 23, 15395–15406. [Google Scholar] [CrossRef] [PubMed] [Green Version]
  41. National Institute of Statistics and the Statistical Division of the Cluj County. Available online: http://www.cluj.insse.ro/produse-si-servicii/statistici-judetene/populatia/ (accessed on 5 June 2020).
  42. Geicu, A.; Candea, I. Clima Romaniei (The Climate of Romania), Romanian National Meteorological Administration; Romanian Academy Press: Bucharest, Romania, 2008. [Google Scholar]
  43. Planul integrat de calitate a aerului pentru aglomerarea Cluj-Napoca pentru indicatorii oxizi de azot (NOx/NO2) și particule in suspensie (PM10) perioada 2019–2023, Primaria Cluj-Napoca. Available online: https://files.primariaclujnapoca.ro/2019/05/23/Plan-Integrat-de-calitate-a-aerului-pentru-aglomerarea-Cluj-Napoca.pdf (accessed on 16 June 2020).
  44. Air Quality. National Air Quality Monitoring Network. Available online: http://www.calitateaer.ro/public/monitoring-page/reports-reports-page/?__locale=en (accessed on 2 June 2020).
  45. Mohan, M.; Kandya, A. An analysis of the annual seasonal trends of Air Quality Index of Delhi. Environ. Monit. Assess. 2007, 131, 267–277. [Google Scholar] [CrossRef] [PubMed]
  46. Iorga, G. Air Quality—Measurement Modeling Air Pollution Monitoring: A Case Study from Romania. In Air Quality-Measurement and Modelling; Sallis, P.J., Ed.; Intech Open: London, UK, 2016; pp. 135–162. [Google Scholar]
  47. Miclean, M.; Cadar, O.; Levei, E.A.; Roman, R.; Ozunu, A.; Levei, L. Metal (Pb, Cu, Cd, and Zn) Transfer along food chain health risk assessment through raw milk consumption from free-range cows. Int. J. Environ. Res. Public Health 2019, 16, 4064. [Google Scholar] [CrossRef] [PubMed] [Green Version]
  48. Proorocu, M.; Odagiu, A.; Oroian, I.G.; Ciuiu, G.; Dan, V. Particulate matter status in Romanian urban areas: PM10 pollution levels in Bucharest. Environ. Eng. Manag. J. 2014, 3, 3115–3122. [Google Scholar] [CrossRef]
  49. Iorga, G.; Balaceanu Raicu, C.; Stefan, S. Annual air pollution level of major primary pollutants in Greater Area of Bucharest. Atmos. Pollut. Res. 2015, 6, 824–834. [Google Scholar]
  50. Zhao, W.; Cheng, J.; Li, D.; Duan, Y.; Wei, H.; Ji, R.; Wang, W. Urban ambient air quality investigation health risk assessment during haze non-haze periods in Shanghai China. Atmos. Pollut. Res. 2013, 4, 275–281. [Google Scholar] [CrossRef] [Green Version]
  51. Morakinyo, O.M.; Adebowale, A.S.; Mokgobu, M.I.; Mukhola, M.S. Health risk of inhalation exposure to sub-10 μm particulate matter gaseous pollutants in an urban-industrial area in South Africa: An ecological study. BMJ Open 2017, 7, e013941. [Google Scholar] [CrossRef]
  52. Stylianou, M.; Nicolich, M.J. Cumulative effects and threshold levels in air pollution mortality: Data analysis of nine large US cities using the NMMAPS dataset. Environ. Pollut. 2009, 157, 2216–2223. [Google Scholar] [CrossRef]
  53. Xia, Y.; Tong, H. Cumulative effects of air pollution on public. Stat. Med. 2006, 25, 3548–3559. [Google Scholar] [CrossRef]
  54. Mauderly, J.L.; Samet, J.M. Is there evidence for synergy among air pollutants in causing health effects. Environ. Health Perspect. 2009, 117, 1–6. [Google Scholar] [CrossRef]
Figure 1. Location of the monitoring stations in Cluj-Napoca city.
Applsci 10 05331 g001
Figure 2. Temporal evolution of PM10, temperature and wind speed in Cluj-Napoca between 2009 and 2019.
Applsci 10 05331 g002
Figure 3. Temporal variation of (a) average of PM10 concentration, (b) 90th percentile of PM10 concentration (μg/m3), (c) average of air quality index (AQI) and (d) 90th percentile of air quality index (AQI) in Cluj-Napoca city for 2009–2019.
Applsci 10 05331 g003
Figure 4. Temporal variation of hazard quotient (HQ) calculated based on EU limit values for best-case (a) and worst-case (b) scenarios, and calculated based on World Health Organization air quality guideline for best-case (c) and worst-case (d) scenarios in Cluj-Napoca city for 2009–2019.
Applsci 10 05331 g004
Figure 5. Variation of hazard quotient (HQ) calculated based on EU limit values (a) and World Health Organization air quality guidelines (b) between the air quality monitoring stations in Cluj-Napoca city.
Applsci 10 05331 g005
Table 1. Basic statistics of the annual PM10 concentrations (μg/m3) in Cluj-Napoca for 2009–2019.
PM1020092010201120122013201420152016201720182019
Minimum2.06.352.75.86.77.07.52.73.27.93.6
Maximum86.8111.359.754.861.665.761.676.656.559.562.2
Average27.429.523.224.024.424.925.722.022.224.420.3
Standard deviation15.914.511.19.810.711.210.110.610.19.410.7
10th percentile9.814.211.412.212.811.814.49.710.413.88.7
50th percentile24.626.819.922.521.322.623.720.421.0422.718.0
90th percentile51.647.640.938.139.240.139.936.538.137.635.3
Skewness1.11.50.80.50.90.60.71.00.70.81.1
Kurtosis0.64.0−0.2−0.60.4−0.20.12.30.170.51.4
Days with PM10 > 50 μg/m32926416653359

