Numerical Study of the Toughness of Complex Metal Matrix Composite Topologies


CNRS UMR 8201—LAMIH—Laboratoire d’Automatique, de Mécanique et d’Informatique Industrielles et Humaines, Univ. Polytechnique Hauts-de-France, F-59313 Valenciennes, France
*
Author to whom correspondence should be addressed.
Appl. Sci. 2020, 10(18), 6250; https://doi.org/10.3390/app10186250
Submission received: 17 July 2020
/
Revised: 2 September 2020
/
Accepted: 7 September 2020
/
Published: 9 September 2020
(This article belongs to the Special Issue Fracture Mechanics and Structural Integrity of Composite Materials)
Abstract
:Fracture toughness tests (compact tension) of a dual material composed of a structured Metal Matrix Composite (MMC) (martensitic steel and titanium carbides, named MS-TiC) surrounded by martensitic steel (MS) are simulated with a Discrete Elements Model (DEM) developed with the GranOO Workbench. The MMC structures are micro-lattices such as gyroid, octet-truss and Face and Body-Centered Cubic with Z-truss (FBCCZ). The volume fraction of these MMC inserts and their cell size are fixed, the influence of the cell orientation is studied. The aim of the study is to determine the configuration of topology (shape and cell orientation) which absorbs the most energy and is the most crack resistant. From experimental tests, the Young’s moduli and the failure stresses of the MMC material and the metal are estimated, and thanks to beam network discretization, a local stiffness and a failure criterion are evaluated to finally obtain a crack propagation path. To verify the suitability of the DEM model, a Compact Tension (CT) experimental test on MMC specimens is performed and a stress intensity factor is computed. A good agreement with an error less than 10% is obtained between experimental and simulated with values respectively equal to 35 and 37 . From DEM simulations based on the CT tests, the FBCCZ cell absorbs the most energy at the crack propagation compared to other structures and the steel. The crack propagation length depends on the shape of the topology. The originality of the study lies in the modeling, with granular properties using DEM, of the mechanical and elastic fracture behavior of these topological structures classically solved by Finite Elements Method (FEM): the microscopic constitutive relations have been validated macroscopically by experimental tests on homogeneous MMC materials.
1. Introduction
Wear and fracture resistance is a major problem for parts stressed under extreme conditions. These parts often wear heterogeneously or break prematurely. Metal Matrix Composites (MMC) are now widely favored because they considerably improve the mechanical performance of material and limit physical phenomena of damage [1]. It is notably showed an increase of fracture toughness with the increase of volume fraction of reinforcing ceramics [2,3]. Reinforcing ceramics, carbides or oxides, are uniformly distributed throughout the matrix. However, a homogeneous distribution of the MMC material is not always optimal to improve the mechanical properties.
An alternative is to reinforce parts with specifically shaped MMC inserts into a metal matrix. Among existing reinforcement structures, there are foams or honeycombs, but the inserts now have increasingly complex topologies. These structures are lightweight, and are known for their high specific strength and their high energy absorption capability [4]. There is a wide range of cell topology as gyroid or micro-lattice with struts [5,6]. These complex structures can be manufactured by several processes [7], but they are often manufactured by Selective Laser Melting, an additive manufacturing method which is able to manufacture any shape contrary to casting. These lattices or natural topologies are more and more used in medical [8,9], in the aerospace industry, but especially for parts subjected to extreme mechanical conditions.
The reinforcement ceramic, titanium carbides (TiC) is well-known for its ability to improve the wear resistance of a metal matrix. This is especially used in extreme tribology (crushers, rolling, etc.). However, although highly resistant to abrasive wear, the mechanical properties (fracture toughness and failure stress) of the MMC material drops drastically due to the metal-ceramic permeability (Section 3.3). The aim is therefore to re-establish correct mechanical properties as keeping a good wear resistance.
In this study, three types of topologies are compared, namely a gyroid, an octet-truss and an Face and Body-Centered Cubic with Z-truss (FBCCZ), with different cell orientations (Figure 1 for the illustration of the studied cell topologies, and Figure 4 for the representation of the structures in the form of a compact tension specimen). The aim is to determine which structure absorbs the most fracture energy to improve parts subject to severe multidirectional stresses. The common and chosen test is the mode I fracture toughness test with Compact Tension (CT) specimens containing the above-mentioned reinforcement shapes.
The originality of the study is to model with granular properties (DEM) the mechanical and elastic fracture behavior of these topological structures classically studied in Finite Elements Method (FEM) [5,10], whose the microscopic constitutive relations are validated macrospically by experimental tests on homogeneous MMC materials.
The performance evaluation of each reinforcement shape is based on numerical simulations carried out with the Discrete Element Method (DEM), using the GranOO Workbench [11]. Some plugins are implemented to study the damage into the specimens as the crack propagation. The DEM has been chosen for its ability to model structure fracture phenomena and cracks branching in discontinuous and porous media, and to decrease the crack path dependency on the mesh compared to the Finite Element Method (FEM). Actually, while the many developments based on the FEM allow the modeling of damage and fracture, such as the Continuum Damage Mechanics [12], the eXtended Finite Element Method [13], or the Cohesive Zone Model [14], these methods suffer from multiple difficulties, such as taking into account multi-fracturation and cracks deviation. Moreover, the DEM relies on Discrete Mechanics which, in essence, is dedicated to the simulation of discontinuous phenomena.
The DEM models mechanical properties will be calibrated using simple compression tests, in the same way as described by André et al. [15]. The models based on the reference configurations of reinforced CT specimens, namely the full steel and full composite specimens, will be compared to experiments. These experimental tests were carried out according to ASTM E399 [16], ASTM E1820 [17] and ISO 12135 [18]. Then, predictive simulations will be achieved with the gyroid, the octet-truss and the FBCCZ inserts with different orientations. The results will be compared to the reference configurations in terms of maximum load for crack opening and absorbed energy, and discussed.
2. Topological Structures of Reinforcement
Three topological reinforcement structures are studied, namely a gyroid, an octet-truss and an FBCCZ. The gyroid structure (Figure 1a), discovered by Schoen [19] in 1970 and initially meets in nature (mitochondria, butterfly wings, etc.), has a topology similar to open-celled foam. This shape is a triply periodic minimal surface with mean curvature described by the formula presented in (1).
This formula is expressed with the cartesian coordinates (x, y, z), the cell length L. The gyroid has a complete shape and represents of the volume fraction of a cube in which it is enclose in [20].
Yanez et al. [8] showed in their study that the gyroid can be used as scaffold for human bones thanks to its good compressive and torsional strengths and stiffnesses. Qin et al. [21] performed a study on 3D graphene gyroids with varying cell size and wall thickness. They concluded that a gyroid with a high density gives a better mechanical performance of the assembly, especially a high strength.
The octet-truss (Figure 1b) and the FBCCZ (Figure 1c) are micro-lattices. They are composed of trusses. The octet-truss has a Face-Centered Cubic (FCC) configuration. A unit cell of octet-truss corresponds to eight identical tetrahedron elements. The octet-truss has very good mechanical performance compared to other reinforcement structures [22], especially metallic foam [23]. It has higher crack resistance for a high relative density and large cell size [24].
The FBCCZ (Face- and Body-Centered Cubic with Z-truss) is composed of 28 trusses including Z-truss. This lattice structure has higher strength and stiffness thanks to Z-trusses. It has a high compressive strength [25,26], a high-impact resistance [26] and a good energy absorption [25]. As the gyroid, the FBCCZ lattice can be used as titanium-based alloy scaffold in human body thanks to a good biocompability and a good corrosion behavior [9]. Vrana et al. [26] showed that the FBCCZ lattice performs better than the gyroid regarding the compressive strength despite the same stiffness in all loading directions of the gyroid.
3. Materials and Methods
3.1. Theory on the Determination of the Fracture Toughness
The determination of the fracture toughness is based on the load-crack mouth displacement curve (Figure 2). The crack mouth opening displacement (CMOD) corresponds to the load-line displacement. This is therefore measured with a clip gauge on the loading line (Figure 3b).
The aim is to determine a load which is the intersection between the load-displacement curve and a line secant to the tangent line of the curve which is the initial elastic loading slope (OA line in Figure 2). For a type-I load-displacement curve, the critical load is equal to (Figure 2). If the ratio (with the maximum recorded load) does not exceed (i), then a stress intensity factor can be calculated using Equation (2). This stress intensity factor is equal to the critical stress intensity factor if the criterion (ii) with is satisfied. If the different conditions (i and ii) are not satisfied, cannot be calculated because the test is a size-dependent test.
B is the specimen thickness, is the length of the uncracked part of the specimen, W is the length from the bottom of the specimen to the center of its holes, is the initial crack length taking into account the length from the center of the specimen holes to the notch tip and the pre-cracking (Figure 3a). is a stress intensity factor coefficient [17]. is the yield strength.
3.2. CAD of the Topologies
In addition to comparing topologies for determining the one which absorbs more energy and is more resistant to crack, their orientation is also studied to know if the cell orientation has an influence on mechanical performance. Gu et al. [27] showed that the strength of the octet-truss is higher in Z-orientation than in X- or Y-orientations. Two configurations of gyroid, one orientation of octet-truss and three spatial orientations of FBCCZ are studied (Figure 4). Each oriented structure was designed according to the dimension of a CT specimen proposed by ISO 12135 [18], ASTM E399 [16] and ASTM E1820 [17] for the mode I fracture toughness tests (Figure 4). The CT specimen has a dimension of (L, l, B) = (75 mm, 72 mm, 30 mm) (Figure 3a). The cell size is thus fixed to 30 mm to have a single cell on the CT specimen thickness. The wall thickness of the gyroid and the truss size of the lattices are calculated to have the same volumetric fraction of MMC structure in the CT specimen. This volumetric fraction is fixed to 29% which corresponds to a gyroid with a wall thickness of 3 mm. MIT showed that a gyroid with this wall thickness absorbs more pressure than a thinner gyroid under compressive loading.
3.3. Materials
The studied insert material is a Metal Matrix Composite (MMC) composed of Martensitic Steel (MS) and Titanium Carbides (TiC), named MS-TiC, with particle size around 10 μm. TiC is one of the most resistant reinforcement ceramic [28,29,30]. Mechanical tests were performed on MS and MS-TiC specimens. The mechanical properties of both materials are presented in Table 1. Each test method used for the determination of a given mechanical parameter is specified.
The fracture toughness testing was performed on pre-cracked heat-treated CT specimens of full MS and full MS-TiC. The pre-cracking was carried out by fatigue testing. Constant of 30 and 15 were respectively applied to the full MS and the full MS-TiC CT specimens. The crack growth was monitored according to the compliance method. The fatigue test was stopped when an opening crack of 12 mm was measured which corresponds to a crack length of 30 mm by considering the notch. The fracture toughness testing was then performed on the pre-cracked specimen. A displacement speed of mm/min at an ambient temperature of 23 was applied, the target maximum load was 250 . The values is computed according to the ASTM E1820 standard [17] and the validity of the tests is verified (Section 3.1).
The MS-TiC material has low mechanical properties when it is in the form of a homogeneous structure compared to the MS material (Table 1), which is why it is necessary to find a reinforcement structure in order to not decrease performance.
3.4. Discrete Elements Method
3.4.1. Principle
The Discrete Element Method (DEM) is widely used to model divided media such as raw powders or granular materials. Particular classes of the DEM, named Lattice Element Method (LEM) [32] or Bonded Particle Element Method (BPEM) [15], allow the modeling of continuous media via the introduction of interaction laws between the particles, which local parameters enable simulation of the material apparent behavior. The DEM relies on the Discrete Mechanics framework, and it was successfully applied to the fracture of rocks [33] or concretes [34]. With the DEM, and especially the BPEM, the particles represent a given material volume and the cohesion between these particles is ensured by means of mechanical bonds. In this study, the particles are represented by spheres with different radius to avoid any geometrical anisotropy of the domains. The distribution of particles radius is uniform and vary by a factor ±0.125 around the mean value, which is decided with the aim of obtaining a coordination number, or domain cardinality, around 6.2. This value allows the obtaining of an isotropic behavior of the discrete domains [15].
Since the particles are of spherical shape, voids exist in the domain. However, this does not affect the domain mechanical behavior, and the dynamic properties are recovered by adjusting the elements density to match the expected global mass [15].
The elastic bonds, which confer its cohesion to the discrete domain, are modeled by cylindrical beams based on the Euler-Bernoulli theory. Thus, two parameters are required to define the beams behavior, namely their elastic modulus and radius . These parameters will be calibrated in the next section.
The beams are built after the packing stage of the discrete domain (Section 3.4.3). Concerning the failure modeling, once a defined amount of stress is reached inside a given bond, it is considered broken and it no longer takes part in the computation. This leads to a crack onset in the discrete domain, which propagates according to the local stress state. The value of must also be calibrated for each material.
3.4.2. Beams’ Properties Calibration
As described in the previous section, the mechanical parameters of the beams must be calibrated. The modeled material elastic modulus and Poisson’s ratio are driven by the beams’ elastic modulus and radius . In the GranOO Workbench, the beams’ radius is not entered directly but is defined as a given ratio of the averaged radius of the discrete elements it is connected to, .
Since the parameters and are not independent, they must be obtained by means of a parametric study [15] or, in the present study, using an inverse analysis on a reference cylindrical domain of same coordination number and same particles mean size, with dimensions mm and mm (Figure 5). This domain is subjected to a compression load, and its mechanical response, in terms of displacement in both the loading and transverse directions, are measured. Across the iterations of the inverse analysis, the beams’ elastic modulus and radius ratio are adjusted to match the mechanical (elastic linear) response of a theoretical cylinder of the target material.
Finally, the failure stress is directly obtained by extracting the maximum stress in all bonds in the domain at the corresponding critical load in the physical specimen.
In this study, a convergence study similar to that conducted in [15] led to the conclusion that the optimal radius of the particles is 640 μm. This value, used in the calibration process and in the remaining of this paper, gives a good compromise between the accuracy of the numerical study (in terms of domain isotropy, cardinality and volume fraction) and the computational cost. The beams’ parameters for both the martensitic steel and the TiC are given in Table 2.
3.4.3. Model Design
The DEM domains are created in two steps. First, the reinforcing inserts (illustrated in Figure 4) are filled with discrete elements with an average radius of 640 μm and numerically compacted to obtain the target coordination number of 6.2. Second, each insert is placed in the CT specimen CAD envelope which in turn is filled with the particles representing the martensitic steel. These particles are also compacted while the position of the particles belonging to the insert are fixed. The last step is the bonds creation: a beam is created between two neighboring particles as soon as a contact is detected. Figure 6 shows the CT specimen with a gyroid reinforcement.
The density of the materials is applied to the discrete elements, and the calibrated elastic moduli of the bonds , the radius ratios and the failure stresses of the bonds are applied to the corresponding bonds. Three types of bonds are defined: matrix bonds characterized by the steel, topology and interface bonds characterized by the composite parameters. The numerical CT test is performed using rigid pins placed in the two holes of the CT specimen (Figure 7). The first one, in the bottom of the specimen, is clamped, while the second one is applied and sine-ramped displacement of maximum amplitude of mm, in the X-direction. During the simulation, numerical sensors monitor the current load, the strain energy and the free surface created as soon as the crack onsets. These data will be used in the next section to validate the reference configuration against the experimental tests, and then to compare the performances of each CT specimen configuration.
3.4.4. Validation of the DEM Model
A preliminary simulated mode I fracture toughness testing was carried out on full MS-TiC CT specimens to validate the DEM model. As described above, a sine-ramped displacement of mm is applied to a pin until the fracture of the CT specimen. The load-crack mouth displacement curves for the experimental testing and the simulation are available in Figure 8.
The loads are calculated for both curves in order to determine the fracture toughness (see Section 3.1 for the method). A of around 37 is calculated from simulated data whereas the experimental fracture toughness is 35 for the full MS-TiC CT specimen despite a high difference of the load values. The values are quite similar despite different mechanical curves. This is explained by the fact that the numerical CT specimen has not the same value than the experimental one because no pre-cracking is performed in simulation. Indeed, a preliminary study was carried out on the suitability of the presence of a pre-cracking in the DEM model. Two methods of pre-cracking were used. The first method is based on the removal of discrete elements (and the bonds connected to them) that lies in a crack-sized box of discrete elements at the end of the notch. The second method consists of directly creating a pre-cracking by CT test on the specimen. When the desired crack length is obtained, the associated DEM domain is saved, and the real CT simulation is performed on it. The preliminary simulations showed that whatever the chosen pre-cracking method, the load-displacement results are similar to a load P close to 140 kN (Figure 9). Therefore, the low value of the simulation offsets its high load during the calculation (Section 3.1). The DEM model is consequently validated.
4. Results and Discussion
The maximum load necessary to the crack opening as well as the crack lips surface of the CT specimen and the total absorbed energy at this maximum load are studied. The total absorbed energy corresponds to the energy released with the crack propagation and therefore corresponds to a loss in the energy balance. The energy balance is defined as the sum of the work done by the external forces (including the contact forces), the strain energy and the kinetic energy, among other quantities (such as damping) that are not involved in this study. For a conservative system, the energy balance is null. The occurrence of cracks turns the system into a non-conservative one and leads to a loss in the energy balance, which is monitored and reported as the energy released with the crack propagation.
The crack lips surface (or free surface) is calculated from the number of broken bonds. The number of broken bonds and therefore the free surface increases as the crack spreads until they reach their maximum value at the total fracture of the specimen.
The free surface is calculated using the method described in [35], briefly summed up here. When a bond is broken, the number of interactions acting on the discrete elements connected to this bond is determined. With this number of interactions in hand, it is supposed that the connected discrete elements are not spheres but polyhedra with number of facets equal to the number of interactions, i.e., 6 faces (a cube) when the discrete element is connected to 6 other elements. With this method, it becomes easy and quite accurate to estimate the free surface corresponding to one broken bond. When such a polyhedron does not exist (e.g., 5, 7, 10 faces etc.), the face area is interpolated from other known polyhedra, as described in [35]. Across the simulation, the surface of all faces involving broken bonds is monitored and reported as the free surface.
The maximum load necessary to the crack opening of FBCCZ structures are the closest to the steel’s one (Figure 10a). FBCCZs are more efficient than gyroids (130 versus 77 ) despite its high proportion of surface, gyroids crack at the lower loading. This confirms the results obtained by Vrana et al. [26]. Octet-truss, well-known for its high strength in compressive load, is more resistant than gyroid but less than FBCCZ. The presence of trusses improves the crack resistance, especially for FBCCZ. The orientation of the cell has an influence on the mechanical strength of the structure. For gyroids, the X-orientation gyroid with sines perpendicular to the crack initiation is less efficient than the Z-orientation gyroid. The crack lips surface in the CT specimen is the lowest (Figure 10b) but its capacity of energy absorption is lower (Figure 10c) and the crack is opened at lower load. For FBCCZ, the Y-orientation FBCCZ is the spatial configuration which absorbs the most energy, it absorbs more than the steel (Figure 10c).
While the MS-TiC material, used as reinforcement, has the lowest performance with an absorbed energy eight times lower than the steel’s one, its addition in the form of a complex structure into a metal matrix (MS) makes it possible to find characteristics close to the simple matrix. The global mechanical properties are then not changed but the wear resistance can be improved thanks to the presence of titanium carbides.
The crack propagation in the CT specimen was observed thanks to the bonds fracture regarding the failure stress value of the bonds. In accordance with the metallic material standard for a mode I fracture toughness, the crack created during the CT test propagates straight in the full MS and full MS-TiC specimens (Figure 11). The red and blue colors of the scale of failure stress of the bonds correspond respectively to the MS (Figure 11a) and MS-TiC (Figure 11b) failure stress values (Table 2).
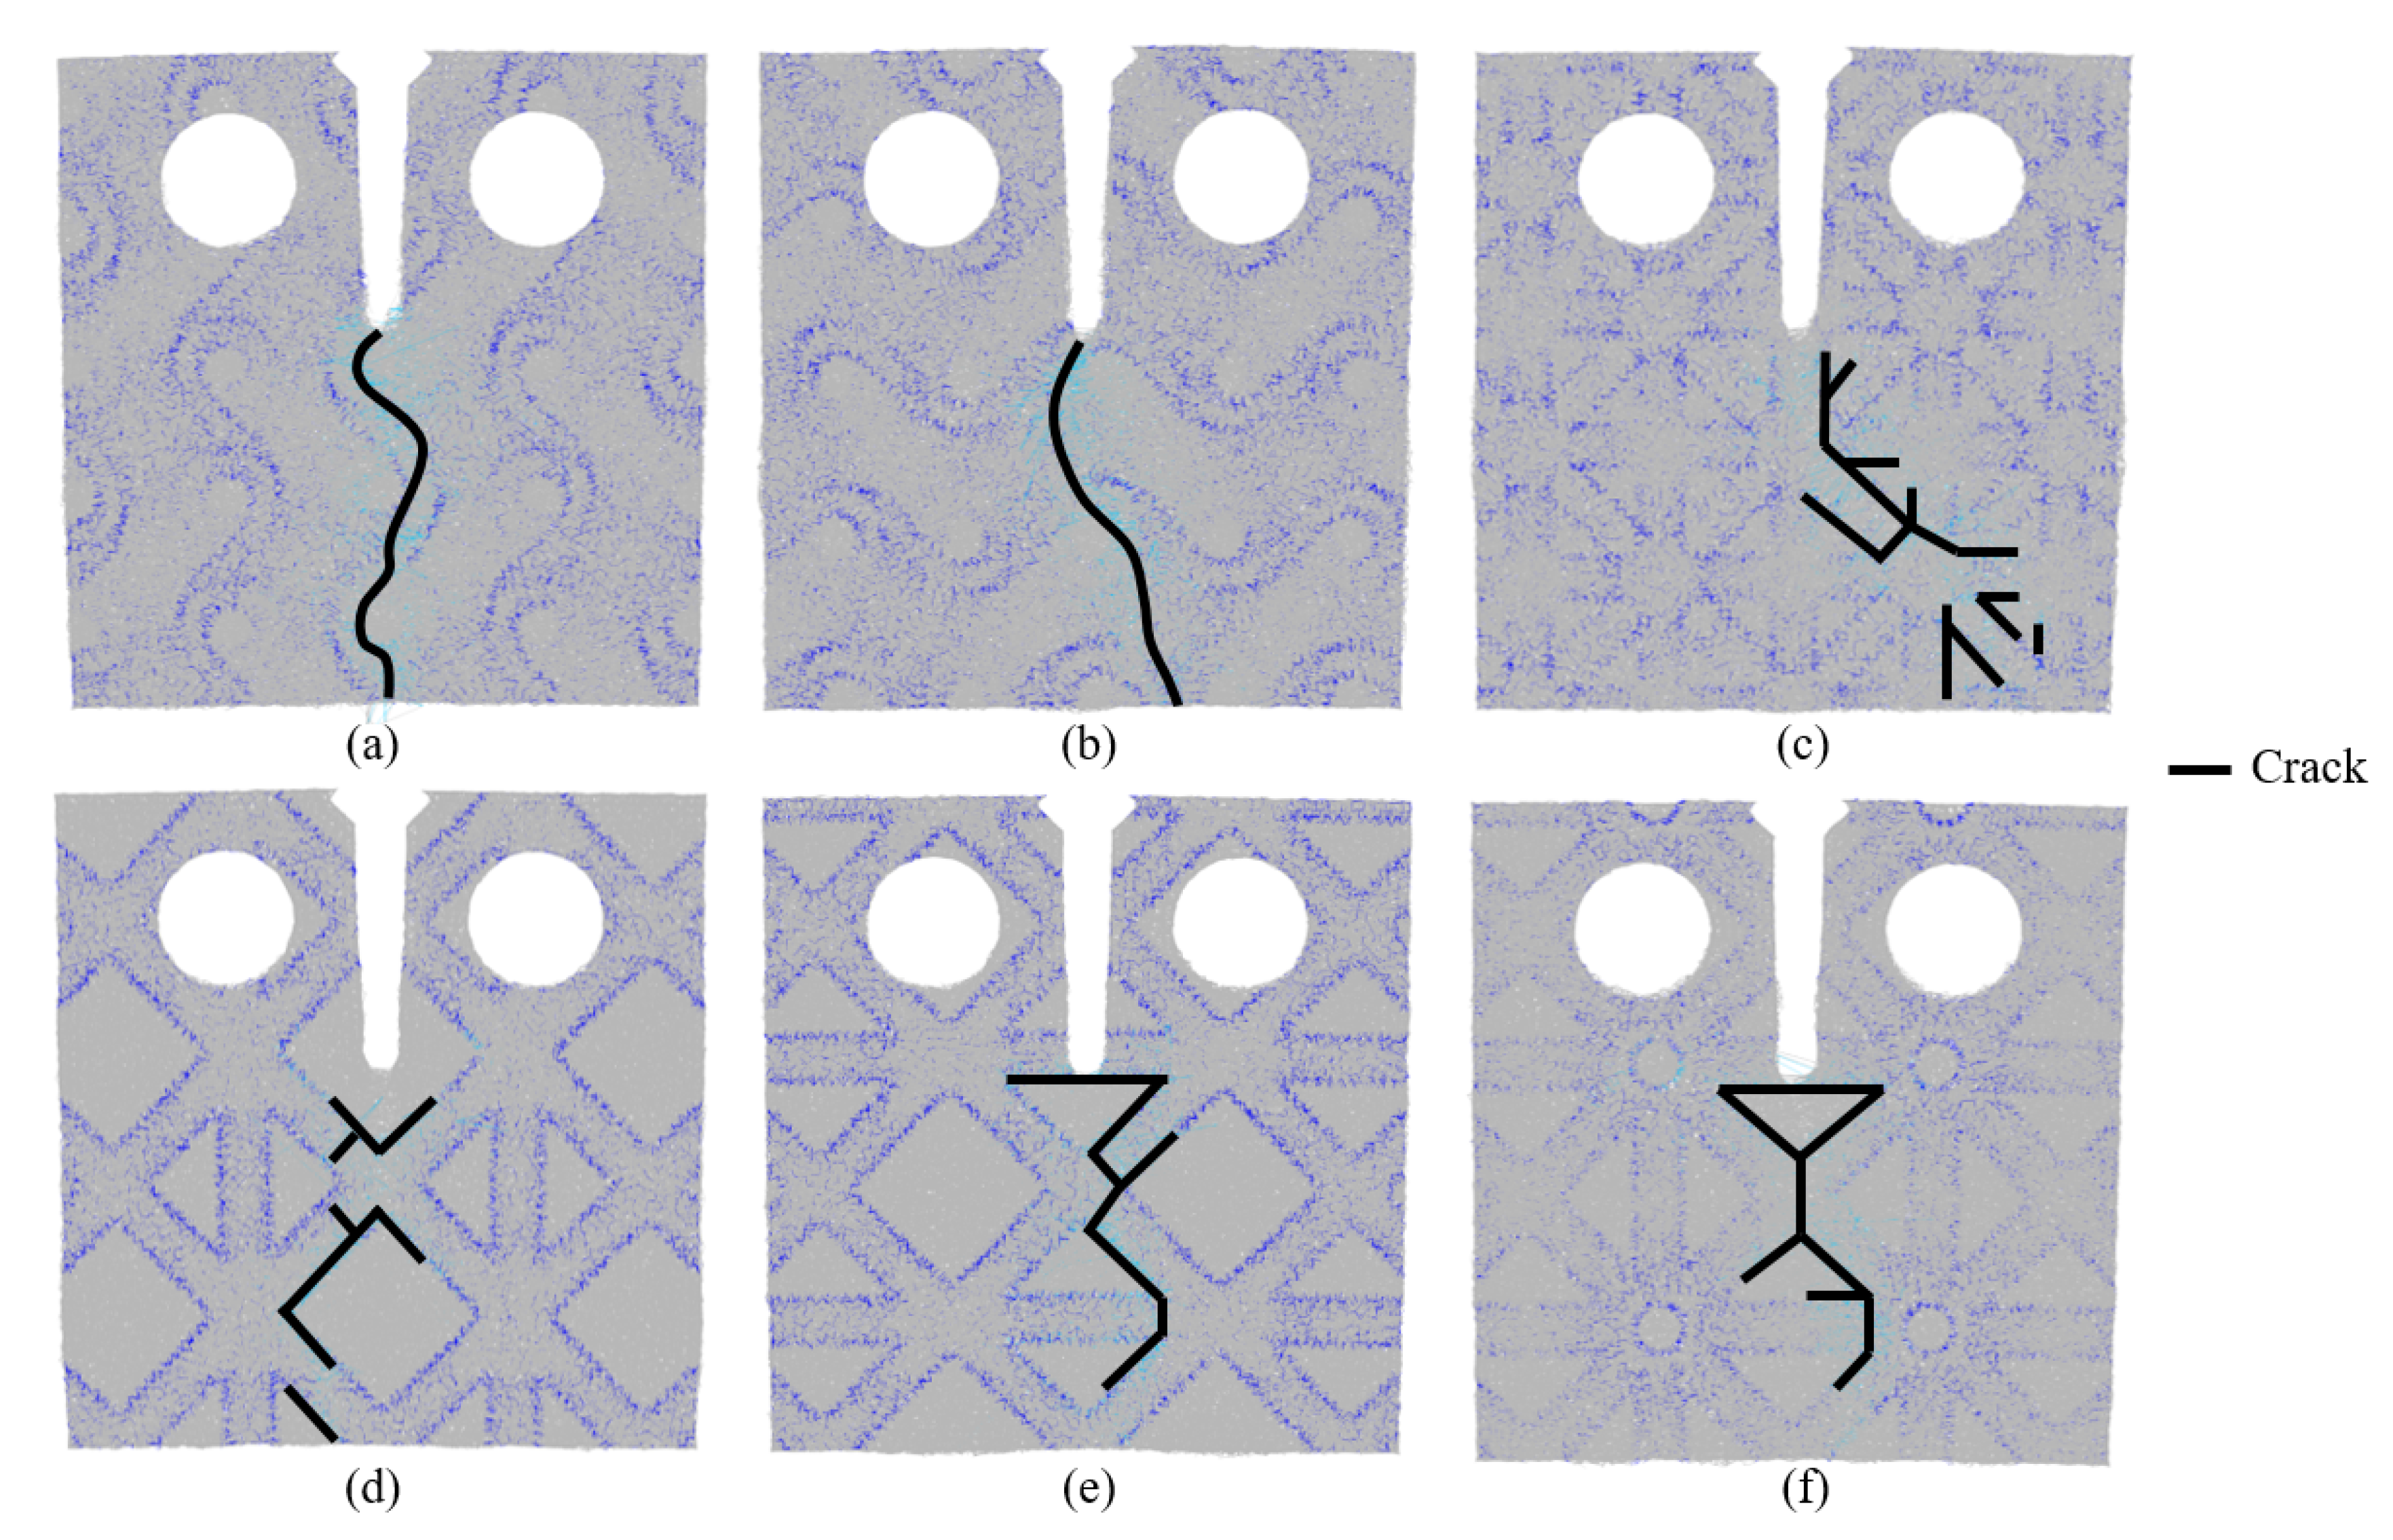
However, for the CT specimens with complex structures, the crack tends to follow the contour of the structure while propagating in both materials (Figure 12 and Figure 13). The crack changes its path when it reaches the lattice/matrix interface or when it has a contact with a truss (Figure 12). The change in trajectory may be due to the struts themselves or to the change in hardness of the materials.
A test was therefore carried out with a simple cylindrical reinforcement to verify the hypothesis of the influence of the interface or the struts on the crack deviation. The crack spreads in a rather straight line in the CT specimen despite a slight deviation due to the propagation of the crack along the interface MS-TiC cylinder/MS interface (Figure 14). The difference in hardness of the two materials does not therefore seem to be the reason for the deviation in the crack path.
There is no abrupt change in the trajectory of the crack for gyroids because they have a zero-average curvature. Their shape is smoother than octet-truss or FBCCZs which have struts oriented at 35 and 45 (Figure 13). The angle of the truss thus seems to be determinant in the crack propagation. The crack spreads more chaotically in the octet-truss structure because it has more oriented struts than FBCCZs. The number of struts and their orientation are therefore predominant in the crack path in the CT specimen. In all cases, this seems to create a decohesion between the MS-TiC topological structure and the MS matrix (Figure 15).
Table 3 is a summary of the results obtained for each specimen configuration. From this table, a ranking of the topological structures according the absorbed energy is proposed: 1. FBCCZ_01, 2. FBCCZ_02, 3. Gyroid_01, 4. FBCCZ_03, 5. Octet-truss and 6. Gyroid_02.
5. Conclusions
DEM simulations of fracture toughness tests were performed on CT specimens with three complex MS-TiC topologies of reinforcement (gyroid, octet-truss and FBCCZ) in order to improve performance of severely multidirectional loaded parts. The cell size of the topologies was defined according to the specimen thickness and to respect a 29% volume fraction of reinforcement. Different orientations of elementary cells were studied to see any influence on mechanical performance of the structures.
- Since a homogeneous MS-TiC structure has poor mechanical properties, the use of a shaped MS-TiC structure increases the damage resistance by 600% according to the simulation.
- The fineness of the DEM model makes it possible to calculate a macroscopic from simulations. The microscopic-macroscopic passage is validated with an error less than 10%. The microscopic constitutive relations were validated experimentally for a homogeneous MMC material.
- Concerning the topological structures, the FBCCZ structure with Y-orientation cell (FBCCZ_03) performs better, it absorbs the most energy and has the highest crack opening load. This structure absorbs more energy than the studied steel for a nearly equivalent failure stress.
- Regarding the crack path obtained by the DEM method, the crack generated during the tests tends to follow the contour of the reinforcing structures and seems to cause a decohesion at the insert/matrix interface. The trajectory deviation of the crack in gyroids is less abrupt than in micro-lattice structures because of its smoother curvature. The orientation of the struts is thus important in the crack propagation. There is an influence of the cell orientation on the fracture behavior of the structure.
The results show a good ability of DEM to model homogeneous or complex MMC structures into a metal matrix. In future, the effect of the struts size and the cell size on the potential improvement of the mechanical properties will be studied as well as the influence of the position of the notch in relation to the topological structures on the crack initiation and propagation.
Author Contributions
Software, C.H.; Supervision, M.B.; Writing–original draft preparation, J.L. All authors have read and agreed to the published version of the manuscript.
Funding
This research was funded by The ELSAT2020 project, co-financed by the European Union with the European Regional Development Fund, the French state and the Hauts de France Region.
Conflicts of Interest
The authors declare no conflict of interest.
Nomenclature
| Abbreviations | ||
| BPEM | Bonded Particle Element Method | |
| CMOD | Crack Mouth Opening Displacement | |
| CT | Compact Tension | |
| DEM | Discrete Elements Method | |
| FBCCZ | Face and Body Centered Cubic with Z-truss | |
| FEM | Finite Element Method | |
| LEM | Lattice Element Method | |
| MMC | Metal Matrix Composite | |
| MS | Martensitic Steel | |
| MS-TiC | Martensitic Steel and Titanium Carbides | |
| CT parameters | ||
| Initial crack length | (mm) | |
| Length of the uncracked part of the CT specimen | (mm) | |
| Stress intensity factor coefficient | (no unit) | |
| l | Total height of the CT specimen | (mm) |
| B | Thickness of the CT specimen | (mm) |
| Fracture toughness | () | |
| Stress intensity factor | () | |
| L | Width of the CT specimen | (mm) |
| P | Load | () |
| Load at the intersection between the load-displacement curve and | () | |
| the 5∘ secant line | ||
| Maximum load of the load-displacement curve | () | |
| Critical load | () | |
| Yield strength | (MPa) | |
| W | Length from the bottom of the CT specimen to the center of its holes | (mm) |
| DEM parameters | ||
| Displacement in the loading direction during a compression test on | (mm) | |
| a cylindrical DEM domain | ||
| Displacement in the transverse direction during a compression test | (mm) | |
| on a cylindrical DEM domain | ||
| Length of a cylindrical DEM domain | (mm) | |
| Radius of a cylindrical DEM domain | (mm) | |
| Radius ratio of the bonds | (no unit) | |
| Elastic modulus of the bonds | (GPa) | |
| Failure stress of the bonds | (GPa) | |
References
- Singh, J.; Chauhan, A. Overview of wear performance of aluminium matrix composites reinforced with ceramic materials under the influence of controllable variables. Ceram. Int. 2016, 42, 56–81. [Google Scholar] [CrossRef]
- Das, D.K.; Mishra, P.C.; Singh, S.; Thakur, R.K. Properties of ceramic-reinforced aluminium matrix composites—A review. Int. J. Mech. Mater. Eng. 2014, 9, 12. [Google Scholar] [CrossRef] [Green Version]
- Tjong, S.; Lau, K. Abrasion resistance of stainless-steel composites reinforced with hard TiB2 particles. Compos. Sci. Technol. 2000, 60, 1141–1146. [Google Scholar] [CrossRef]
- Schaedler, T.A.; Ro, C.J.; Sorensen, A.E.; Eckel, Z.; Yang, S.S.; Carter, W.B.; Jacobsen, A.J. Designing Metallic Microlattices for Energy Absorber Applications. Adv. Eng. Mater. 2014, 16, 276–283. [Google Scholar] [CrossRef]
- Aremu, A.; Maskery, I.; Tuck, C.; Ashcroft, I.; Wildman, R.; Hague, R. A Comparative Finite Element Study of Cubic Unit Cells for Selective Laser Melting. In 25th Annual International Solid Freeform Fabrication Symposium—An Additive Manufacturing Conference; University of Texas at Austin: Austin, TX, USA, 2014; pp. 1238–1249. [Google Scholar]
- Maconachie, T.; Leary, M.; Lozanovski, B.; Zhang, X.; Qian, M.; Faruque, O.; Brandt, M. SLM lattice structures: Properties, performance, applications and challenges. Mater. Des. 2019, 183, 108137. [Google Scholar] [CrossRef]
- Rashed, M.; Ashraf, M.; Mines, R.; Hazell, P.J. Metallic microlattice materials: A current state of the art on manufacturing, mechanical properties and applications. Mater. Des. 2016, 95, 518–533. [Google Scholar] [CrossRef]
- Yánez, A.; Cuadrado, A.; Martel, O.; Afonso, H.; Monopoli, D. Gyroid porous titanium structures: A versatile solution to be used as scaffolds in bone defect reconstruction. Mater. Des. 2018, 140, 21–29. [Google Scholar] [CrossRef]
- Li, Y.; Ding, Y.; Munir, K.S.; Lin, J.; Brandt, M.; Atrens, A.; Xiao, Y.; Kanwar, J.R.; Wen, C. Novel β-Ti35Zr28Nb alloy scaffolds manufactured using selective laser melting for bone implant applications. Acta Biomater. 2019, 87, 273–284. [Google Scholar] [CrossRef]
- Tancogne-Dejean, T.; Spierings, A.B.; Mohr, D. Additively-manufactured metallic micro-lattice materials for high specific energy absorption under static and dynamic loading. Acta Mater. 2016, 116, 14–28. [Google Scholar] [CrossRef]
- André, D.; Luc Charles, J.; Iordanoff, I.; Néauport, J. The GranOO workbench, a new tool for developing discrete element simulations, and its application to tribological problems. Adv. Eng. Softw. 2014, 74, 40–48. [Google Scholar] [CrossRef] [Green Version]
- Hubert, C.; Dubar, L.; Dubar, M.; Dubois, A. Finite Element simulation of the edge-trimming/cold rolling sequence: Analysis of edge cracking. J. Mater. Process. Technol. 2012, 212, 1049–1060. [Google Scholar] [CrossRef]
- Xue, F.; Li, F.; Li, J.; He, M.; Yuan, Z.; Wang, R. Numerical modeling crack propagation of sheet metal forming based on stress state parameters using XFEM method. Comput. Mater. Sci. 2013, 69, 311–326. [Google Scholar] [CrossRef]
- Debras, C.; Dubar, L.; Dubar, M.; Hubert, C.; Dubois, A. Fracture energy based approach for cemented carbides grain debonding. Int. J. Mech. Sci. 2019, 161–162, 105038. [Google Scholar] [CrossRef]
- André, D.; Iordanoff, I.; Charles, J.L.; Néauport, J. Discrete element method to simulate continuous material by using the cohesive beam model. Comput. Methods Appl. Mech. Eng. 2012, 213–216, 113–125. [Google Scholar] [CrossRef] [Green Version]
- ASTM E399—Standard. Test Method for Linear-Elastic Plane-Strain Fracture Toughness KIc of Metallic Materials; Technical Report; ASTM International: West Conshohocken, PA, USA, 2017. [Google Scholar]
- ASTM E1820-20—Standard. Standard Test Method for Measurement of Fracture Toughness; Technical Report; ASTM International: West Conshohocken, PA, USA, 2017. [Google Scholar]
- ISO 12135. Metallic Materials—Unified Method of Test for the Determination of Quasistatic Fracture Toughness; International Organization for Standardization: Geneva, Switzerland, 2016. [Google Scholar]
- Schoen, A.H. Infinite Periodic Minimal Surfaces Without Self-Intersections; Technical Report; National Aeronautics and Space Administration: Washington, DC, USA, 1970. [Google Scholar]
- Scherer, M.R.J. Double-Gyroid-Structured Functional Materials: Synthesis and Applications; Springer International Publishing AG: Cham, Switzerland, 2013. [Google Scholar]
- Qin, Z.; Jung, G.S.; Kang, M.J.; Buehler, M.J. The mechanics and design of a lightweight three-dimensional graphene assembly. Sci. Adv. 2017, 3. [Google Scholar] [CrossRef] [PubMed] [Green Version]
- Dong, L.; Deshpande, V.; Wadley, H. Mechanical response of Ti–6Al–4V octet-truss lattice structures. Int. J. Solids Struct. 2015, 60–61, 107–124. [Google Scholar] [CrossRef]
- Deshpande, V.; Fleck, N.; Ashby, M. Effective properties of the octet-truss lattice material. J. Mech. Phys. Solids 2001, 49, 1747–1769. [Google Scholar] [CrossRef] [Green Version]
- O’Masta, M.; Dong, L.; St-Pierre, L.; Wadley, H.; Deshpande, V. The fracture toughness of octet-truss lattices. J. Mech. Phys. Solids 2017, 98, 271–289. [Google Scholar] [CrossRef]
- Leary, M.; Mazur, M.; Elambasseril, J.; McMillan, M.; Chirent, T.; Sun, Y.; Qian, M.; Easton, M.; Brandt, M. Selective laser melting (SLM) of AlSi12Mg lattice structures. Mater. Des. 2016, 98, 344–357. [Google Scholar] [CrossRef]
- Vrana, R.; Koutny, D.; Paloušek, D. Impact resistance of different types of lattice structures manufactured by SLM. MM Sci. J. 2016, 2016, 1579–1585. [Google Scholar] [CrossRef]
- Gu, H.; Shterenlikht, A.; Pavier, M. Brittle fracture of three-dimensional lattice structure. Eng. Fract. Mech. 2019, 219, 106598. [Google Scholar] [CrossRef]
- Doǧan, O.; Hawk, J.; Tylczak, J.; Wilson, R.; Govier, R. Wear of titanium carbide reinforced metal matrix composites. Wear 1999, 225–229, 758–769. [Google Scholar] [CrossRef]
- Doǧan, O.; Hawk, J. Abrasion resistance of in situ Fe-TiC composites. Scr. Metall. Mater. 1995, 33, 953–958. [Google Scholar] [CrossRef]
- Doel, T.; Bowen, P. Tensile properties of particulate-reinforced metal matrix composites. Compos. Part A Appl. Sci. Manuf. 1996, 27, 655–665. [Google Scholar] [CrossRef]
- ASTM C1259—Standard. Standard Test Method for Dynamic Young’s Modulus, Shear Modulus, and Poisson’s Ratio for Advanced Ceramics by Impulse Excitation of Vibration; Technical Report; ASTM International: West Conshohocken, PA, USA, 2015. [Google Scholar]
- Schlangen, E.; Garboczi, E. New method for simulating fracture using an elastically uniform random geometry lattice. Int. J. Eng. Sci. 1996, 34, 1131–1144. [Google Scholar] [CrossRef]
- Klichowicz, M.; Frühwirt, T.; Lieberwirth, H. New experimental setup for the validation of DEM simulation of brittle crack propagation at grain size level. Miner. Eng. 2018, 128, 312–323. [Google Scholar] [CrossRef]
- Wang, Y.; Meng, Y.; Jiradilok, P.; Matsumoto, K.; Nagai, K.; Asamoto, S. Expansive cracking and compressive failure simulations of ASR and DEF damaged concrete using a mesoscale discrete model. Cem. Concr. Compos. 2019, 104, 103404. [Google Scholar] [CrossRef]
- Hubert, C.; André, D.; Dubar, L.; Iordanoff, I.; Charles, J. Simulation of continuum electrical conduction and Joule heating using DEM domains. Int. J. Numer. Methods Eng. 2017, 110, 862–877. [Google Scholar] [CrossRef]
Figure 1.
Topological cell of reinforcement—gyroid (a), octet-truss (b) and FBCCZ (c).
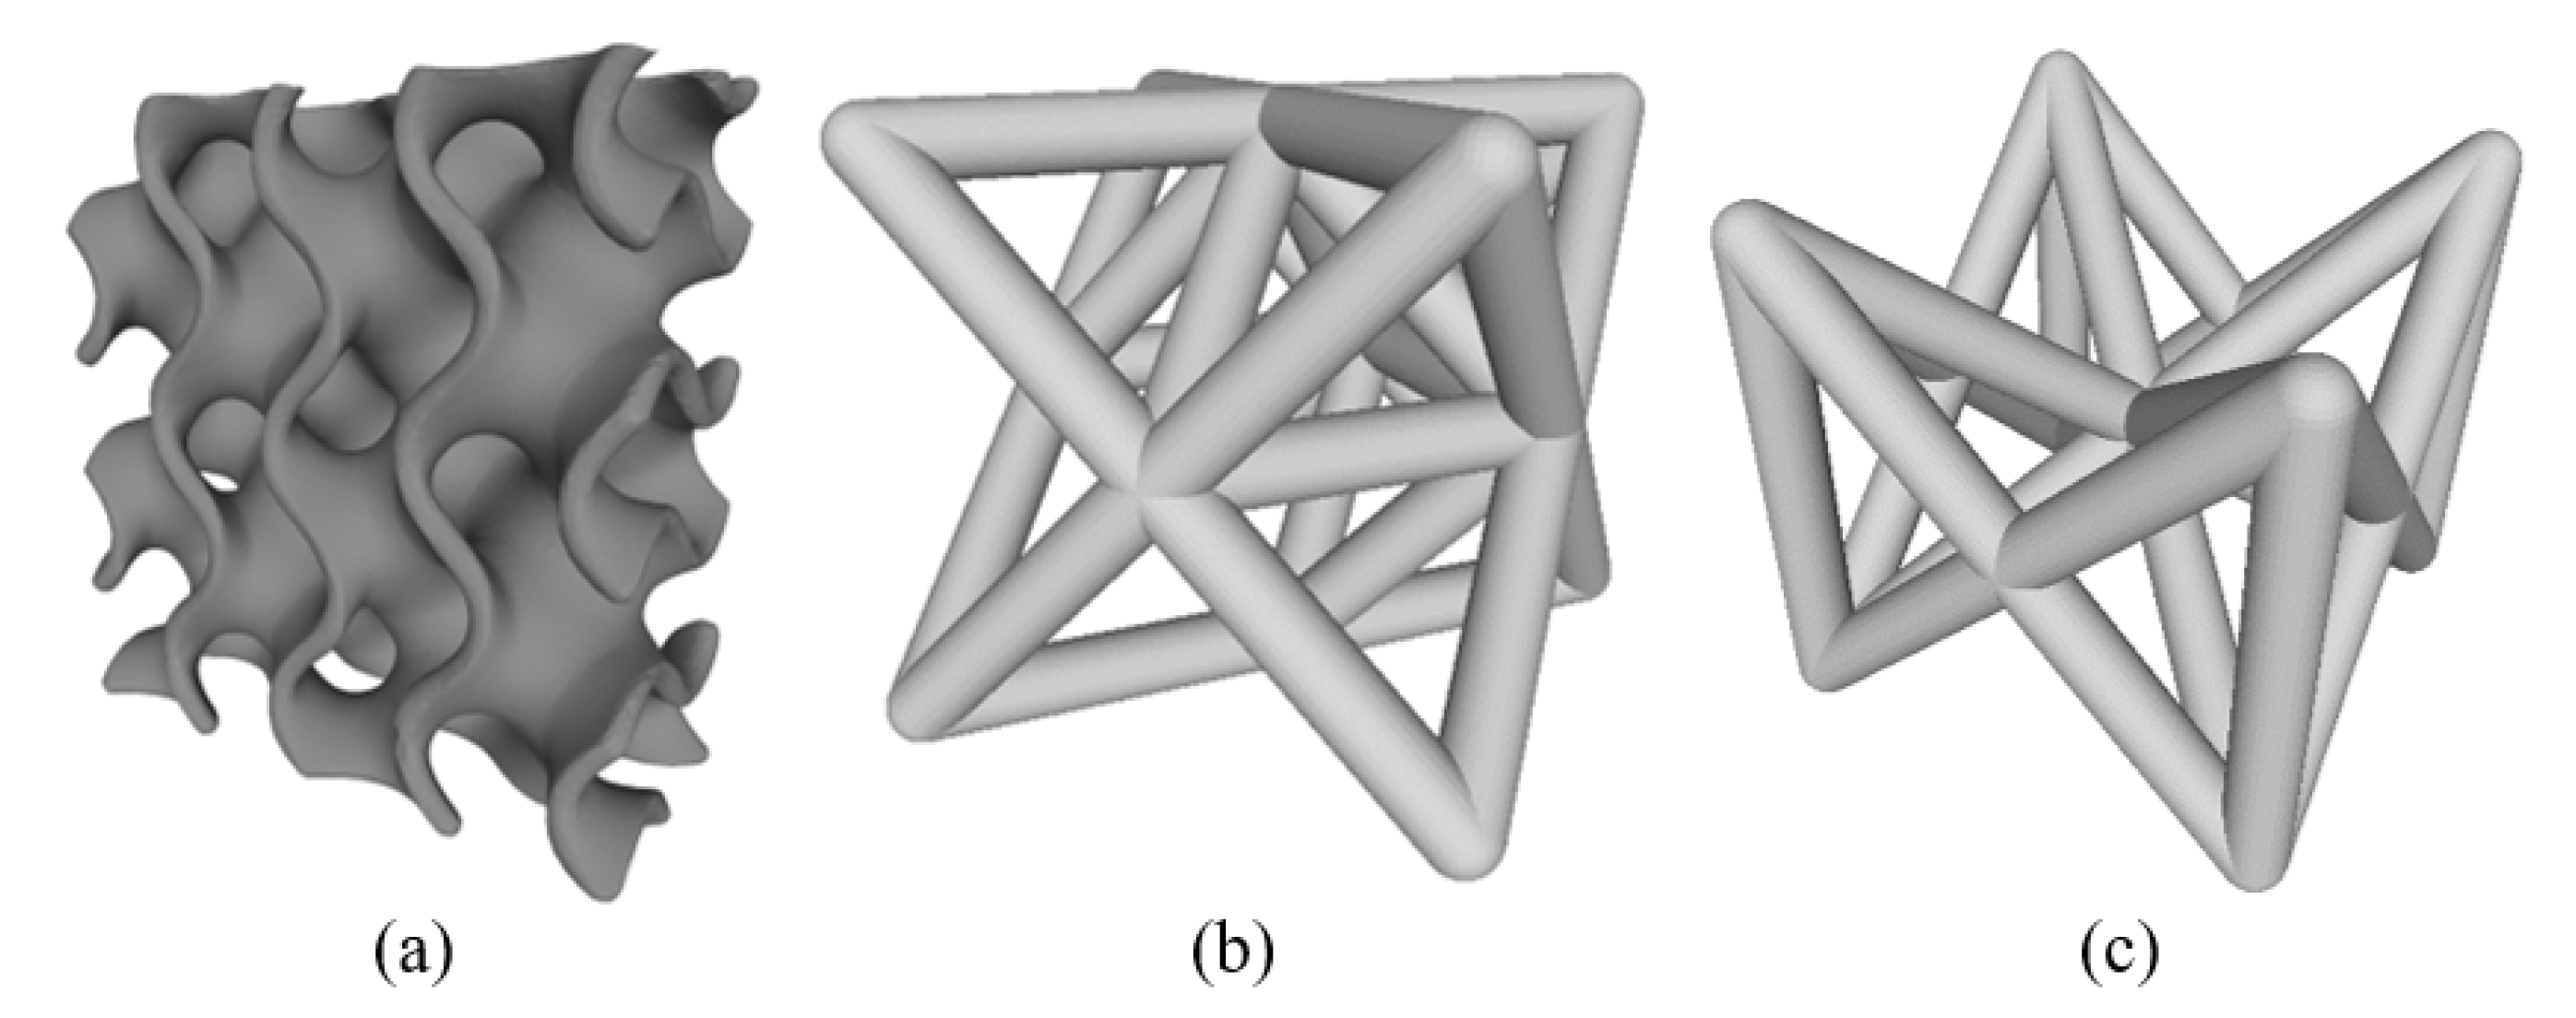
Figure 2.
Type-I load-displacement curves for the determination of the critical load then the calculation of the stress intensity factor [17].
Figure 2.
Type-I load-displacement curves for the determination of the critical load then the calculation of the stress intensity factor [17].
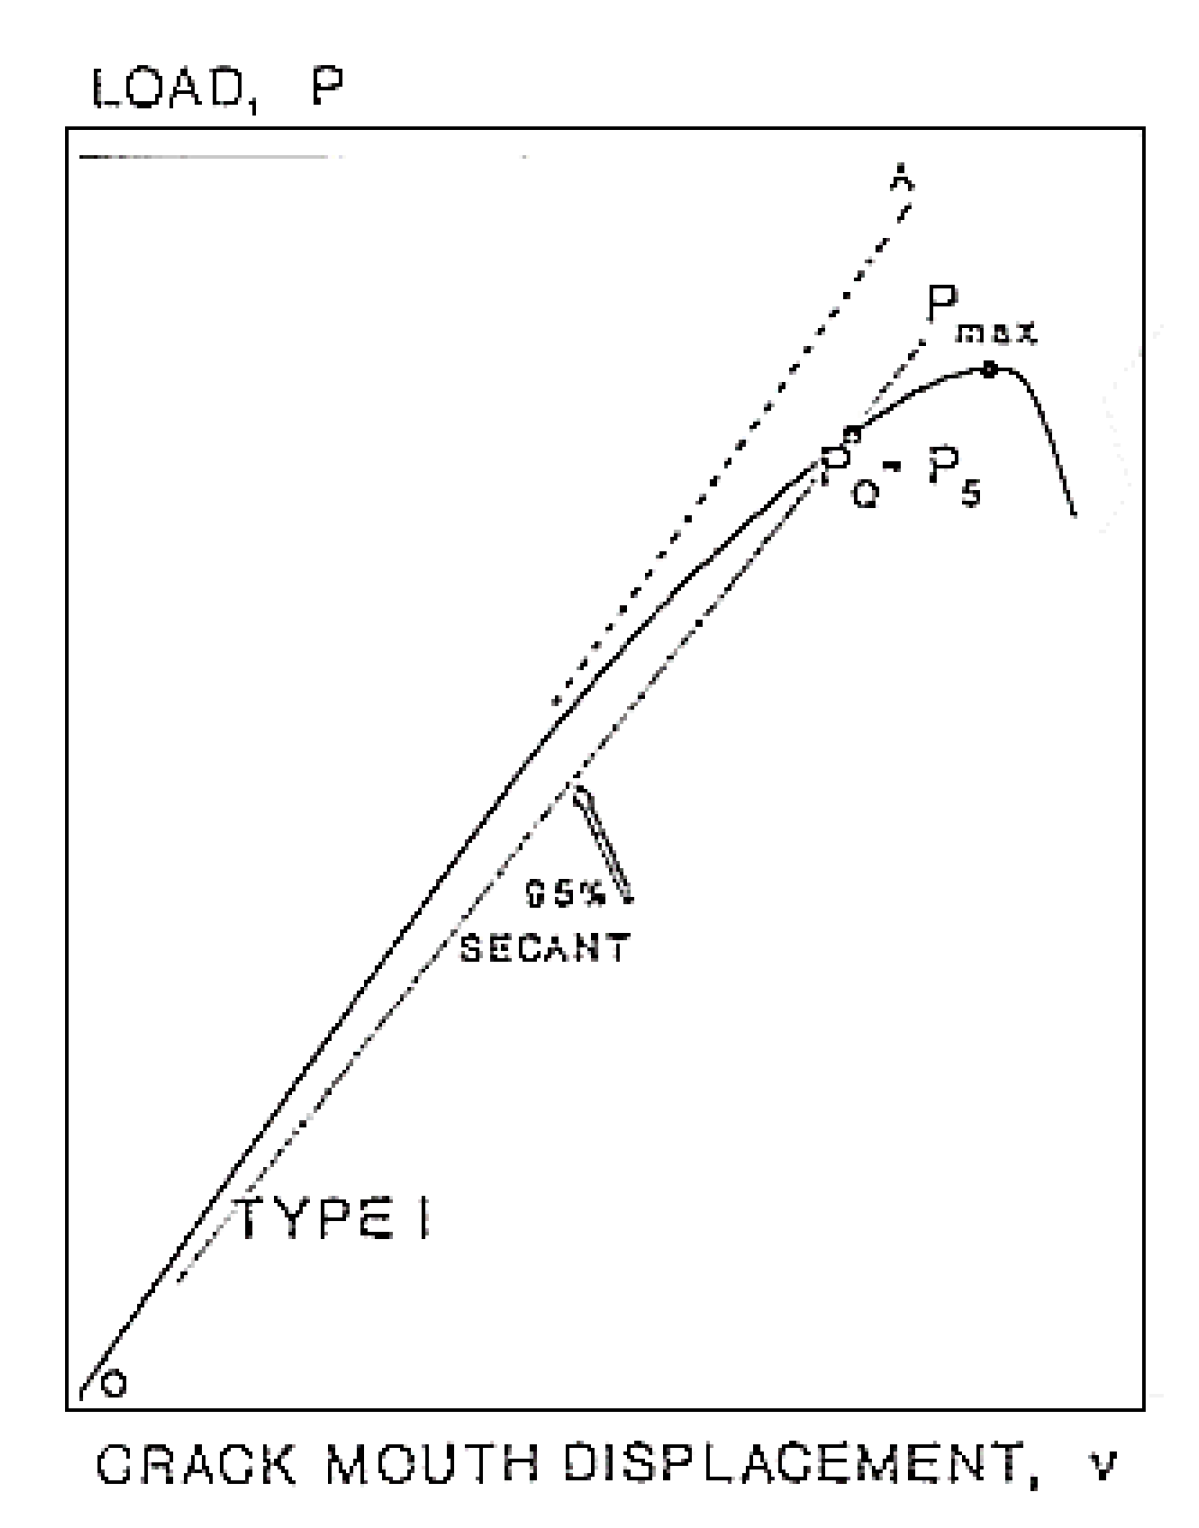
Figure 3.
Geometry of a CT specimen (a) and crack mouth opening displacement (b).

Figure 4.
Topological inserts cut according to a CT specimen—Z-orientation gyroid (Gyroid_01) (a), X-orientation gyroid (Gyroid_02) (b), octet-truss (c), Z-orientation FBCCZ (FBCCZ_01) (d), X-orientation FBCCZ (FBCCZ_02) (e) and Y-orientation FBCCZ (FBCCZ_03) (f).
Figure 4.
Topological inserts cut according to a CT specimen—Z-orientation gyroid (Gyroid_01) (a), X-orientation gyroid (Gyroid_02) (b), octet-truss (c), Z-orientation FBCCZ (FBCCZ_01) (d), X-orientation FBCCZ (FBCCZ_02) (e) and Y-orientation FBCCZ (FBCCZ_03) (f).
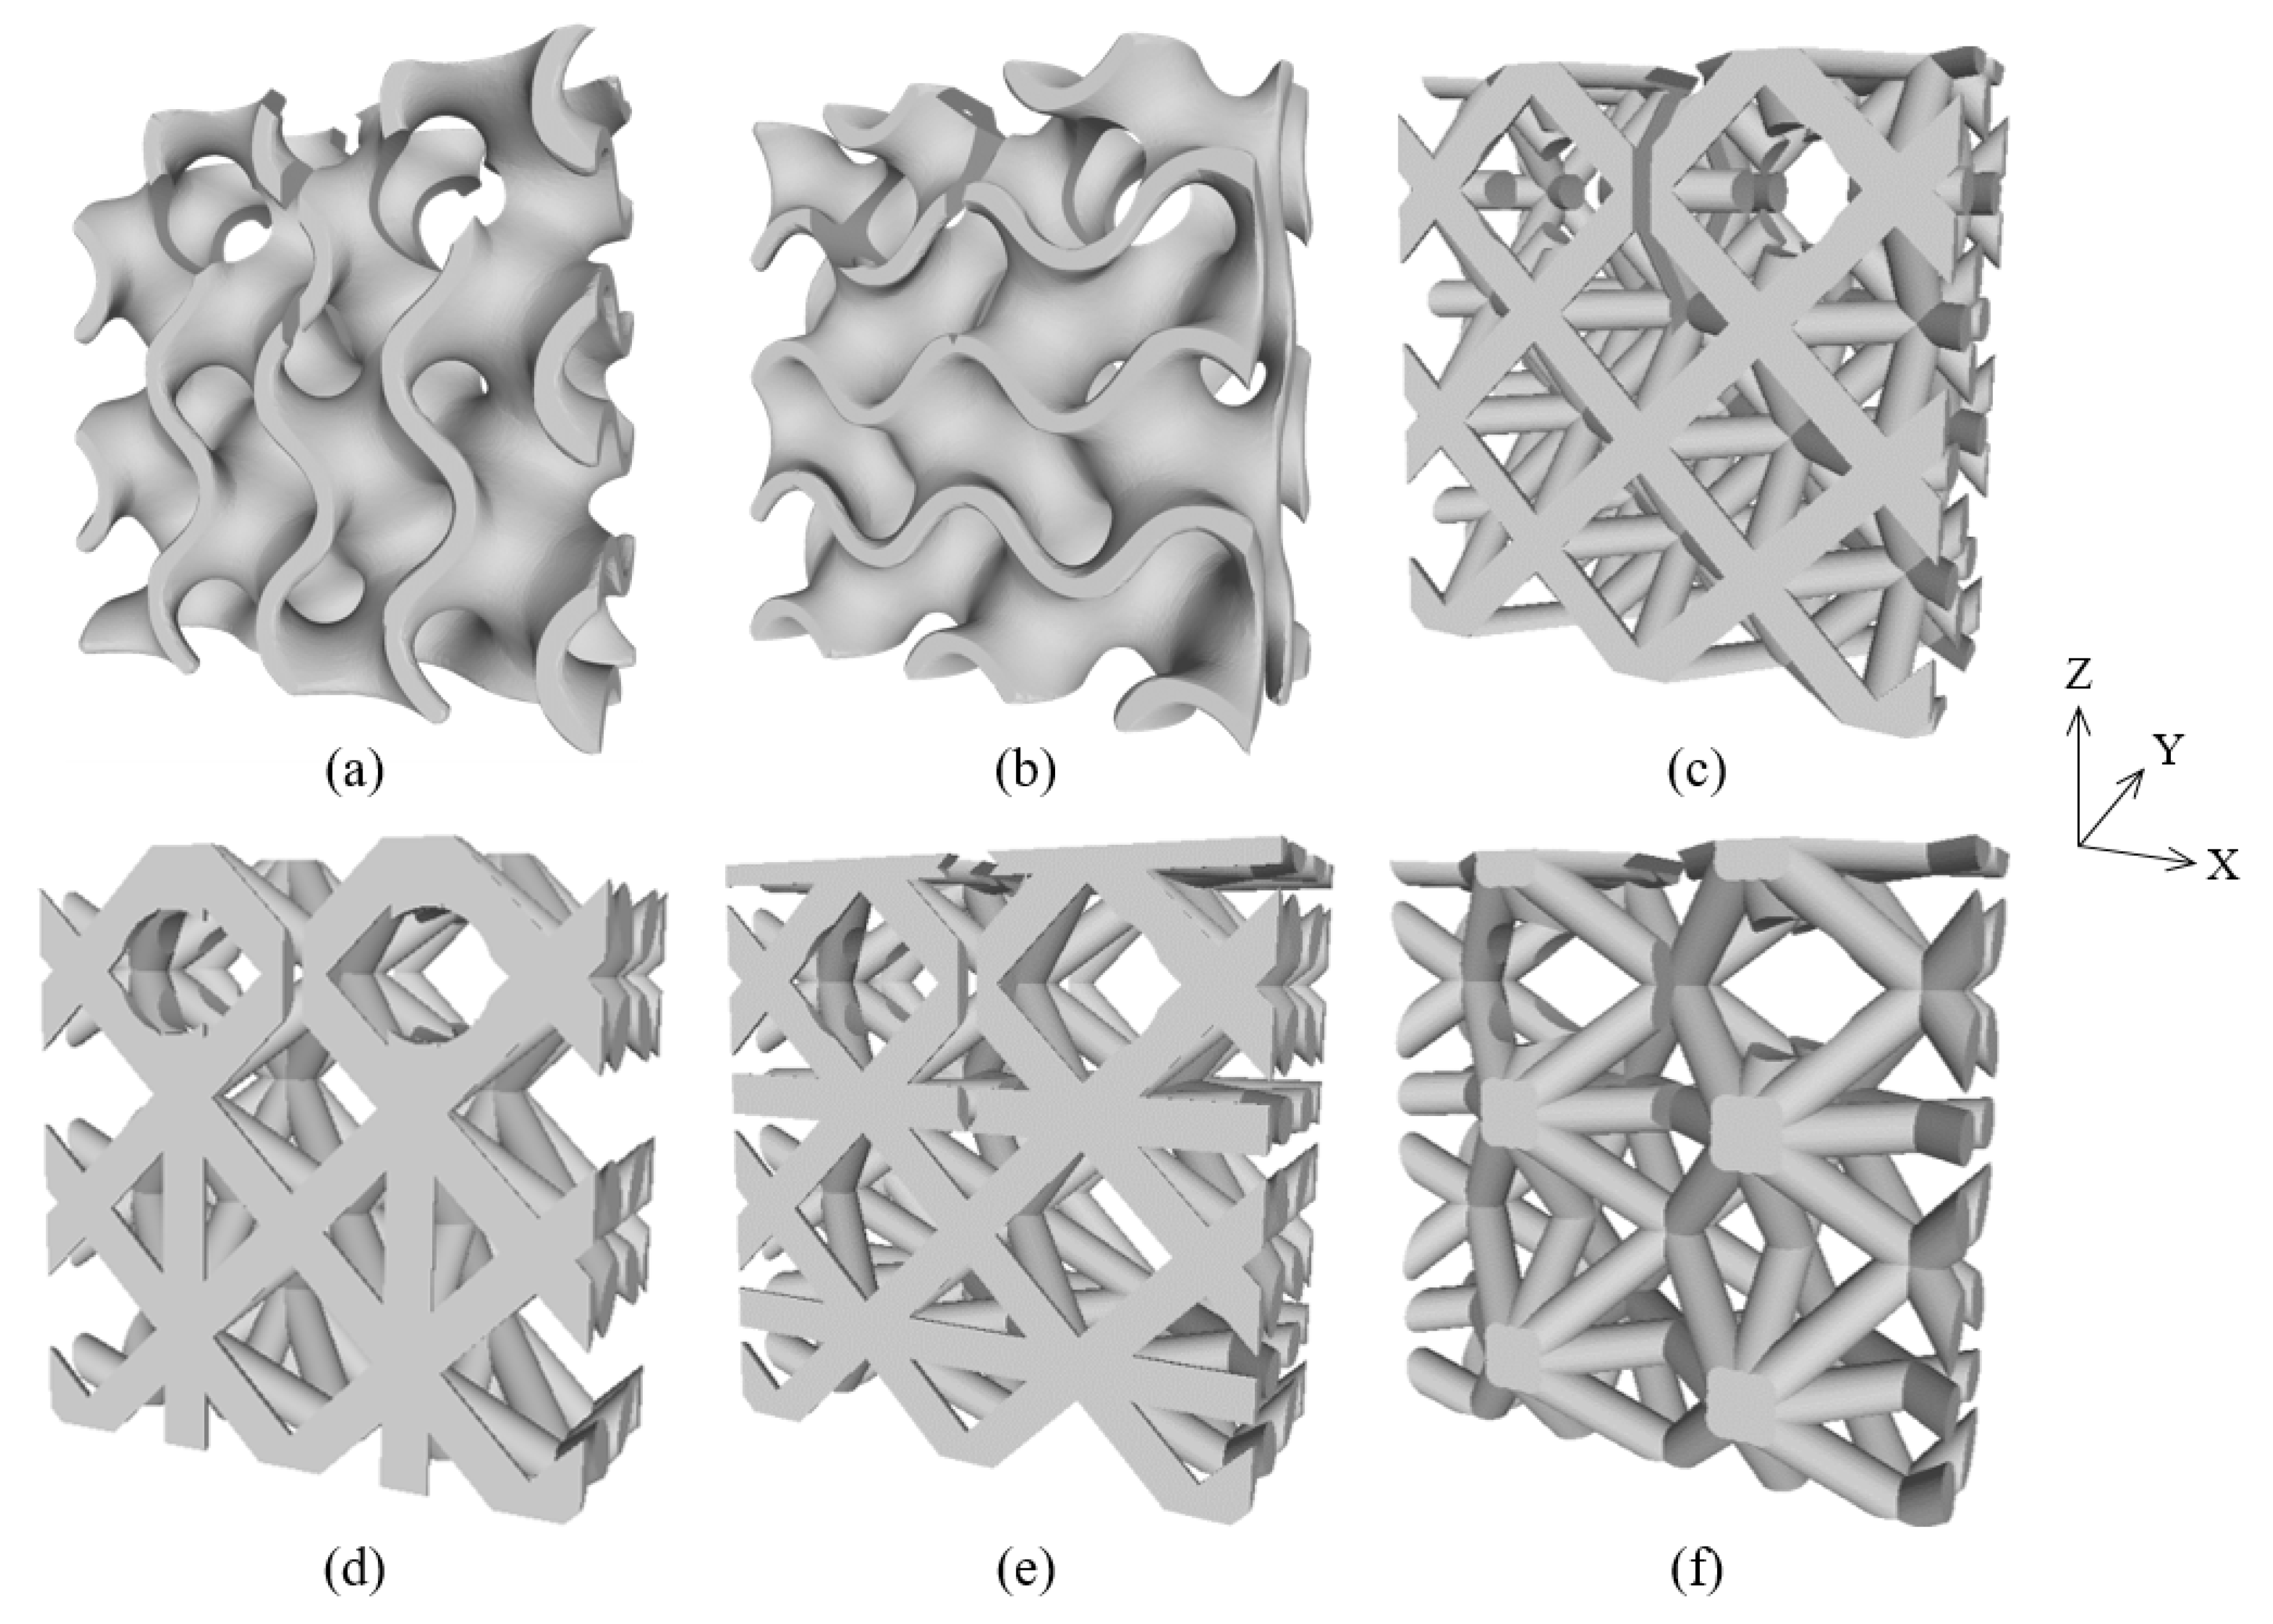
Figure 5.
Calibration domain and boundary conditions for the MS (red) and MS-TiC (yellow).
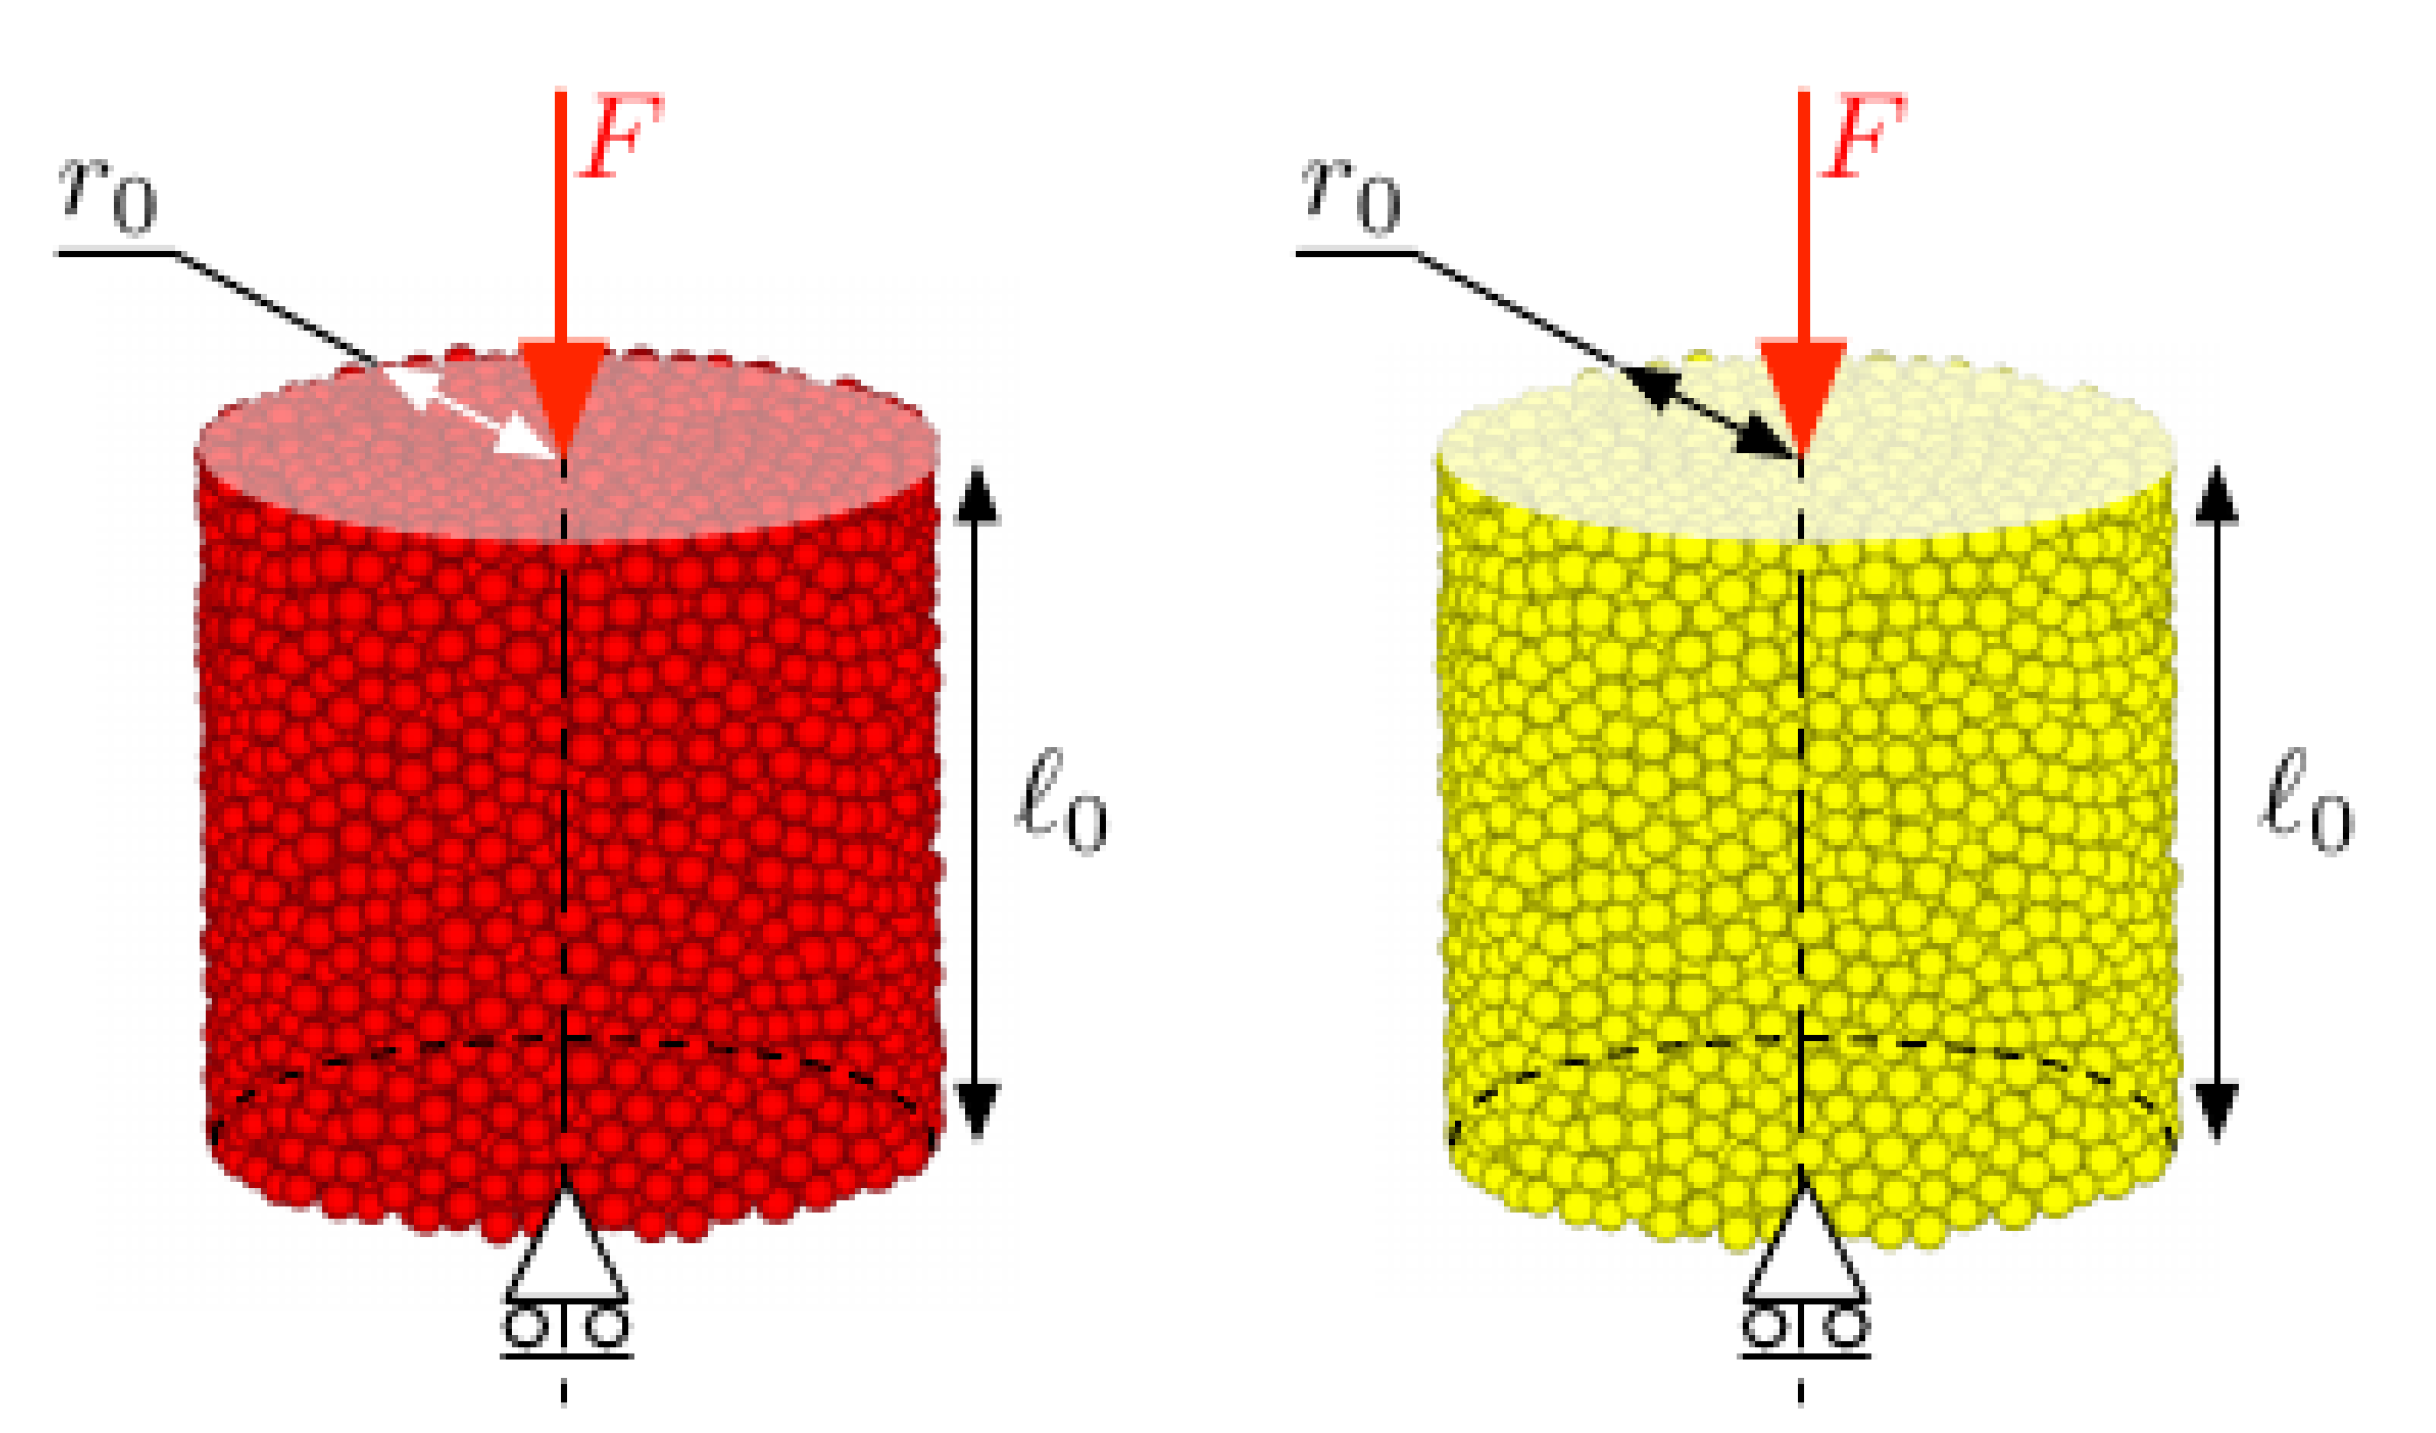
Figure 6.
Views of the DEM domain of the Z-orientation gyroid (Gyroid_01). The gyroid is represented by yellow discrete elements which correspond to the MS-TiC particles, whereas red elements correspond to the MS matrix.
Figure 6.
Views of the DEM domain of the Z-orientation gyroid (Gyroid_01). The gyroid is represented by yellow discrete elements which correspond to the MS-TiC particles, whereas red elements correspond to the MS matrix.
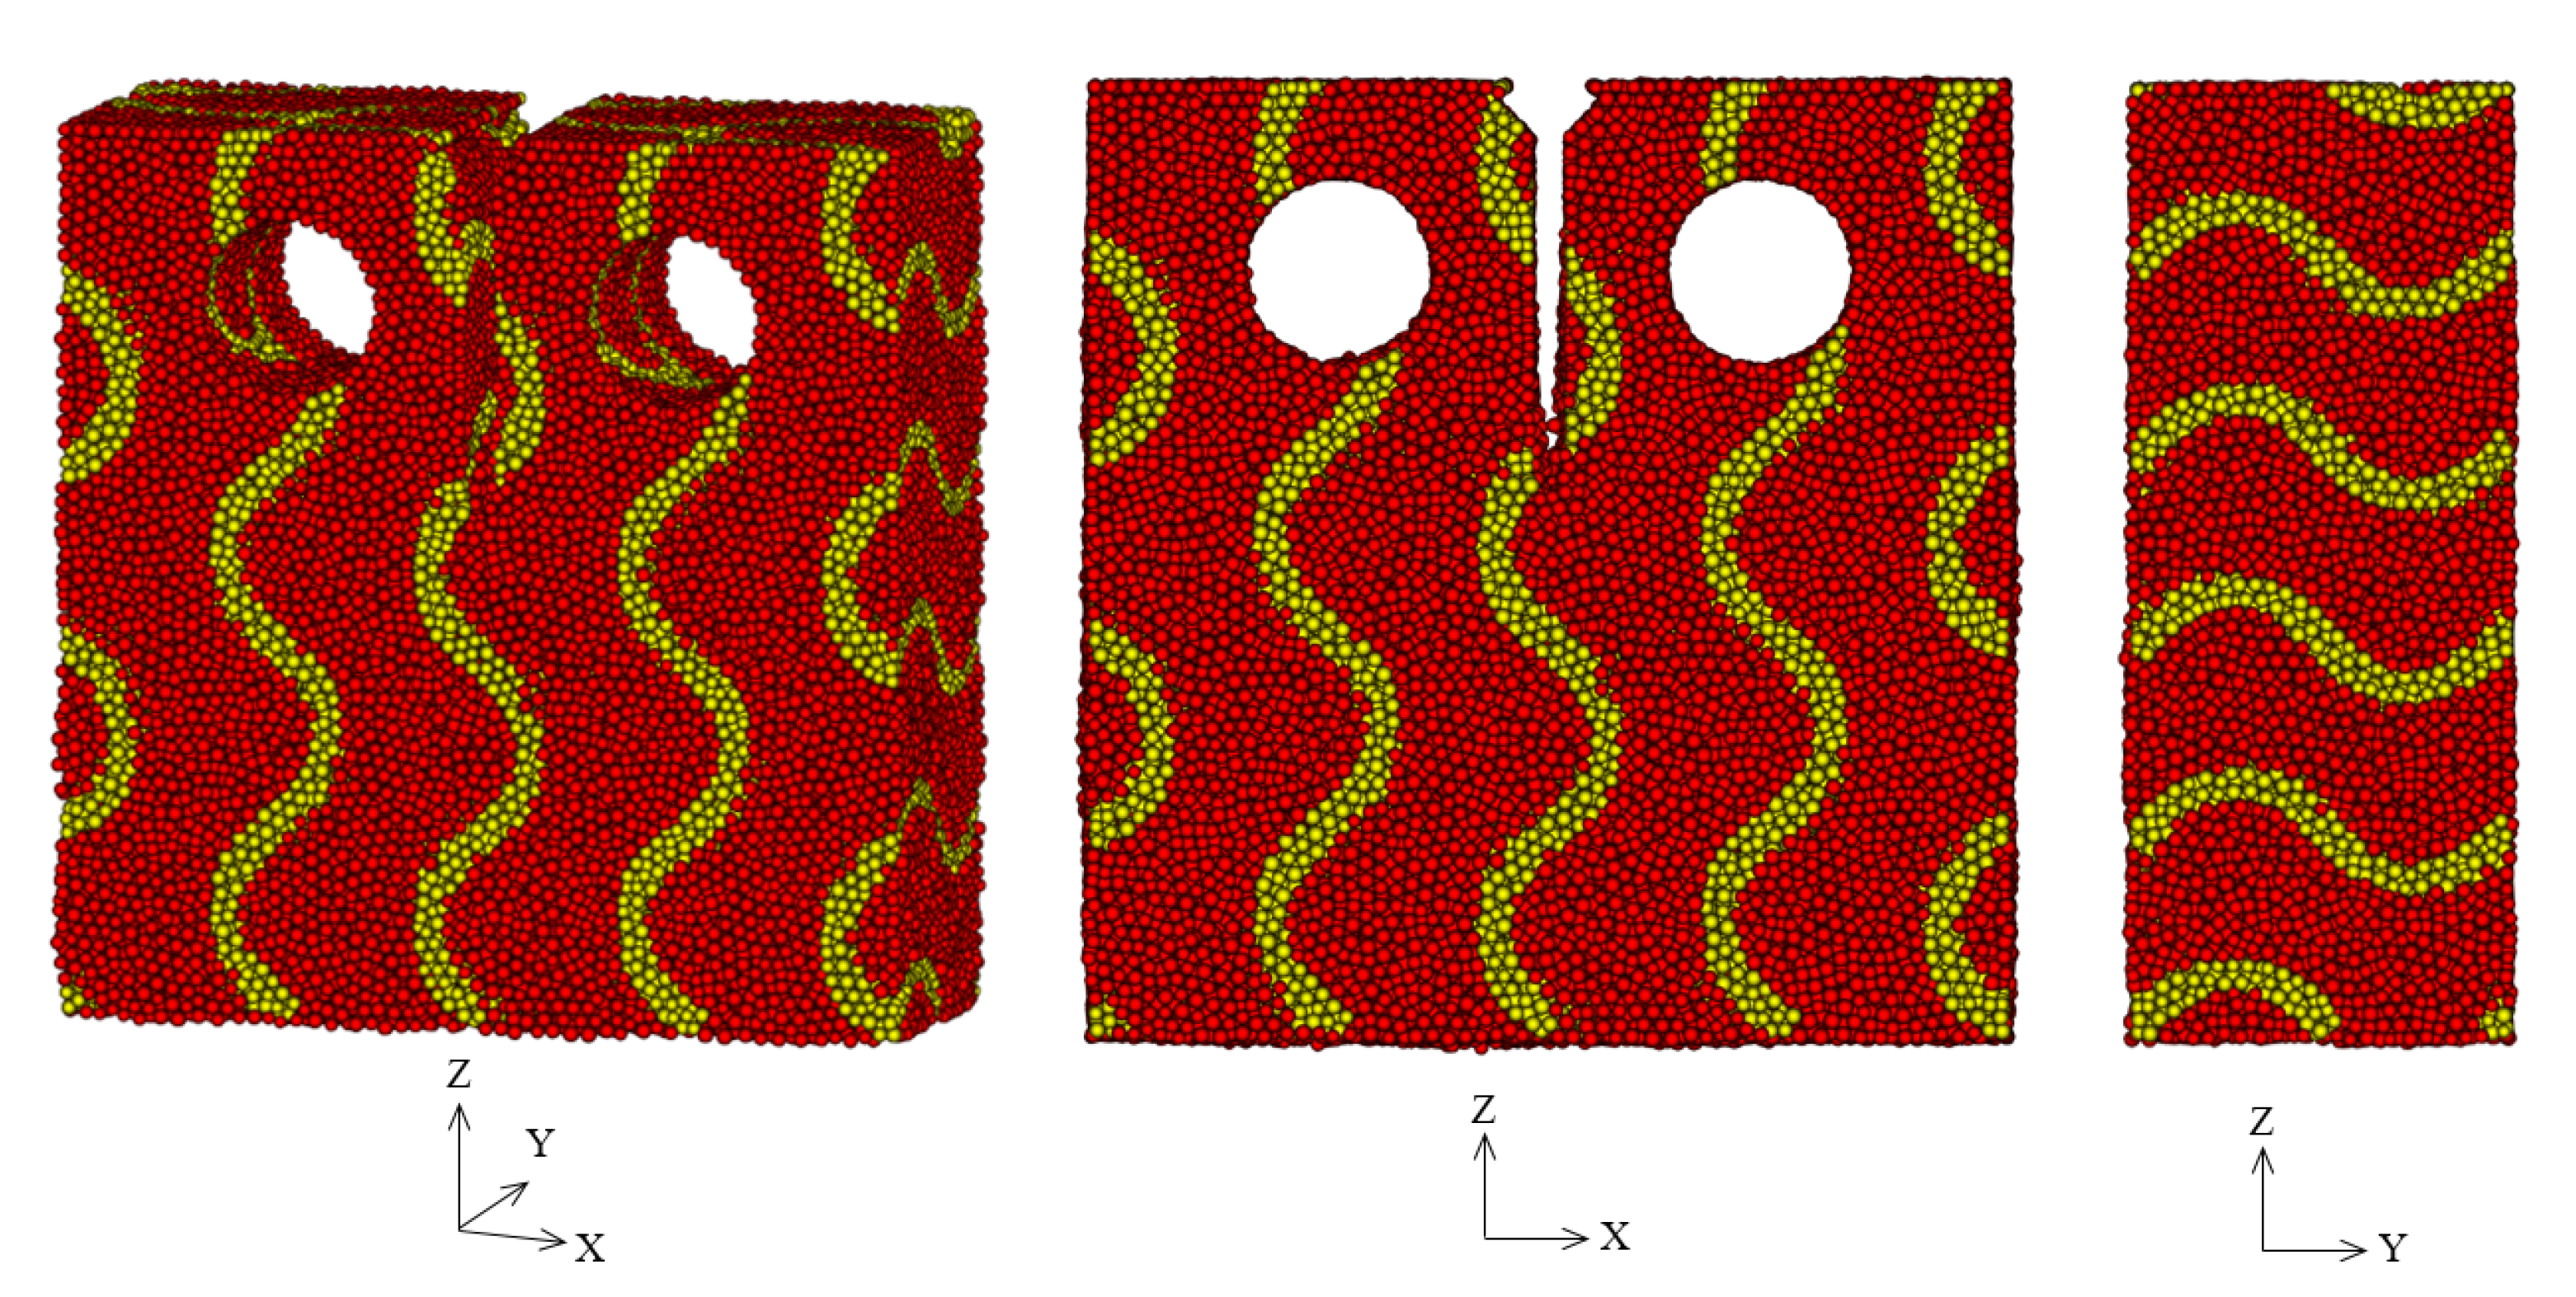
Figure 7.
Distribution of the discrete elements radius in a full MS CT specimen. The discrete elements have an average radius of 640 μm. Rigid pins are in both holes of the CT specimen.
Figure 7.
Distribution of the discrete elements radius in a full MS CT specimen. The discrete elements have an average radius of 640 μm. Rigid pins are in both holes of the CT specimen.

Figure 8.
Load-crack mouth displacement curves used for the determination of : experimental testing (a) and simulation (b).
Figure 8.
Load-crack mouth displacement curves used for the determination of : experimental testing (a) and simulation (b).
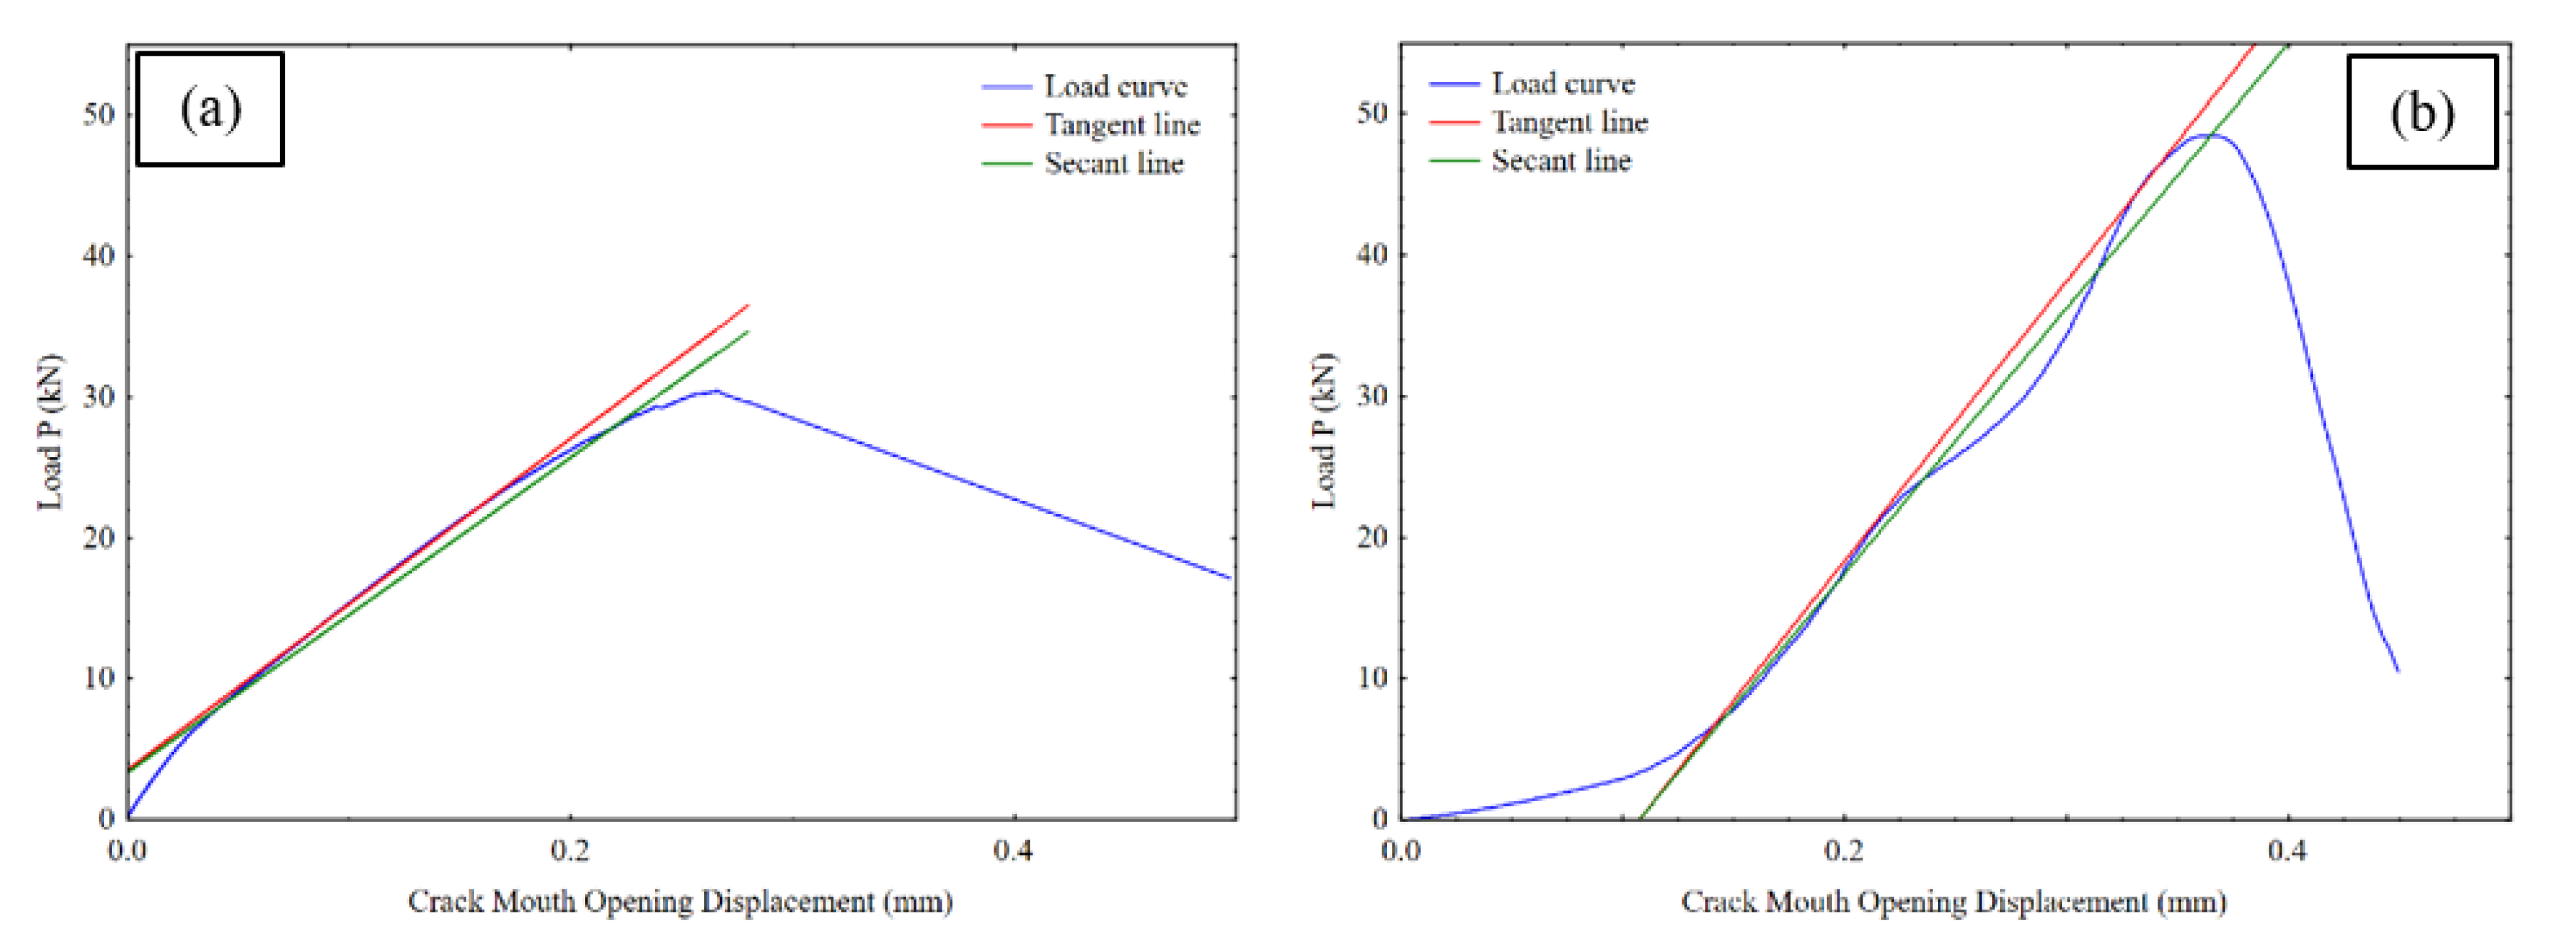
Figure 9.
Load-displacement curves obtained for the pre-cracking tests on full MS CT specimen.
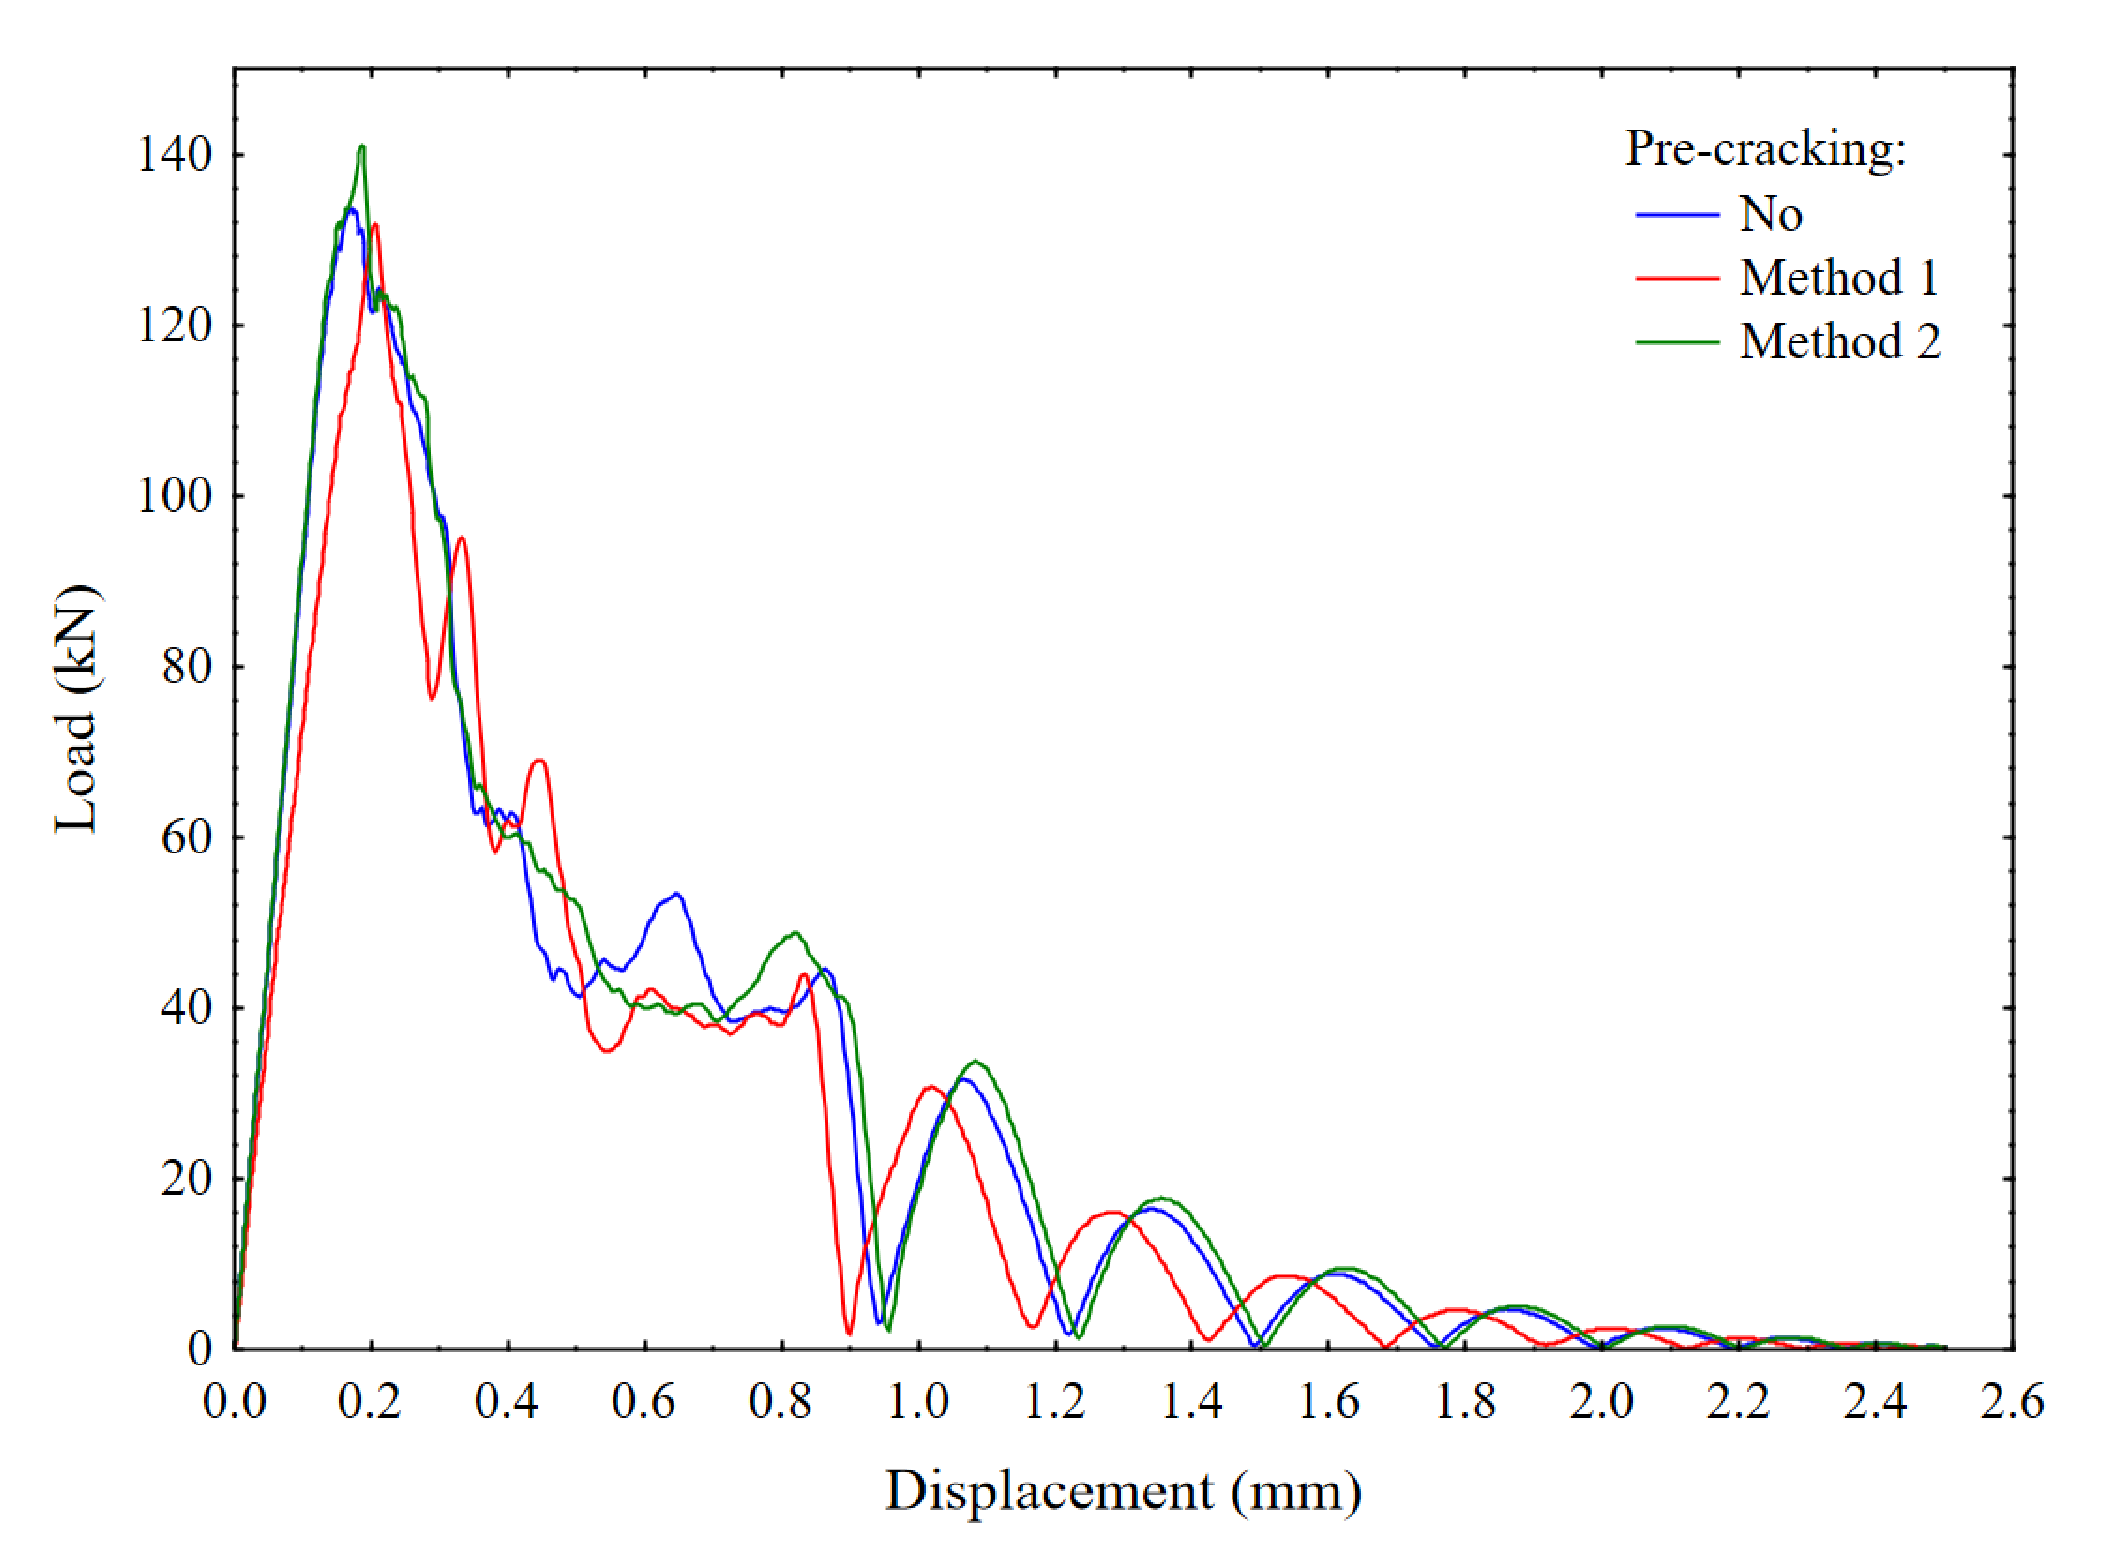
Figure 10.
Load (a), broken surface in the CT specimen (b) and total absorbed energy (c), versus displacement.
Figure 10.
Load (a), broken surface in the CT specimen (b) and total absorbed energy (c), versus displacement.
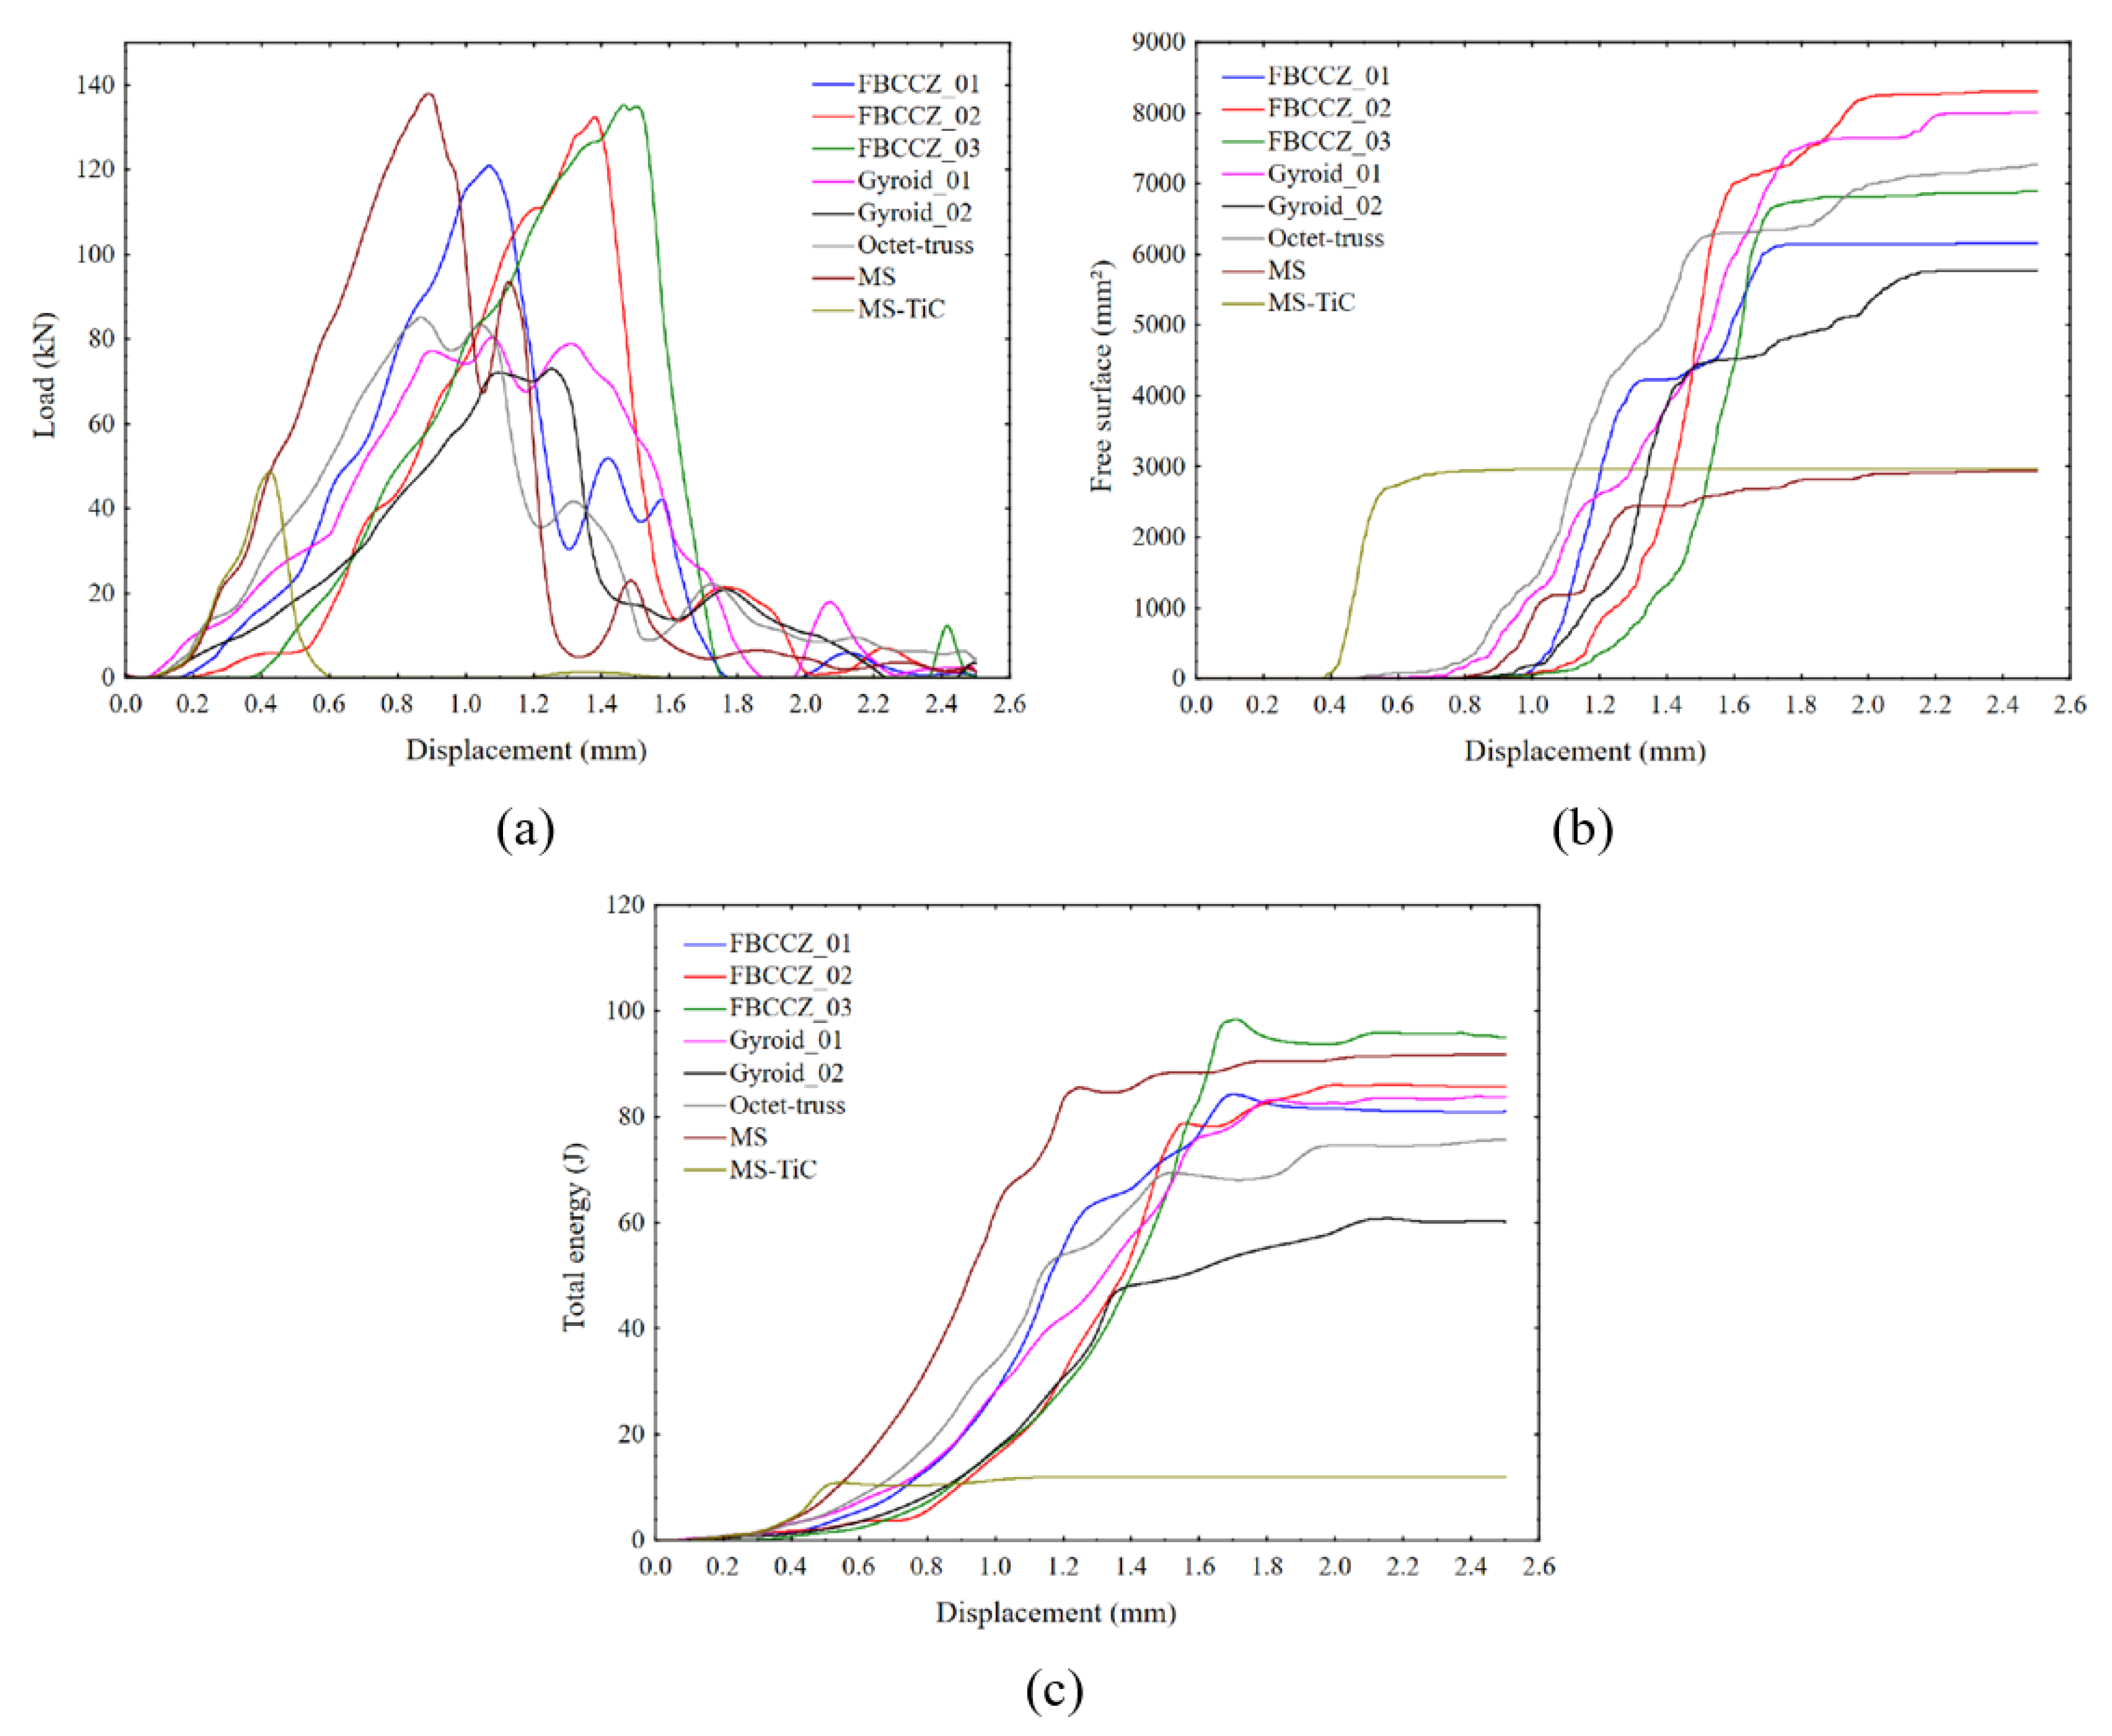
Figure 11.
Crack propagation in the full MS CT specimen (a) and in the full MS-TiC CT specimen (b).
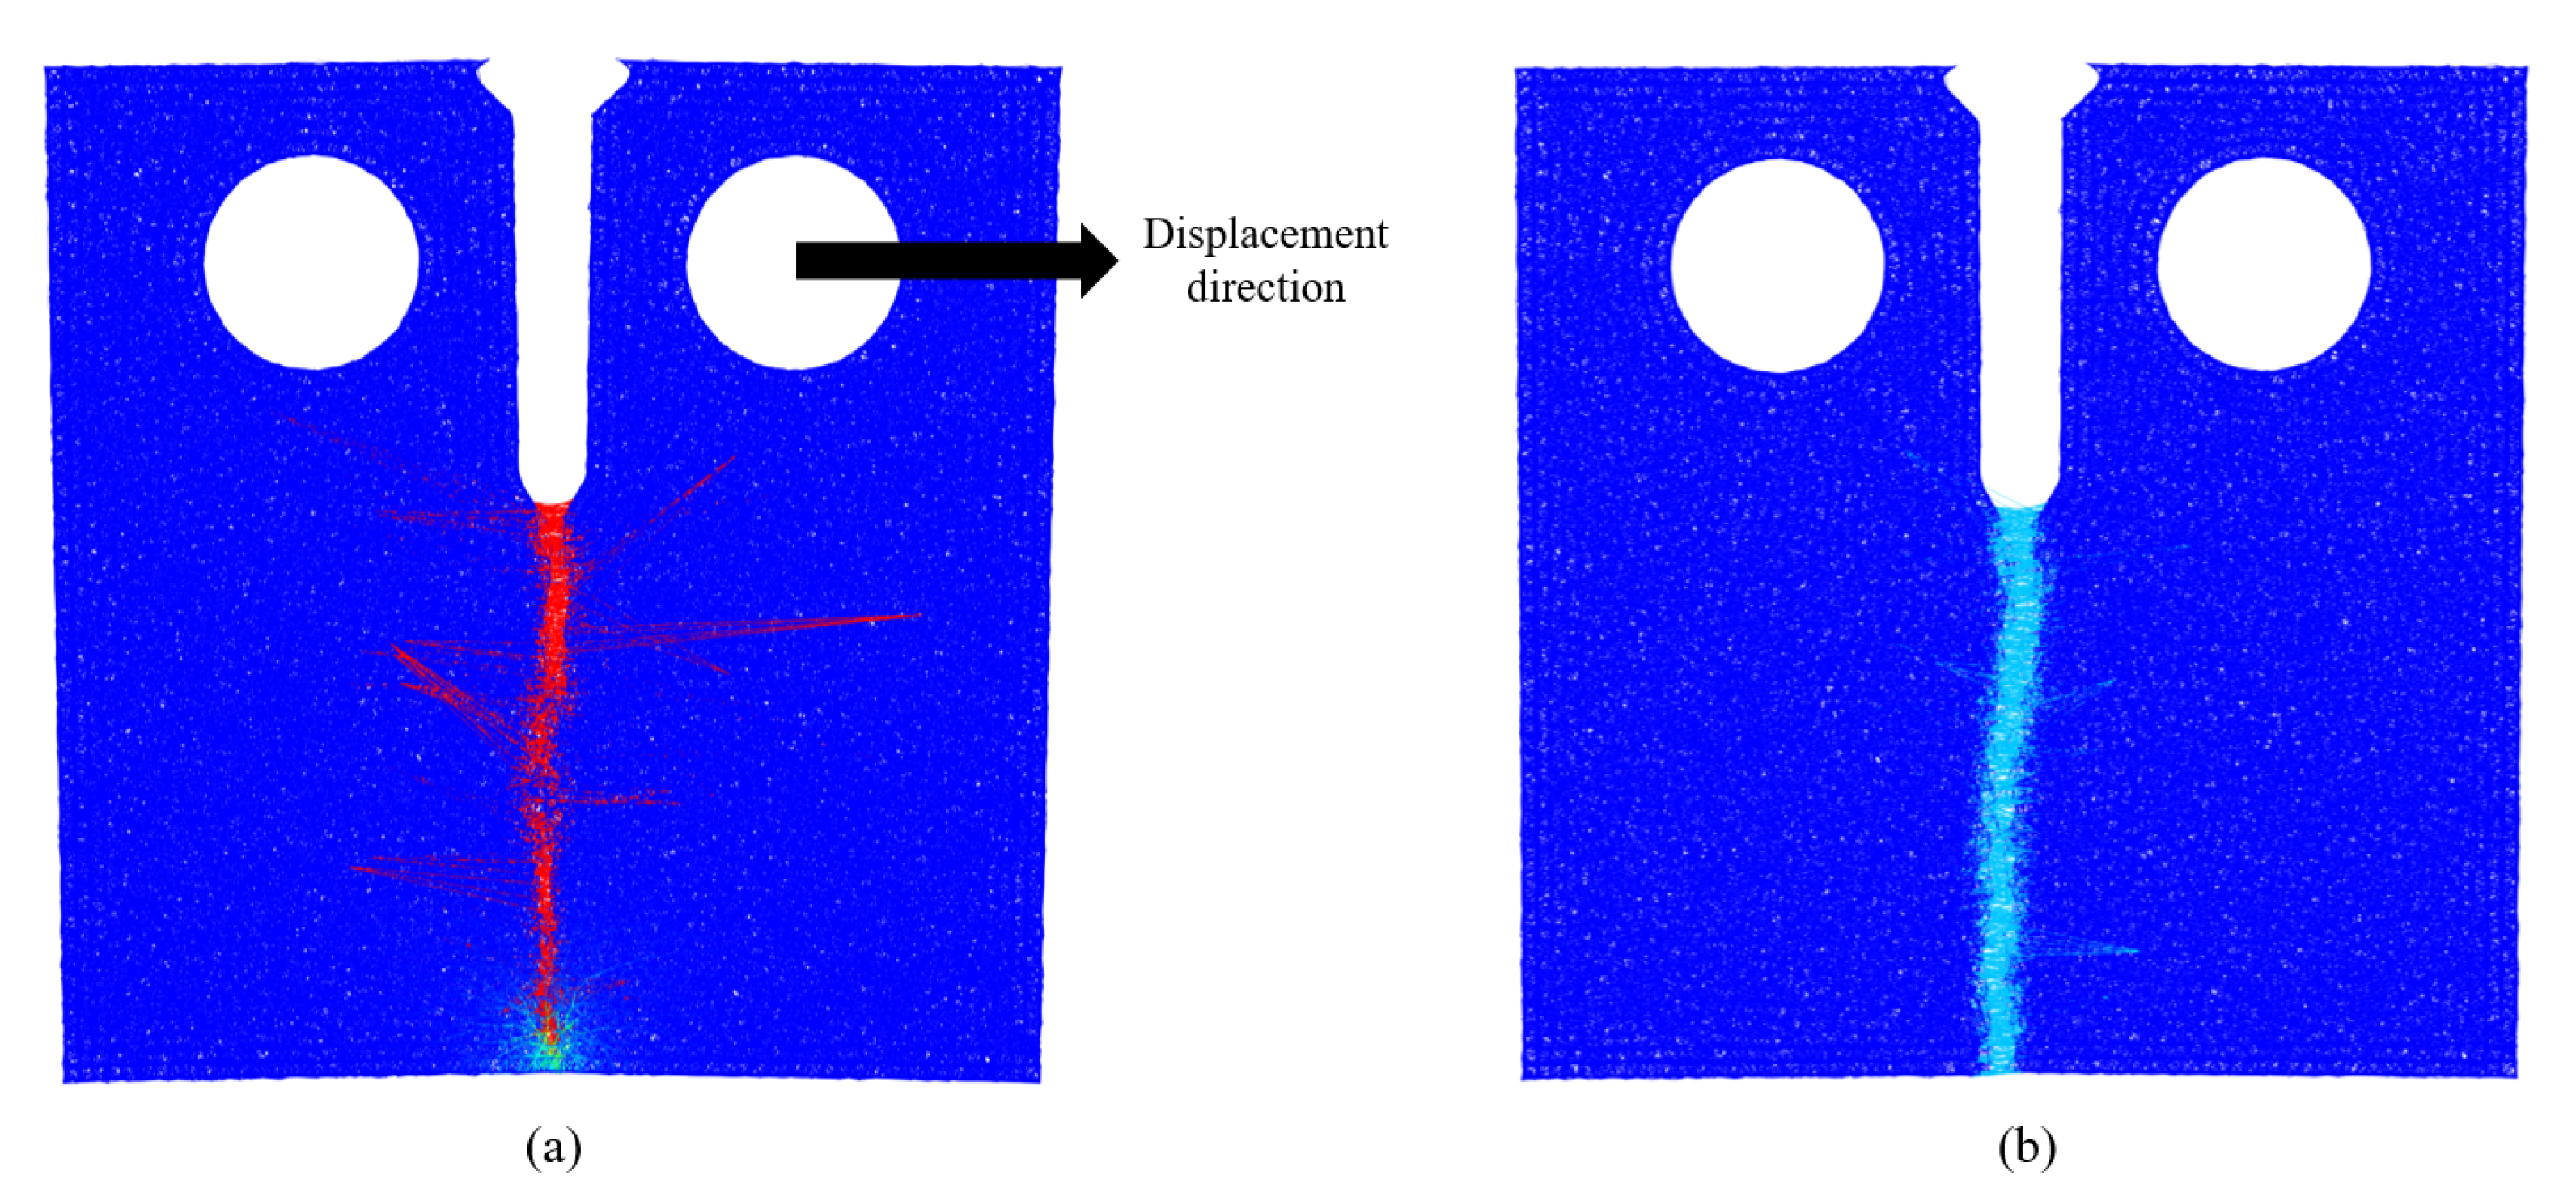
Figure 12.
Crack paths in the MS-TiC inserts according to the failure stress of the DEM bonds. The blue color of the bonds corresponds to the MS-TiC failure stress. Gyroid_01 (a), Gyroid_02 (b), octet-truss (c), FBCZZ_01 (d), FBCCZ_02 (e) and FBCCZ_03 (f).
Figure 12.
Crack paths in the MS-TiC inserts according to the failure stress of the DEM bonds. The blue color of the bonds corresponds to the MS-TiC failure stress. Gyroid_01 (a), Gyroid_02 (b), octet-truss (c), FBCZZ_01 (d), FBCCZ_02 (e) and FBCCZ_03 (f).
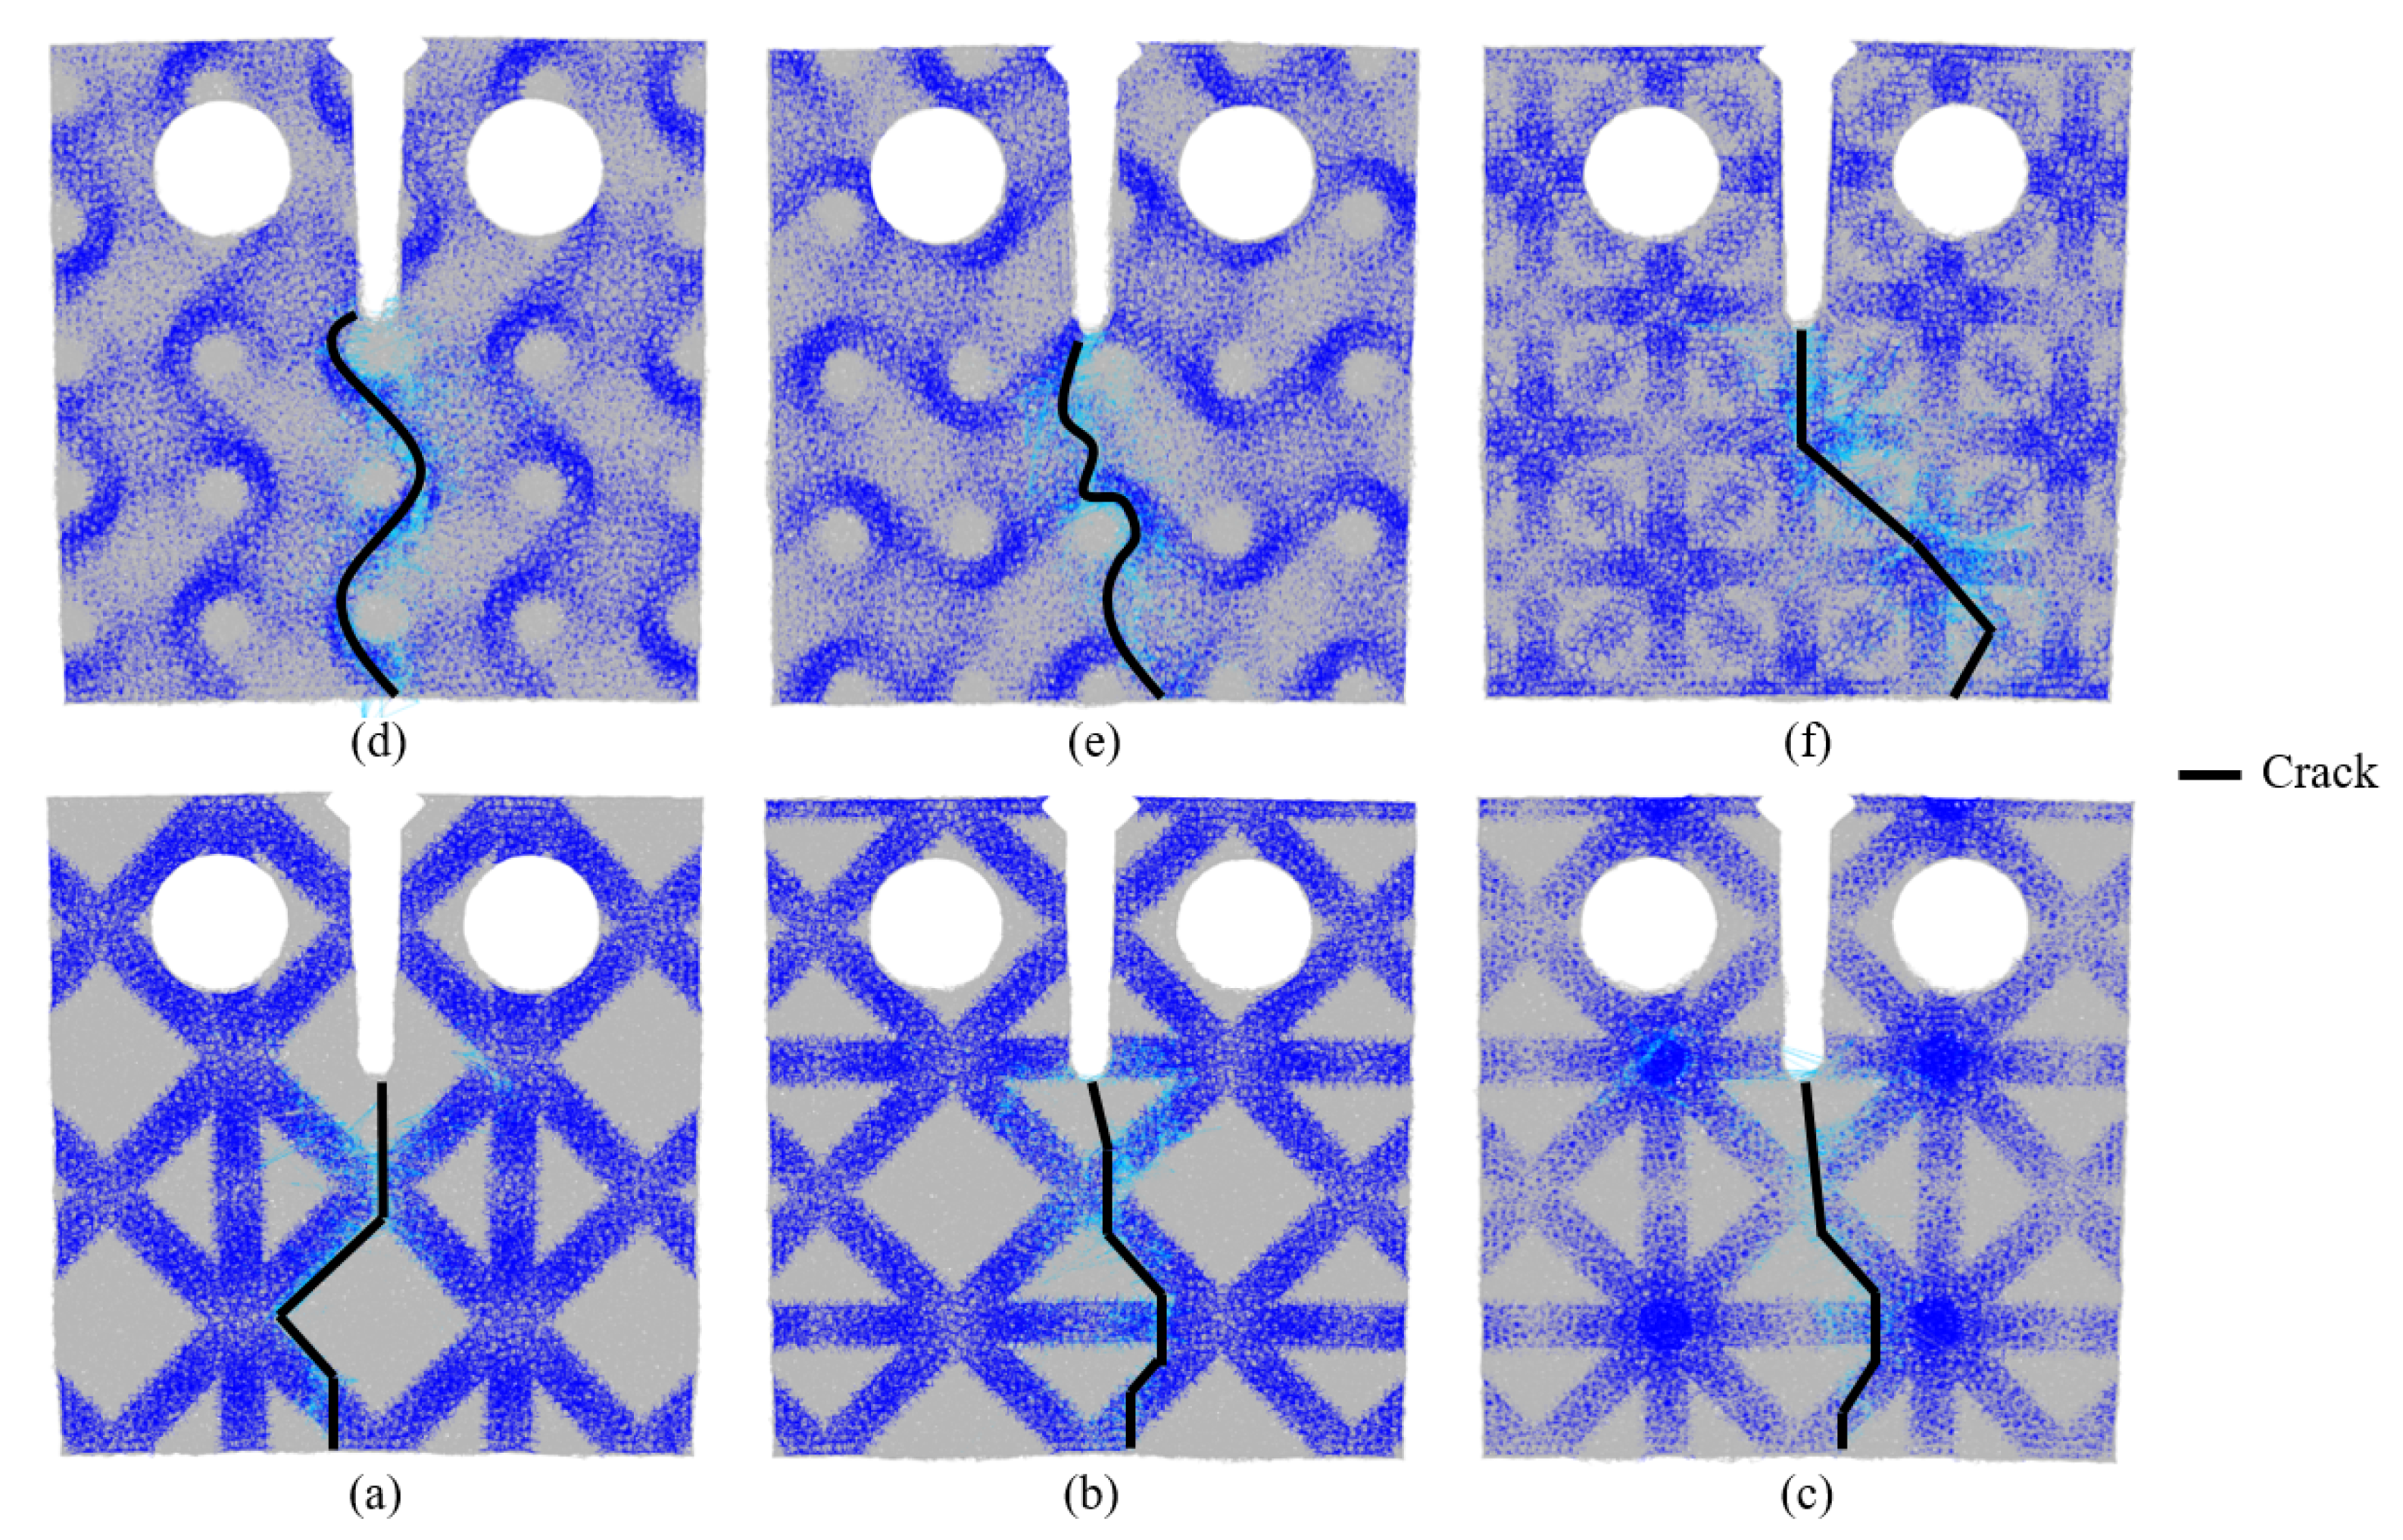
Figure 13.
Crack paths in the metal which surrounds the MS-TiC topologies (MS) according to the failure stress of the DEM bonds. The red color of the bonds corresponds to the MS failure stress. Gyroid_01 (a), Gyroid_02 (b), octet-truss (c), FBCZZ_01 (d), FBCCZ_02 (e) and FBCCZ_03 (f).
Figure 13.
Crack paths in the metal which surrounds the MS-TiC topologies (MS) according to the failure stress of the DEM bonds. The red color of the bonds corresponds to the MS failure stress. Gyroid_01 (a), Gyroid_02 (b), octet-truss (c), FBCZZ_01 (d), FBCCZ_02 (e) and FBCCZ_03 (f).
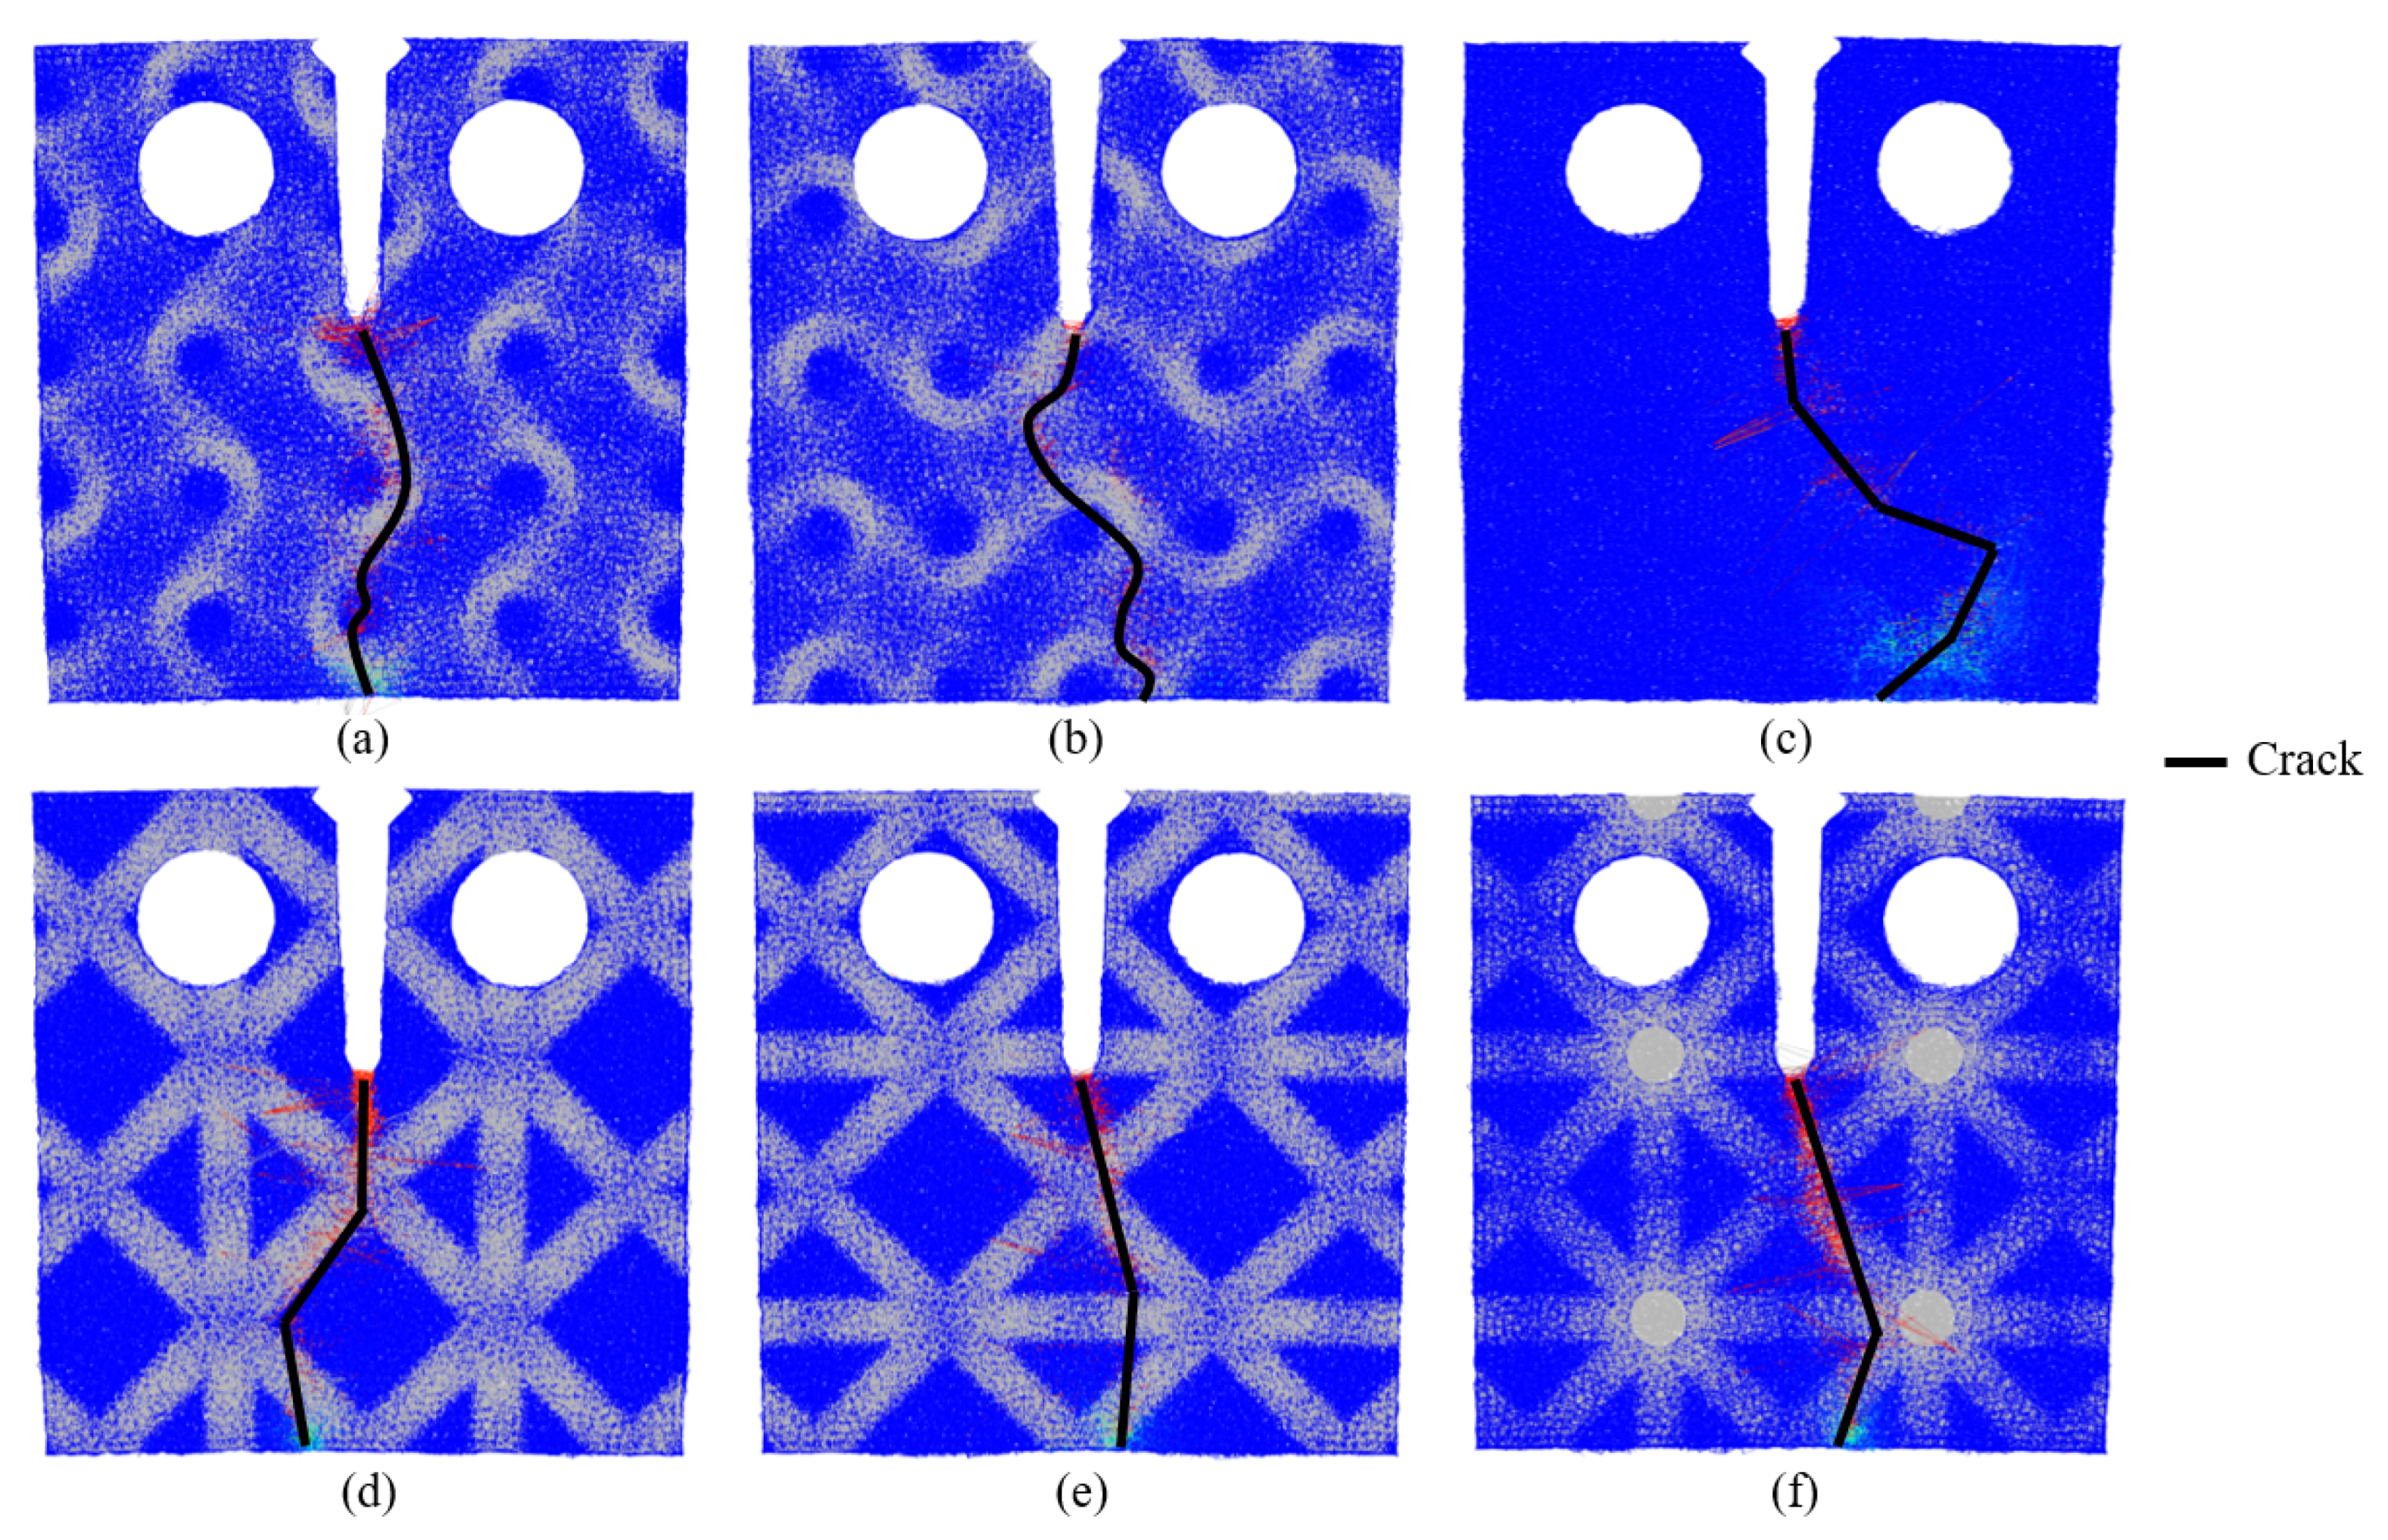
Figure 14.
Crack path in the MS of a CT specimen containing a MS-TiC cylindrical reinforcement (a) and in the MS-TiC cylindrical insert (b).
Figure 14.
Crack path in the MS of a CT specimen containing a MS-TiC cylindrical reinforcement (a) and in the MS-TiC cylindrical insert (b).
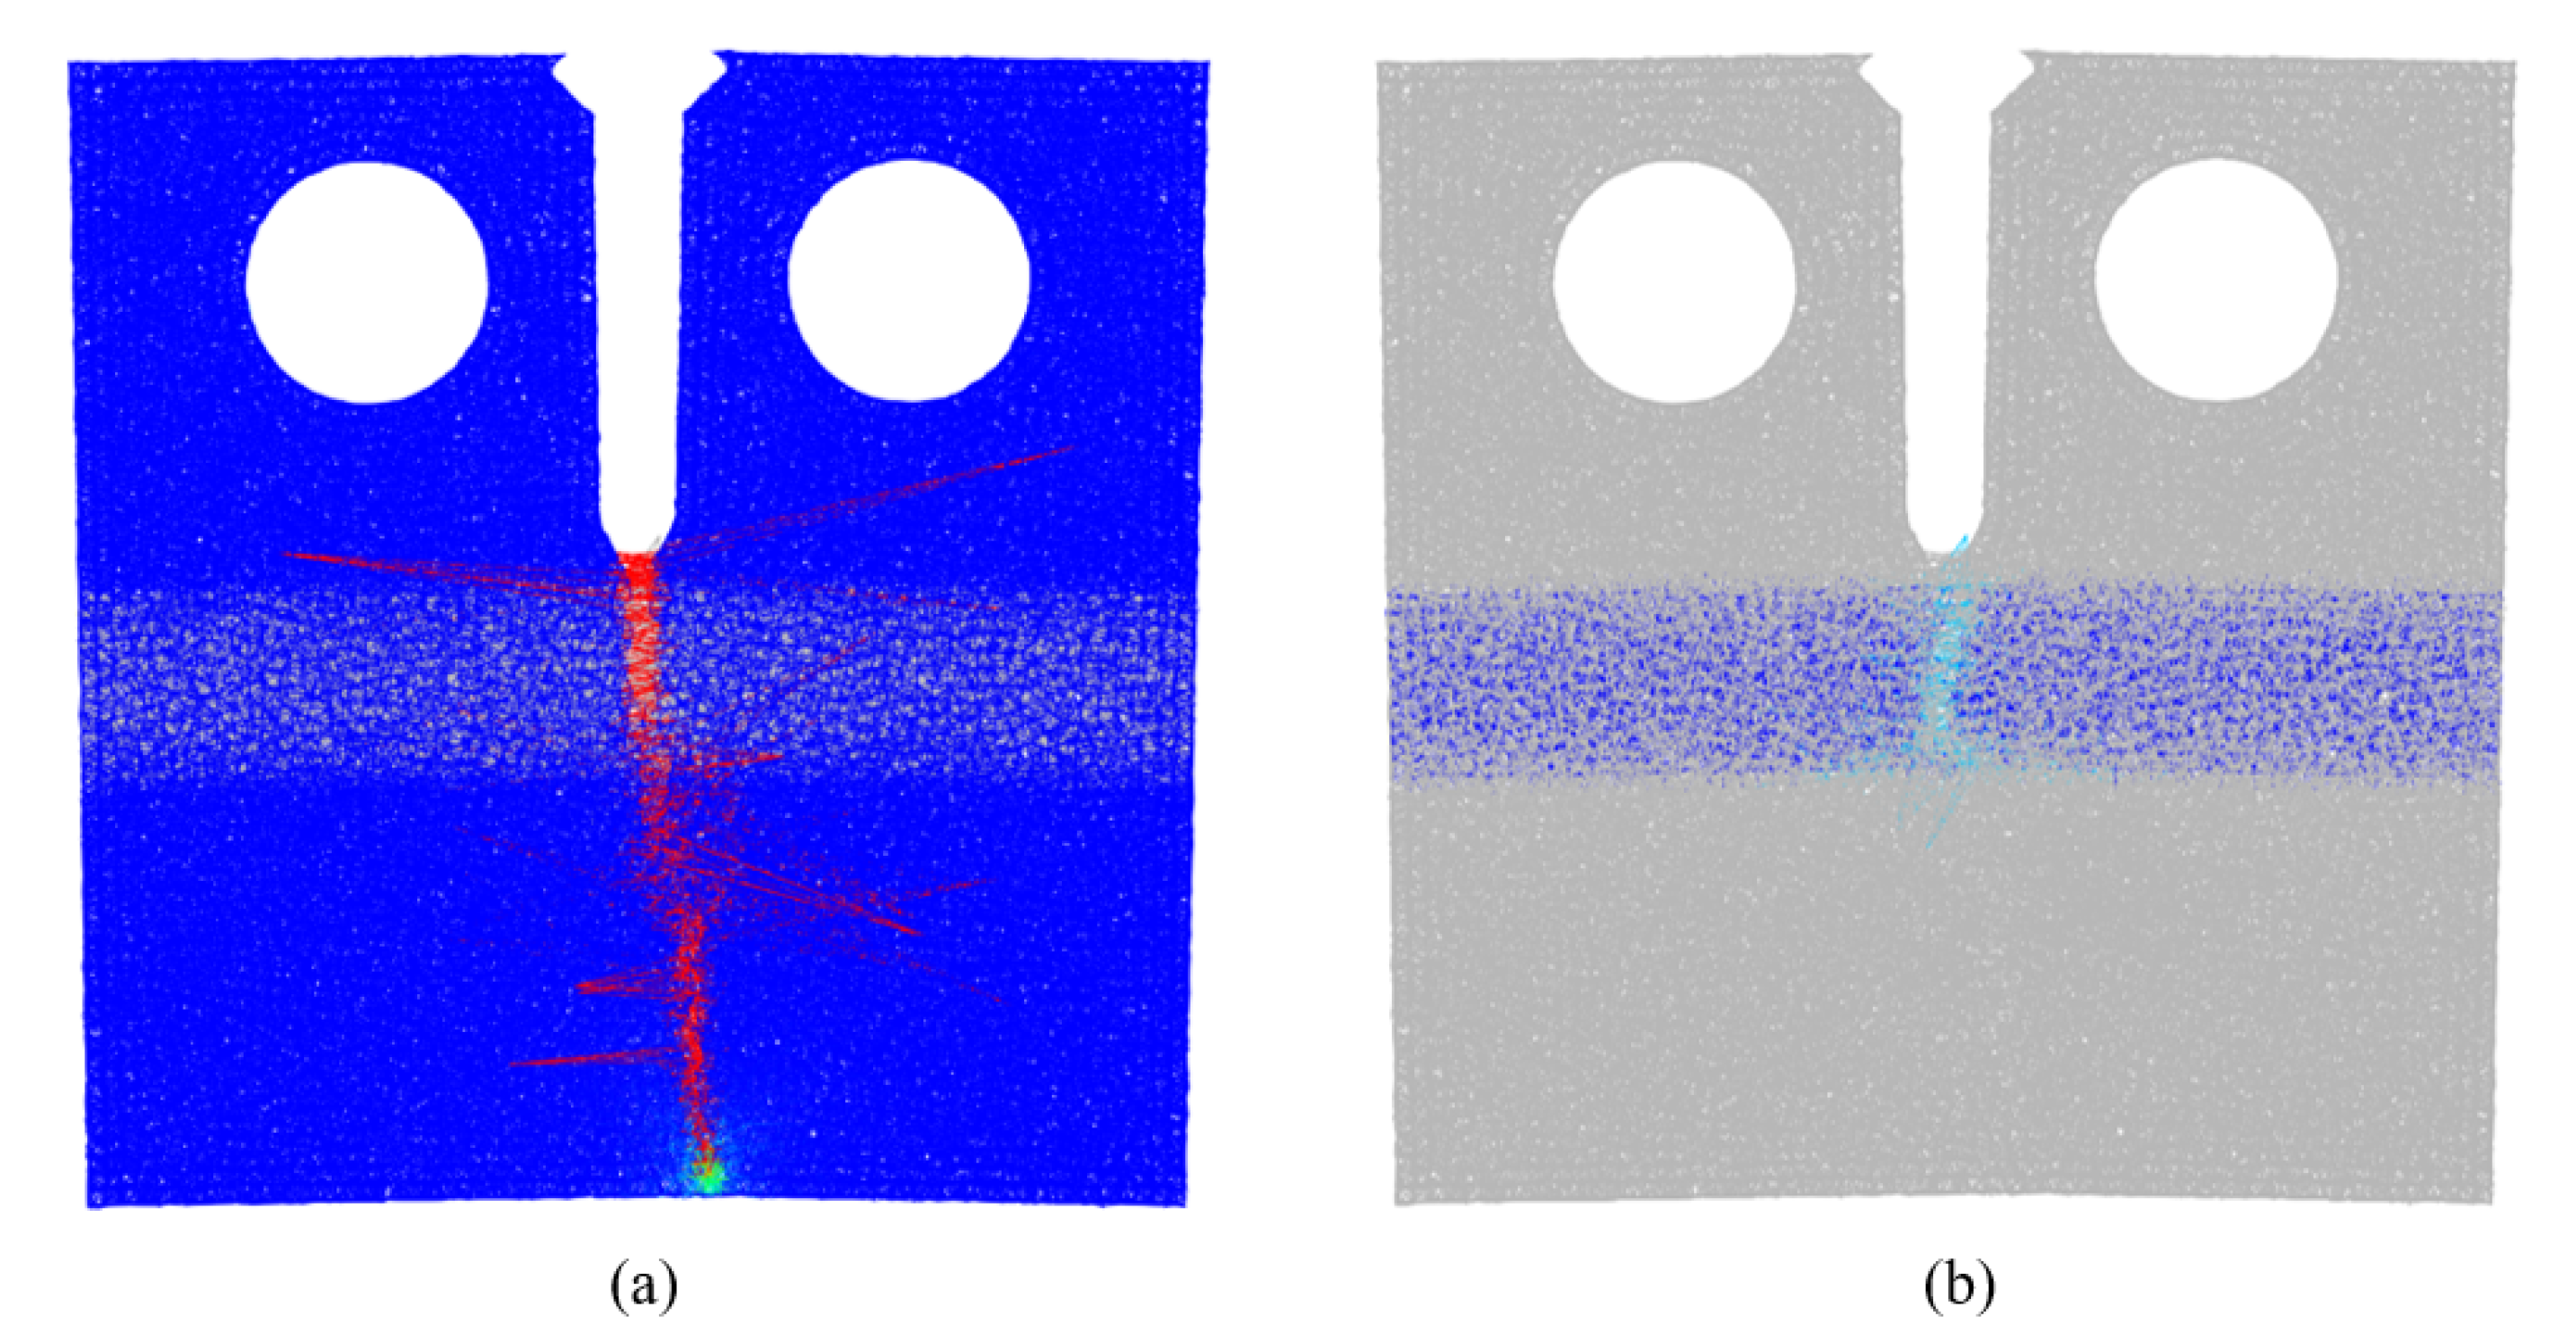
Figure 15.
Broken bonds at the MS-TiC insert/MS interface. Gyroid_01 (a), Gyroid_02 (b), octet-truss (c), FBCZZ_01 (d), FBCCZ_02 (e) and FBCCZ_03 (f).
Figure 15.
Broken bonds at the MS-TiC insert/MS interface. Gyroid_01 (a), Gyroid_02 (b), octet-truss (c), FBCZZ_01 (d), FBCCZ_02 (e) and FBCCZ_03 (f).

Table 1.
Mechanical properties of the materials used in this study.
| Test Method | MS | MS-TiC | |
|---|---|---|---|
| Young’s modulus () | Impulsive excitation (ASTM C1259 [31]) | 203 | 230 |
| Poisson’s ratio | Impulsive excitation (ASTM C1259 [31]) | 0.29 | 0.26 |
| Strength () | Tensile (steel) / Three-points bending (MMC) | 1560 | 538 |
| Fracture toughness () | Pre-cracked CT (ASTM E399 [16]) | 105 | 35 |
Table 2.
Identified parameters of the beams for the steel and Metal Matrix Composite.
| MS | MS-TiC | |
|---|---|---|
| Elastic modulus of the bonds (, ) | 5053 | 3098 |
| Radius ratio of the bonds (, no unit) | 0.34 | 0.43 |
| Failure stress of the bonds (, ) | 31.85 | 6.24 |
Table 3.
Mechanical response of each specimen configuration at the maximum load.
| Topology | Load for Crack | Free Surface | Total Absorbed | Energy per Unit | |
|---|---|---|---|---|---|
| Opening (N) | (mm2) | Energy (J) | Area (KJ m−2) | ||
| MS-TiC/MS | Gyroid_01 | 80,471 | 8011 | 84 | 66 |
| Gyroid_02 | 73,032 | 5773 | 60 | 48 | |
| Octet-truss | 85,269 | 7278 | 76 | 60 | |
| FBCCZ_01 | 121,081 | 6157 | 81 | 64 | |
| FBCCZ_02 | 132,487 | 8298 | 86 | 68 | |
| FBCCZ_03 | 135,374 | 6897 | 95 | 75 | |
| MS-TiC | no structure | 48,450 | 2963 | 12 | 10 |
| MS | no structure | 138,035 | 2940 | 92 | 73 |
© 2020 by the authors. Licensee MDPI, Basel, Switzerland. This article is an open access article distributed under the terms and conditions of the Creative Commons Attribution (CC BY) license (http://creativecommons.org/licenses/by/4.0/).
Share and Cite
MDPI and ACS Style
Lemesle, J.; Hubert, C.; Bigerelle, M. Numerical Study of the Toughness of Complex Metal Matrix Composite Topologies. Appl. Sci. 2020, 10, 6250. https://doi.org/10.3390/app10186250
AMA Style
Lemesle J, Hubert C, Bigerelle M. Numerical Study of the Toughness of Complex Metal Matrix Composite Topologies. Applied Sciences. 2020; 10(18):6250. https://doi.org/10.3390/app10186250
Chicago/Turabian StyleLemesle, Julie, Cedric Hubert, and Maxence Bigerelle. 2020. "Numerical Study of the Toughness of Complex Metal Matrix Composite Topologies" Applied Sciences 10, no. 18: 6250. https://doi.org/10.3390/app10186250
Note that from the first issue of 2016, this journal uses article numbers instead of page numbers. See further details here.