DronAway: A Proposal on the Use of Remote Sensing Drones as Mobile Gateway for WSN in Precision Agriculture

 , , , and
Abstract
:1. Introduction
2. Related Work
3. Materials and Methods
3.1. Drone Parameters
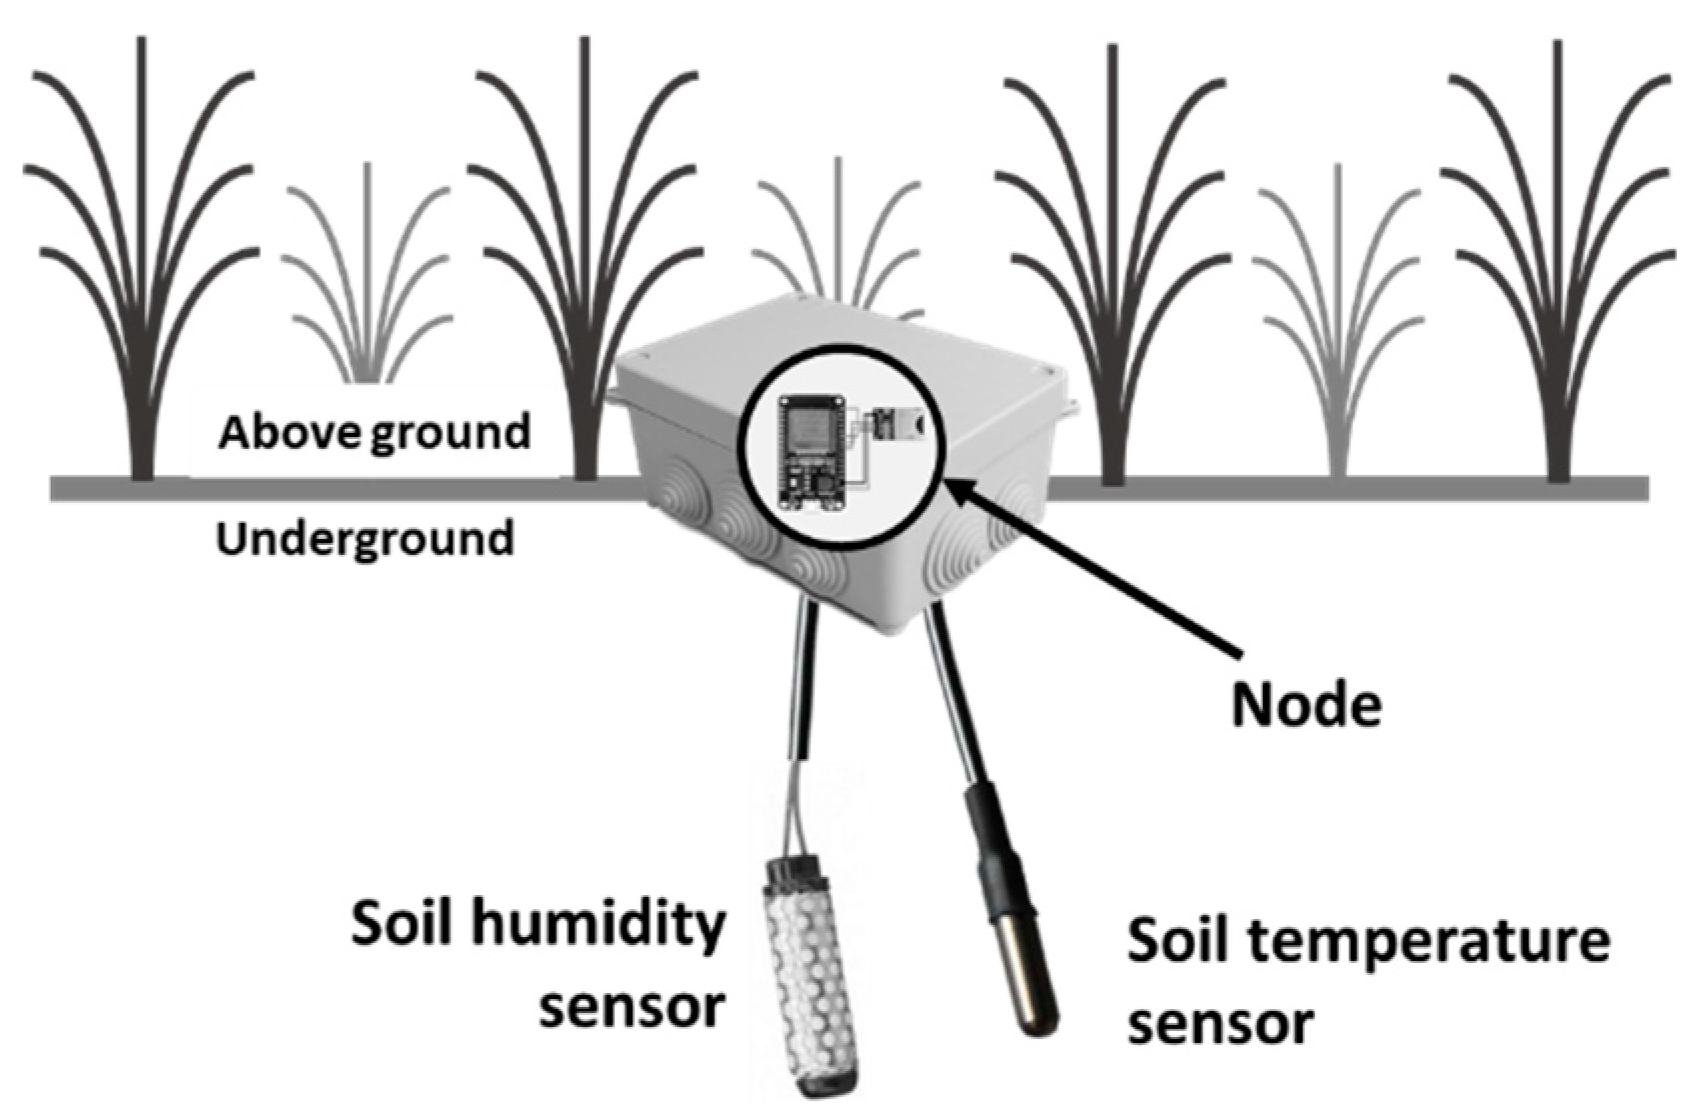
3.2. Low-Cost Nodes for Precision Agriculture Deployments
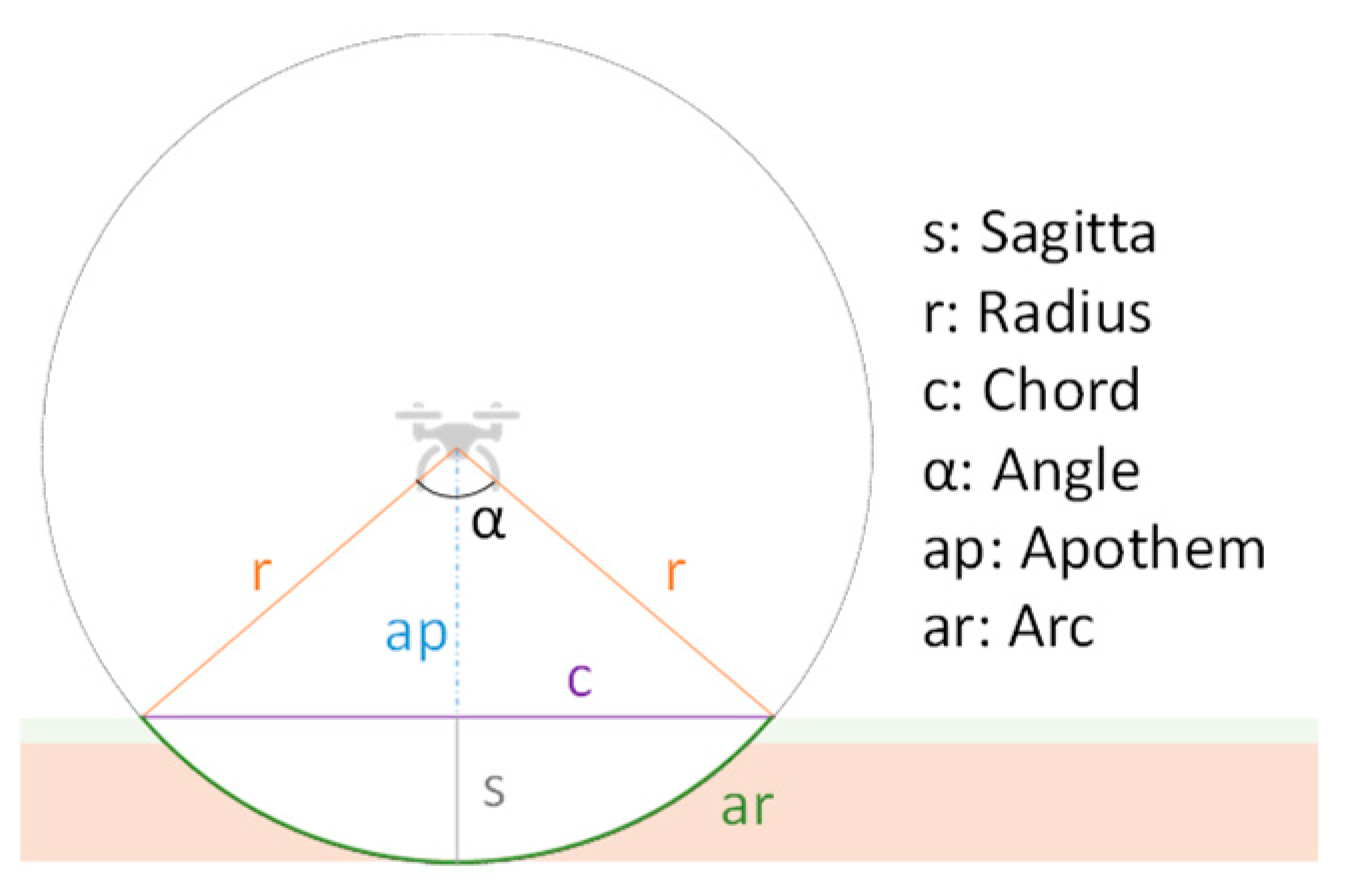
3.3. Antenna Radiation Model
4. System Description
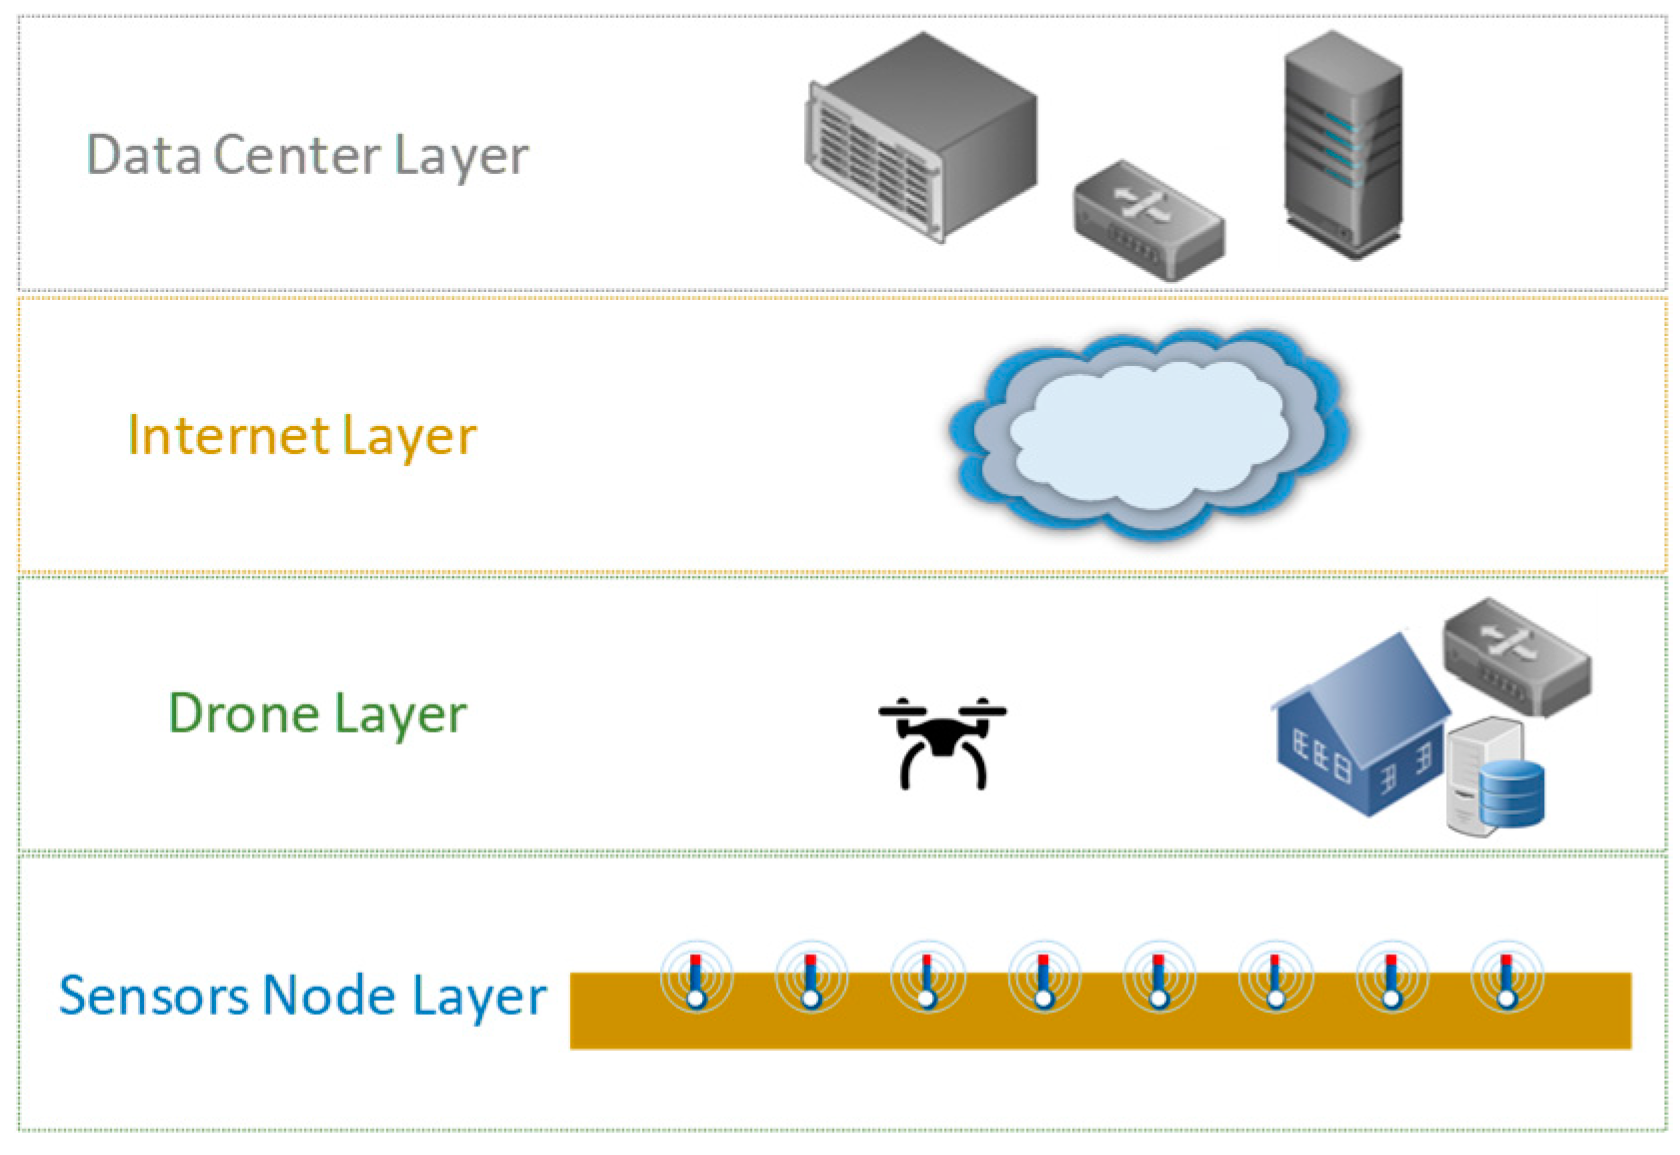
4.1. Architecture
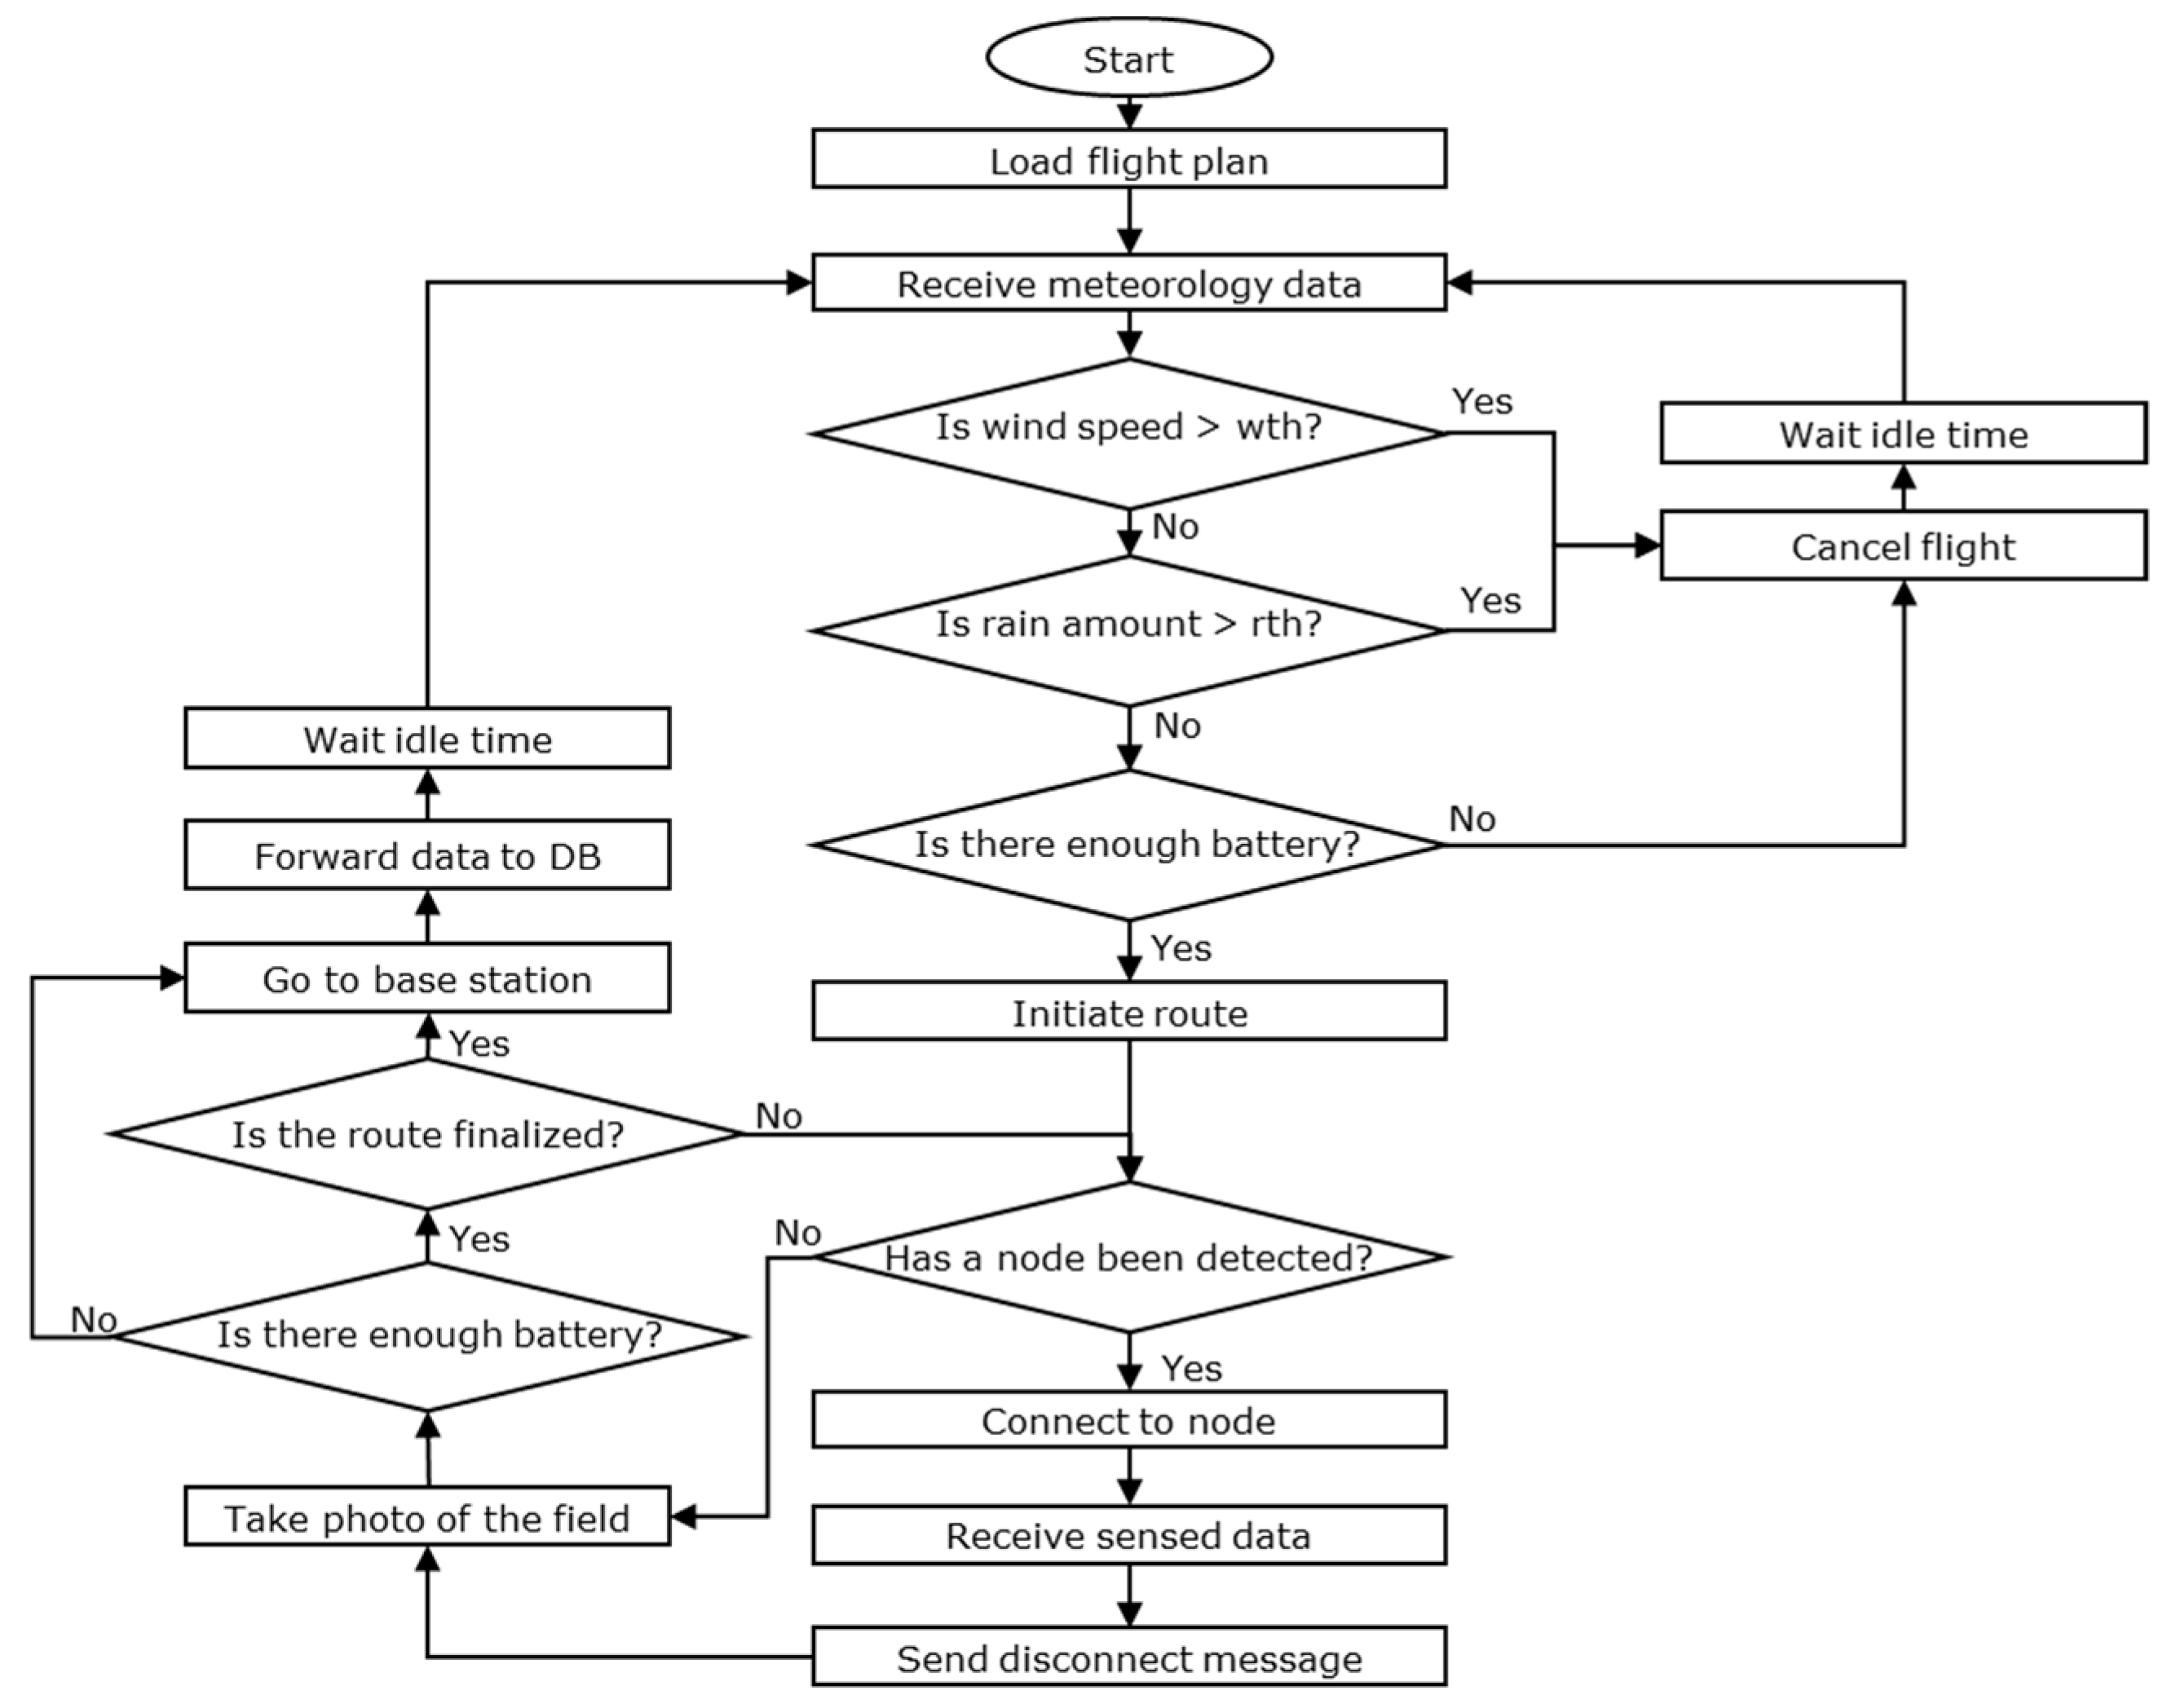
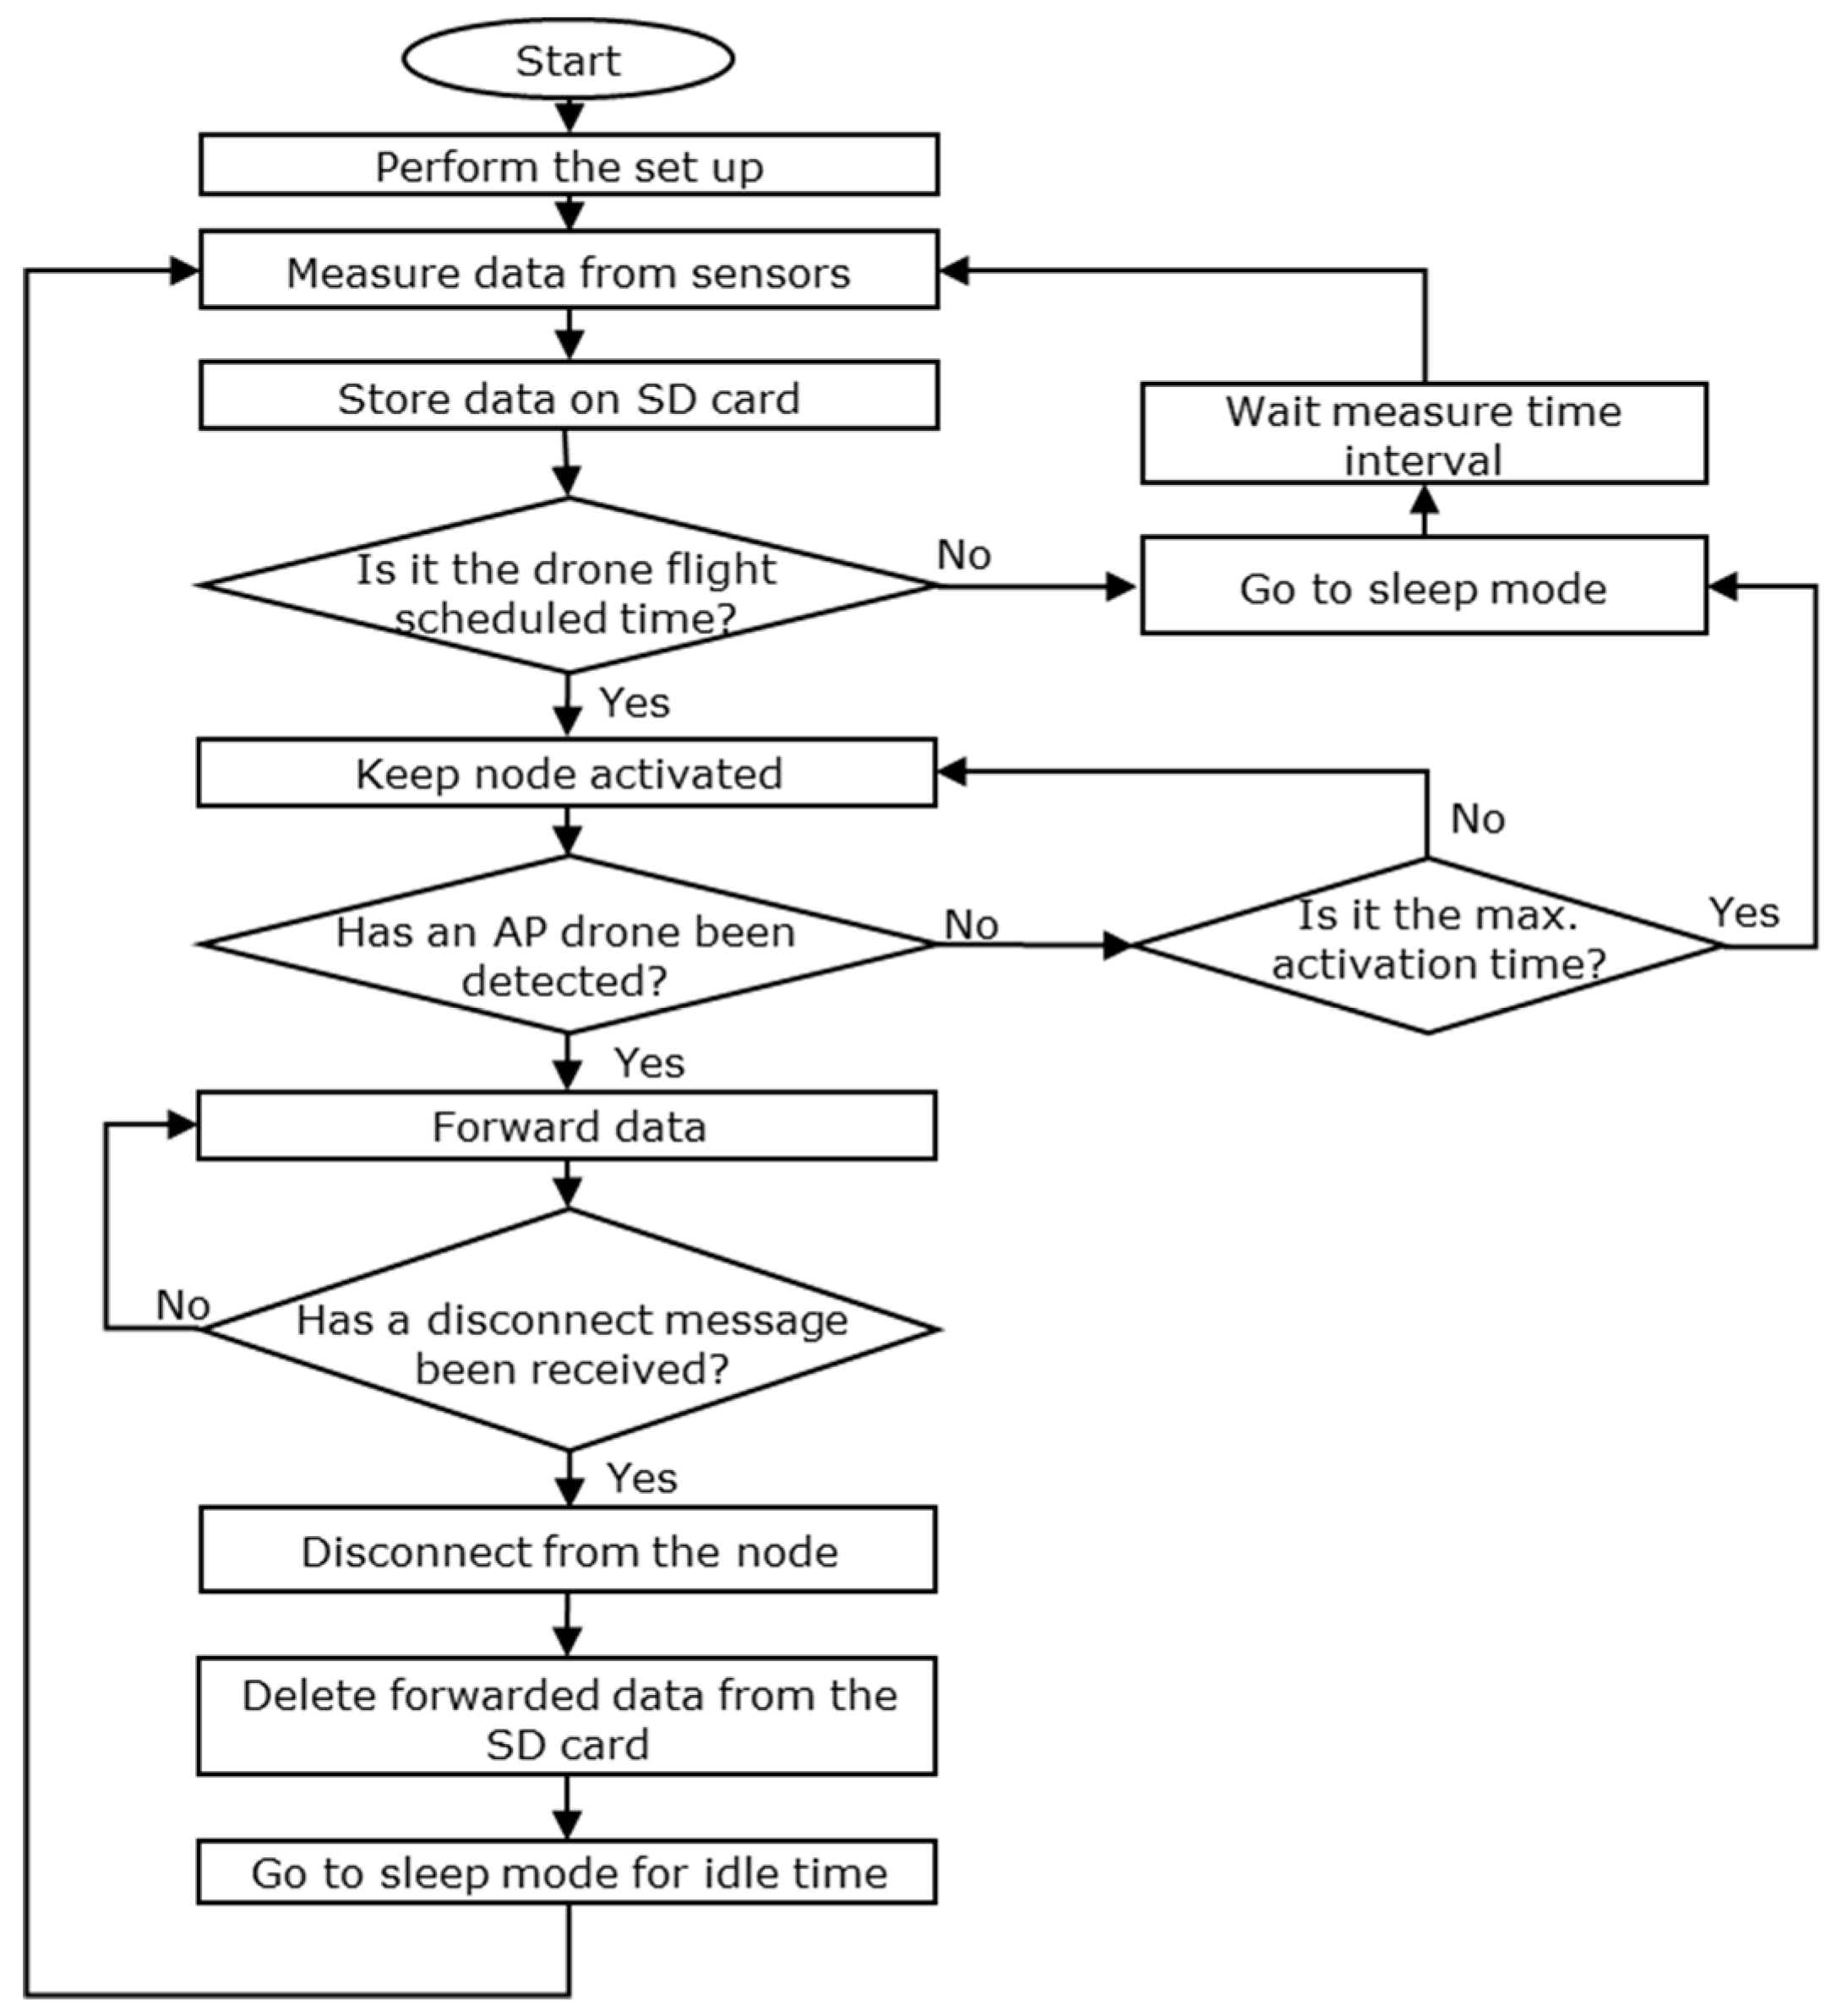
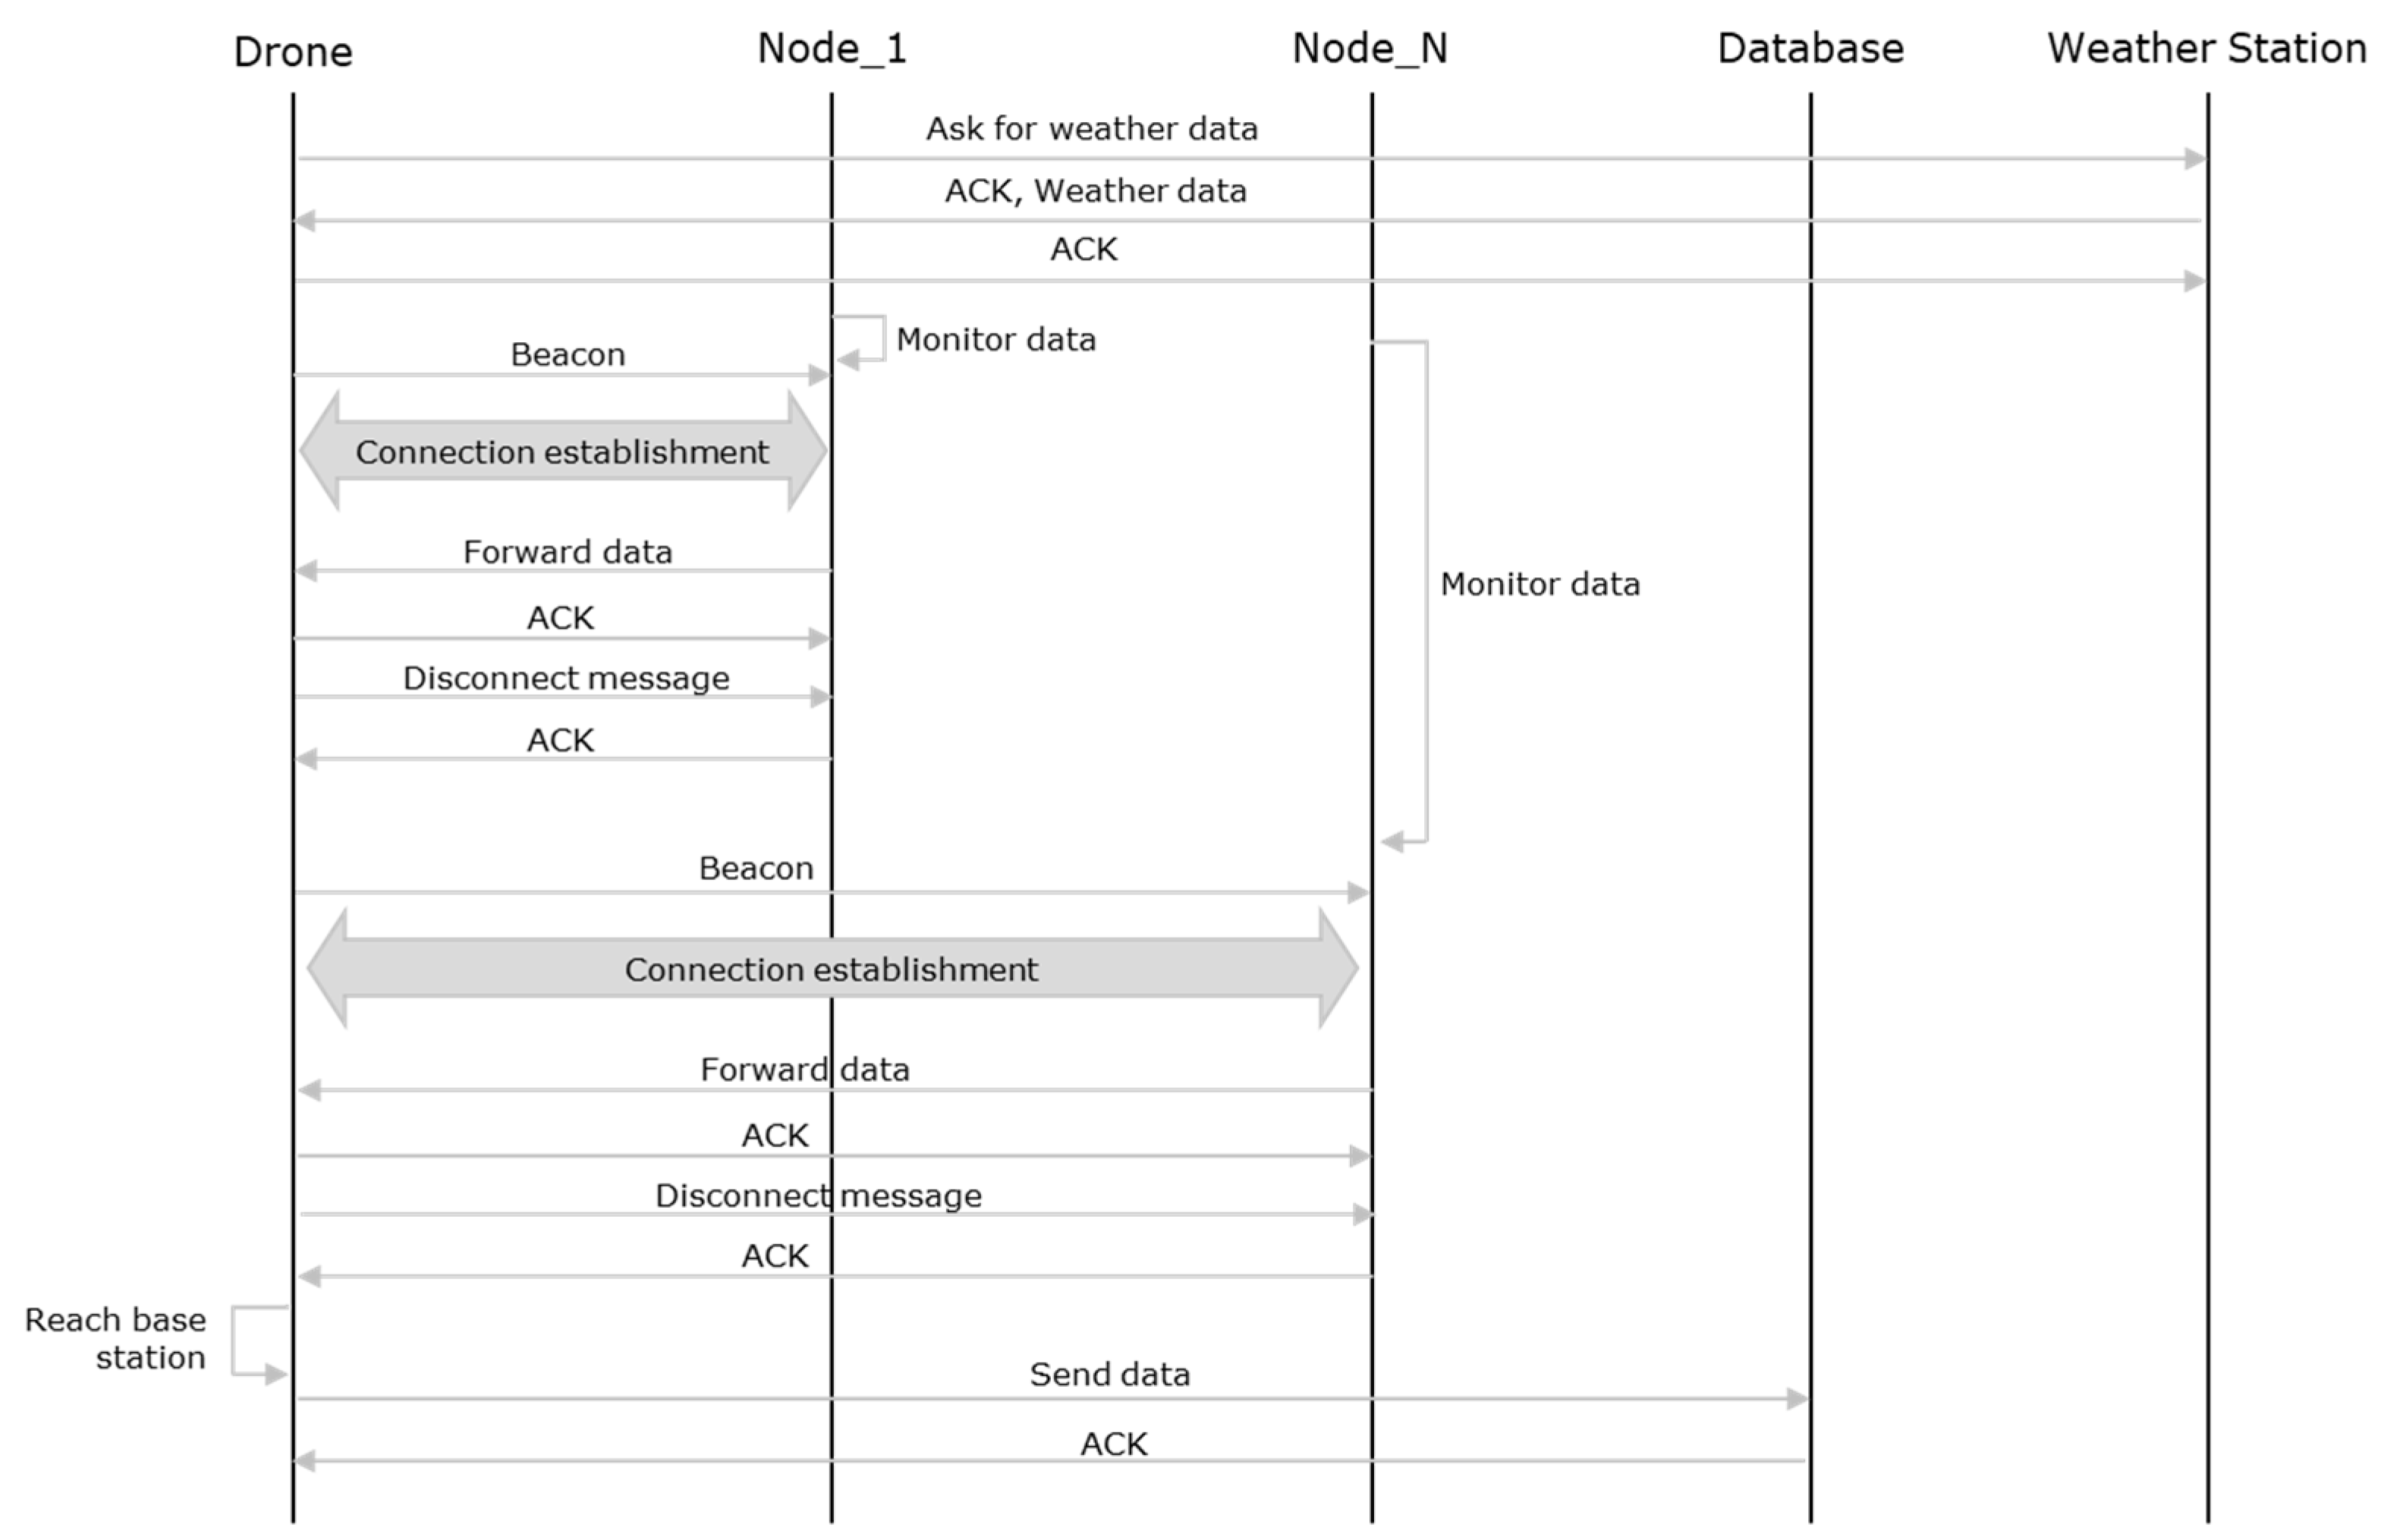
4.2. Algorithm
5. Results
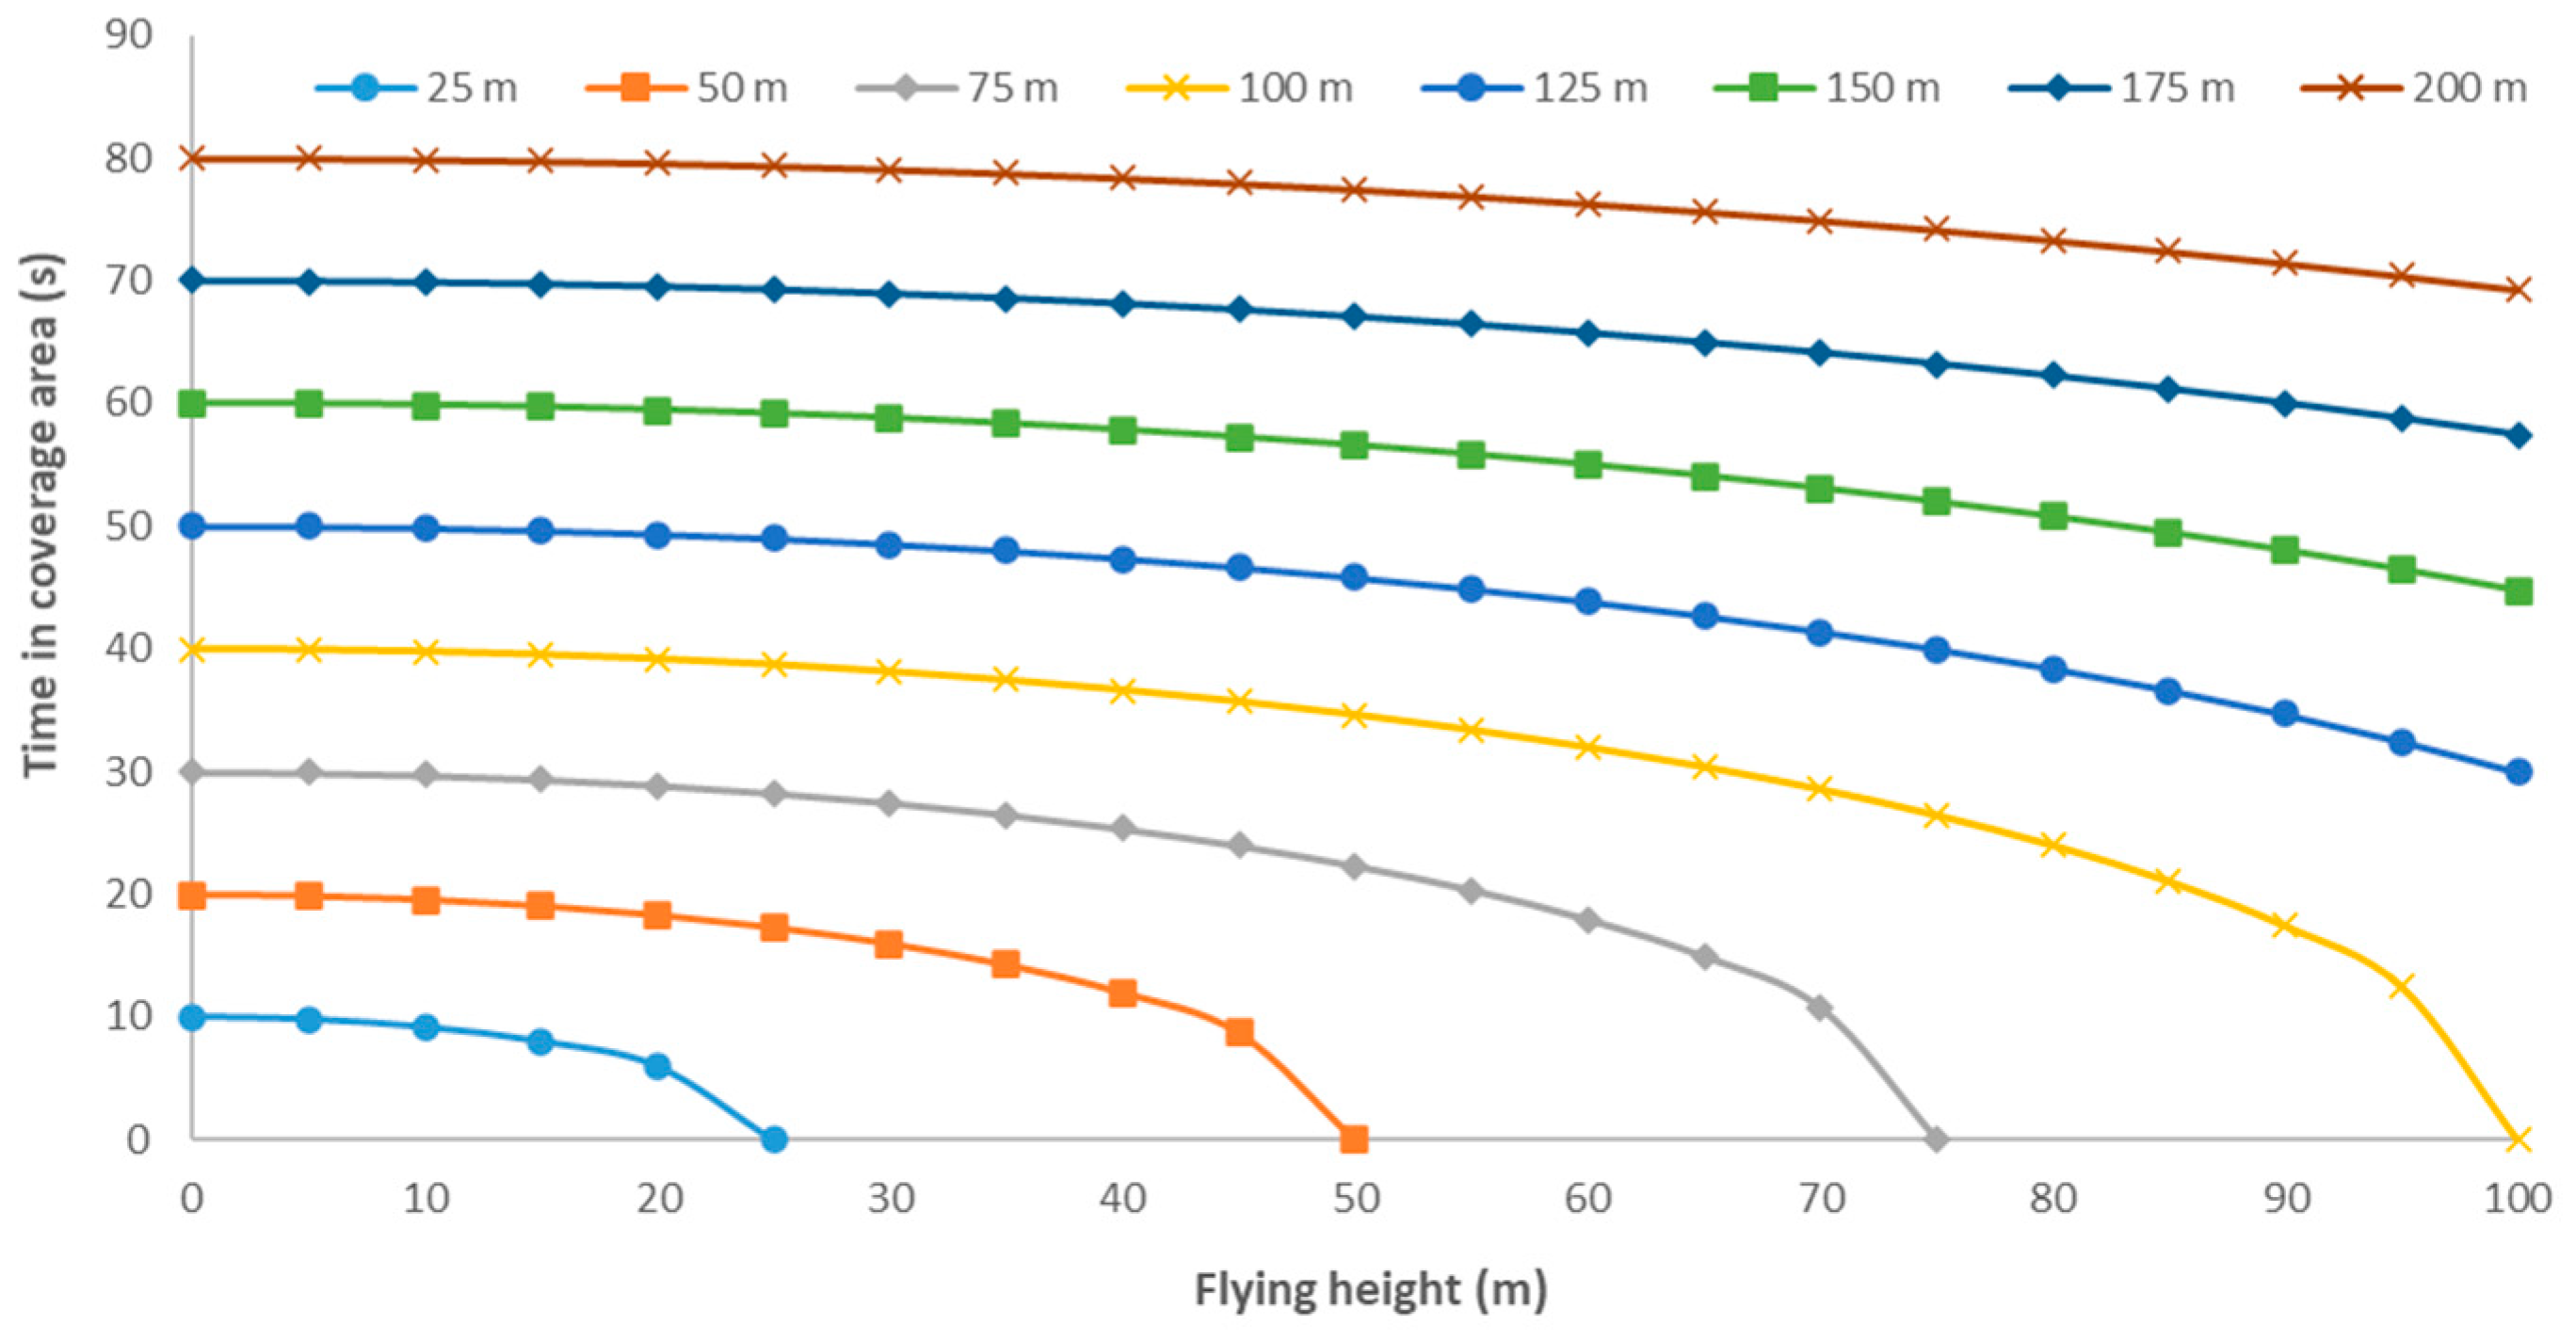
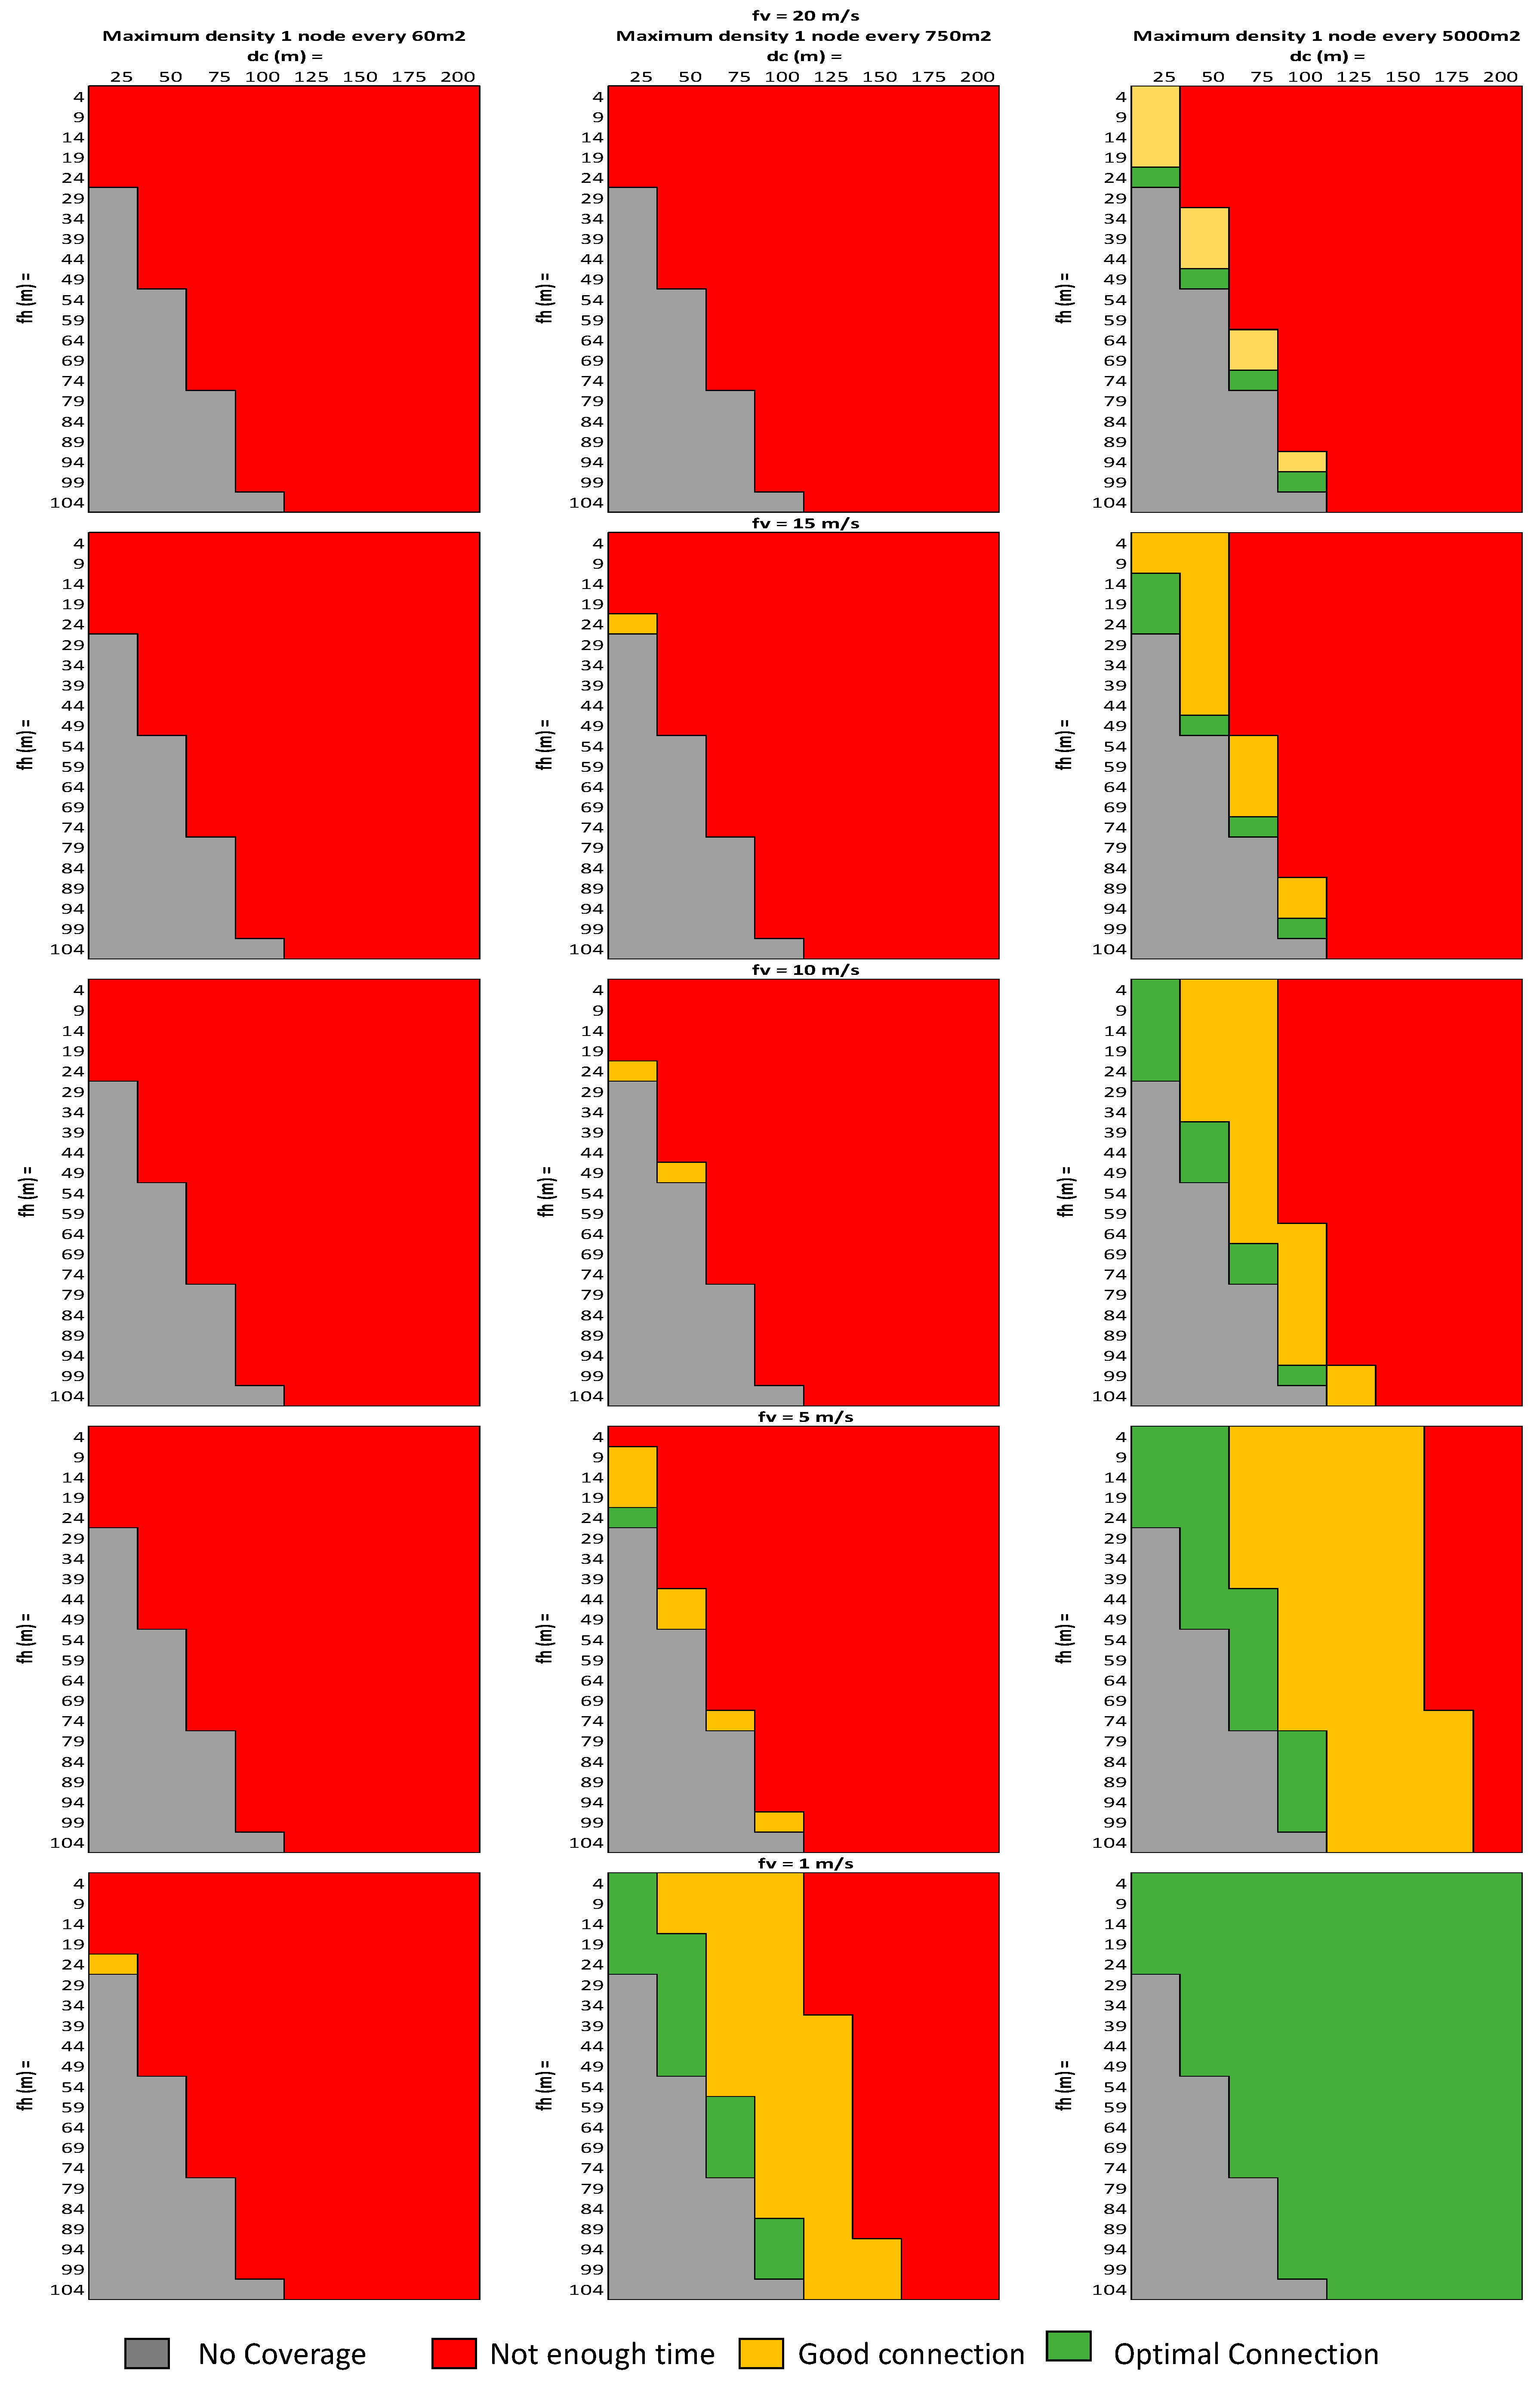
5.1. Coverage Analysis
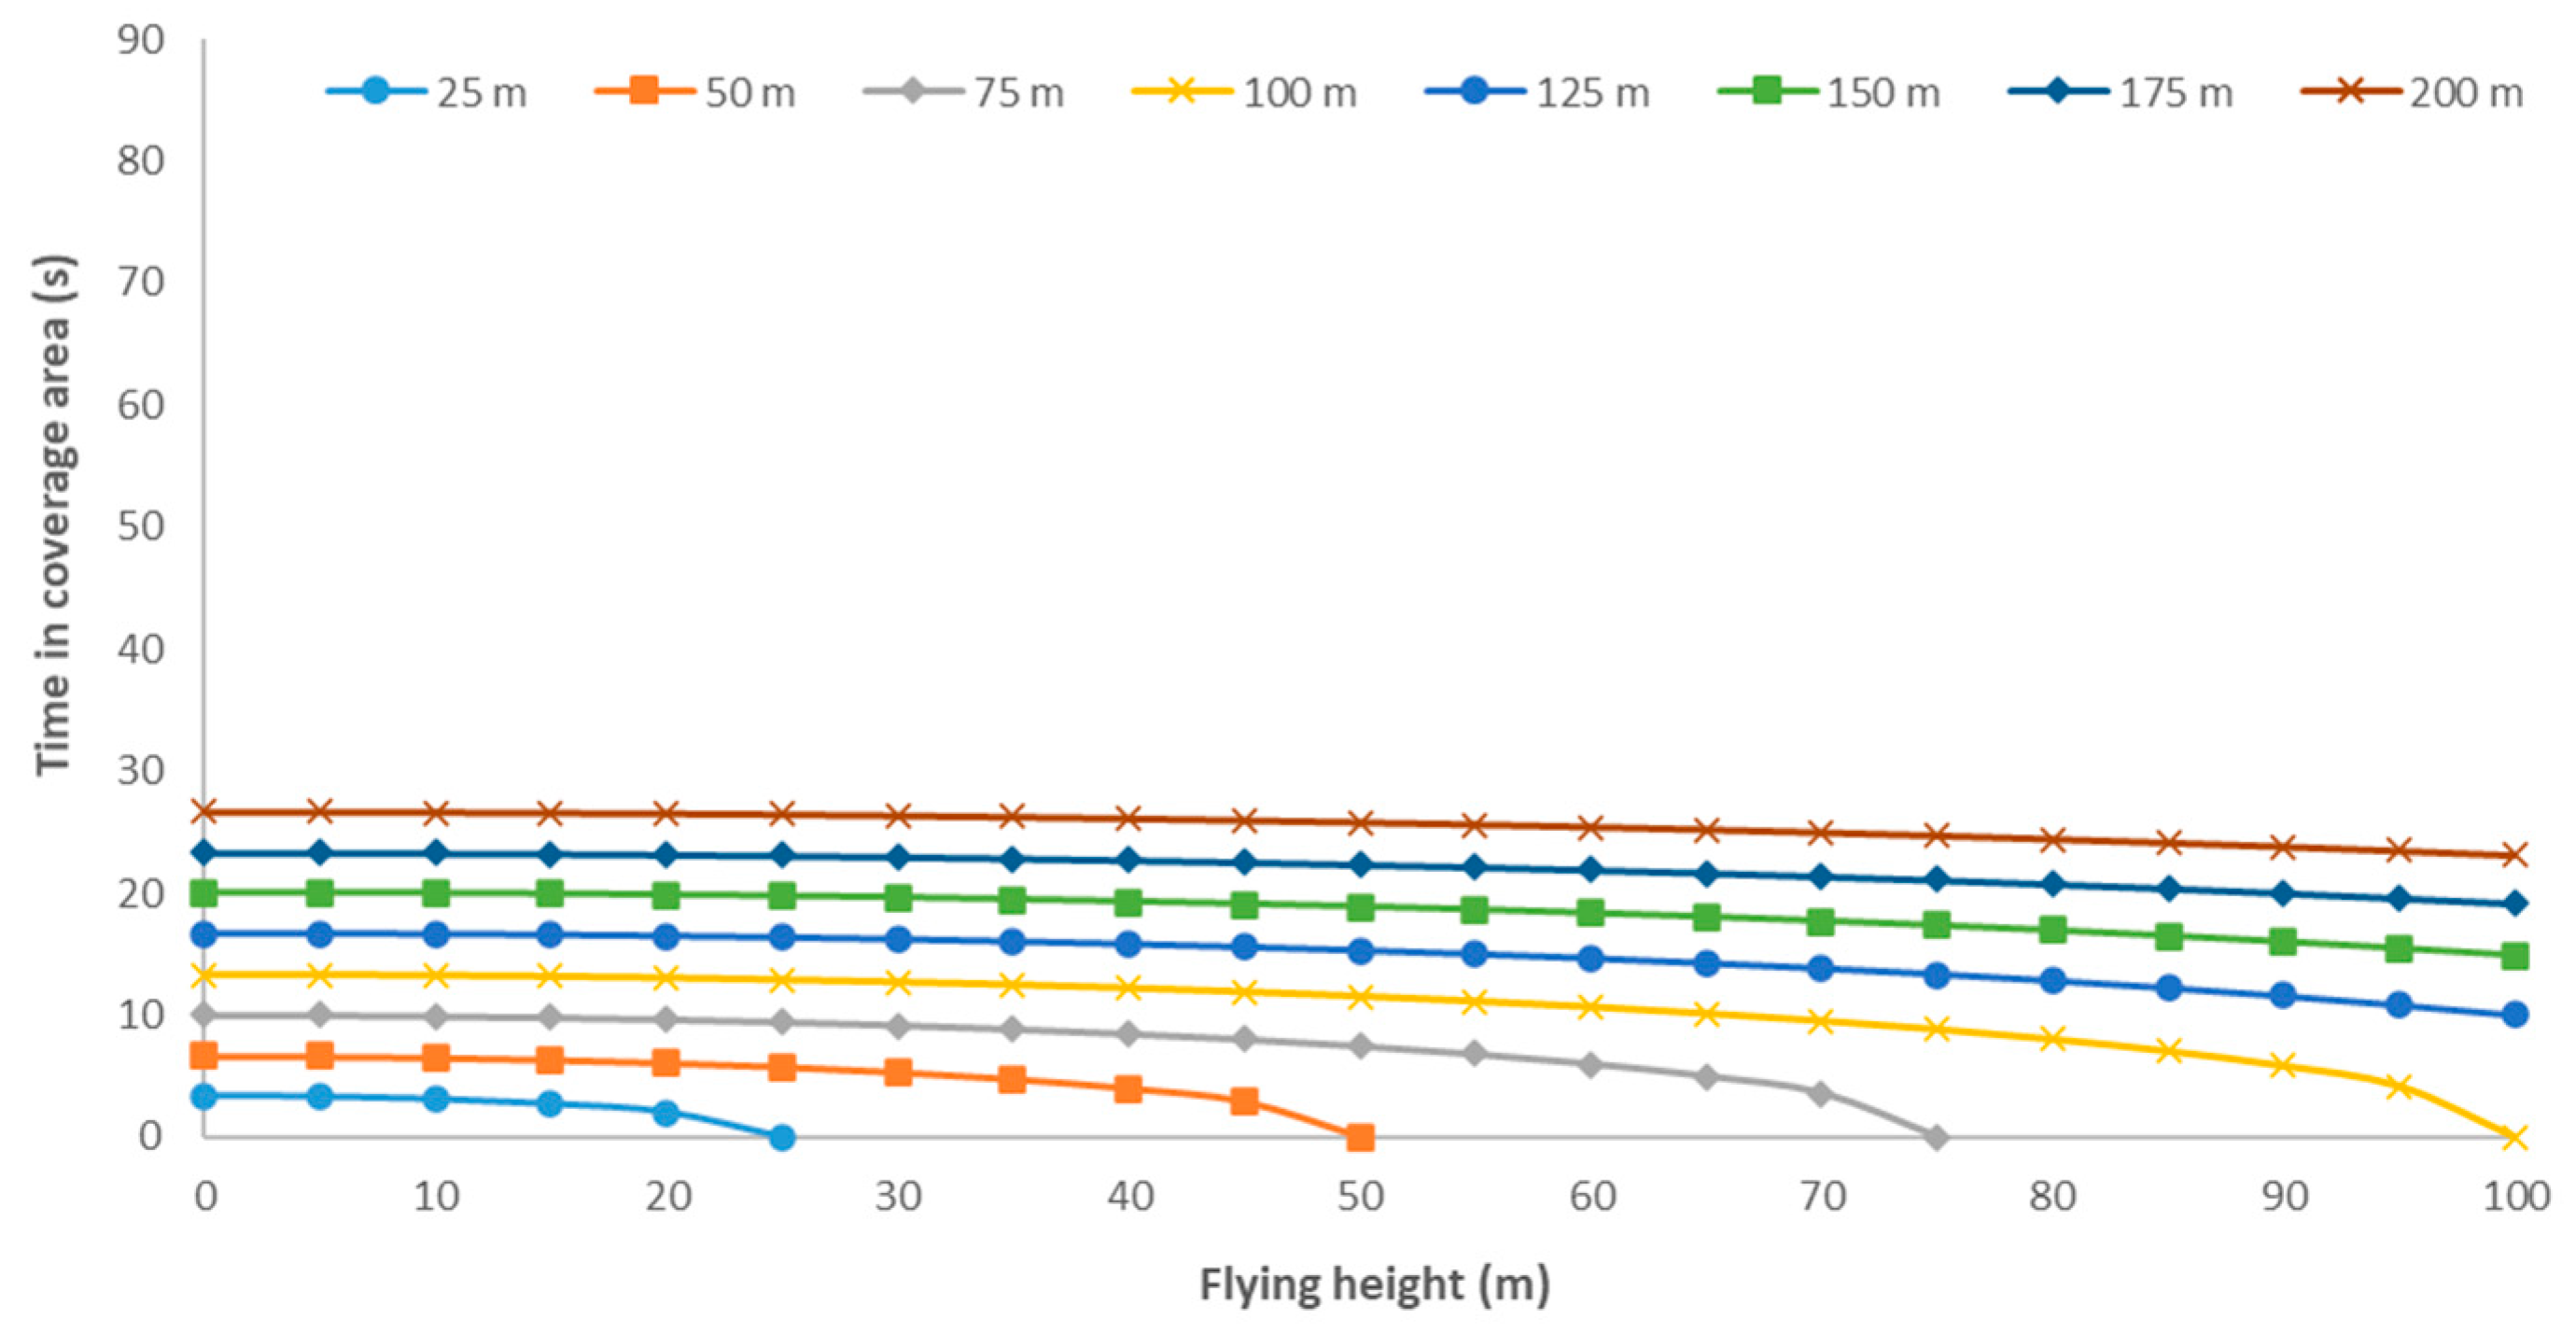
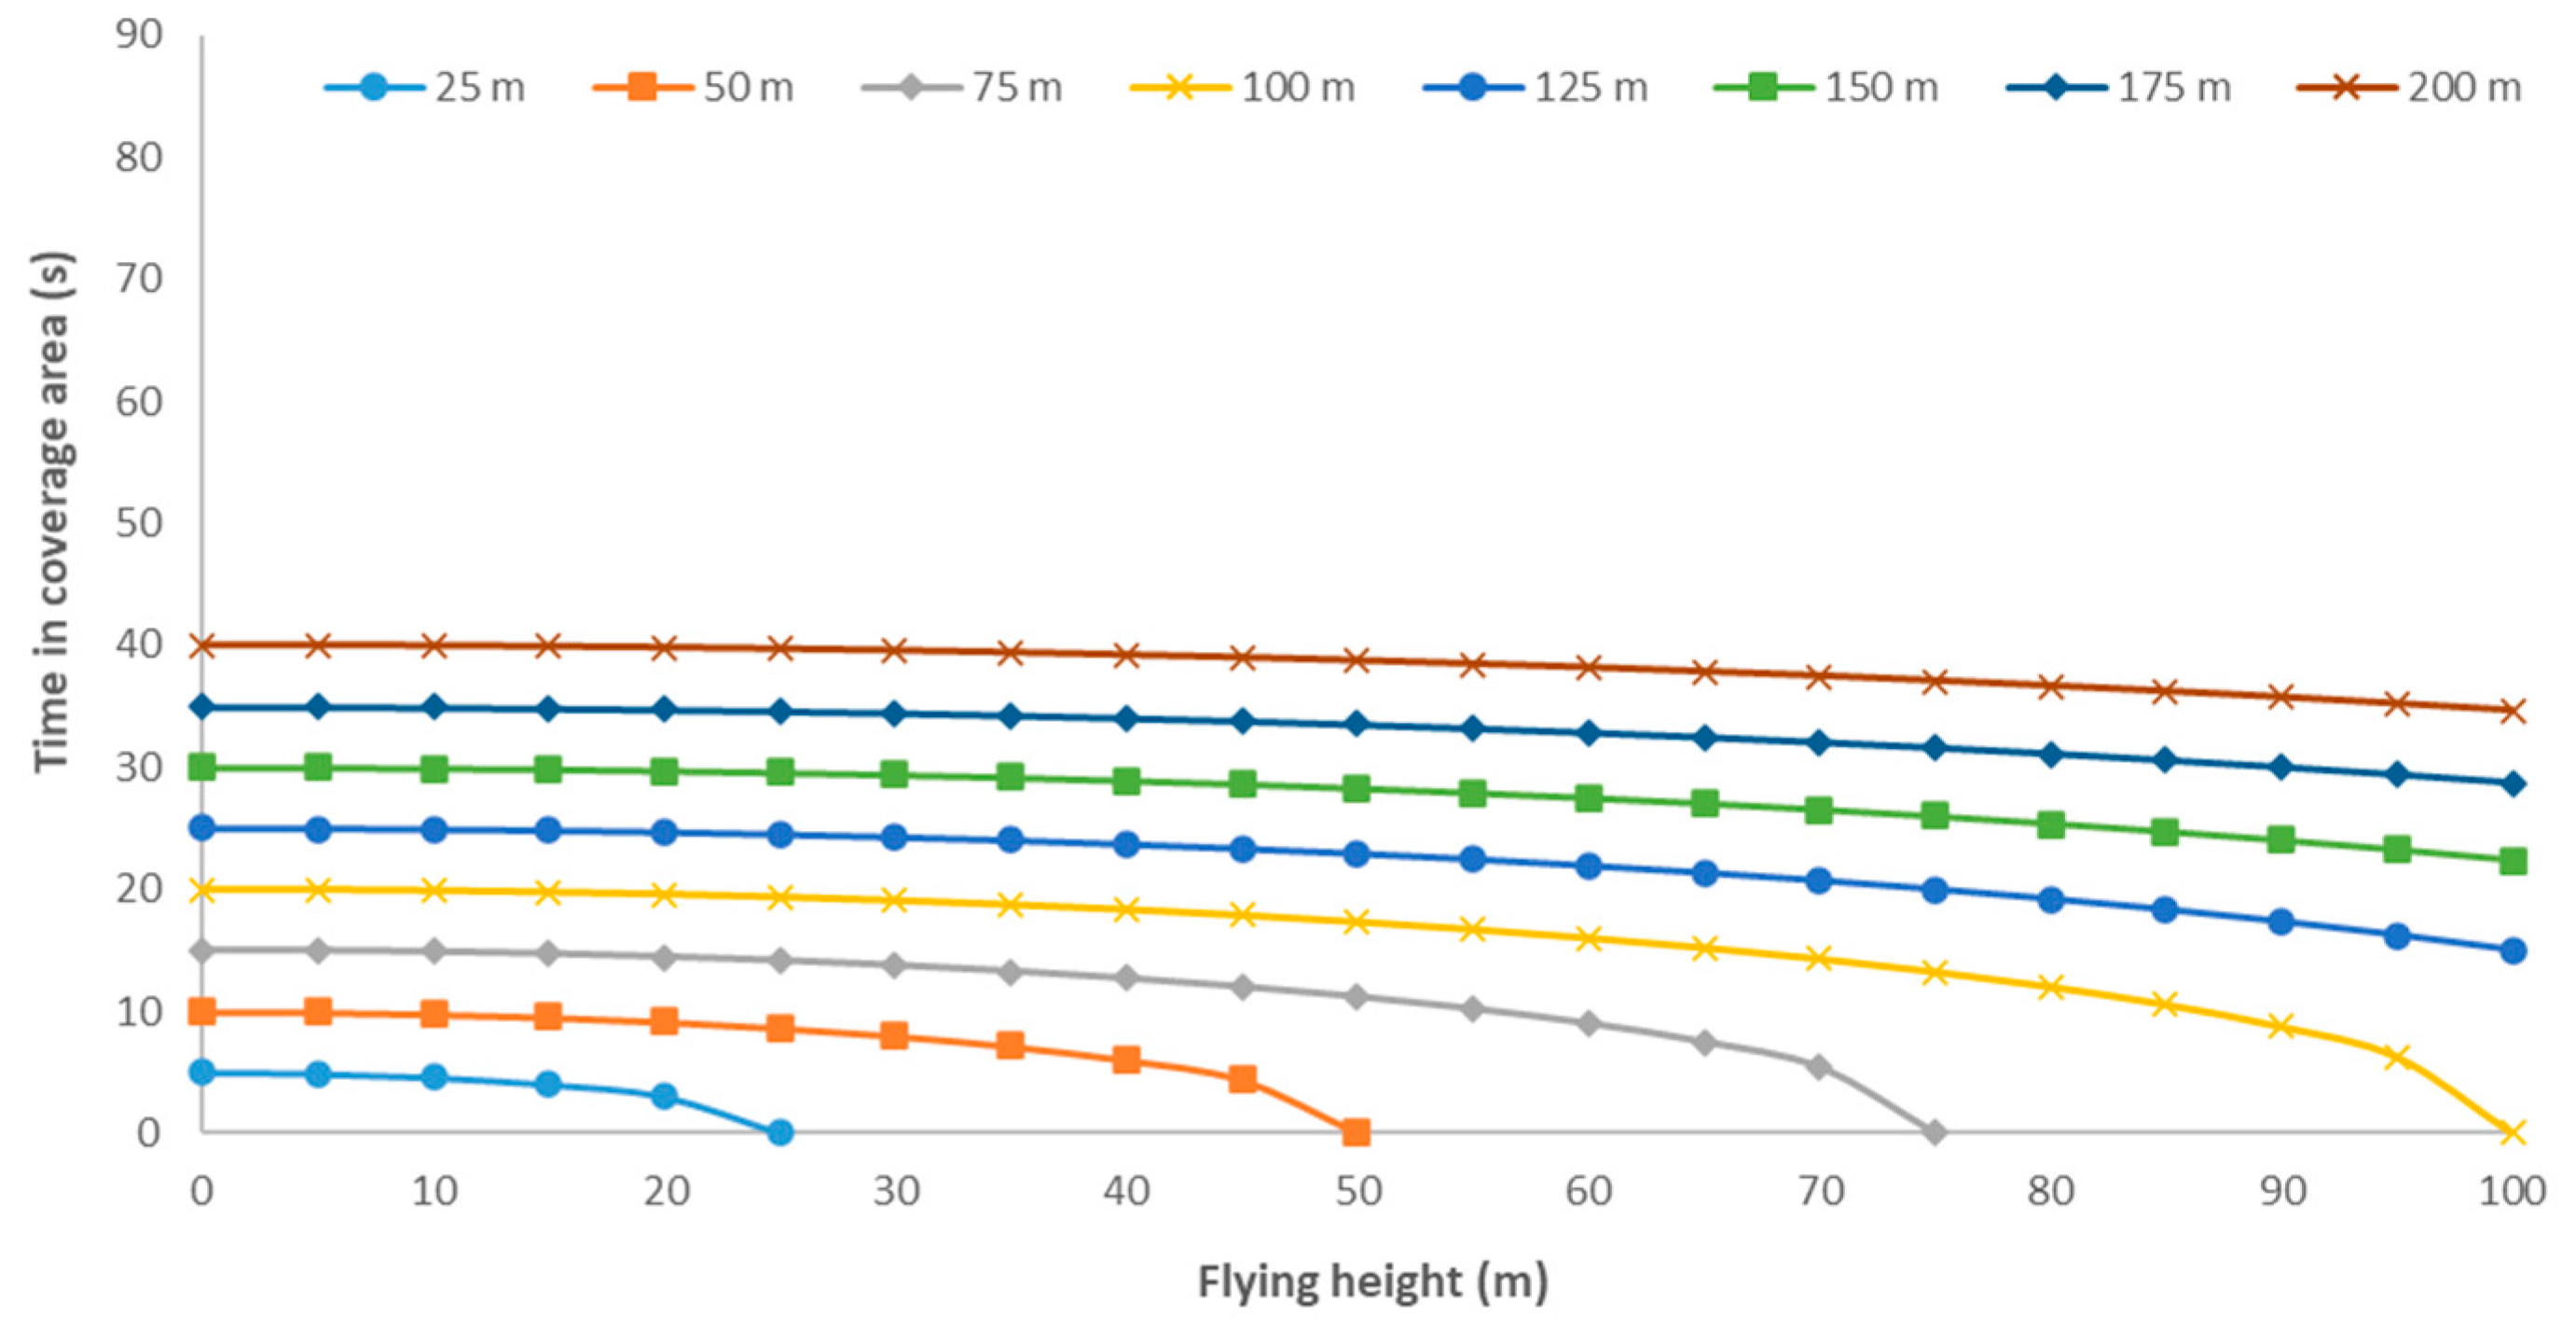
- First, we must consider the time required to establish the connection. We performed tests in real environments to determine the time required by Arduino nodes to establish the connection between each other. The results showed connection establishment times ranging between 2 and 4 s. To ensure the connection of the nodes, we will consider the worst-case scenario of connection time of 4 s. Since the data are forwarded after the connection establishment, we will consider 5 s of total required time for connection establishment and data transmission. Therefore, all the combinations of dc and fh that give, as a result, a time in coverage equal to or less than 5 s are considered as unfeasible scenarios for connection. Since the current velocities in WiFi have increased in the last years and the gathered data by the sensors are small, we can consider that all the information can be sent in this period of 5 s.
- Moreover, all the coverage areas do not have the same properties in terms of signal strength. The further points have lower Received Signal Strength Indicator (RSSI) values, and the connection will be difficult in those situations. Nonetheless, the estimation of the effects of RSSI on the establishment of the connection is not the purpose of this paper.
- Finally, regarding the density of nodes, we must consider the number of nodes that will be able to connect to the drone at the same moment and that have to share their time in coverage. There is a different type of scenario regarding node density in precision agriculture. The densest cases are related to the intensive agriculture of fruit-bearing trees such as orchards. The farmers used to grow their trees in a density of one tree each 16 to 20 m2. In the case that we have one node per tree, the node density will be one node each 16 to 20 m2. Nonetheless, this is not usual, since the conditions of the soil and irrigation techniques are relatively homogeneous. Therefore, we can expect that in the densest networks, we have one node every three or four trees, having a density of one node each 60 m2. Other scenarios can include cereal or energetic crops. In these cases, the crops create a uniform soil coverage, and it is not possible to differentiate the individual plants. Moreover, as the outcomes of these crops are much lower than in the case of fruit-bearing trees, the investment in precision agriculture is lower. In addition, if we consider that most of the cereals and energetic crops do not need irrigation, the node density can be further lower. It is no exaggeration to say that in these cases, we can have only one node in each field having node densities of one each 5000 m2 or even more. In between both cases, we can find another example of fruit-bearing trees as olive trees. The density of trees in the field is lower than in the case of orchards. Moreover, since no irrigation systems are used in the culture of olive trees, the monitoring requirements are lower. Thus, we can expect densities of one node each 750 m2 in the cropping of this type of crop. Nevertheless, the final density will be a factor that the farmer will define. To select the density of the nodes, the farmer will consider the environmental parameters (soil proprieties, homogeneity of the terrain, and past climate events), culture parameters (crop resilience, irrigation requirements, and susceptibility to specific diseases or pests among others), and economic constraints (benefits of the crops and the required investment).
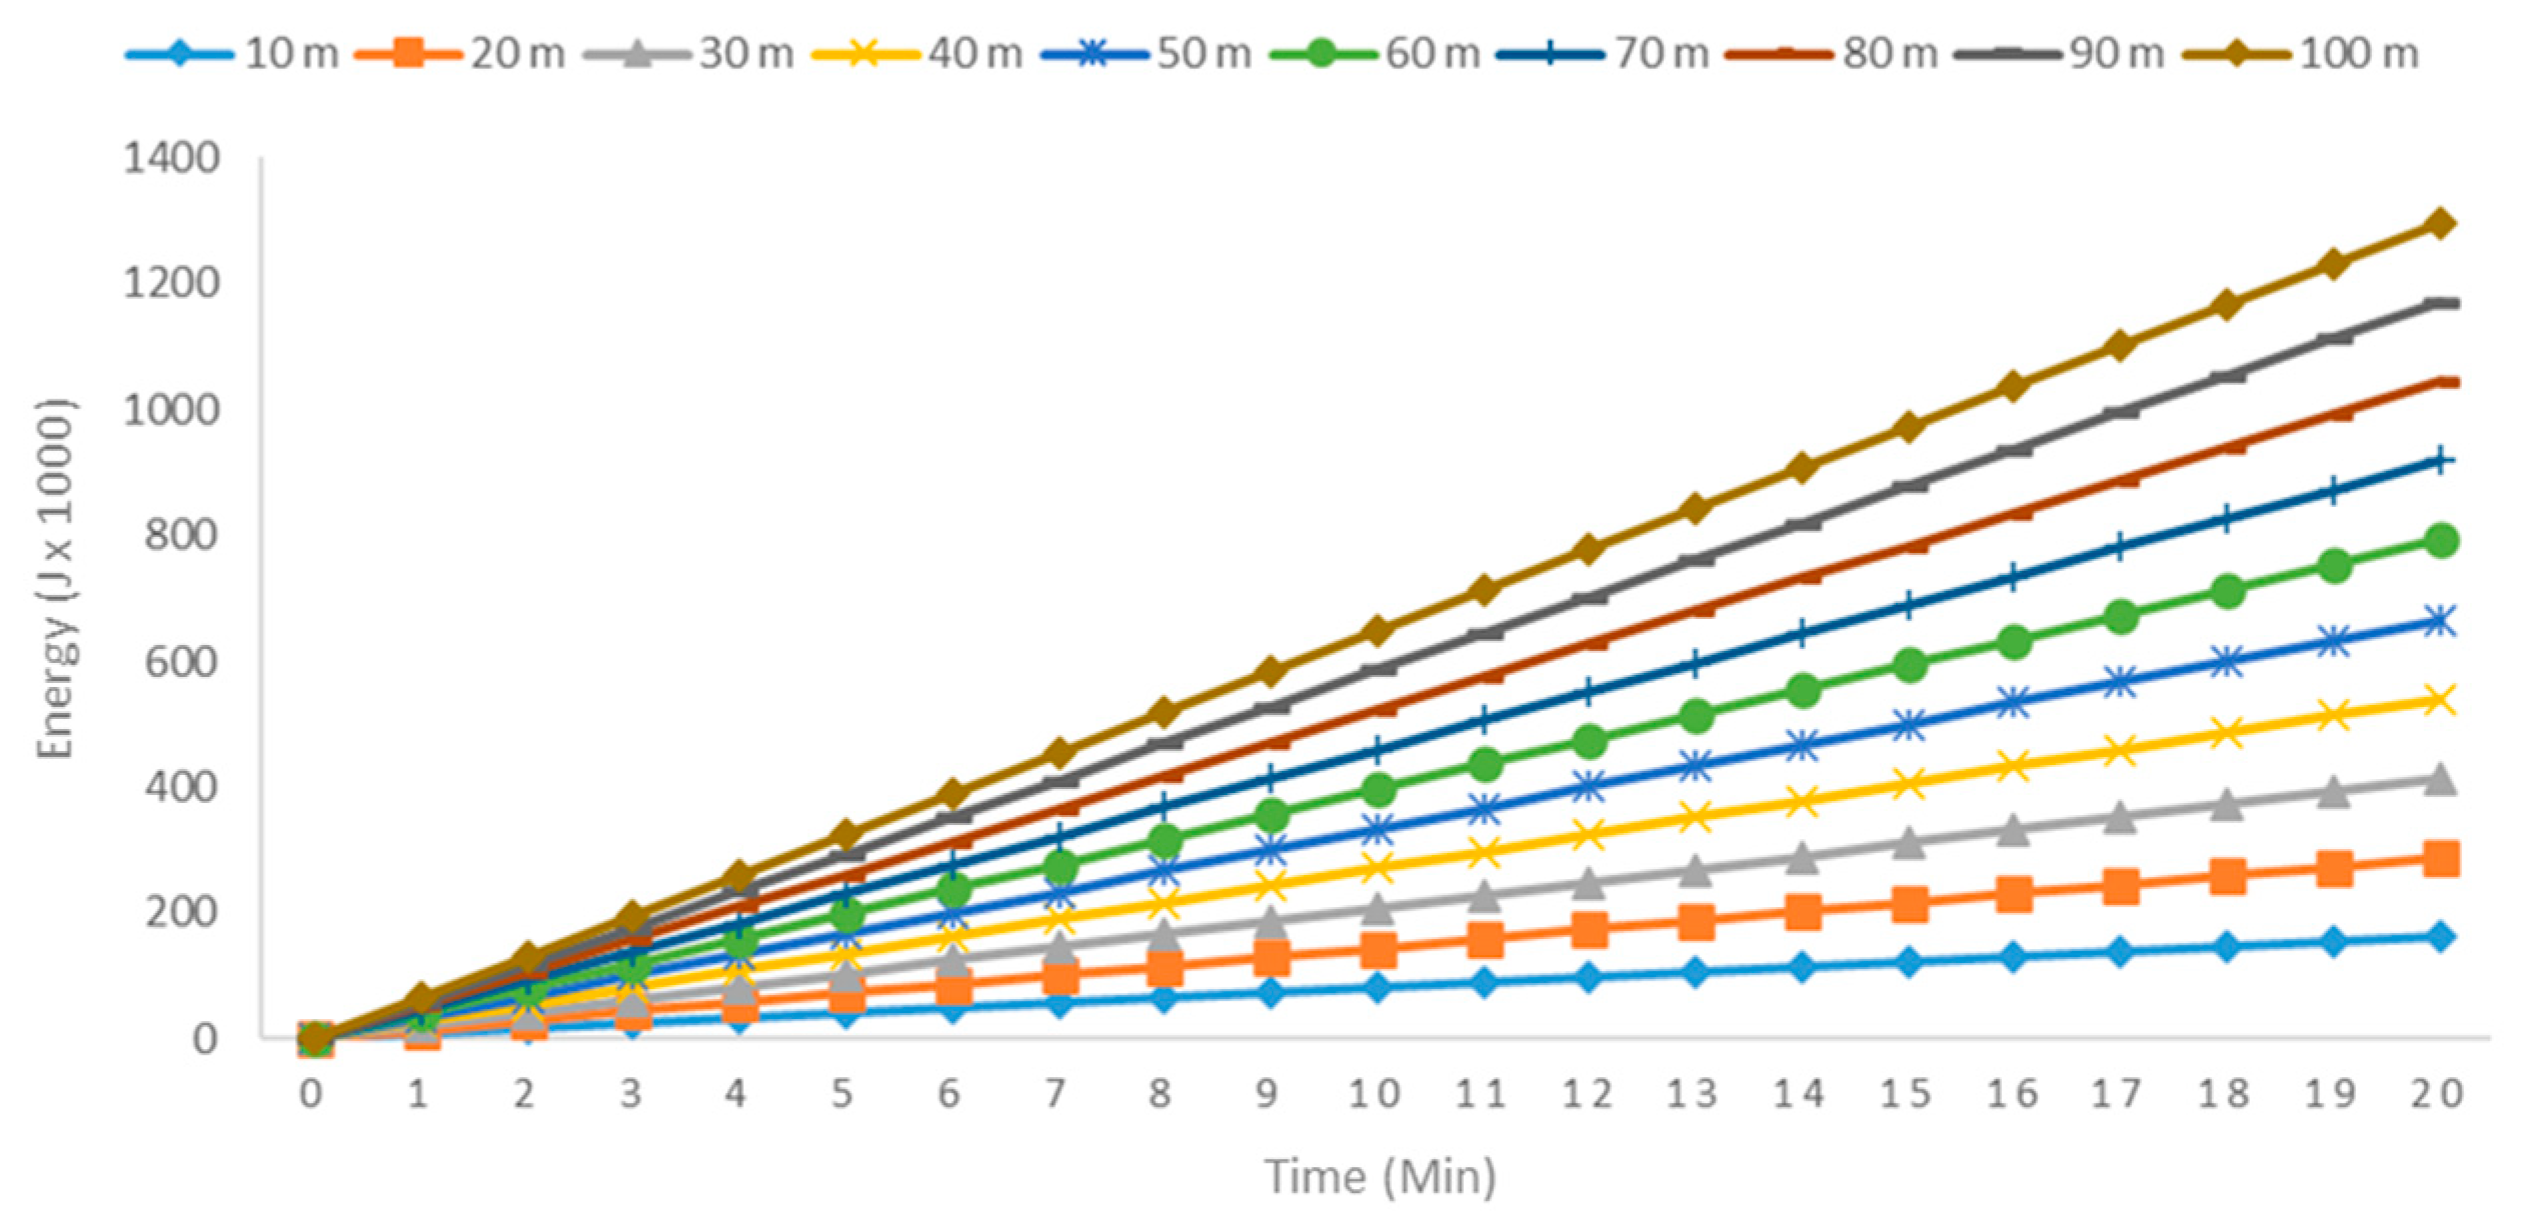
5.2. Energy Consumption
6. Conclusions and Future Work
Author Contributions
Funding
Conflicts of Interest
References
- Agriculture and Rural Development Agriculture and Rural Development. Available online: https://ec.europa.eu/agriculture/cap-post-2013/ (accessed on 3 December 2019).
- Kropff, M.; Wallinga, J.; Lotz, L. Modelling for Precision Weed Management. In Proceedings of the Ciba Foundation Symposium 210—Precision Agriculture: Spatial and Temporal Variability of Environmental Quality, Chichester, UK, 27 September 2007; pp. 182–207. [Google Scholar] [CrossRef]
- Earl, R.; Wheeler, P.; Blackmore, S.; Godwin, R.J. Precision Farming: The Management of Variability. AGRIS 2013, 51, 18–23. [Google Scholar]
- Srinivasan, A. Handbook of Precision Agriculture: Principles and Applications; CRC Press: New York, NY, USA, 2006; ISBN 9781560229551. [Google Scholar]
- Toth, C.; Jóźków, G. Remote sensing platforms and sensors: A survey. ISPRS J. Photogramm. Remote Sens. 2016, 115, 22–36. [Google Scholar] [CrossRef]
- Pajares, G. Overview and Current Status of Remote Sensing Applications Based on Unmanned Aerial Vehicles (UAVs). Photogramm. Eng. Remote Sens. 2015, 81, 281–330. [Google Scholar] [CrossRef] [Green Version]
- Maes, W.H.; Steppe, K. Perspectives for Remote Sensing with Unmanned Aerial Vehicles in Precision Agriculture. Trends Plant Sci. 2019, 24, 152–164. [Google Scholar] [CrossRef]
- Psirofonia, P.; Samaritakis, V.; Eliopoulos, P.; Potamitis, I. Use of Unmanned Aerial Vehicles for Agricultural Applications with Emphasis on Crop Protection: Three Novel Case-studies. Int. J. Agricult. Sci. Technol. 2017, 5, 30–39. [Google Scholar] [CrossRef]
- Agriculture Drones Market by Offering (Hardware and Software & Services), Application (Precision Farming, Livestock Monitoring, Precision Fish Farming, and Smart Greenhouse), Component, and Geography—Global Forecast to 2024. Available online: https://www.marketsandmarkets.com/Market-Reports/agriculture-drones-market-23709764.html?gclid=CjwKCAiA-P7xBRAvEiwAow-VaRPLzQ4x9YHOwUyC4e-PBfJvjpkB4Bqx9WWIt6S-lM0FsKvUcbqLdxoC_VcQAvD_BwE (accessed on 3 February 2020).
- Cunliffe, A.M.; Brazier, R.E.; Anderson, K. Ultra-fine grain landscape-scale quantification of dryland vegetation structure with drone-acquired structure-from-motion photogrammetry. Remote Sens. Environ. 2016, 183, 129–143. [Google Scholar] [CrossRef] [Green Version]
- Zhang, J.; Hu, J.; Lian, J.; Fan, Z.; Ouyang, X.; Ye, W. Seeing the forest from drones: Testing the potential of lightweight drones as a tool for long-term forest monitoring. Biol. Conserv. 2016, 198, 60–69. [Google Scholar] [CrossRef]
- Urbahs, A.; Jonaite, I. Features of the use of unmanned aerial vehicles for agriculture applications. Aviation 2013, 17, 170–175. [Google Scholar] [CrossRef]
- Raeva, P.L.; Šedina, J.; Dlesk, A. Monitoring of crop fields using multispectral and thermal imagery from UAV. Eur. J. Remote Sens. 2019, 52, 192–201. [Google Scholar] [CrossRef] [Green Version]
- Stehr, N.J.; Justen, V. Drones: The Newest Technology for Precision Agriculture. Nat. Sci. Educ. 2015, 44, 89–91. [Google Scholar] [CrossRef]
- Kurkute, S.R.; Deore, B.D.; Kasar, P.; Bhamare, M.; Sahane, M. Drones for Smart Agriculture: A Technical Report. Int. J. Res Appl. Sci. Eng. Technol. 2018, 6, 341–346. [Google Scholar] [CrossRef]
- Puri, V.; Nayyar, A.; Raja, L. Agriculture drones: A modern breakthrough in precision agriculture. J. Stat. Manag. Syst. 2017, 20, 507–518. [Google Scholar] [CrossRef]
- Valente, J.; Sanz, D.; Barrientos, A.; del Cerro, J.; Ribeiro, A.; Rossi, C. An Air-Ground Wireless Sensor Network for Crop Monitoring. Sensors 2011, 11, 6088–6108. [Google Scholar] [CrossRef] [Green Version]
- Hunt, E.R.J.; Daughtry, C.S.T. What good are unmanned aircraft systems for agricultural remote sensing and precision agriculture? Int. J. Remote Sens. 2018, 39, 5345–5376. [Google Scholar] [CrossRef] [Green Version]
- Tsouros, D.C.; Bibi, S.; Sarigiannidis, P.G. A Review on UAV-Based Applications for Precision Agriculture. Information 2019, 10, 349. [Google Scholar] [CrossRef] [Green Version]
- Daponte, P.; De Vito, L.; Glielmo, L.; Iannelli, L.; Liuzza, D.; Picariello, F.; Silano, G. A review on the use of drones for precision agriculture. IOP Conf. Ser. Earth Environ. Sci. 2019, 275, 012022. [Google Scholar] [CrossRef]
- Boehm, F.; Schulte, A. Air to ground sensor data distribution using IEEE802 11N Wi-Fi network. In Proceedings of the 2013 IEEE/AIAA 32nd Digital Avionics Systems Conference (DASC), East Syracuse, NY, USA, 5–10 October 2013; pp. 4–10. [Google Scholar] [CrossRef]
- Stek, T.D. Drones over Mediterranean landscapes. The potential of small UAV’s (drones) for dite detection and heritage management in archaeological survey projects: A case study from Le Pianelle in the Tappino Valley, Molise (Italy). J. Cult. Herit. 2016, 22, 1066–1071. [Google Scholar] [CrossRef]
- Marín, J.; Parra, L.; Rocher, J.; Sendra, S.; Lloret, J.; Mauri, P.V.; Masaguer, A. Urban Lawn Monitoring in Smart City Environments. J. Sens. 2018, 8743179. [Google Scholar] [CrossRef] [Green Version]
- Ojha, T.; Misra, S.; Raghuwanshi, N.S. Wireless sensor networks for agriculture: The state-of-the-art in practice and future challenges. Comp. Electron. Agric. 2015, 118, 66–84. [Google Scholar] [CrossRef]
- Tzounis, A.; Katsoulas, N.; Bartzanas, T.; Kittas, C. Internet of Things in agriculture, recent advances and future challenges. Biosyst. Eng. 2017, 164, 31–48. [Google Scholar] [CrossRef]
- Rehman, A.; Abbasi, A.Z.; Islam, N.; Shaikh, Z.A. A Review of Wireless Sensors and Networks’ Applications in Agriculture. Comp. Stand. Interfaces 2014, 36, 263–270. [Google Scholar] [CrossRef]
- Ruiz-Garcia, L.; Lunadei, L.; Barreiro, P.; Robla, J.I. A Review of Wireless Sensor Technologies and Applications in Agriculture and Food Industry: State of the Art and Current Trends. Sensors 2009, 9, 4728–4750. [Google Scholar] [CrossRef] [PubMed] [Green Version]
- Barcelo-Ordinas, J.M.; Chanet, J.P.; Hou, K.M.; García-Vidal, J. A survey of wireless sensor technologies applied to precision agriculture. In Proceedings of the 9th European Conference on Precision Agriculture, Lleida, Spain, 7–11 July 2013; pp. 801–808. [Google Scholar] [CrossRef]
- Srbinovska, M.; Gavrovski, C.; Dimcev, V.; Krkoleva, A.; Borozan, V. Environmental parameters monitoring in precision agriculture using wireless sensor networks. J. Clean. Prod. 2015, 88, 297–307. [Google Scholar] [CrossRef]
- Yu, X.; Wu, P.; Han, W.; Zhang, Z. A survey on wireless sensor network infrastructure for agriculture. Comp. Stand. Interfaces 2013, 35, 59–64. [Google Scholar] [CrossRef]
- Chaudhary, D.D.; Nayse, S.P.; Waghmare, L.M. Application of Wireless Sensor Networks for Greenhouse Parameter Control in Precision Agriculture. Int. J. Wirel. Mob. Netw. 2011, 3, 140–149. [Google Scholar] [CrossRef]
- Escolar Díaz, S.; Carretero Pérez, J.; Calderón Mateos, A.; Marinescu, M.; Bergua Guerra, B. A novel methodology for the monitoring of the agricultural production process based on wireless sensor networks. Comp. Electron. Agricult. 2011, 76, 252–265. [Google Scholar] [CrossRef]
- Zhu, Y.; Song, J.; Dong, F. Applications of wireless sensor network in the agriculture environment monitoring. Procedia Eng. 2011, 16, 608–614. [Google Scholar] [CrossRef] [Green Version]
- Keshtgari, M.; Deljoo, A. A Wireless Sensor Network Solution for Precision Agriculture Based on ZigBee Technology. Wirel. Sens. Netw. 2012, 4, 25–30. [Google Scholar] [CrossRef]
- Hwang, J.; Shin, C.; Yoe, H. Study on an Agricultural Environment Monitoring Server System using Wireless Sensor Networks. Sensors 2010, 10, 11189–11211. [Google Scholar] [CrossRef]
- Garcia-Sanchez, A.; Garcia-Sanchez, F.; Garcia-Haro, J. Wireless sensor network deployment for integrating video-surveillance and data-monitoring in precision agriculture over distributed crops. Comp. Electron. Agricult. 2011, 75, 288–303. [Google Scholar] [CrossRef]
- García, L.; Parra, L.; Jimenez, J.M.; Lloret, J.; Lorenz, P. Practical Design of a WSN to Monitor the Crop and its Irrigation System. Netw. Protoc. Algorithms 2018, 10, 35–52. [Google Scholar] [CrossRef] [Green Version]
- Asadpour, M.; Giustiniano, D.; Hummel, K.A. From Ground to Aerial Communication: Dissecting WLAN 802.11 for the Drones. In Proceedings of the 8th ACM International Workshop on Wireless Network Testbeds, Experimental Evaluation & Characterization, Miami, FL, USA, 30 September 2013; pp. 25–32. [Google Scholar]
- Rosati, S.; Kruzelecki, K.; Traynard, L.; Rimoldi, B. Speed-Aware Routing for UAV Ad-Hoc Networks. In Proceedings of the Globecom 2013 Workshop—Wireless Networking and Control for Unmanned Autonomous Vehicles, Atlanta, GA, USA, 9–13 December 2013; pp. 1367–1373. [Google Scholar]
- Rahman, A. Enabling Drone Communications with WiMAX Technology. In Proceedings of the 5th International Conference on Information, Intelligence, Systems and Applications, Chania, Greece, 7–9 July 2014; pp. 323–328. [Google Scholar]
- Yuan, Z.; Huang, X.; Sun, L.; Jin, J. Software Defined Mobile Sensor Network for Micro UAV Swarm. In Proceedings of the 2016 IEEE International Conference on Control and Robotics Engineering, Singapore, Singapore, 2–4 April 2016; pp. 1–4. [Google Scholar]
- Popescu, D.; Stoican, F.; Stamatescu, G.; Ichim, L.; Dragana, C. Advanced UAV-WSN System for Intelligent Monitoring in Precision Agriculture. Sensors 2020, 20, 817. [Google Scholar] [CrossRef] [PubMed] [Green Version]
- Specifications of the WEMOS MINI DI. Available online: https://docs.wemos.cc/en/latest/d1/d1_mini.html (accessed on 3 February 2020).
- Specifications of the Node MCU. Available online: https://joy-it.net/en/products/SBC-NodeMCU-ESP32 (accessed on 3 February 2020).
- Specifications of the Arduino Mega. Available online: https://store.arduino.cc/arduino-mega-2560-rev3 (accessed on 3 February 2020).
- Specifications of the Arduino UNO. Available online: https://store.arduino.cc/arduino-uno-rev3 (accessed on 3 February 2020).
- Specifications of the Raspberry Pi Model B+. Available online: https://www.raspberrypi-spy.co.uk/2018/03/introducing-raspberry-pi-3-b-plus-computer/ (accessed on 3 February 2020).
- Anguera, J.; Perez, A. Teoría de Antenas, 1st ed.; Edicions UPC; Universitat Ramon Llull: Barcelona, Spain, 2008; ISBN 84-8301-625-7. [Google Scholar]
- Arjadi, R.H.; Candra, H.; Prananto, H.D.; Wijanarko, T.A.W. RSSI Comparison of ESP8266 Modules. In Proceedings of the 2018 Electrical Power, Electronics, Communications, Controls and Informatics Seminar, Batu, Indonesia, 9–11 October 2018; pp. 150–153. [Google Scholar]
- Guillen-Perez, A.; Sanchez-Iborra, R.; Cano, M.; Sanchez-Aarnoutse, J.C.; Garcia-Haro, J. WiFi Networks on Drones. In Proceedings of the ITU Kaleidoscope: ICTs for a Sustainable World, Bangkok, Thailand, 14–16 November 2016; pp. 1–8. [Google Scholar]
- Zorbas, D.; Di Puglia Pugliese, L.; Razafindralambo, T.; Guerreiro, F. Optimal drone placement and cost-efficient target coverage. J. Netw. Comp. Appl. 2016, 75, 16–31. [Google Scholar] [CrossRef] [Green Version]
- Parra, L.; Rocher, J.; García, L.; Lloret, J.; Tomás, J.; Romero, O.; Rodilla, M.; Falco, S.; Sebastiá, M.T.; Mengual, J.; et al. Design of a WSN for Smart Irrigation in Citrus Plots with Fault-Tolerance and Energy-Saving Algorithms. Netw. Protoc. Algorithms 2018, 10, 95–115. [Google Scholar] [CrossRef] [Green Version]


| Drone | Nominal Endurance | Cruise Speed | Typical Climbing Speed | Max Wind Speed | Typical Range Altitude | Wing Type |
|---|---|---|---|---|---|---|
| Swinglet [38] | 30 min | 10 m/s | 3 m/s | 7 m/s | 20–500 m | Fixed |
| Phantom 3 advanced [8] | 23 min | 16 m/s | 5 m/s | - | 120 m | Rotatory |
| SenseFly eBee [39] | 45 min | 15.84 m/s | - | - | - | Fixed |
| Controller | FLASH | RAM | EEPROM | Weight | Size | Operating Voltage | Reference |
|---|---|---|---|---|---|---|---|
| WEMOS MINI D1 | 4 MB | - | - | 3 g | 34.2 × 25.6 mm | 3.3 V | [43] |
| Node MCU | 4 MB | 520 kB | - | 10 g | 48 × 26 × 11.5 mm | 3.3 V | [44] |
| Arduino Mega | 256 kB | 8 kB | 4 kB | 37 g | 101.52 × 53.3 mm | 5 V | [45] |
| Arduino UNO | 32 kB | 2 kB | 1 kB | 25 g | 68.6 × 53.4 mm | 7–12 V | [46] |
| Raspberry Pi 3 Model B+ | - | 1 GB | - | 50 g | 85 × 56 × 17 mm | 5 V | [47] |
| Parameter | Fixed Parameter | Acronym | Units | Range |
|---|---|---|---|---|
| Flying height | Yes | fh | (m) | 4 to 104 |
| Flying velocity | Yes | fv | (m/s) | 1 to 20 |
| Drone coverage | No | dc | (m) | 25 to 200 |
| Node density | Yes | nd | (nodes/m2) | 60 to 5000 |
| Time in coverage | No | - | (s) | Calculated |
| Required time for communication | Yes | - | (s) | 5 |
| Nodes in coverage | No | - | (nodes) | Calculated |
| Connection feasibility | No | - | No Units | Calculated |
| Velocity | 1 m/s | 5 m/s | 10 m/s | 15 m/s | 20 m/s |
|---|---|---|---|---|---|
| 1 node per 60 m2 | 19 | 99 | 199 | 299 | 399 |
| 1 node per 750 m2 | - | 7 | 15 | 23 | 31 |
| 1 node per 5000 m2 | - | - | 1 | 2 | 3 |
© 2020 by the authors. Licensee MDPI, Basel, Switzerland. This article is an open access article distributed under the terms and conditions of the Creative Commons Attribution (CC BY) license (http://creativecommons.org/licenses/by/4.0/).
Share and Cite
García, L.; Parra, L.; Jimenez, J.M.; Lloret, J.; Mauri, P.V.; Lorenz, P. DronAway: A Proposal on the Use of Remote Sensing Drones as Mobile Gateway for WSN in Precision Agriculture. Appl. Sci. 2020, 10, 6668. https://doi.org/10.3390/app10196668
García L, Parra L, Jimenez JM, Lloret J, Mauri PV, Lorenz P. DronAway: A Proposal on the Use of Remote Sensing Drones as Mobile Gateway for WSN in Precision Agriculture. Applied Sciences. 2020; 10(19):6668. https://doi.org/10.3390/app10196668
Chicago/Turabian StyleGarcía, Laura, Lorena Parra, Jose M. Jimenez, Jaime Lloret, Pedro V. Mauri, and Pascal Lorenz. 2020. "DronAway: A Proposal on the Use of Remote Sensing Drones as Mobile Gateway for WSN in Precision Agriculture" Applied Sciences 10, no. 19: 6668. https://doi.org/10.3390/app10196668