Effect of Formwork Removal Time Reduction on Construction Productivity Improvement by Mix Design of Early Strength Concrete


Abstract
:1. Introduction
2. Materials and Methods
2.1. Materials
2.2. Experimental Plan and Mix Proportions
2.3. Test Methods
2.3.1. Properties of Raw Materials and Concrete
2.3.2. Temperature History and Maturity on Concrete
3. Results and Discussion
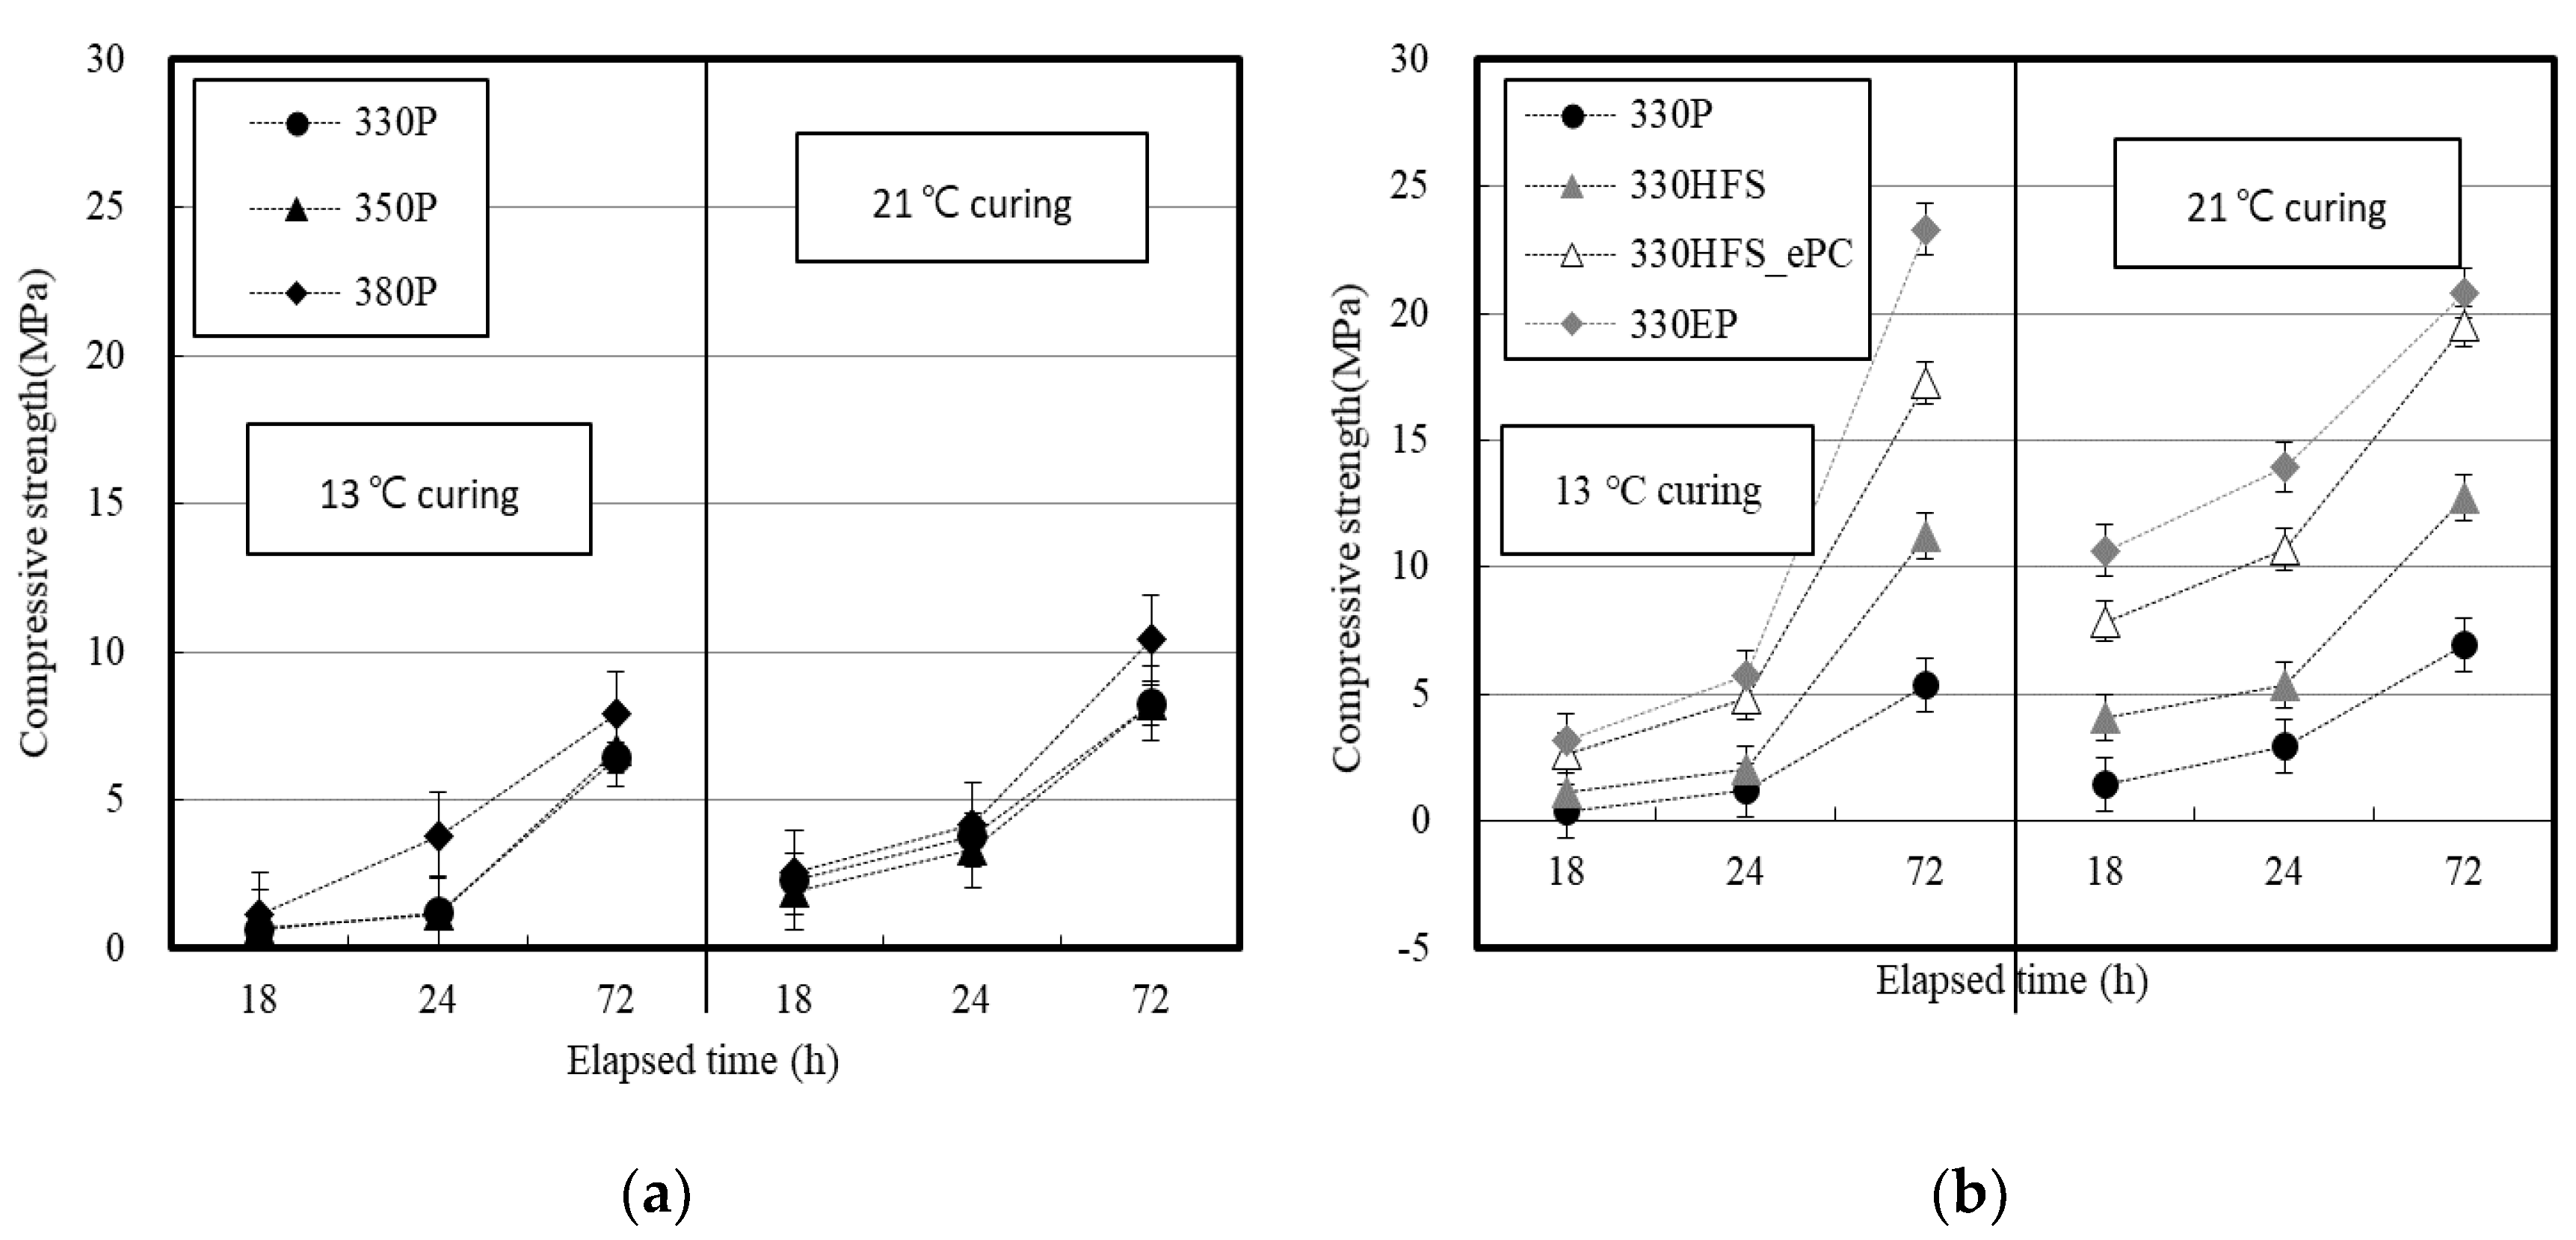
3.1. Fresh and Hardened Properties on Concrete
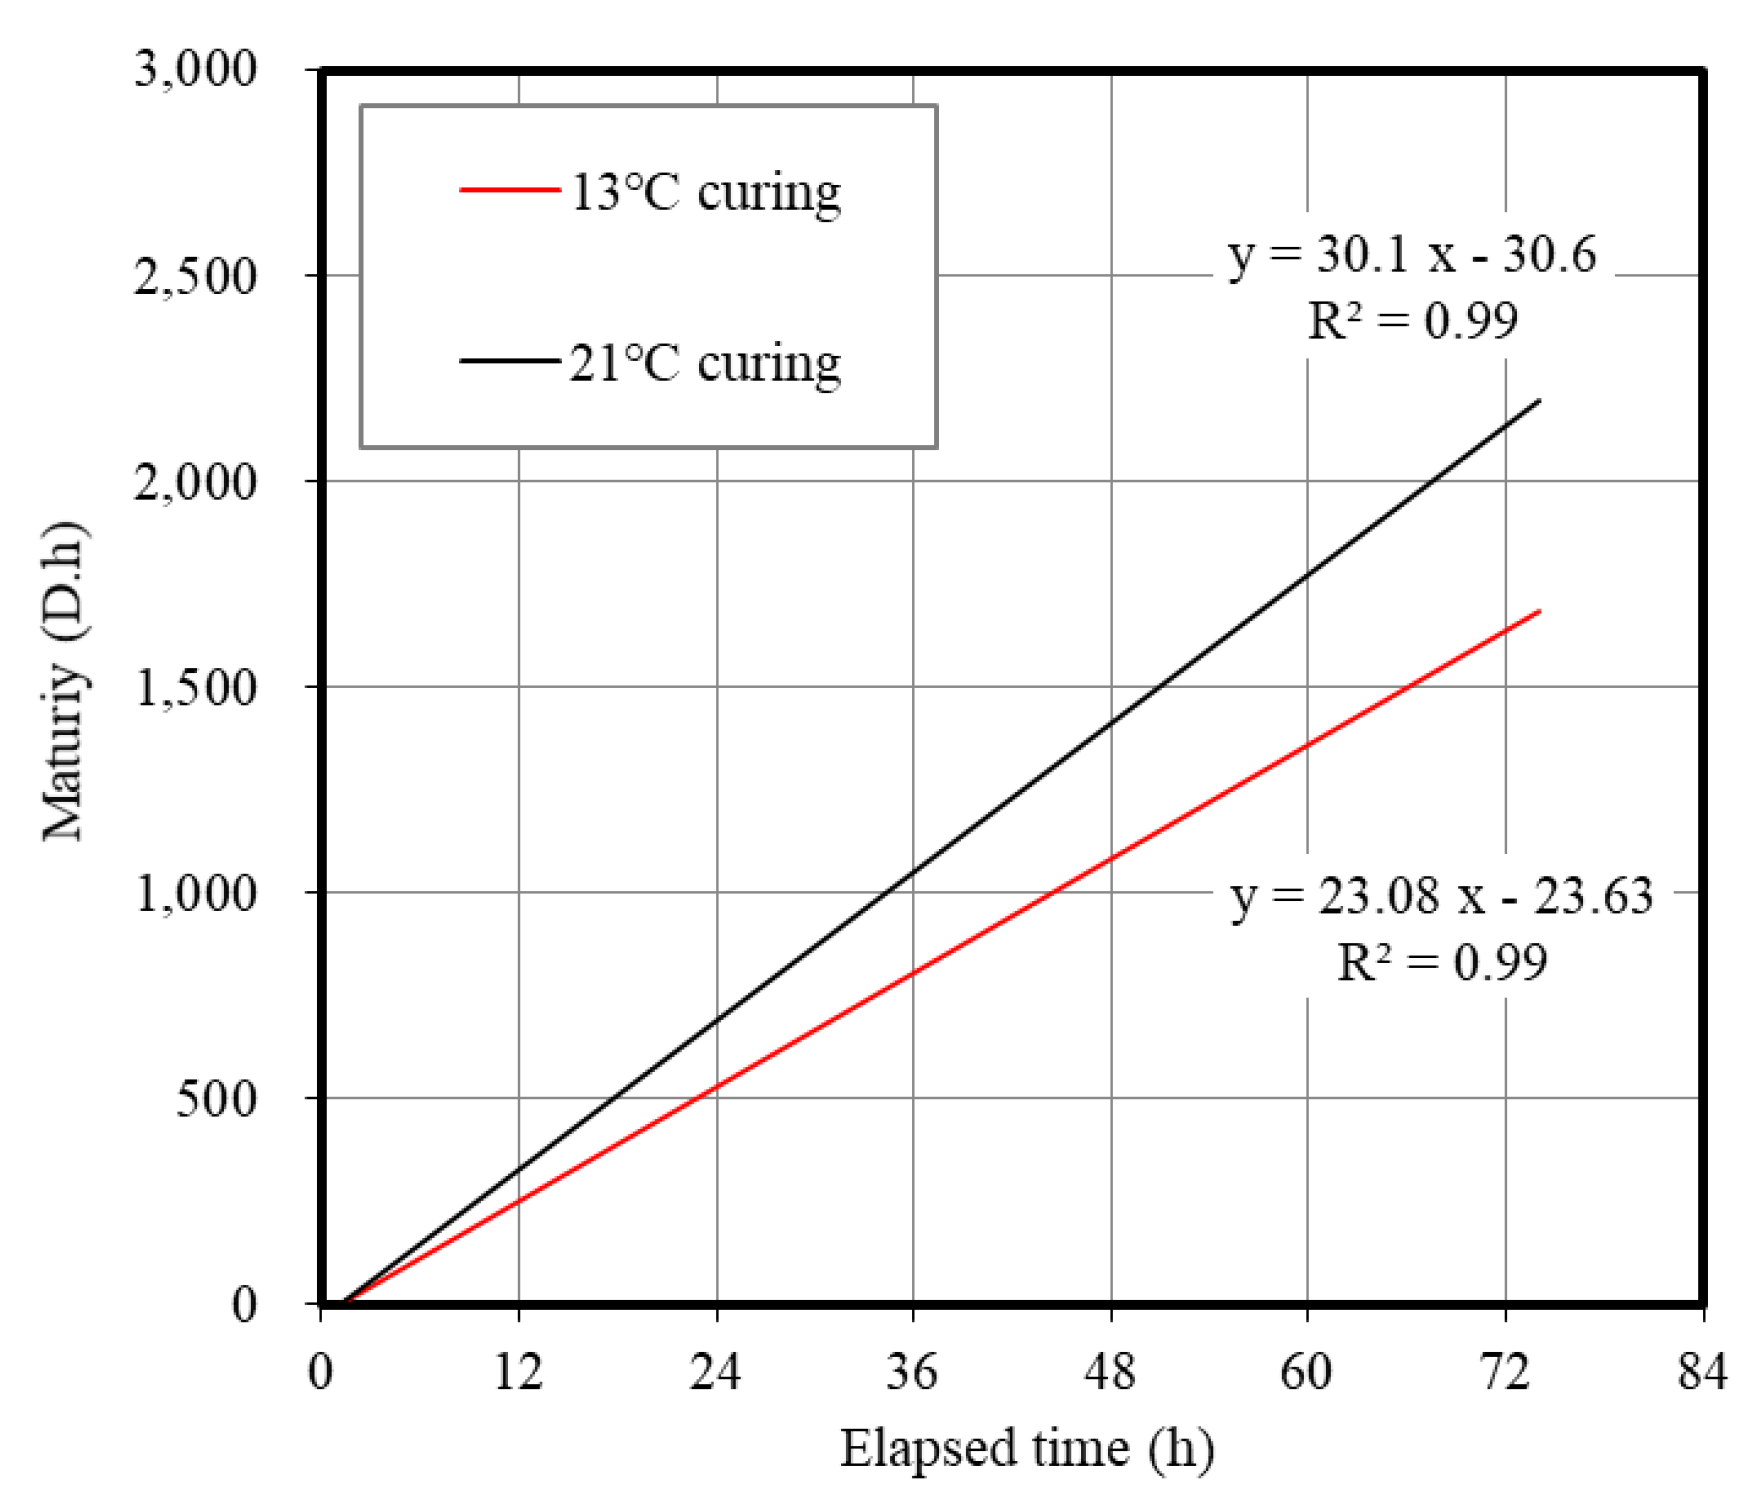
3.2. Temperature History and Maturity on Concrete
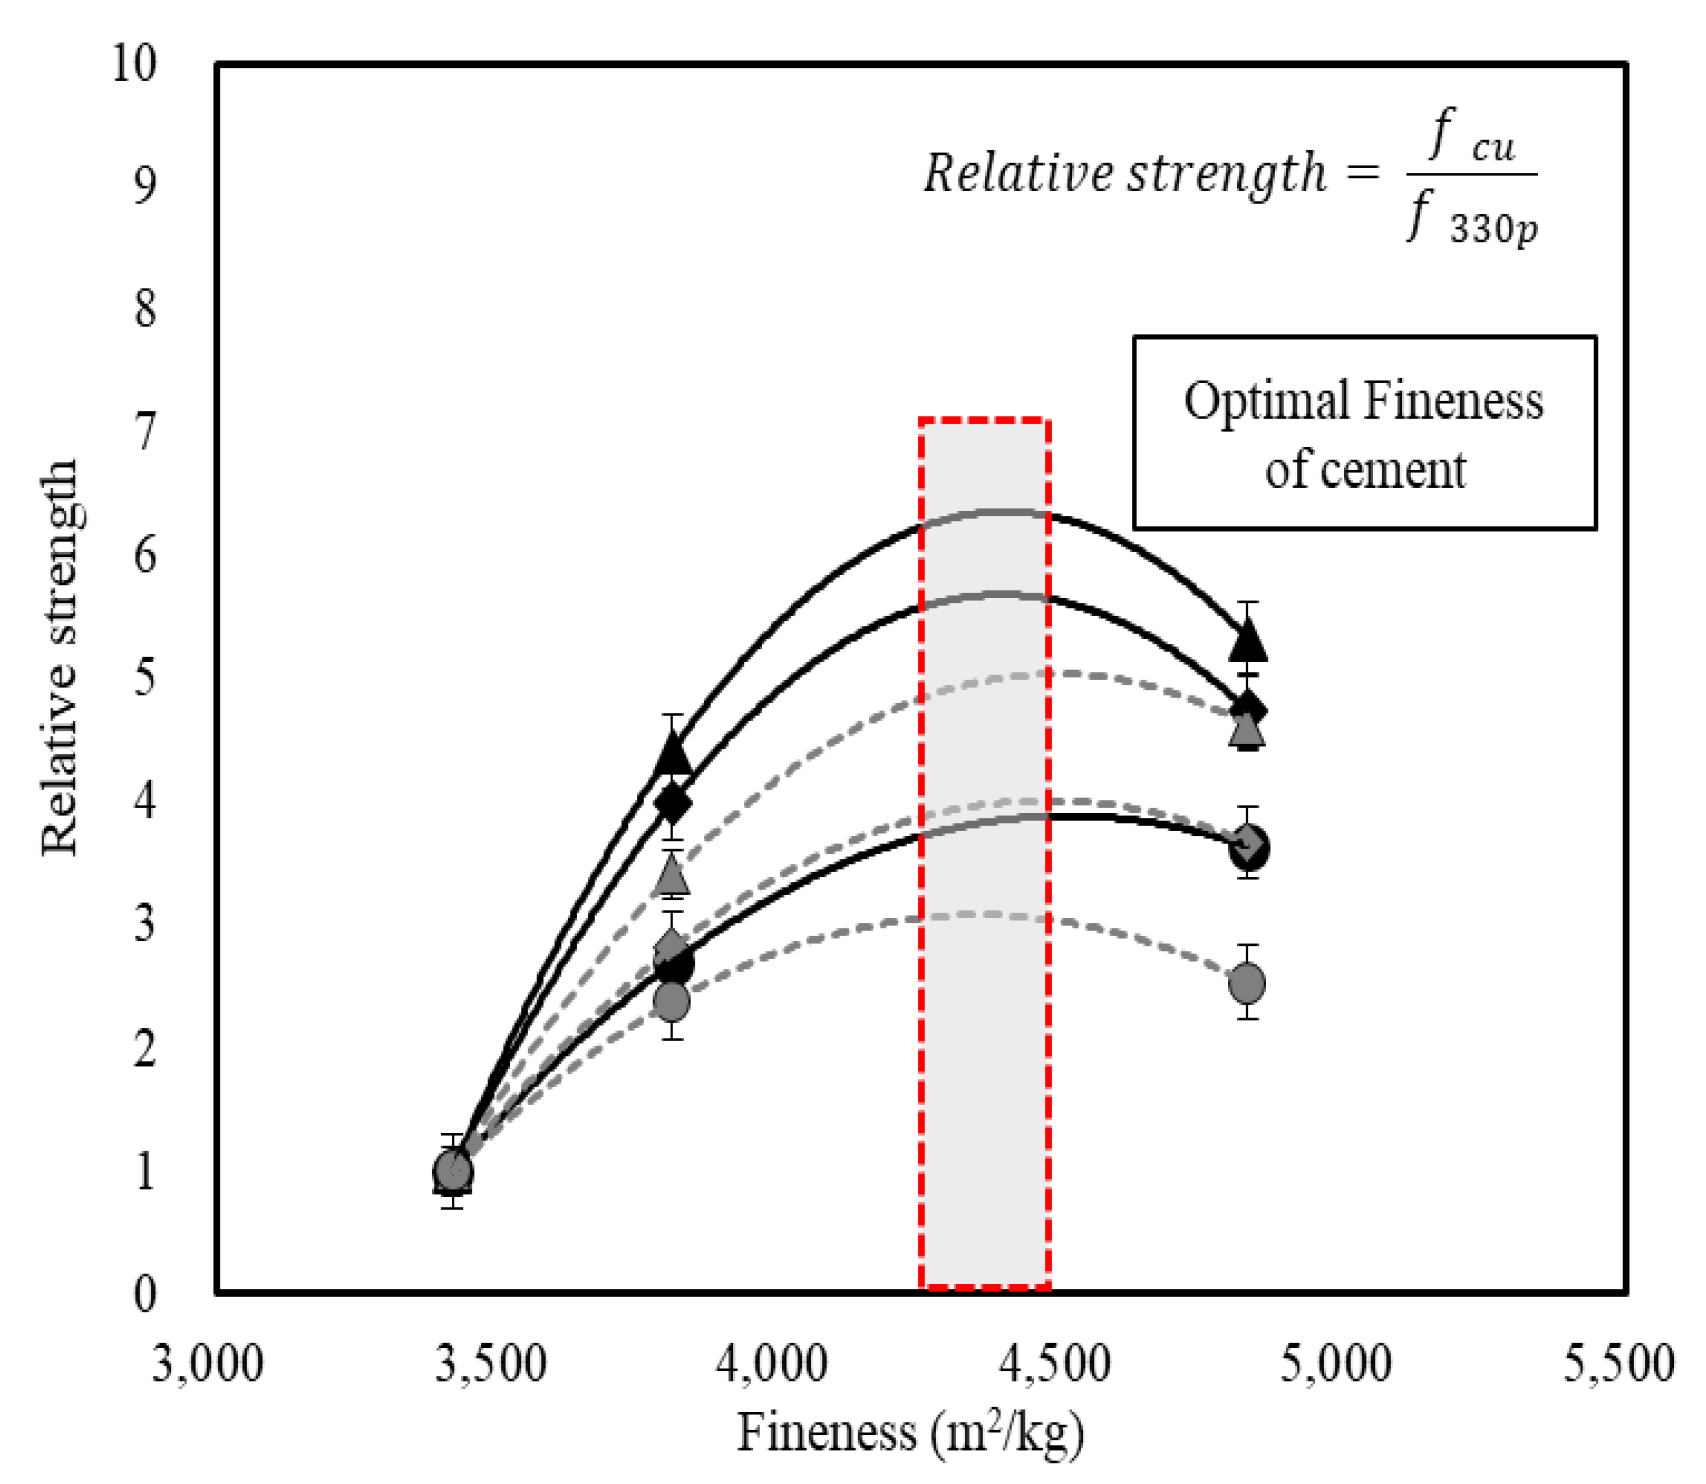
3.3. Effect of Cement Fineness on Concrete Early Strength
3.4. Effect of Cement SO3 Contents on Concrete Early Strength
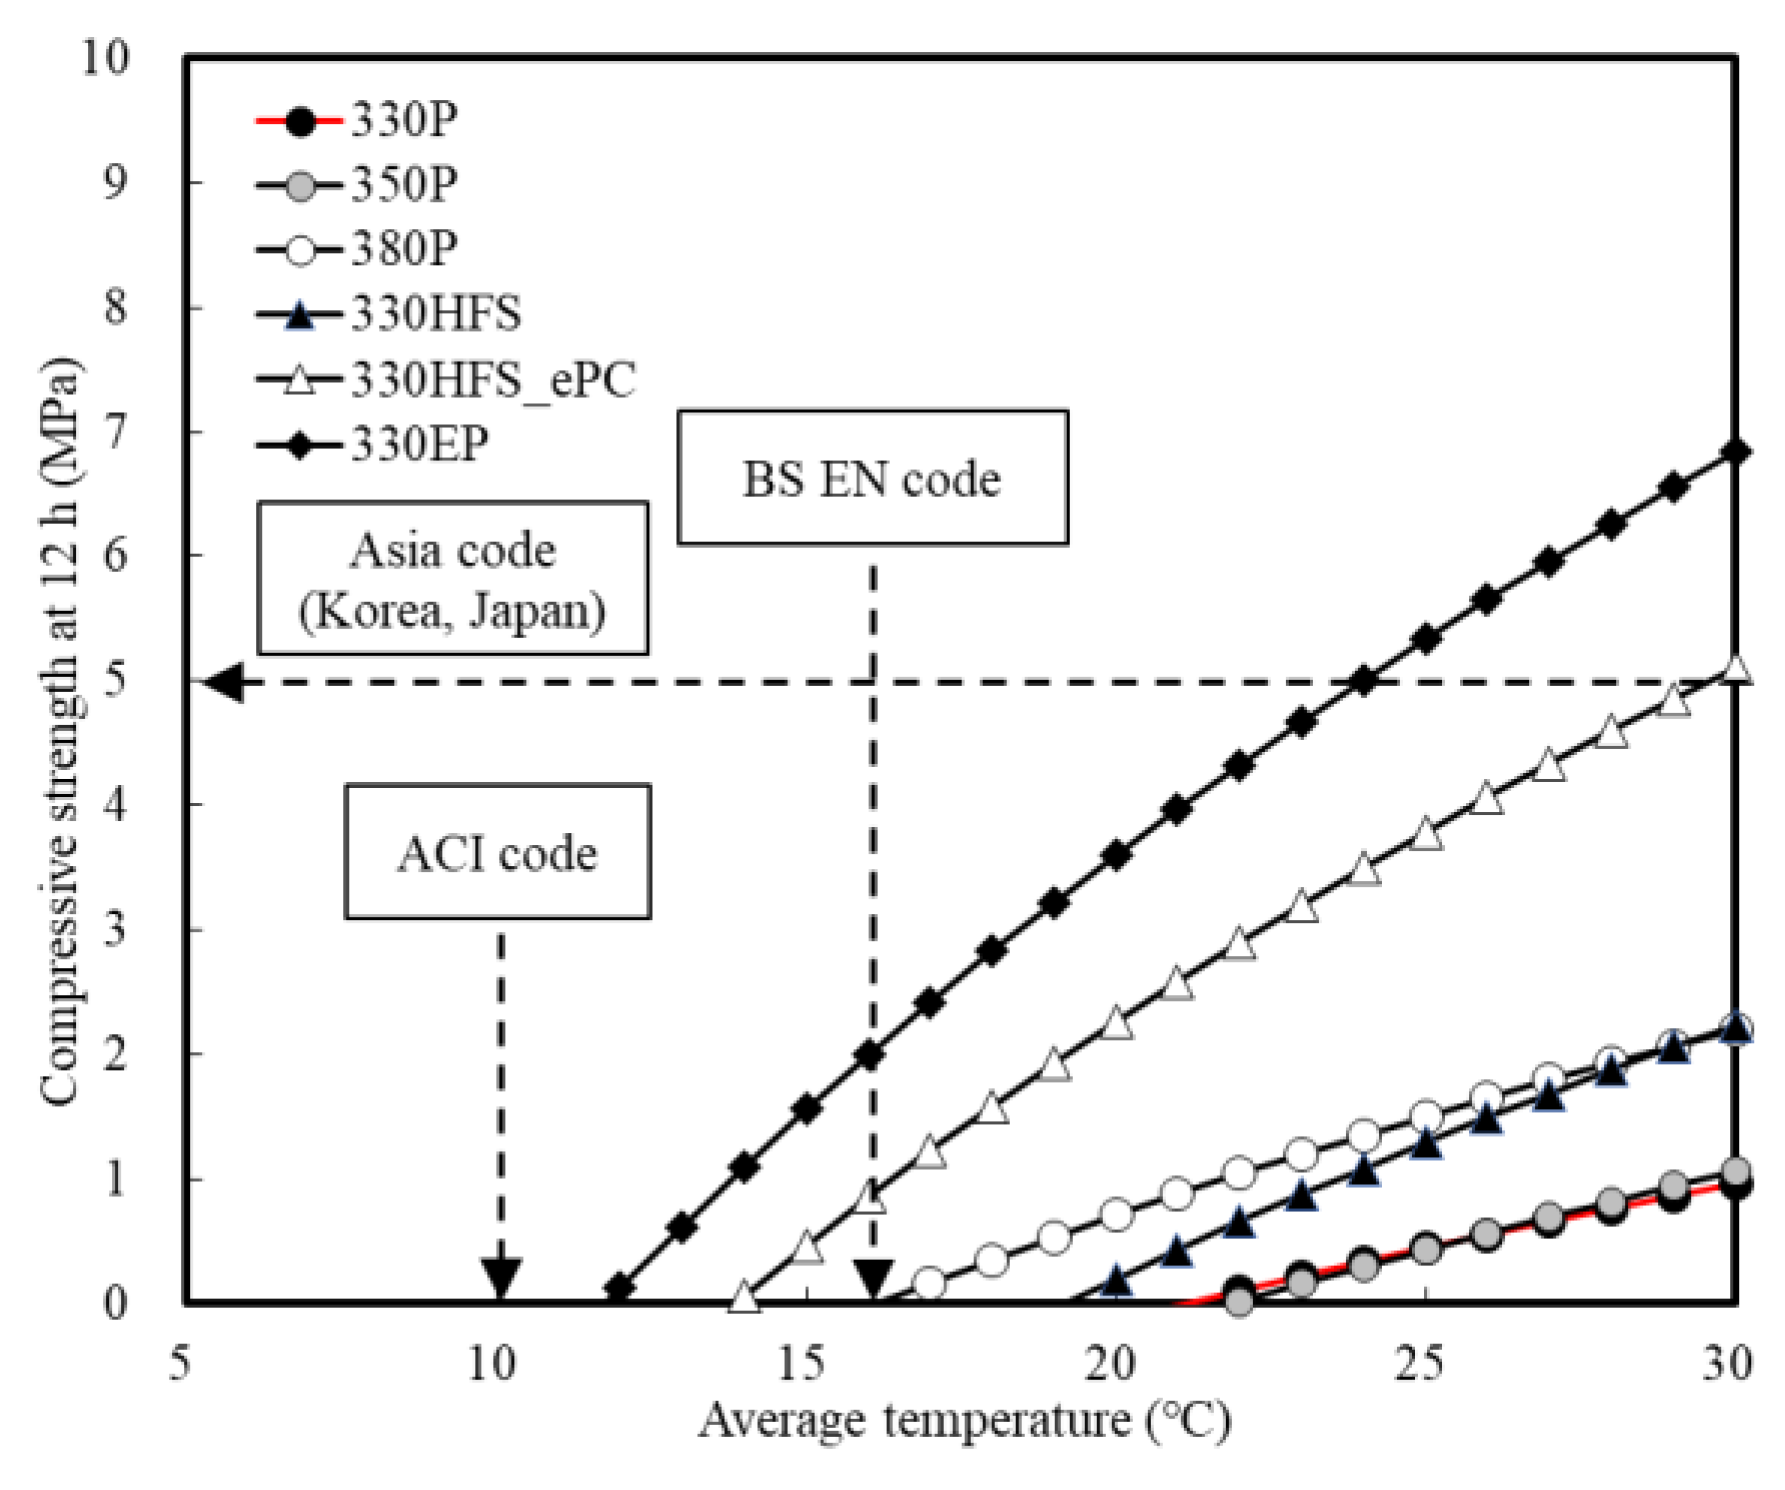
3.5. Comparison of Escape Time for Vetical Form Removal
4. Conclusions
- (1)
- The slump and air content necessary for securing the workability on concrete met the set target ranges both at the beginning and after 60 min. The strength development of concrete was further accelerated by the cement type and the addition of EPC than when the unit weight of cement was increased. In addition, the strength development rate of concrete was higher at lower temperatures.
- (2)
- For the maturity of concrete, the strength development tended to increase according to the maturity. This is because the unit weight of cement increased for the concrete mixtures that used OPC. The effect, however, was not significant when the HFS_OPC and EPC were used.
- (3)
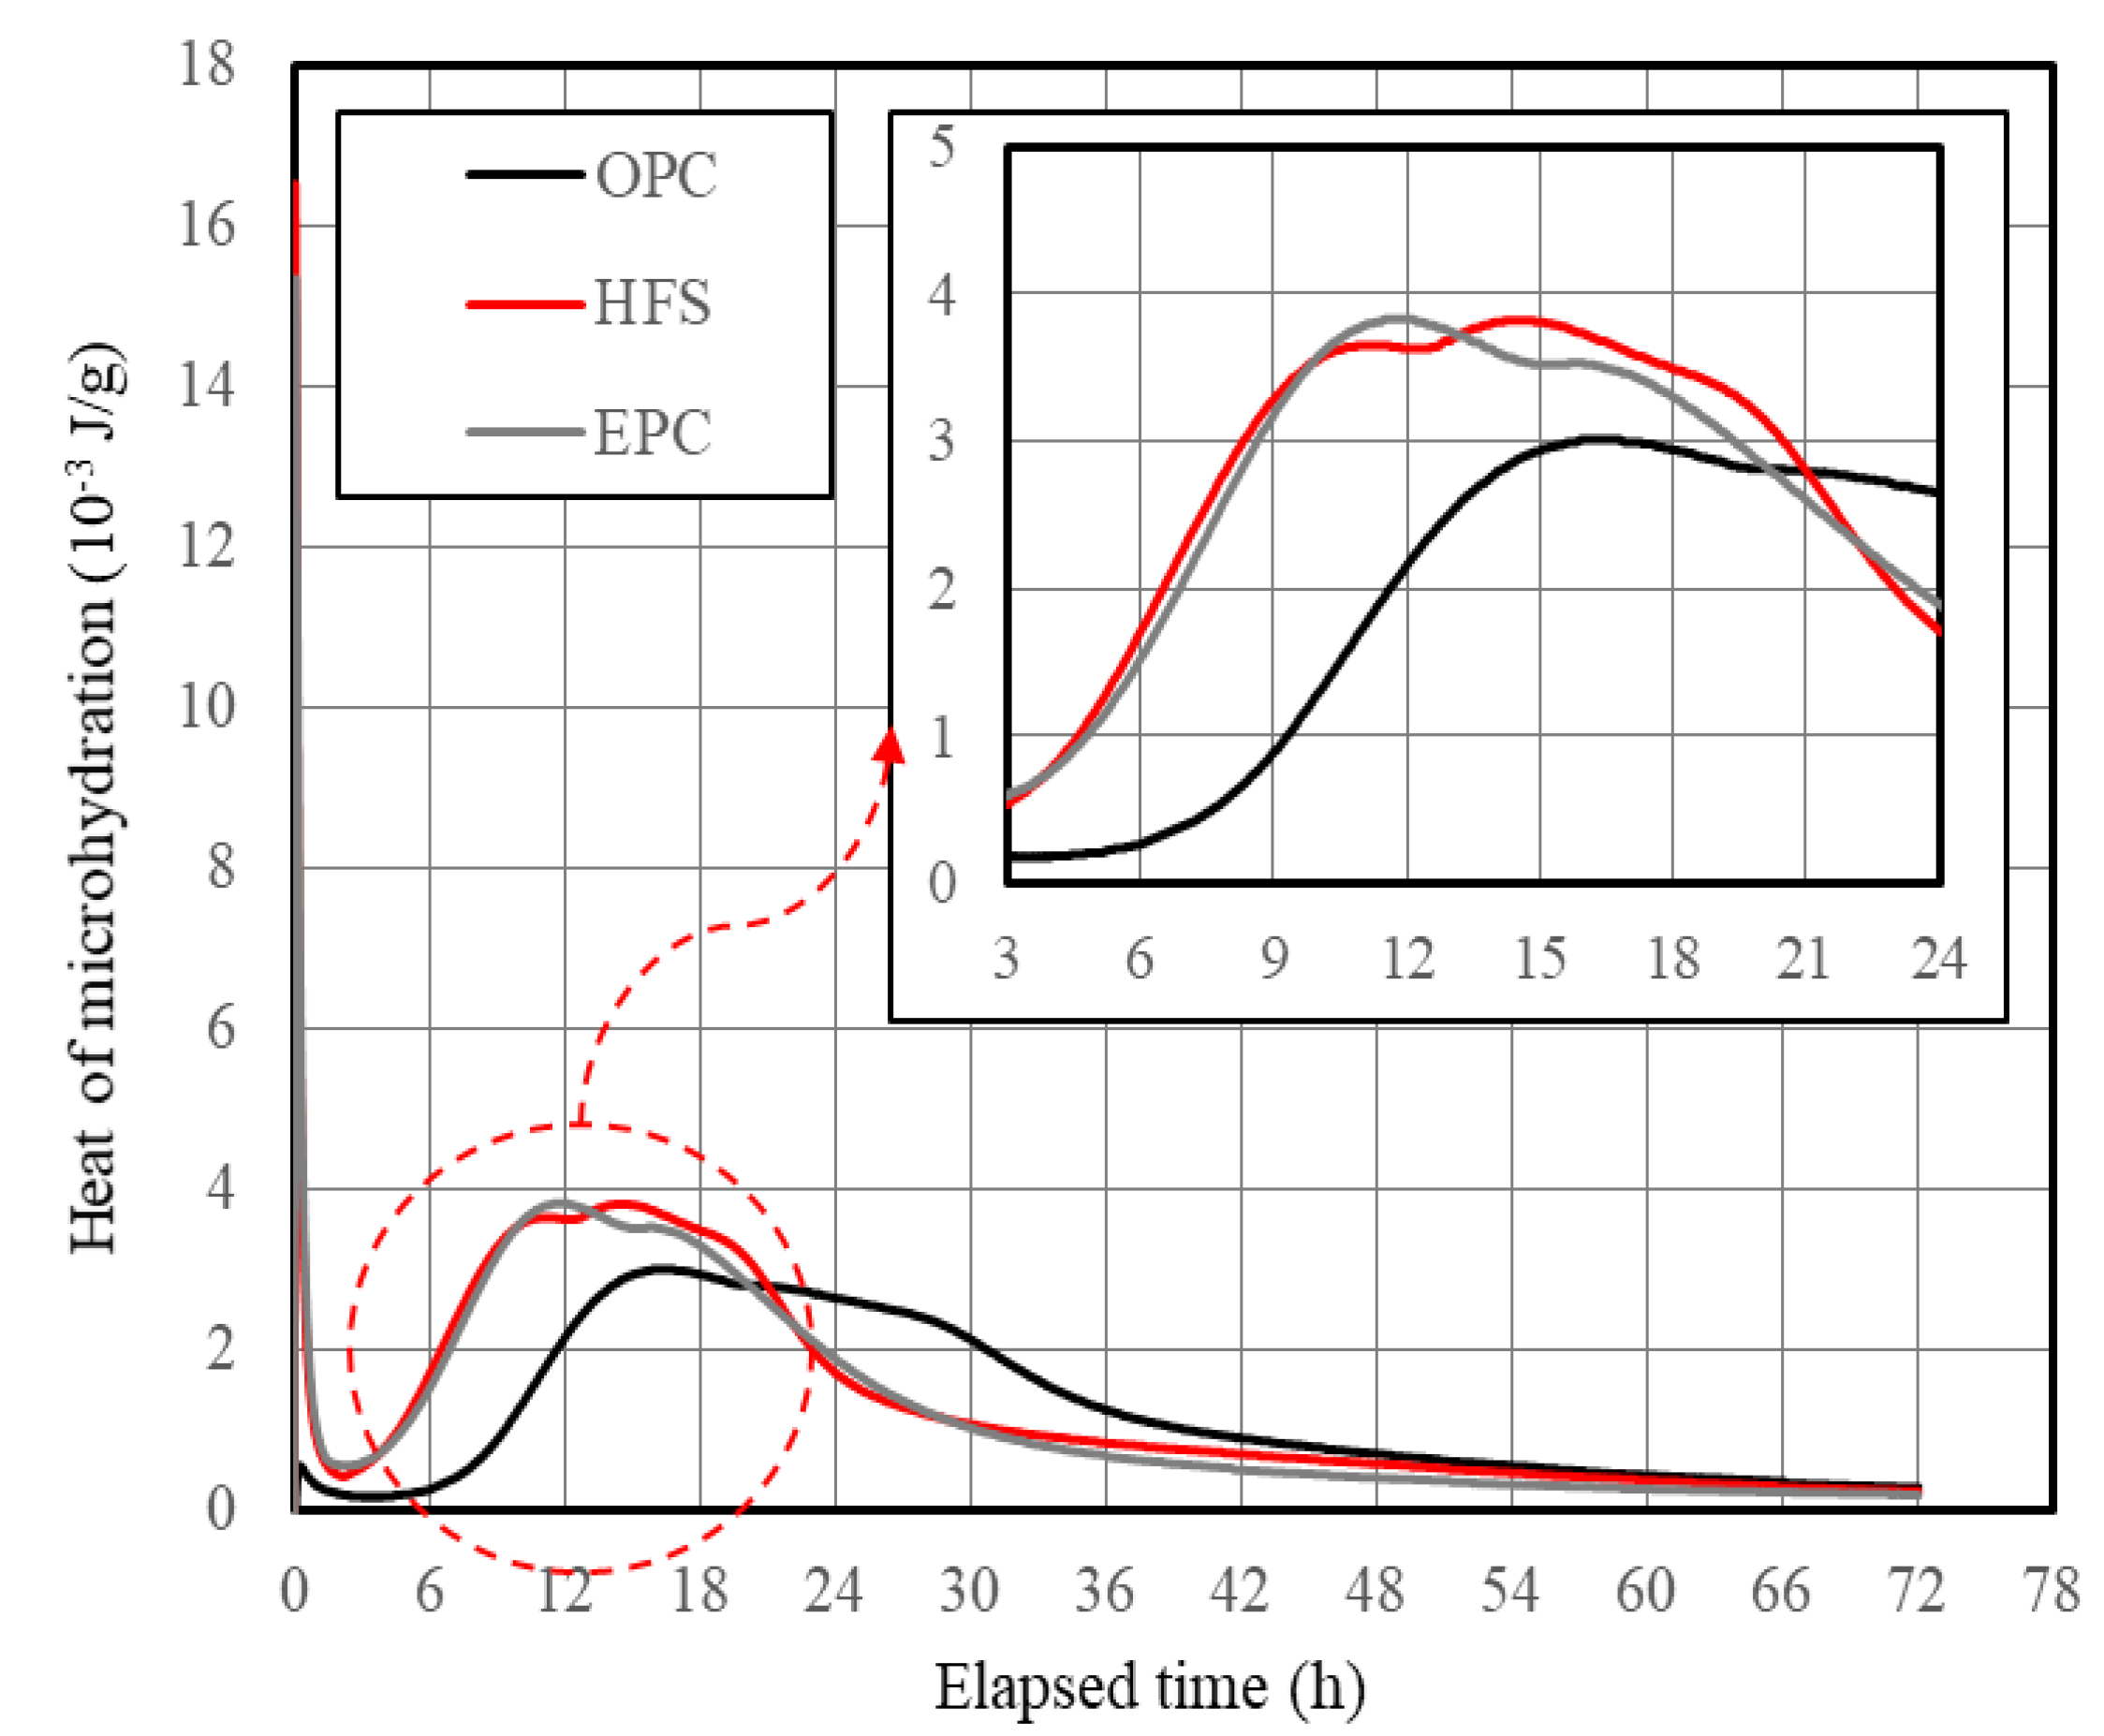
- When the amount of heat of each mixture was calculated based on the microhydration heat results of cement, no significant differences were found in the total amount of heat within 24 h depending on the unit weight of cement. In addition, analyzing the results of the amount of heat for each cement type showed that HFS and EPC exhibited significantly high values compared to OPC until 24 h, indicating that they are favorable for the development of early strength.
- (4)
- The relation between concrete strength and the cement fineness showed that the compressive strength tended to increase with the fineness of cement, and an optimal fineness between 4300 m2/kg and 4500 m2/kg was obtained. The microhydration heat was found to be higher when the fineness of cement was high than when the unit weight of cement was increased. The results of analyzing the amount of heat for each cement type showed that HFS and EPC exhibited significantly higher values compared with OPC up to 24 h. Thus, they are expected to be favorable for early strength development.
- (5)
- A linear relationship was observed between the SO3 content and relative strength of cement when SO3 content was less than 4%. In addition, when the unit weight of cement was increased, the early strength was slightly increased owing to the increase in overall SO3 content.
- (6)
- The criterion of each country for the formwork removal time on concrete were examined and applying the Asian criterion was judged to be effective, which presents a clear compressive strength of 5 MPa. The use of EPC and HFS_ePC can shorten the formwork removal time by 20–24 h at 10 °C and by 14–16 h at 20 °C.
Author Contributions
Funding
Conflicts of Interest
References
- Barnes, P.; Bensted, J. Structure and Performance of Cements, 2nd ed.; CRC Press: London, UK, 2002. [Google Scholar] [CrossRef]
- Mehta, P.; Monteiro, P. Concrete: Microstructure, Properties, and Materials, 3rd ed.; McGraw-Hill: New York, NY, USA, 2006. [Google Scholar]
- Scrivener, K.L.; Nonat, A. Hydration of cementitious materials, present and future. Cem. Concr. Res. 2011, 41, 651–665. [Google Scholar] [CrossRef]
- Juilland, K.; Monteiro, P. Advances in understanding hydration of Portland cement. Cem. Concr. Res. 2015, 78, 38–56. [Google Scholar] [CrossRef]
- Abrams, D. Design of Concrete Mixtures, Structural Materials Research Laboratory; Bulletin No. 1, PCA LS001; Lewis Institute: Chicago, IL, USA, 1919. [Google Scholar]
- Cheung, J.; Jeknavorian, A.; Roberts, L.; Silva, D. Impact of admixtures on the hydration kinetics of Portland cement. Cem. Concr. Res. 2011, 41, 1289–1309. [Google Scholar] [CrossRef]
- Bentz, D.P.; Peltz, M.; Winpigler, J. Early-age properties of cement-based materials: II. Influence of water-to-cement ratio. ASCE J. Mat. Civ. Eng. 2009, 1–14. [Google Scholar] [CrossRef] [Green Version]
- ASTM C150. Standard specification for Portland cement. In American Society of Testing and Materials; ASTM: West Conshohocken, PA, USA, 2019; pp. 1–10. [Google Scholar]
- Bentz, D.P. Blending different fineness cements to engineer the properties of cement-based materials. Mag. Concr. Res. 2010, 62, 327–338. [Google Scholar] [CrossRef] [Green Version]
- Bentz, D.P.; Haecker, C.J. An argument for using coarse cements in high-performance concretes. Cem. Concr. Res. 1999, 29, 615–618. [Google Scholar] [CrossRef]
- Bentz, D.P.; Garboczi, E.J.; Haecker, C.J.; Jensen, O.M. Effects of cement particle size distribution on performance properties of Portland cement-based materials. Cem. Concr. Res. 1999, 29, 1663–1671. [Google Scholar] [CrossRef]
- Frigione, G.; Marra, S. Relationship between particle size distribution and compressive strength in Portland cement. Cem. Concr. Res. 1976, 6, 113–127. [Google Scholar] [CrossRef]
- Osbaeck, B.; Johansen, V. Particle size distribution and rate of strength development of Portland cement. J. Am. Ceram. Soc. 1989, 72, 197–201. [Google Scholar] [CrossRef]
- Lee, J.; Lee, T. Influences of chemical composition and fineness on the development of concrete strength by curing conditions. Materials 2019, 12, 4061. [Google Scholar] [CrossRef] [PubMed] [Green Version]
- Lee, J.; Lee, T. Effects of high CaO fly ash and sulfate activator as a finer binder for cementless grouting material. Materials 2019, 12, 3664. [Google Scholar] [CrossRef] [PubMed] [Green Version]
- Rixon, R.; Mailvaganam, N. Chemical Admixtures for Concrete, 3rd ed.; E & FN Spon: London, UK, 1999. [Google Scholar] [CrossRef]
- Heren, Z.; Ölmez, H. The influence of ethanolamines on the hydration and mechanical properties of Portland cement. Cem. Concr. Res. 1996, 26, 701–705. [Google Scholar] [CrossRef]
- Aiad, I.; Mohammed, A.A.; Abo-El-Enein, S.A. Rheological properties of cement pastes admixed with some alkanolamines. Cem. Concr. Res. 2003, 33, 9–13. [Google Scholar] [CrossRef]
- Aggoun, S.; Cheikh-Zouaoui, M.; Chikh, N.; Duval, R. Effect of some admixtures on the setting time and strength evolution of cement pastes at early ages. Constr. Build. Mater. 2008, 22, 106–110. [Google Scholar] [CrossRef]
- ACI 347-04. Guide to Formwork for Concrete; ACI 347; ACI Committee: Farmington Hills, MI, USA, 2005. [Google Scholar]
- Ceb-Fip Model code 1990, 1993: Design Code; Telford: London, UK, 1993. [CrossRef]
- BS EN 13670:2009. Execution of Concrete Structures; BSI: London, UK, 2010. [Google Scholar]
- KASS 5. Korea Architectural Standard Specification Reinforced Concrete Work; Architectural Institute of Korea: Seoul, Korea, 2009. [Google Scholar]
- JASS 5. Japanese Architectural Standard Specification Reinforced Concrete Work; Architectural Institute of Japan: Tokyo, Japan, 2009. [Google Scholar]
- Lee, T.; Lee, J.; Kim, Y. Effects of admixtures and accelerators on the development of concrete strength for horizontal form removal upon curing at 10 °C. Constr. Build. Mater. 2020, 37, 1–7. [Google Scholar] [CrossRef]
- ASTM C204. Standard test methods for fineness of hydraulic cement by air-permeability apparatus. In American Society of Testing and Materials; ASTM: West Conshohocken, PA, USA, 2018; pp. 1–11. [Google Scholar]
- ASTM C114-18. Standard test methods for chemical analysis of hydraulic cement. In American Society of Testing and Materials; ASTM: West Conshohocken, PA, USA, 2018; pp. 1–33. [Google Scholar]
- ASTM C1702. Standard test method for measurement of heat of hydration of hydraulic cementitious materials using isothermal conduction calorimetry. In American Society of Testing and Materials; ASTM: West Conshohocken, PA, USA, 2015; pp. 1–9. [Google Scholar] [CrossRef]
- ASTM C143/C143M REV A. Standard test method for slump of hydraulic-cement concrete. In American Society of Testing and Materials; ASTM: West Conshohocken, PA, USA, 2015; pp. 1–4. [Google Scholar]
- ASTM C231/C231M-17a. Standard test method for air content of freshly mixed concrete by the pressure method. In American Society of Testing and Materials; ASTM: West Conshohocken, PA, USA, 2017; pp. 1–10. [Google Scholar]
- ASTM C873/C873M. Standard test method for compressive strength of concrete cylinders cast in place in cylindrical molds. In American Society of Testing and Materials; ASTM: West Conshohocken, PA, USA, 2015; pp. 1–4. [Google Scholar] [CrossRef]
- ASTM C39/C39M. Standard test method for compressive strength of cylindrical concrete specimens. In American Society of Testing and Materials; ASTM: West Conshohocken, PA, USA, 2018; pp. 1–8. [Google Scholar]
- ASTM C1074. Standard practice for estimating concrete strength by the maturity method. In American Society of Testing and Materials; ASTM: West Conshohocken, PA, USA, 2019; pp. 1–10. [Google Scholar]
- BS EN 197-1. Cement Part 1: Composition, Specifications and Conformity Criteria for Common; BSI: London, UK, 2011. [Google Scholar]
- Mohammed, S.; Safiullah, O. Optimization of the SO3 content of an Algerian Portland cement: Study on the effect of various amounts of gypsum on cement properties. Constr. Build. Mater. 2018, 164, 362–370. [Google Scholar] [CrossRef]
- Benaicha, M.; Burtschell, Y.; Alaoui, A. Prediction of compressive strength at early age of concrete—Application of maturity. J. Build. Eng. 2016, 6, 119–125. [Google Scholar] [CrossRef]
- Pomares, J.C.; Gonzalez, A.; Saura, P. Simple and Resistant Construction Built with Concrete Voussoirs for Developing Countries. J. Constr. Eng. Manag. 2018, 144. [Google Scholar] [CrossRef]
- Bautista, A.; Pomares, J.C.; González, M.N.; Velasco, F. Influence of the microstructure of TMT reinforcing bars on their corrosion behavior in concrete with chlorides. Constr. Build. Mater. 2019, 229, 116899. [Google Scholar] [CrossRef] [Green Version]
- Małek, M.; Jackowski, M.; Łasica, W.; Kadela, M. Characteristics of Recycled Polypropylene Fibers as an Addition to Concrete Fabrication Based on Portland Cement. Materials 2020, 13, 1827. [Google Scholar] [CrossRef] [PubMed] [Green Version]


| Materials | Chemical Composition (%) | L.O.I. (4) | |||||||
|---|---|---|---|---|---|---|---|---|---|
| CaO | Al2O3 | SiO2 | MgO | Fe2O3 | SO3 | K2O | Others | ||
| OPC (1) | 60.34 | 4.85 | 19.82 | 3.83 | 3.30 | 2.90 | 1.08 | 0.86 | 3.02 |
| HFS (2) | 61.00 | 4.51 | 19.22 | 4.14 | 3.35 | 3.13 | 1.04 | 0.79 | 2.82 |
| EPC (3) | 61.44 | 4.72 | 20.33 | 2.95 | 3.42 | 3.73 | 0.95 | 0.79 | 1.67 |
| Series | Mix ID. | W/C | Cement Type | Unit Weight of Cement (kg/m3) | Chemical Admixture | Curing Temperature (°C) | Evaluation Item |
|---|---|---|---|---|---|---|---|
| Ⅰ | 330P | 0.50 | OPC | 330 | PC | Chamber (13 °C) | ▪ Slump (mm) |
| 350P | 0.47 | 350 | ▪ Air contents (%) | ||||
| 380P | 0.43 | 380 | ▪ Compressive strength (MPa) | ||||
| Ⅱ | 330P | 0.50 | OPC | 330 | PC (1) | Room Temp. (20 °C) | - Cylinder Mold (Ø100 × 200) |
| 330HFS | HFS | 330 | PC | - 18, 24, and 72 h | |||
| 330HFS_ePC | HFS | 330 | ePC (2) | ▪ Temperature history (°C) | |||
| 330EP | EPC | 330 | PC | and Maturity (D∙h) |
| Series | Mix ID. | W/C (1) | S/a (2) (%) | Unit Weight (kg/m3) | PC (B×%) | ePC (B×%) | |||||
|---|---|---|---|---|---|---|---|---|---|---|---|
| W (3) | C (4) | HFS (5) | EPC (6) | S (7) | G (8) | ||||||
| Ⅰ | 330P | 0.50 | 48.5 | 165 | 330 | 885 | 891 | 0.8 | |||
| 350P | 0.47 | 48.5 | 165 | 350 | 876 | 883 | 0.8 | ||||
| 380P | 0.43 | 48.5 | 165 | 380 | 864 | 870 | 0.8 | ||||
| Ⅱ | 330P | 0.50 | 48.5 | 165 | 330 | 885 | 891 | 0.8 | |||
| 330HFS | 0.50 | 48.5 | 165 | 330 | 884 | 890 | 0.8 | ||||
| 330HFS_ePC | 0.50 | 48.5 | 165 | 330 | 884 | 890 | 0.8 | ||||
| 330EP | 0.50 | 48.5 | 165 | 330 | 885 | 891 | 0.8 | ||||
| Series | Test Item | Test Method |
|---|---|---|
| Raw materials (Cement) | Particle size distribution (%) | ASTM C204 |
| X-ray fluorescence | ASTM C114 | |
| Heat of Hydration | ASTM C1702 | |
| Mechanical properties analysis (Concrete) | Compressive strength (MPa) | ASTM C873 |
| ASTM C39 | ||
| Maturity (D∙h) | ASTM C1074 |
| Mix ID. | Slump (mm) | Air Content (%) | ||
|---|---|---|---|---|
| Initial | After 60 min. | Initial | After 60 min. | |
| 330P | 190 | 175 | 5.4 | 5.0 |
| 350P | 195 | 185 | 4.8 | 4.4 |
| 380P | 195 | 180 | 4.3 | 3.9 |
| 330HFS | 200 | 185 | 4.4 | 4.0 |
| 330HFS_ePC | 205 | 190 | 5.8 | 5.4 |
| 330EP | 195 | 175 | 5.5 | 5.0 |
© 2020 by the authors. Licensee MDPI, Basel, Switzerland. This article is an open access article distributed under the terms and conditions of the Creative Commons Attribution (CC BY) license (http://creativecommons.org/licenses/by/4.0/).
Share and Cite
Lee, T.; Lee, J.; Kim, J.; Choi, H.; Lee, D.-E. Effect of Formwork Removal Time Reduction on Construction Productivity Improvement by Mix Design of Early Strength Concrete. Appl. Sci. 2020, 10, 7046. https://doi.org/10.3390/app10207046
Lee T, Lee J, Kim J, Choi H, Lee D-E. Effect of Formwork Removal Time Reduction on Construction Productivity Improvement by Mix Design of Early Strength Concrete. Applied Sciences. 2020; 10(20):7046. https://doi.org/10.3390/app10207046
Chicago/Turabian StyleLee, Taegyu, Jaehyun Lee, Jinsung Kim, Hyeonggil Choi, and Dong-Eun Lee. 2020. "Effect of Formwork Removal Time Reduction on Construction Productivity Improvement by Mix Design of Early Strength Concrete" Applied Sciences 10, no. 20: 7046. https://doi.org/10.3390/app10207046