Article

The Laboratory-Based HySpex Features of Chlorite as the Exploration Tool for High-Grade Iron Ore in Anshan-Benxi Area, Liaoning Province, Northeast China

1
School of Resources and Civil Engineering, Northeastern University, Shenyang 110819, China
2
Division of Earth and Planetary Science & Laboratory for Space Research, the University of Hong Kong, Hong Kong 999077, China
*
Author to whom correspondence should be addressed.
Appl. Sci. 2020, 10(21), 7444; https://doi.org/10.3390/app10217444
Submission received: 29 September 2020 / Revised: 15 October 2020 / Accepted: 21 October 2020 / Published: 23 October 2020
(This article belongs to the Special Issue Remote Sensing and Geoscience Information Systems in Applied Sciences)

Abstract

:
Anshan-Benxi area in Liaoning province is an important banded iron formations (BIFs) ore-mining district in China. Chlorite is widely distributed in this area, which is related to BIFs and high-grade iron ore, respectively. A fast and convenient method to identify the type and spatial distribution of different chlorites is crucial to the evaluation of high-grade iron ore in this area. Qidashan iron mine is a typical BIFs deposit, and its BIFs-related high-grade iron ore reserves are the second largest in the area. In this paper, the laboratory-based HySpex-320m hyperspectral imaging was used to study the wall rock in Qidashan iron mine. A hyperspectral imaging processing model was established for mineral identification, mineralogy mapping, and chlorite spectral features extraction. The results show that the wavelength positions of OH, Fe-OH, and Mg-OH absorptions of chlorite in the altered wall rock of high-grade iron ore are between 1400 and 1410, 2260 and 2265, and 2360 and 2370 nm, respectively, which are longer than those around BIFs. The relationship between cations in the octahedral layer of chlorite and the wavelengths of OH, Fe-OH, and Mg-OH indicates that Mg and Mg/(Mg + Fe) are inversely related to these wavelengths, whereas Fe is positively related. The wavelengths appear to be weakly influenced by AlVI. Since the bandpass of hyperspectral imaging systems is usually less than 10 nm, these chlorite wavelength differences can be used as a favorable tool for the high-grade iron ore exploration and the iron resources evaluation in the Anshan-Benxi area.

1. Introduction

Nowadays, hyperspectral remote sensing is a hot topic in the remote sensing field. It was originally proposed for minerals. In the 1980s, based on the study of mineral reflectance spectroscopy models by Clark and Hapke [1,2,3], the unique advantages of hyperspectral remote sensing in geological applications were gradually recognized by many scholars. Traditional hyperspectral imaging is mostly used in aircraft or satellite platforms and suitable for large-scale geology mapping. On the other hand, emerging terrestrial imaging spectroscopy methods, such as laboratory-based and field-based methods, have been used for various geoscience applications, including mineral exploration [4,5,6,7], sedimentology analysis [8,9], mineral identification, and alteration zonation mapping, etc. [10,11,12]. Compared to those of airborne and satellite-borne, the laboratory-based hyperspectral imaging can obtain mineralogical maps at centimeter to millimeter scale, thus providing more detailed information about the internal spatial distribution of rock specimens.
Anshan-Benxi area, Liaoning province, is one of the most important BIFs ore resource bases in China, among which the Qidashan is interpreted as the second largest one. The iron ores in this area are mainly composed of BIFs and BIFs-related high-grade iron ores. The high-grade iron ore has the characteristics of high iron grade and more industrial economics. Chloritization shows close relations to the high-grade iron ore, which can be regarded as the crucial prospecting criteria [13]. Unfortunately, the chlorite does not merely distribute around the high-grade ores, actually, it is widespread everywhere in the mining district, which is thought to be related to the low-medium grade regional metamorphism. Furthermore, high-grade iron ores are also distributed in other deposits of the Anshan-Benxi area. Examples include the Gongchangling, Yanqianshan, Waitoushan, Dawanggou, Banpanling, and Nanfen iron deposits. Their wall rock alteration consists of chloritization, sericitization, etc., which is similar to the Qidashan [14]. Although many researches such as geophysical exploration, geochemistry, and geochronology have been carried out on these mines, the hyperspectral imaging method, which has the advantages of quick-evaluation of the high-grade iron ore resources, has rarely been conducted.
In this paper, the laboratory-based HySpex-320m spectrometer was adopted to study the wall rock of Qidashan Iron Deposit. The alteration minerals, assemblage, texture, and the spectral features of chlorite were identified. A model of hyperspectral image processing and spectral feature extraction was promoted, and the spectral differences of two kinds of chlorites extracted from wall rock of BIFs and high-grade iron ore were analyzed. Finally, the relationship between cations of the chlorite octahedral layer and the spectral absorption features was discussed.

2. The Application Principle of Hyperspectral Imaging in Geoscience

2.1. The Causes of Absorption Features of Minerals

The bandpass of hyperspectral remote sensing is usually below 10 nm, so the continuous spectra and the spectral details can be obtained. This lays the foundation for the identification and analysis of minerals by hyperspectral remote sensing at the spectral level. It is also the main feature and biggest advantage that distinguishes hyperspectral from multispectral remote sensing.
In the spectral range of 350~2500 nm, the spectral absorption features of minerals are the diagnostic of crystal structure and chemical composition. The spectra of different minerals are generally different, even the minerals of the same family also have subtle spectral differences due to chemical composition variations. There are two general processes that cause spectral absorption features of minerals: electronic and vibrational [15,16,17,18,19]. In the visible and near-infrared spectral range (VNIR: 350~1200 nm), the causes of spectral absorption features are electronic processes, including crystal field effects, charge transfer absorptions, conduction bands, and color centers, among which the crystal field effects of Fe2+ and Fe3+ and the charge transfer absorptions of Fe2+-Fe3+ are most common. In the short-wave infrared spectroscopy (SWIR: 1200~2500 nm), the causes of the spectral absorption features are predominated by the vibration process, which is mainly caused by the first overtone of the hydroxyl group (OH) and the combination vibrations involving OH stretching and cation-O-H bending in the octahedron. Common vibrational absorptions include aluminum hydroxyl (Al-OH), magnesium hydroxyl (Mg-OH), water (H2O), and carbonate (CO32−), etc.

2.2. The Spectral Absorption Features of Chlorite

The crystal structure of the chlorite has a 2:1 ratio of tetrahedral (T) to octahedral (O) layers (talc-like) with edge-sharing M2+(OH)6 octahedra (brucite-like layer) in the interlayer between each set of 2:1 sheets [20] (Figure 1). Chlorite has three octahedral cation sites in octahedral layers, one slightly larger M1 site and two slightly smaller M2 sites [21]. Cation substitution of chlorite is common in M sites, and mineral chemistry can vary significantly from endmember composition. The substitution of Si by Al occurs in the tetrahedral sheet of 2:1 layer, whereas the mutual substitution of Mg and Fe usually occurs in the brucite-like layer and the 2:1 layer of octahedral sheet [22].
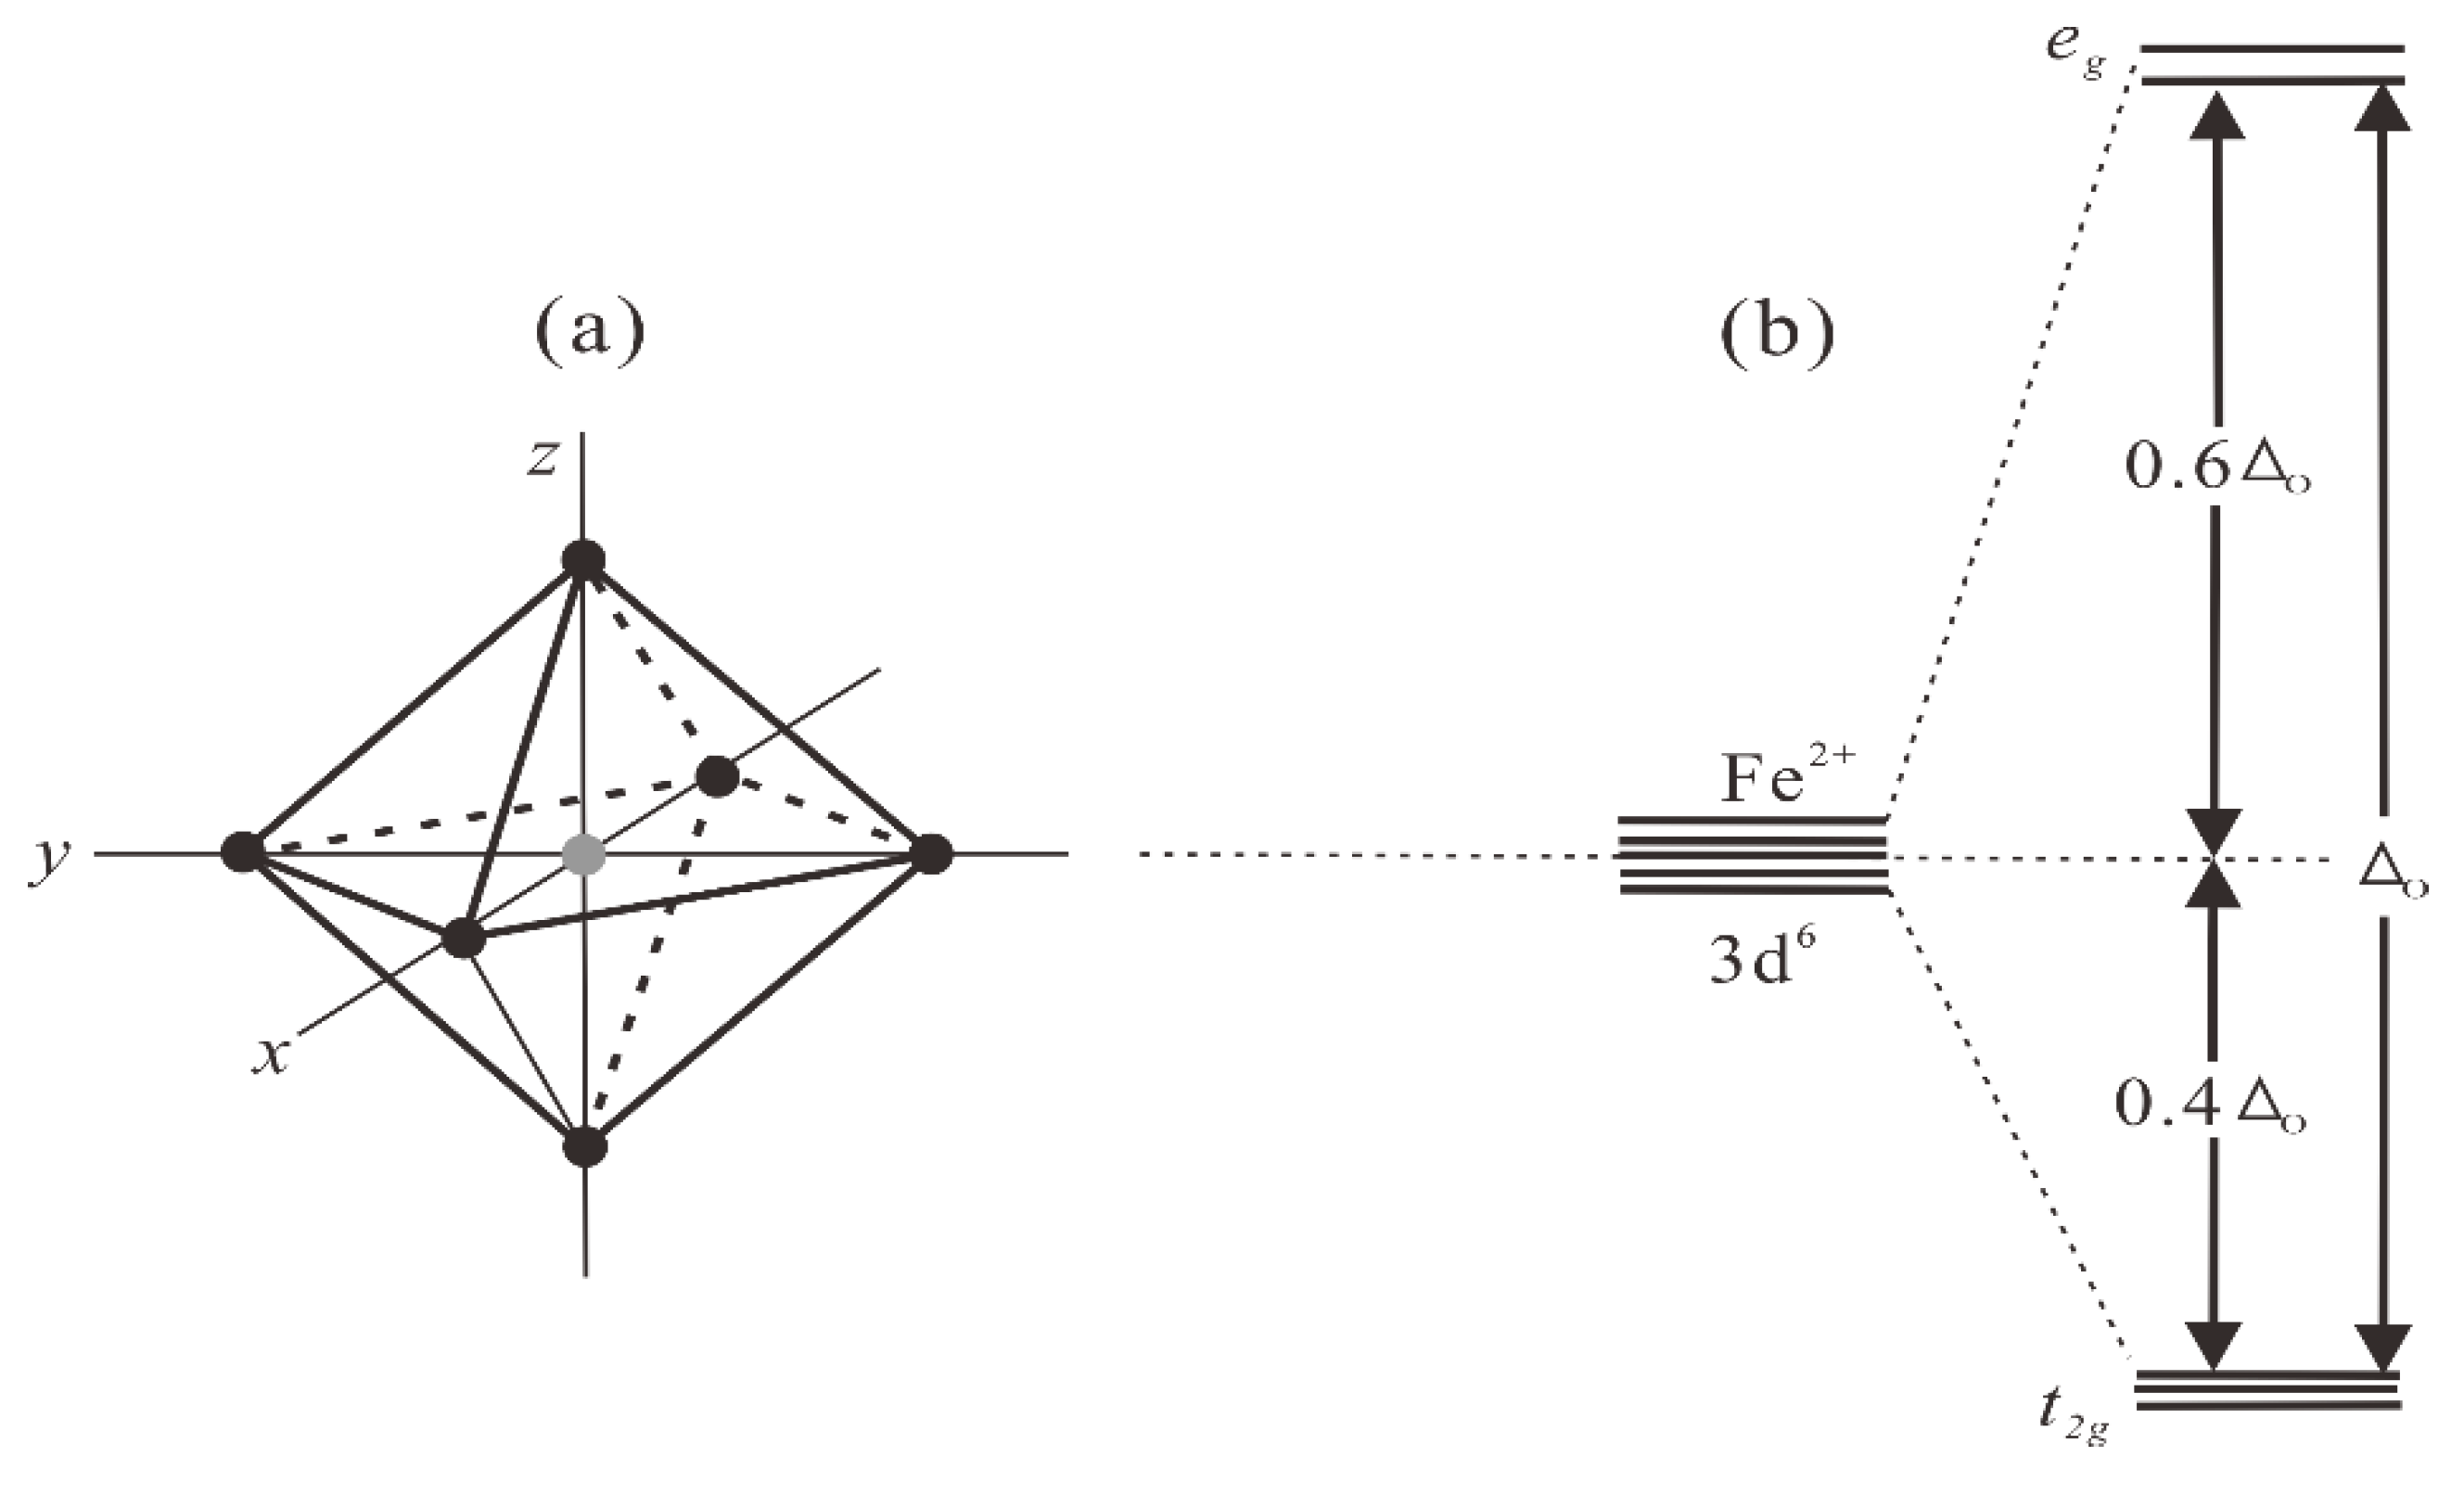
The spectral absorption features of chlorite in the VNIR are mainly caused by the crystal field effect of iron, which is the most common transition element in minerals. When the Fe is in octahedral coordination with six identical ligands, electrons in all five unfilled 3d orbitals are split into eg and t2g energy levels [23] (Figure 2). For example, the broad absorption band of 1.0–1.1 μm in chlorite is caused by the Fe2+ spin-allowed transition between eg and t2g [18]. This absorption band is also commonly found in phyllosilicate minerals such as sericite. Other spectral features of chlorite are listed in Figure 3.
The spectral absorption features of chlorite in the SWIR are assigned to combinations or overtones of the OH bound to octahedral cations (Figure 4). Chlorite is characterized by the Fe-OH absorption band near 2250 nm (combinations of O-H stretching and Fe-OH bending vibration), whose wavelength position varies as a function of the relative amount of cations in the octahedral sheet [24]. Other spectral features of chlorite are listed in Figure 3.

3. Geological Settings and Sampling

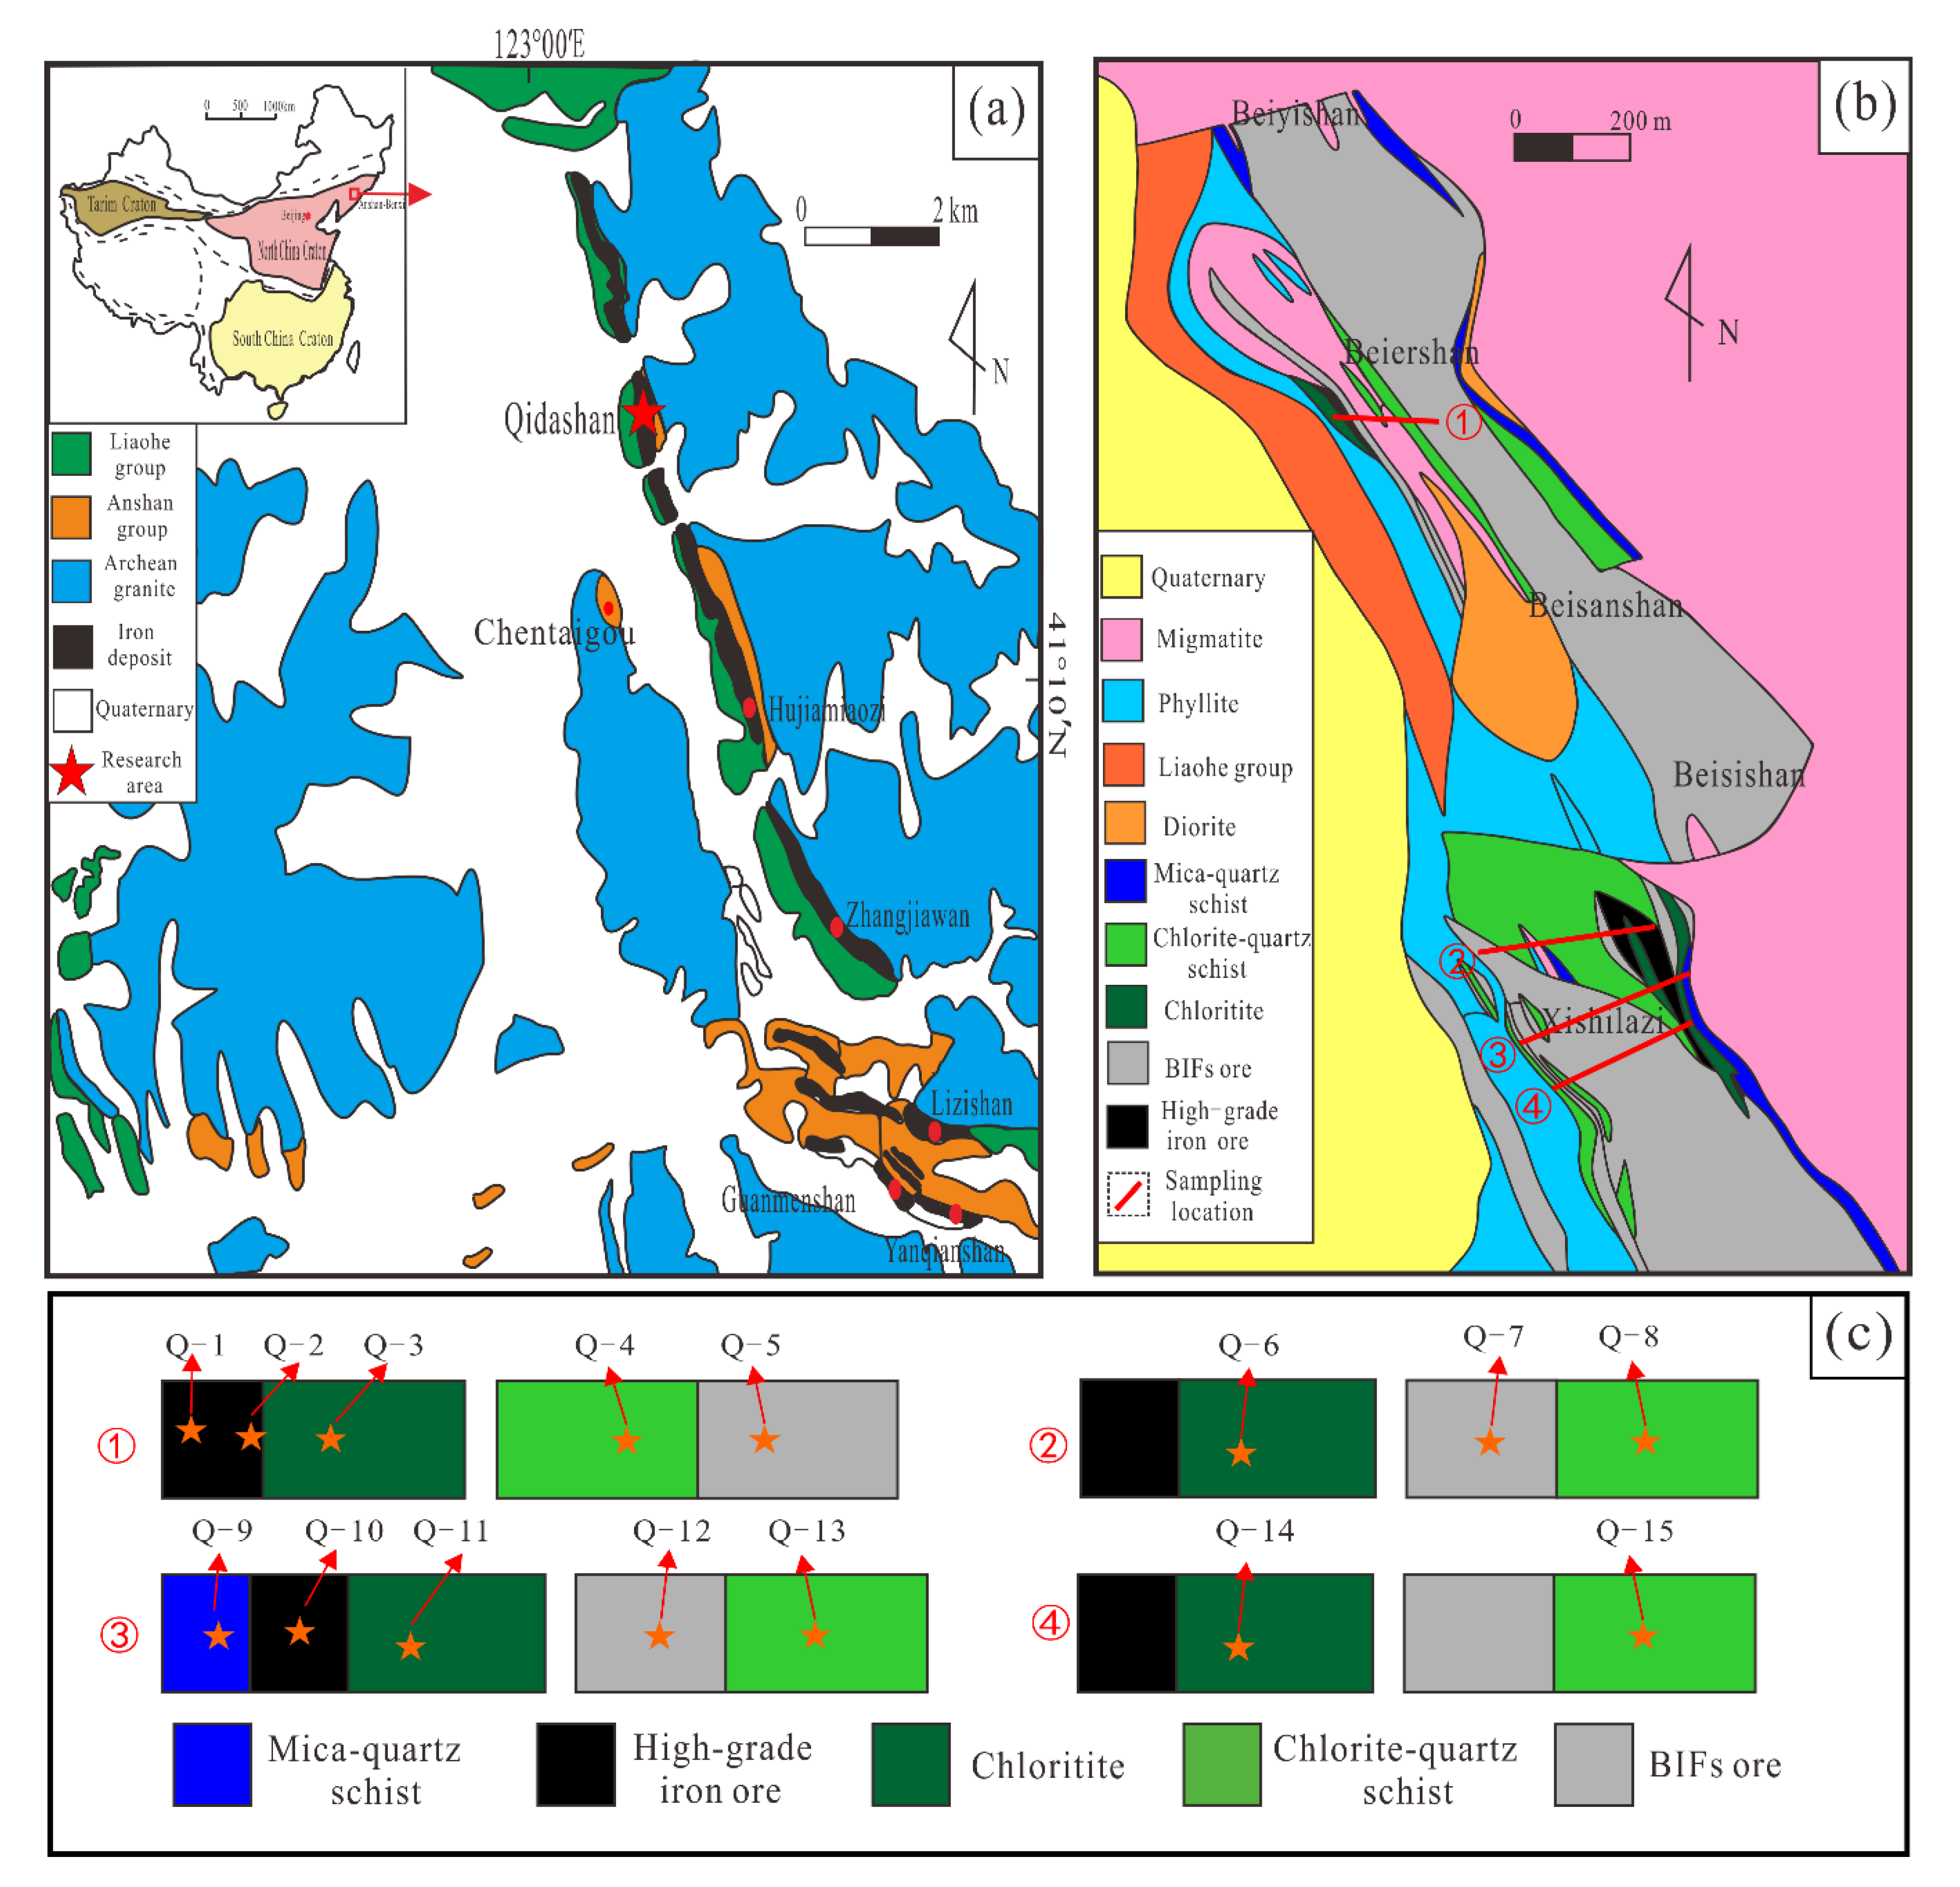
The Qidashan Iron Deposit, with proven BIFs ore reserves of 1259 Mt and high-grade iron ore reserves of 11.45 Mt, lies in the Anshan-Benxi area, Northeastern part of the North China Craton [14]. The deposit belongs to metamorphic volcanic-sedimentary iron deposit, and the stratum exposed in the mining area is mainly Archean Anshan group and Proterozoic Liaohe Group (Figure 5a). The main lithology of Yingtaoyuan formation where the BIFs ore was located is chlorite quartz schist, chlorite talc schist, sericite quartzite, metagranite, amphibolite, and banded iron quartzite. Large areas of Neoarchean granite are distributed on both the east and west sides of the deposit (Figure 5b).
The Qidashan Iron Deposit is a typical BIFs deposit. The BIFs are chemical sedimentary rock characterized by the commonly alternating presence of iron-rich layers and silica-rich layers [25]. BIFs-related iron deposits in China are mainly composed of magnetite (average 30.35% total Fe) with subordinate amount of high-grade magnetite ores (total Fe ≥ 50%) [26]. Low-grade iron ores (BIFs) in the Qidashan Iron Deposit are composed of quartz band and magnetite band with a width of about 1 mm. The high-grade iron ores in the BIFs are mainly massive and composed of magnetite, quartz, and chlorite. They are considered to have resulted from hydrothermal enrichment of BIFs near the faults, which are consistent with the occurrence of the BIFs layer [14]. The main types of wall rock alteration of Qidashan Iron Deposit include chloritization, sericitization, biotitization, and pyritization.
In this work, 15 samples of BIFs, high-grade iron ore, and wall rocks were collected in the mining area (Figure 5c). All the samples were measured using ASD FieldSpec-3 pro spectrometer. Among which, six representative samples (from sampling location ① and ③) were selected for laboratory-based hyperspectral imaging. These samples include three for high-grade iron ore (Q-2, Q-9, and Q-11) and the remnant for BIFs (Q-4, Q-12, and Q-13).

4. Methods

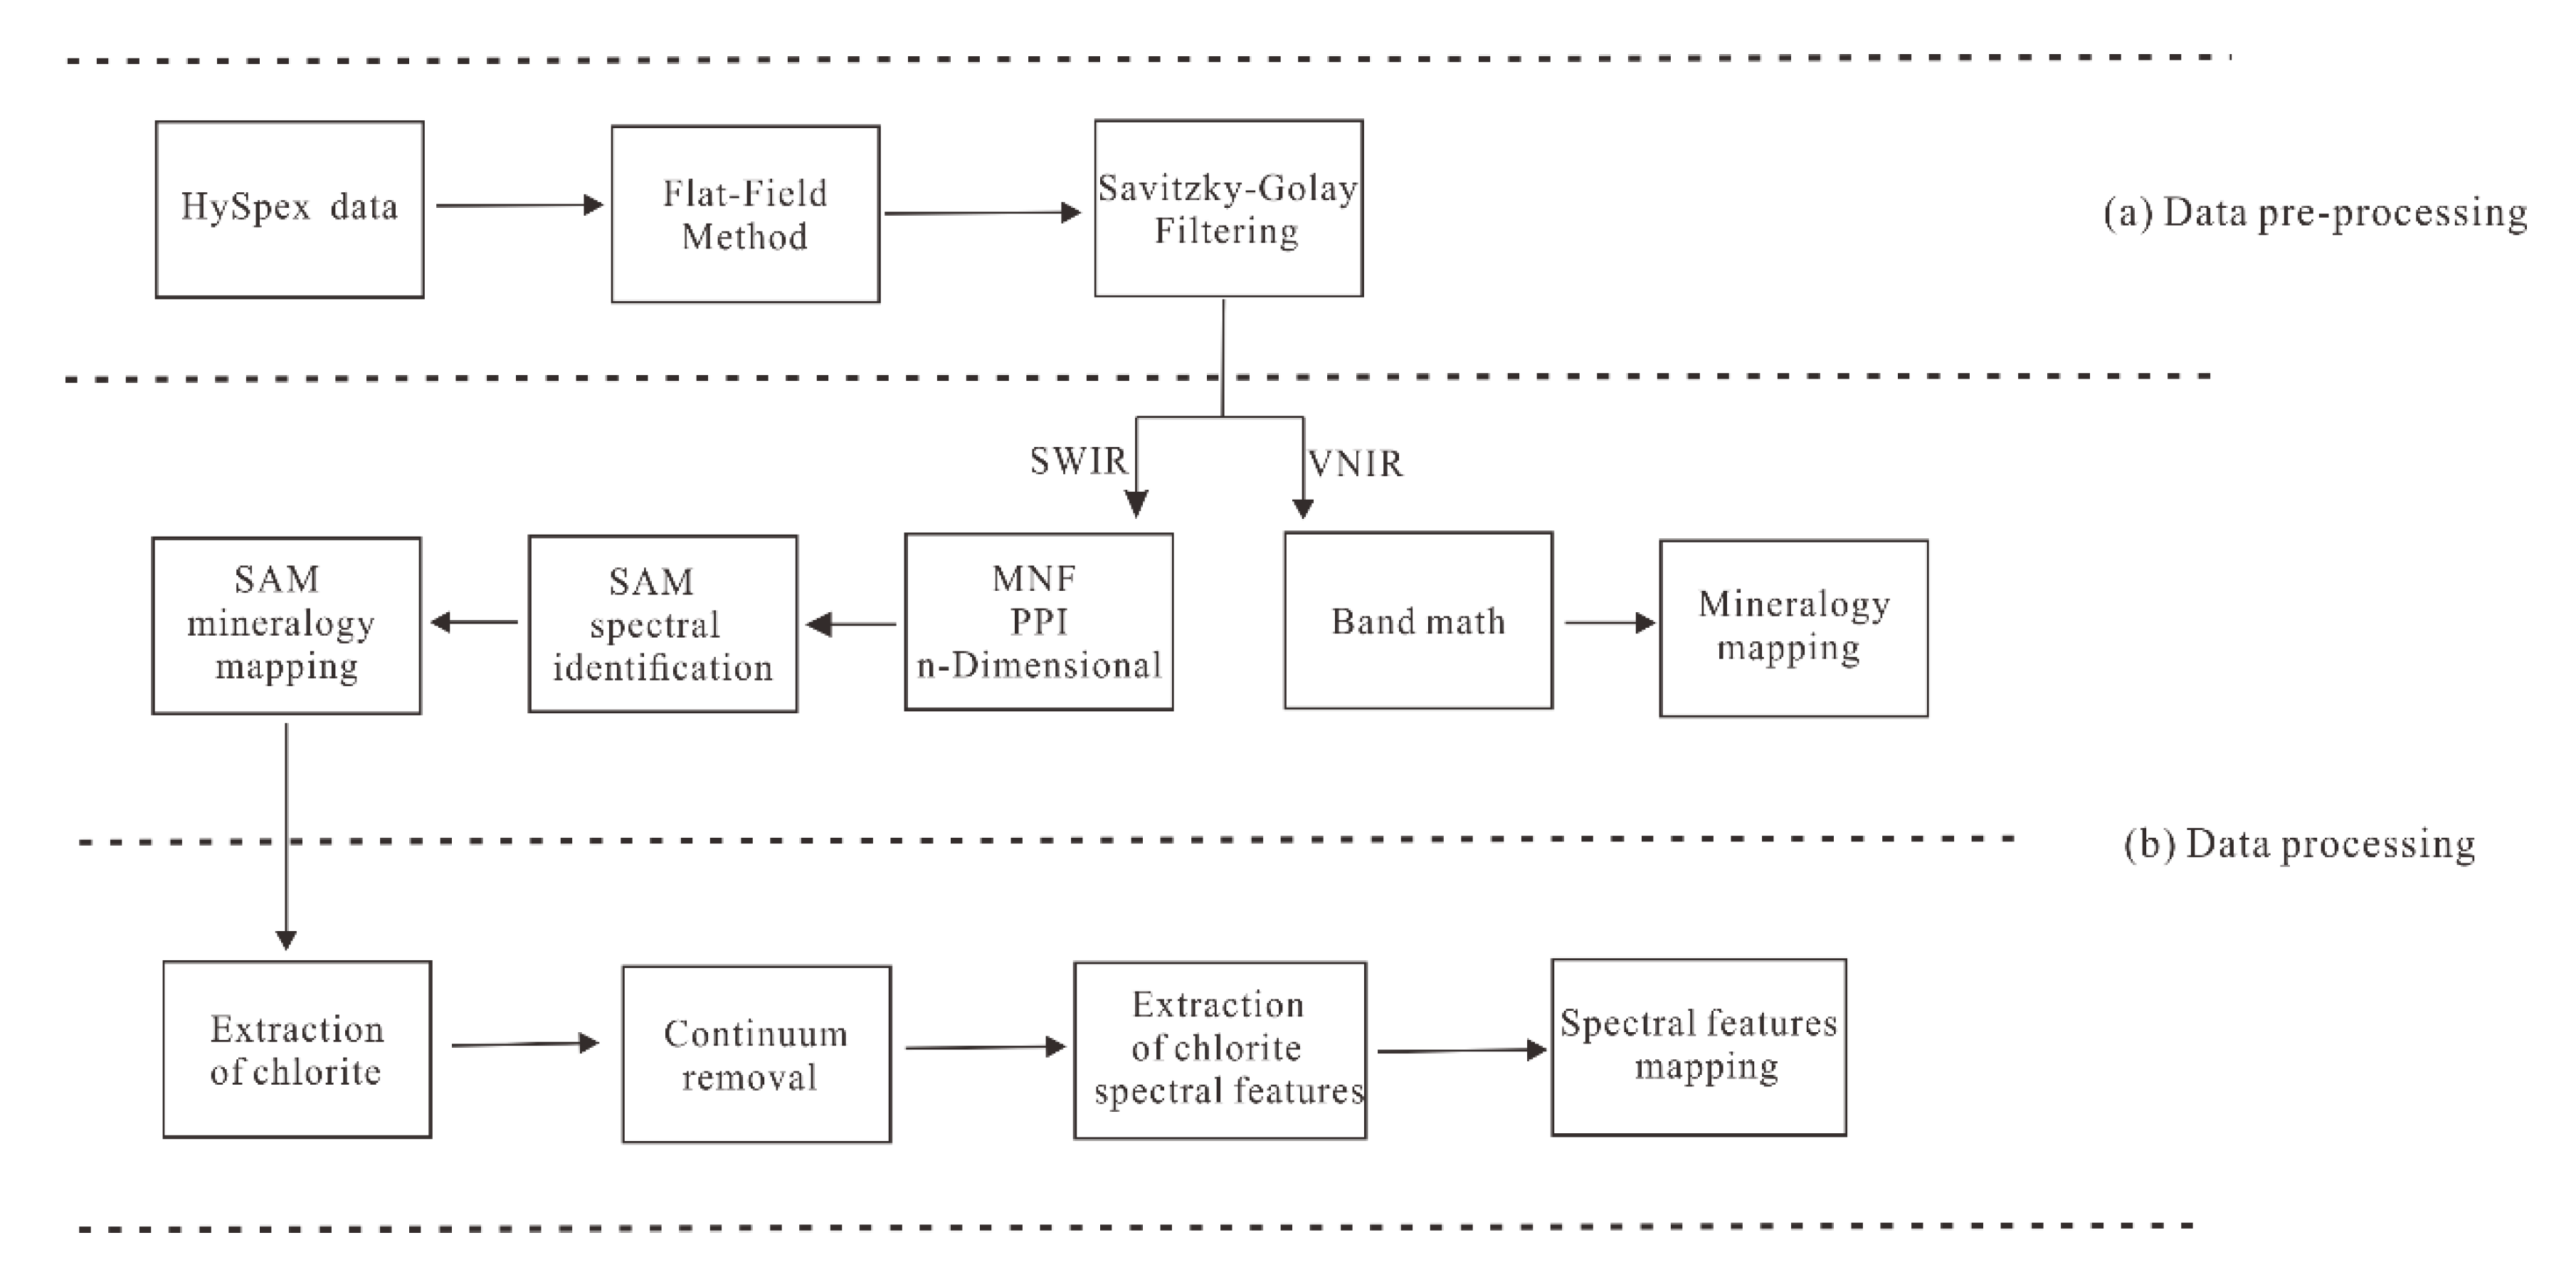
All the 15 rock samples were measured by the ASD FieldSpec-3 pro spectrometer, and the spectra were carefully investigated for mineral identification (see below). Six representative samples used for hyperspectral imaging were then cut into rock chips of ca. 6–7 cm (Unpolished) to facilitate image acquisition and processing. A laboratory-based hyperspectral imaging data processing model was established in this paper (Figure 6). All the operations were completed in ENVI 4.7 and IDL 7.1.

4.1. Data Acquisition

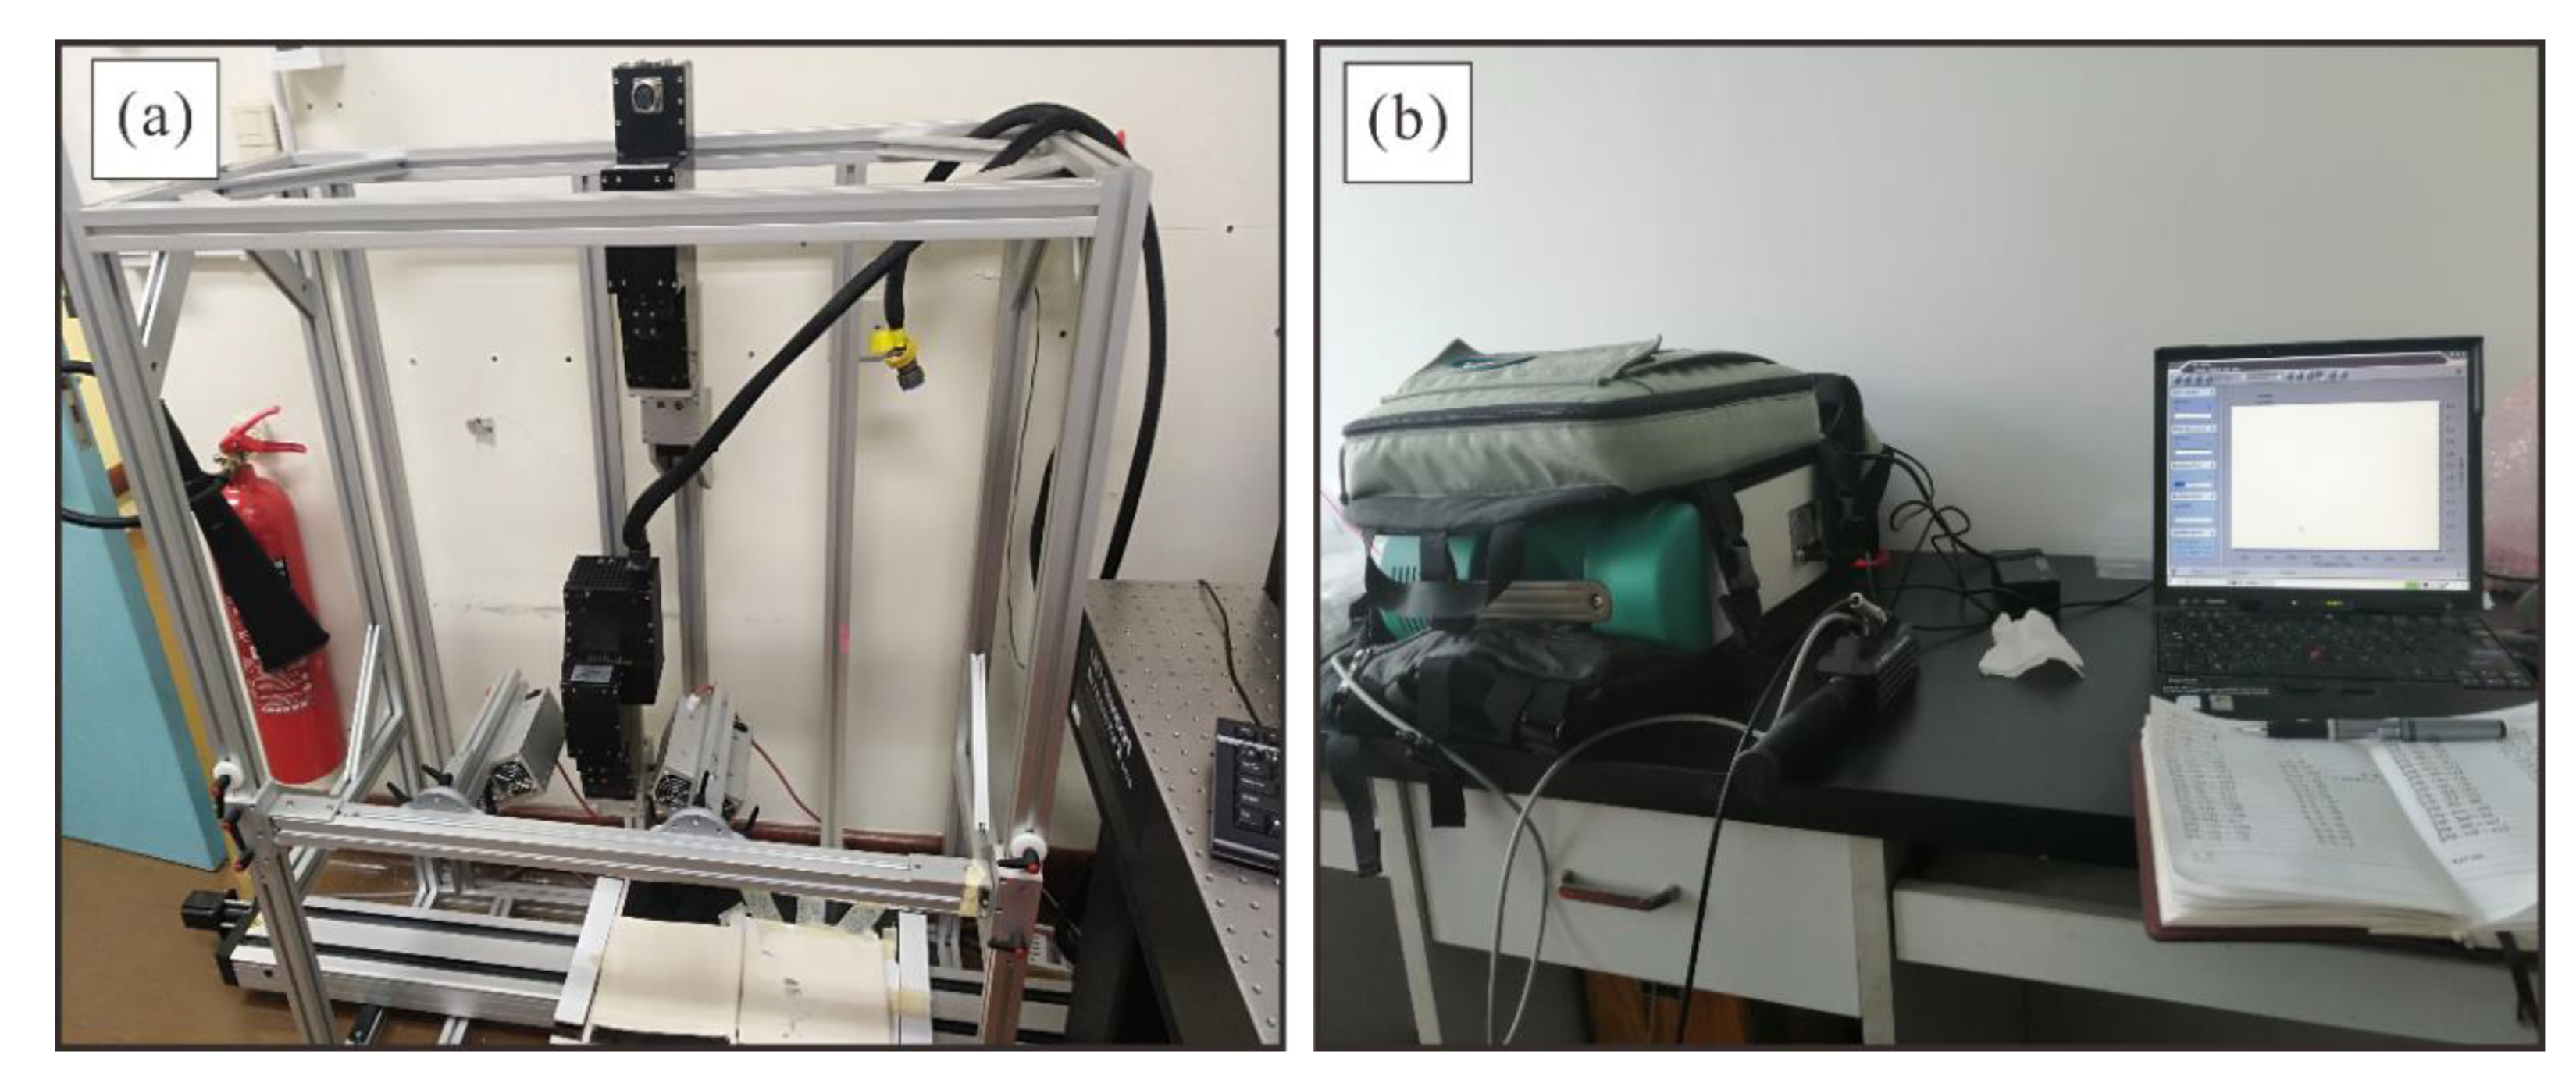
The hyperspectral imaging spectrometer used in this paper is HySpex-320m imaging system (Figure 7a). The rock chips were run sequentially through the camera at a distance of about 0.5 m under artificial illumination. Two sensors were used in this camera, one of which operated in the VNIR and the other in the SWIR regions. The VNIR sensor is configured to record 125 bands, consisting a full spectrum with a spectral sampling interval of 3.7 nm between 0.4 and 1.0 μm. The spectral range of the SWIR sensor is 1.0–2.5 μm with 256 bands, and the spectral resolution is 6.25 nm. Because the hyperspectral images were obtained from the cut surface of the rock chips at a close distance, the spatial resolution is as high as 0.3 mm × 0.3 mm.
Point spectroscopy is often used to validate mineralogy mapping results [27]. In this paper, ASD FieldSpec-3 pro spectrometer was used to obtain the spectra of 15 samples (Figure 7b). The sampling interval from 0.35 to 1.0 μm is 1.4 nm and from 1.0 to 2.5 μm is 2.0 nm. It was fitted with a contact probe with a light source, which ensures stable illumination conditions during spectral measurement. The spectra were then divided by the reflectance of the calibration panel to obtain absolute reflectance. At least 5 individual measurements of each sample were taken to avoid any heterogeneity.
The samples of Q-2, Q-4, Q-11, and Q-13 were analyzed using the electron probe microanalyzer (EPMA) to determine the specific chemical composition of chlorite. The JEOL JXA-8230 was taken at the Key Laboratory of Mineralogy and Metallogeny, Guangzhou Institute of Geochemistry, Chinese Academy of Sciences. The operating conditions were acceleration voltage of 15 kV, 20 nA beam current, and 1 μm beam diameter. The analysis standards include tugtupite, orthoclase, albite, BaF2, kaersutite, diopside, rhodonite, rutile, magnetite, and olivine.

4.2. The HySpex Data Preprocessing

During data collection, a white reference panel and a gray calibration panel (both with measured reflectance spectra) were placed in front of the samples for calibration purposes. The white panel is made of a material that reflects almost 100% in the spectral range of 0.35–2.5 μm. An average dark current frame was subtracted from frames of each image, and the Flat-Field Method calculates the relative reflectance by dividing the spectral value of each pixel by the value of the white reference panel to convert the raw data to reflectance.
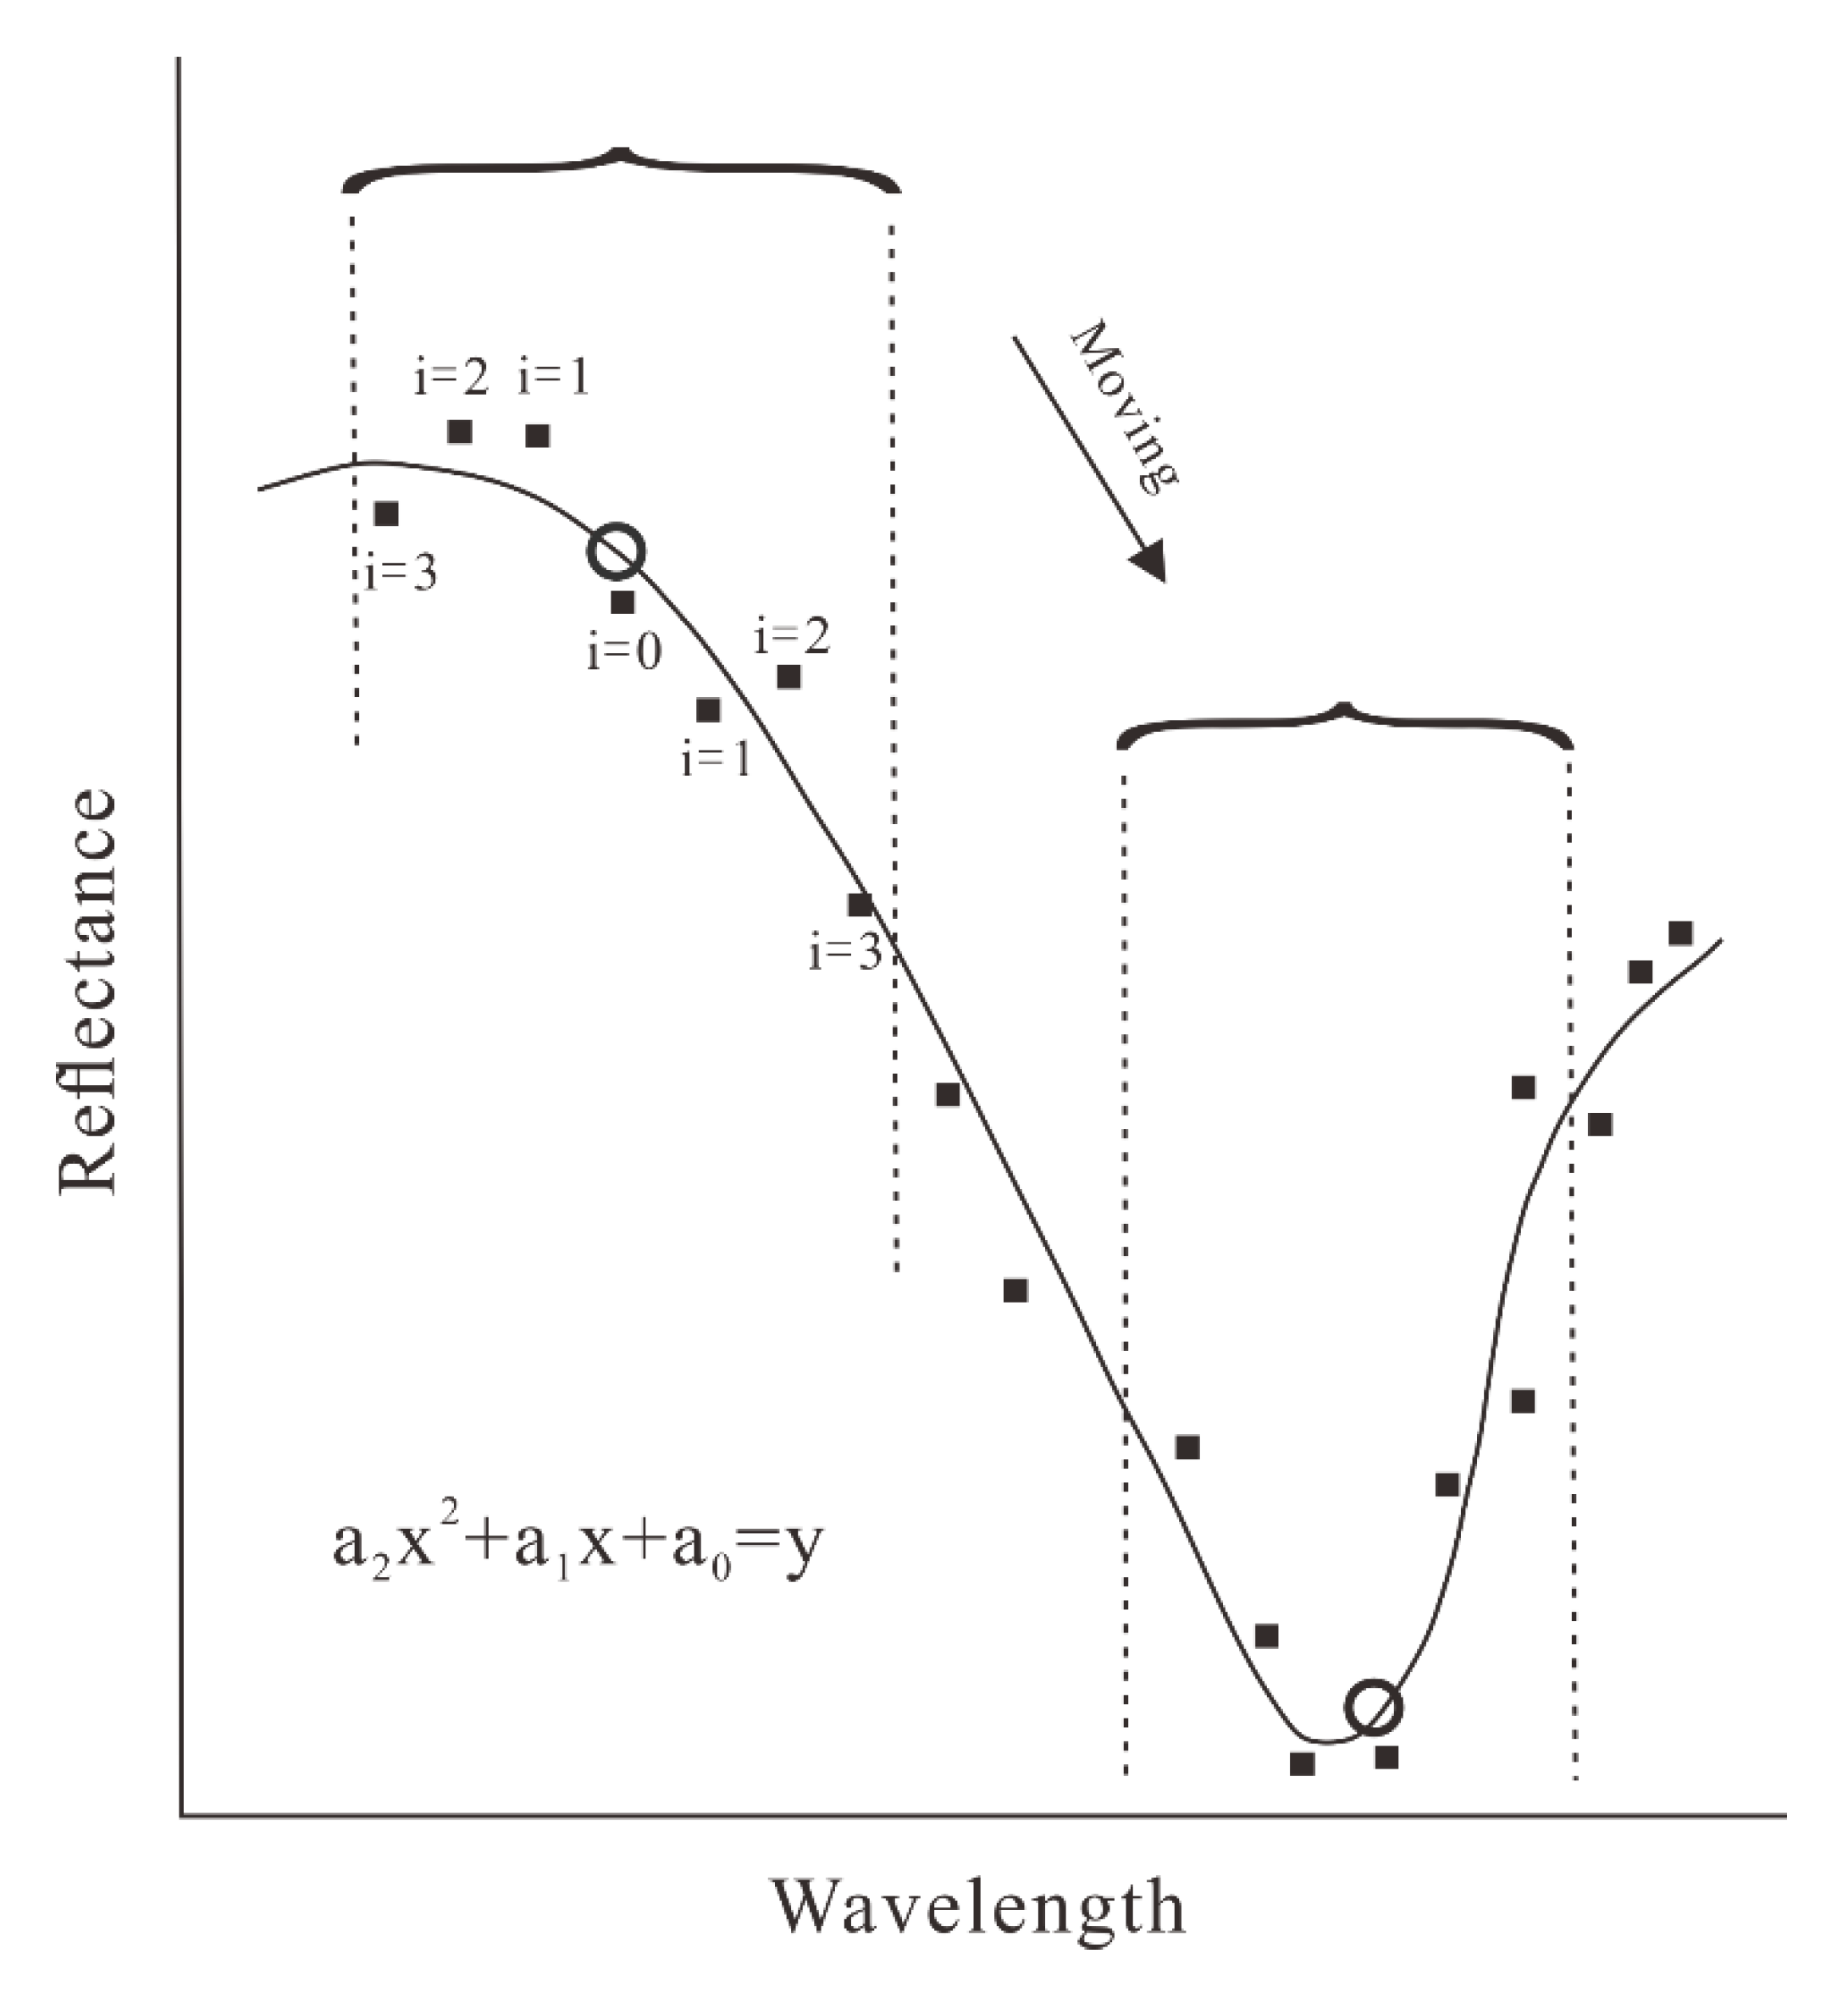
The reflectance data should be filtered to improve the S/N. The Savitzky–Golay filtering (SG) is a widely used technique in modern hyperspectral remote sensing studies [28,29,30]. The principle of SG is the least square filtering based on moving window [31]. The moving window contains the point to be smoothed in the center of the window with multiple adjacent points on either side of the center point. All the points in the window are used to perform the least squares fitting, but only the central point (i = 0) is smoothed (Figure 8). It works especially well when the typical band of the signal is narrow, and the height and width of the spectrum can well be preserved. The filtering effect of the spectrum varies with the size of the moving window and the order of the polynomial. A larger window can produce better smoothing effect, but may lose the tiny absorption features (Figure 9b). A higher order polynomial can achieve a better smoothing without attenuation of data features [32,33]. In this paper, the moving window size of 5 points and 2 polynomial order is adopted for the hyperspectral images (Figure 9a).

4.3. The HySpex Data Processing

The HySpex data processing mainly includes two parts: mineralogy mapping and chlorite spectral absorption features extraction (Figure 6b).
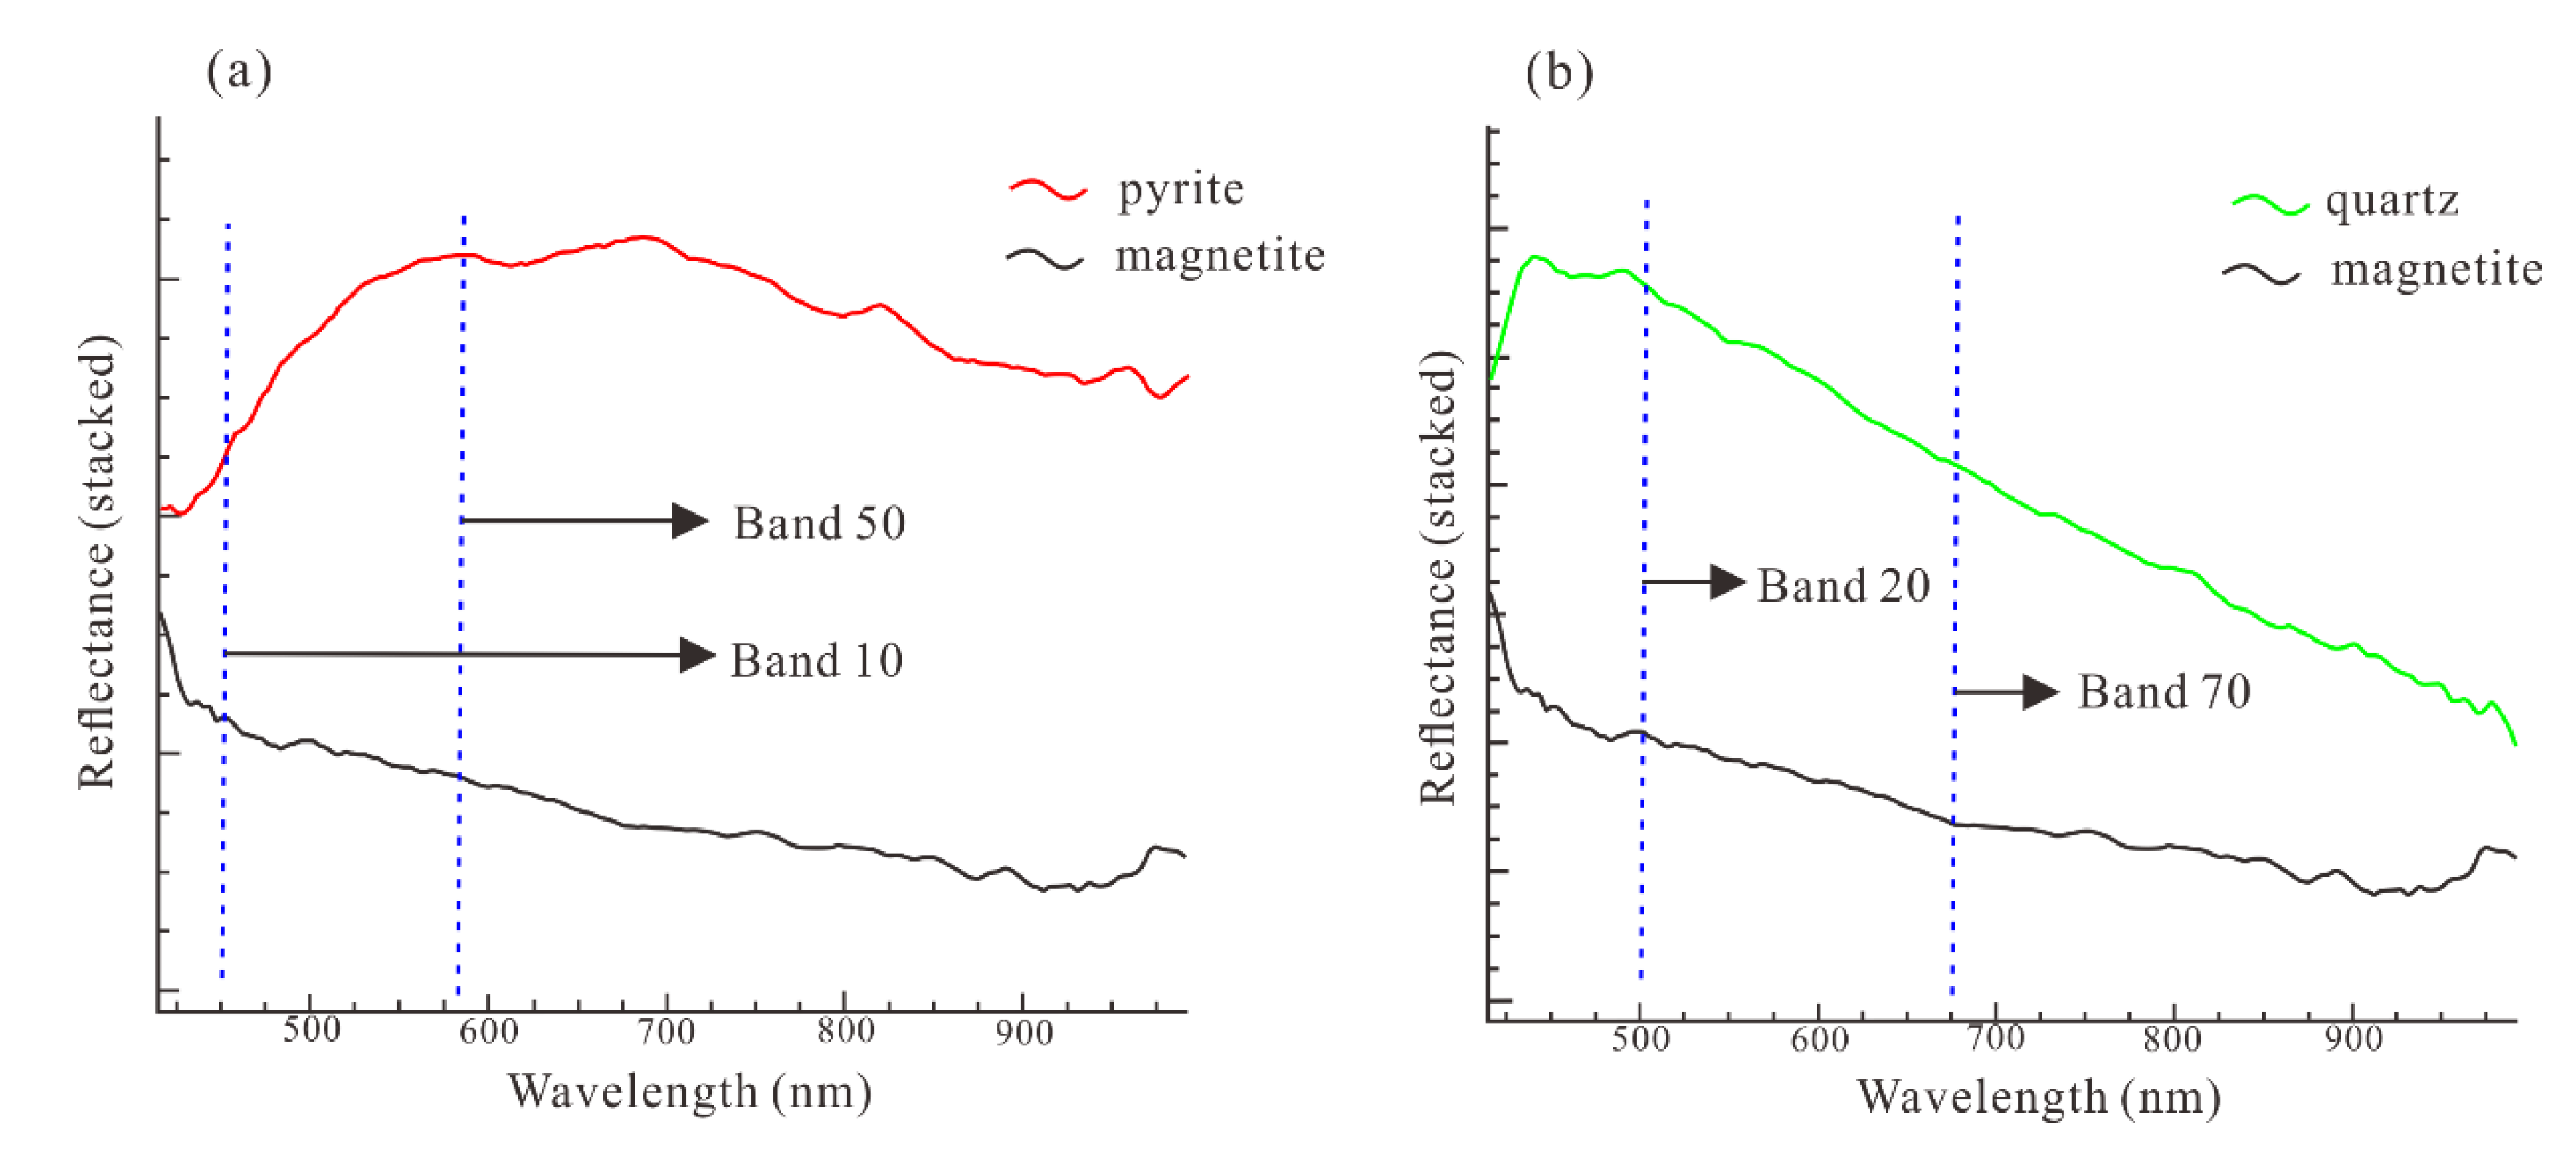
High-grade iron ore is mainly composed of magnetite and pyrite whose spectral absorption features are concentrated in VNIR. Band math is a common remote sensing method to distinguish the opaque metal minerals [34]. High-grade iron ore is mainly composed of magnetite and pyrite. According to the spectra of pyrite and magnetite in VNIR image (Figure 10a), the model is expressed as K1 (Band 10–Band 50). The K1 is the slope of the spectral reflectance from Band 10 to Band 50. Obviously, K1 of pyrite is greater than 0, whereas less than 0 for magnetite. BIFs ore is mainly composed of magnetite and quartz, and the slope of the spectral reflectance from Band 20 to Band 70 are quite different (Figure 10b). The model distinguishing magnetite and quartz is then expressed as K2 (Band 20–Band 70) < −0.5 for quartz and −0.5 < K2 < 0 (Band 20–Band 70) for magnetite.
The main diagnostic spectral absorption features of altered minerals such as chlorite, muscovite, and biotite are located in SWIR. “MNF-PPI-n Dimensional,” a common hyperspectral remote sensing processing method [35,36], was used to extract the endmember spectra from SWIR images. According to the previous research on Qidashan Iron Deposit, the spectra of minerals that may exist in the mining area were selected from USGS spectral library as the customer-defined spectral library. The Spectral Angle Mapping (SAM), which has proven to be an effective classification method for hyperspectral images [10,11,28], was adopted to determine the spectral similarity between the endmember spectra and the customer-defined spectra by calculating the angle between the spectra so that the endmember spectra can be identified [37].The operator then checked the results of the SAM based on geological and spectral knowledge to ensure that the endmember spectra were not misidentified. The maximum angle of 0.15 rad was used as the threshold for the SAM mineralogy mapping in this paper. By combining knowledge of mineral spectroscopy, pixels with spectral angle higher than threshold were determined by manual inspection until no unclassified pixels remained.
The result map of mineral classification was converted to vector, then the chlorite was extracted and other minerals were masked to obtain the pure chlorite thematic map. The continuum-removal was used to extract the absorption wavelength position and depth of chlorite. The continuum is a “shell” wrapped around the spectrum (Figure 11). The continuum-removal can remove the “background spectrum” to highlight the subtle absorption features, which is beneficial to the extraction and comparison of the spectral features of different minerals.

5. Results

5.1. The Spectra of Point Measurement

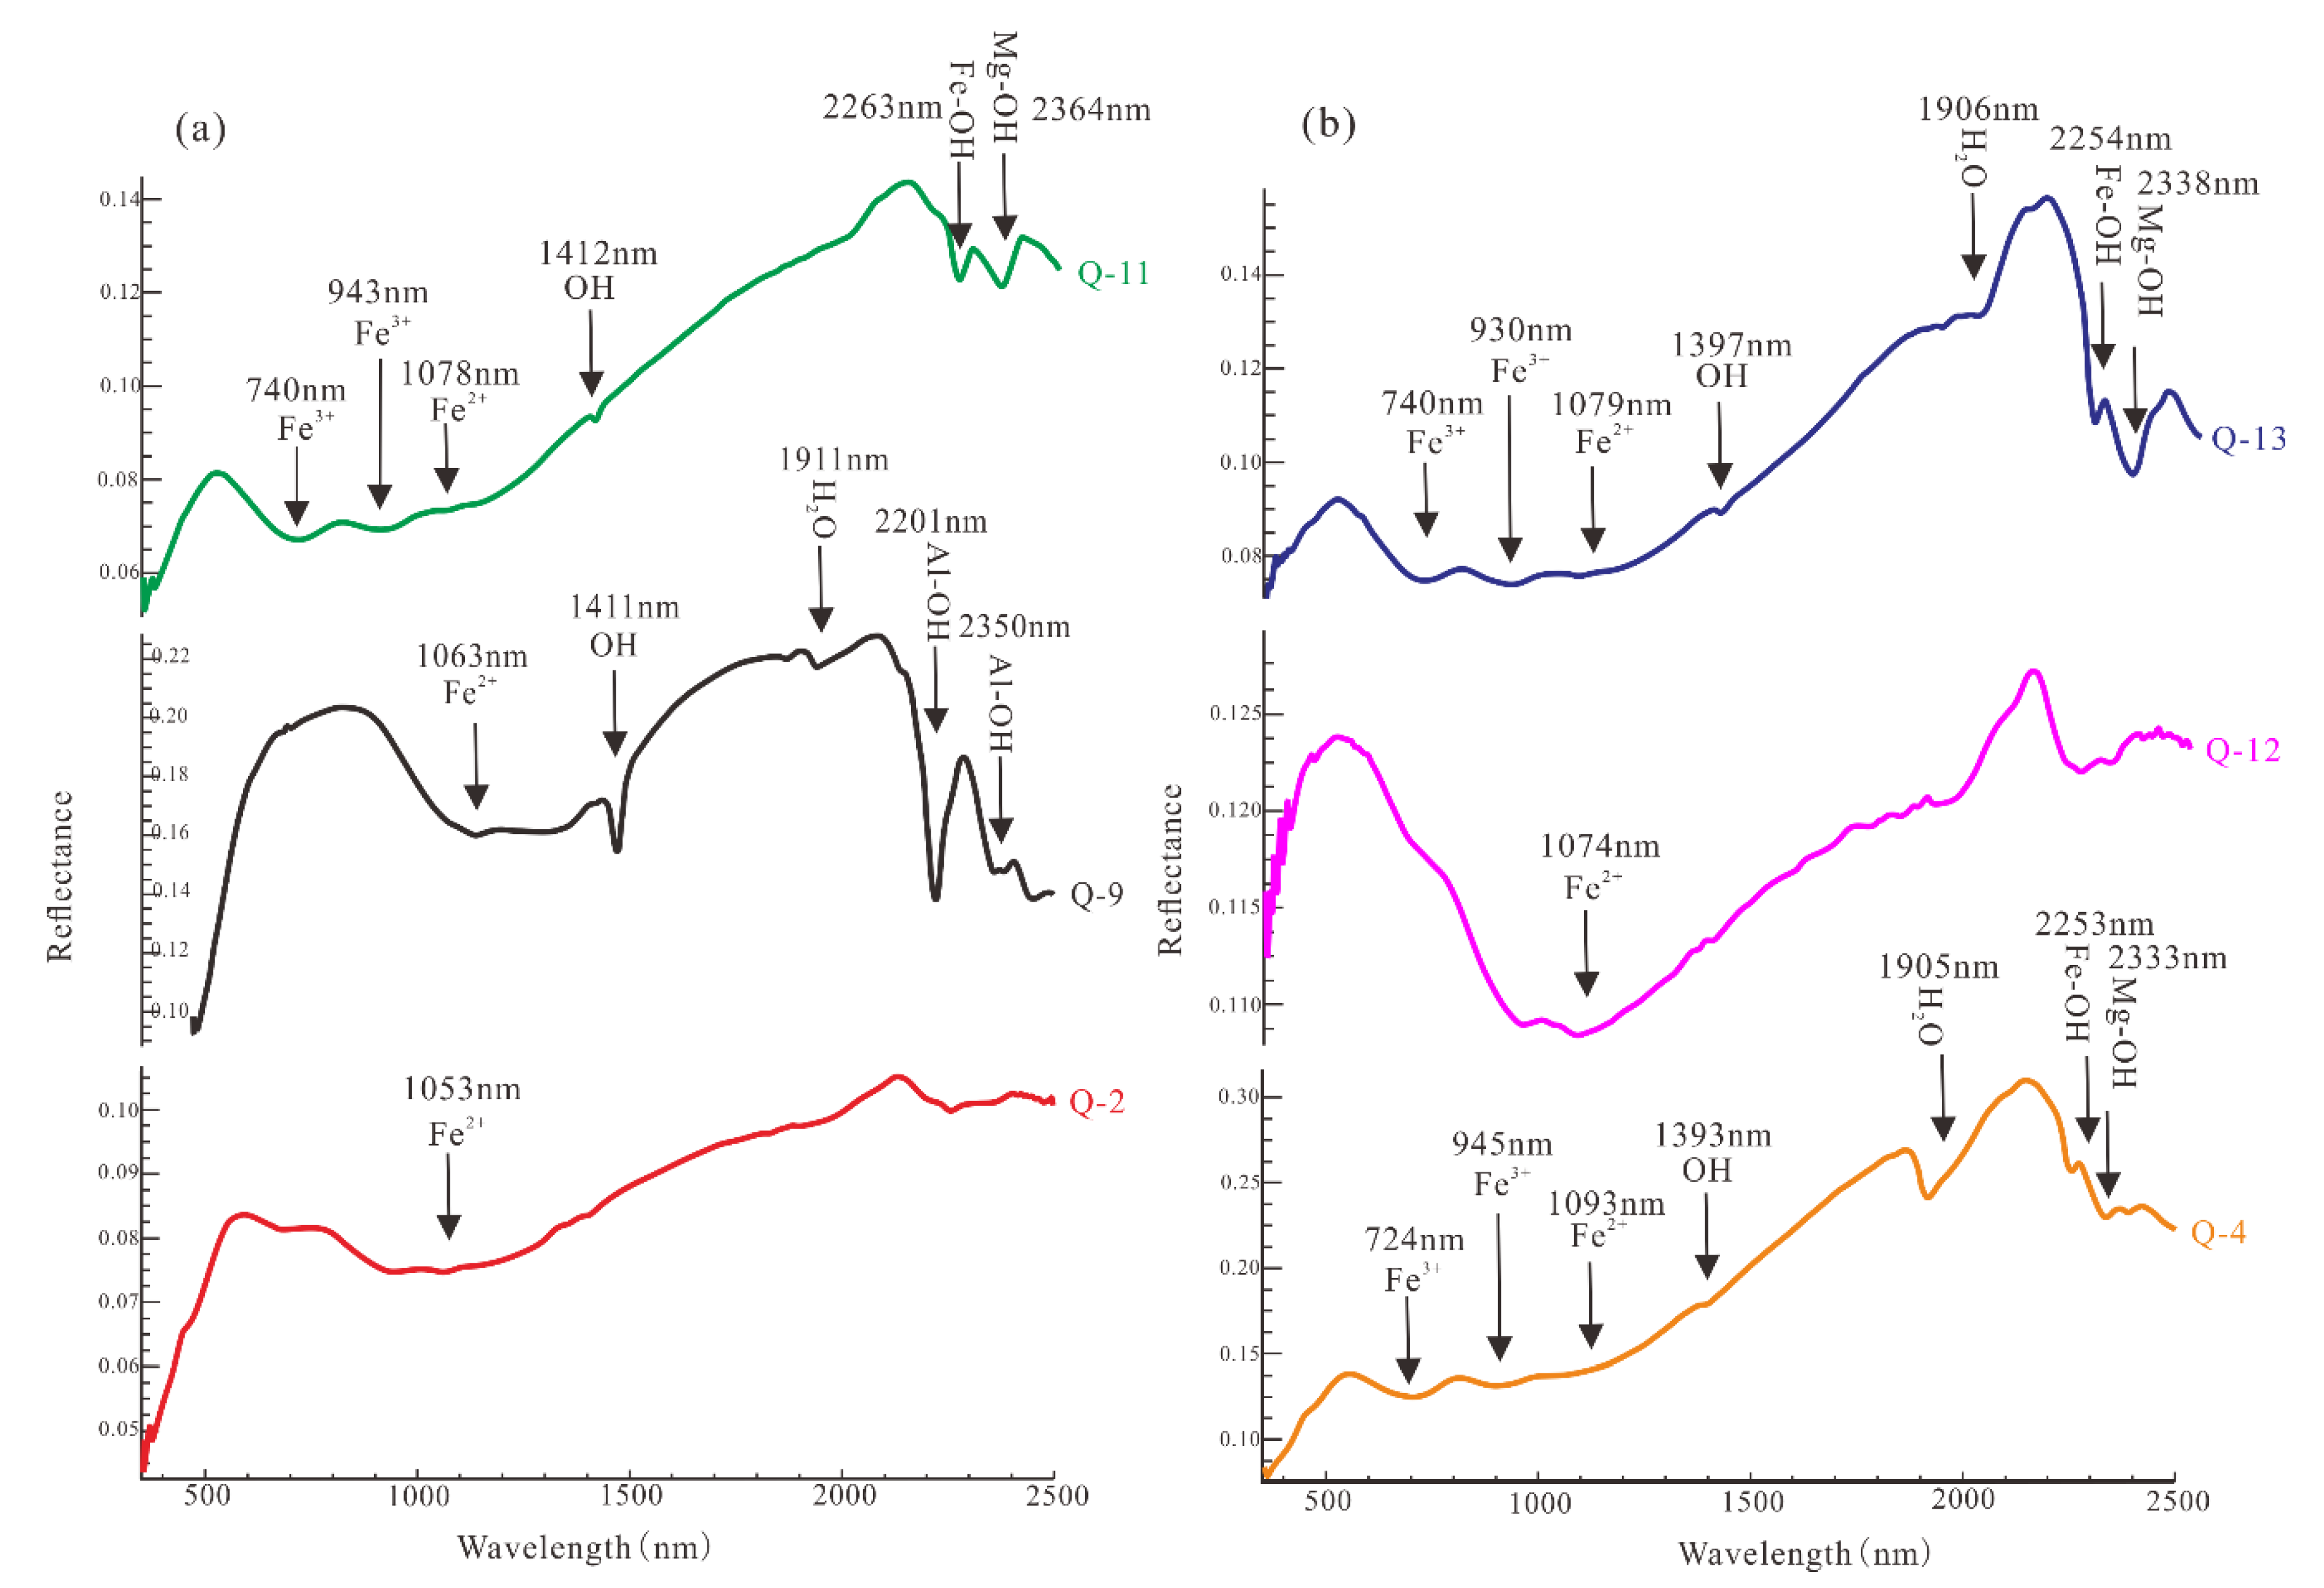
The point spectra of the samples used for imaging are shown in Figure 12. Figure 5 illustrates that the Q-9 was taken from mica-quartz schist zone, whereas the Q-4, Q-11, and Q-13 were taken from chloritite and chlorite-quartz schist zone. Correspondingly their spectra manifest obviously similar features as those of muscovite and chlorite, respectively. The Q-2 and Q-12 were selected from high-grade iron ore and BIFs, which are characterized by lower reflectivity and their main absorption features are concentrated in VNIR range.
Chlorite is marked by diagnostic absorptions around 2250 and 2350 nm [6,15,17,18]. By mutual verification with hyperspectral imaging, the samples containing chlorite from wall rock of BIFs (Q-4, Q-8, Q-13, and Q-15) and high-grade iron ore (Q-3, Q-6, Q-11, and Q-14) were selected, and the wavelength positions around 2250 and 2350 nm were extracted (Figure 13).

5.2. Minerals Identification from the HySpex Data

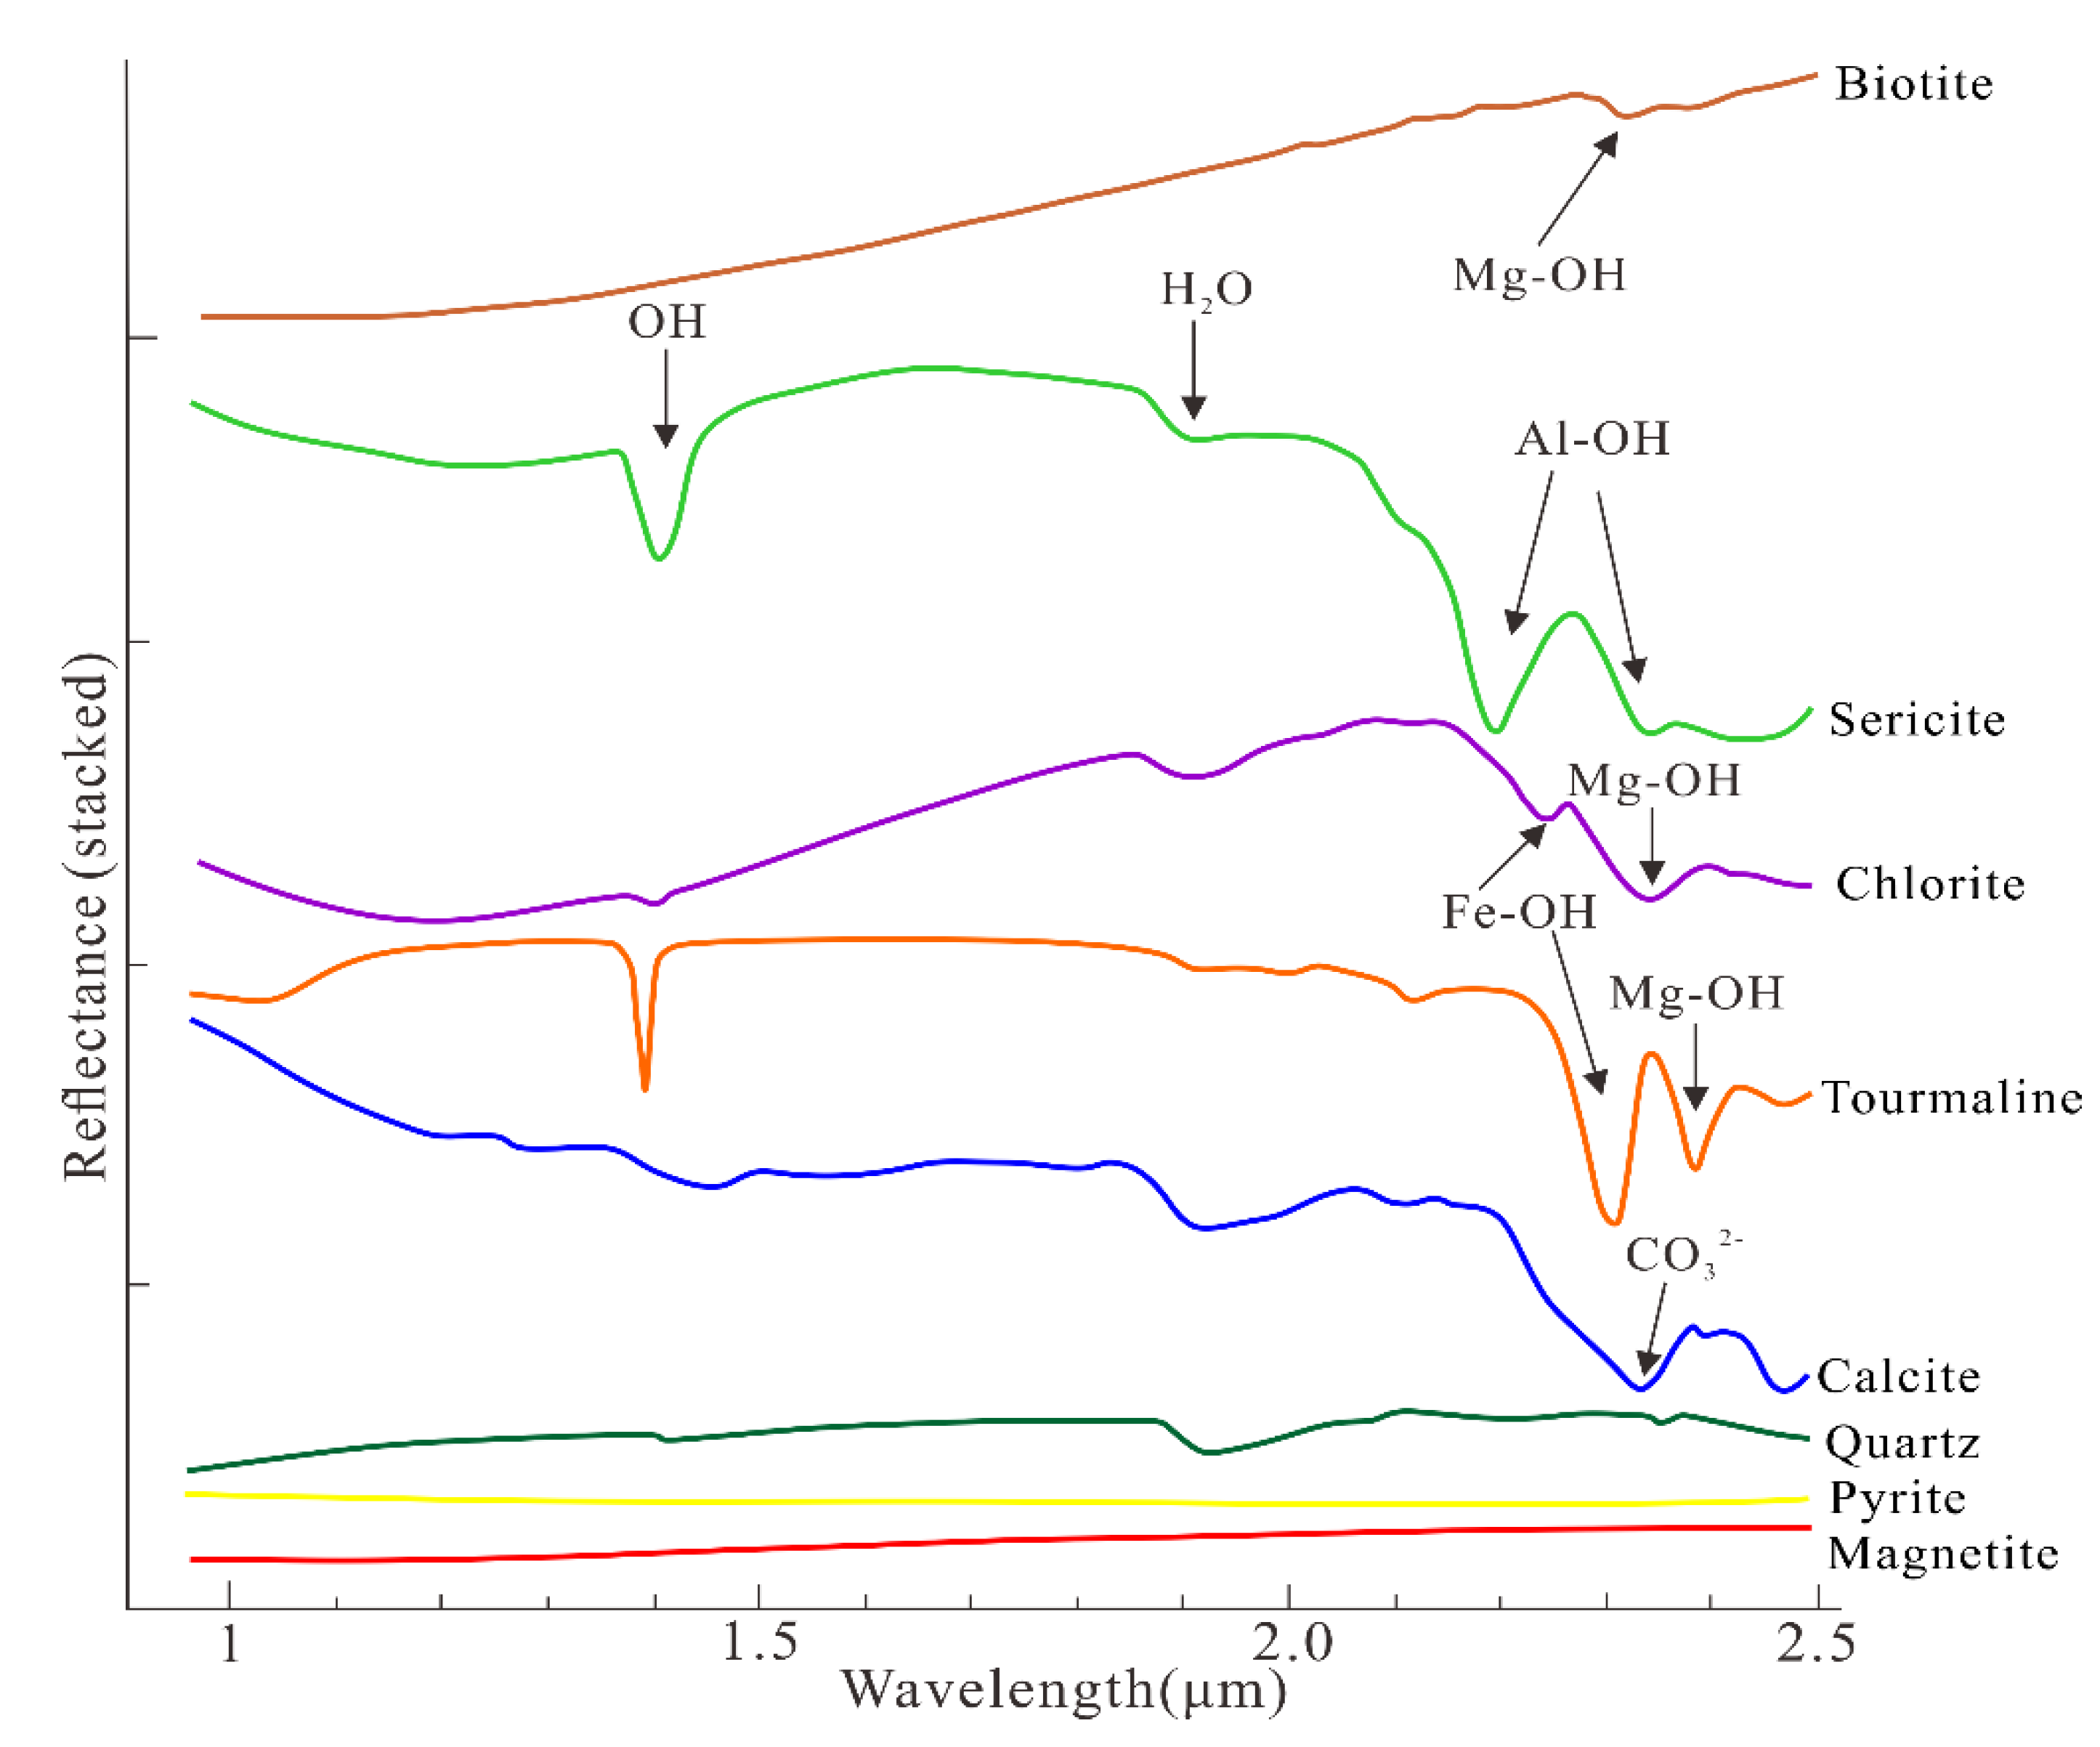
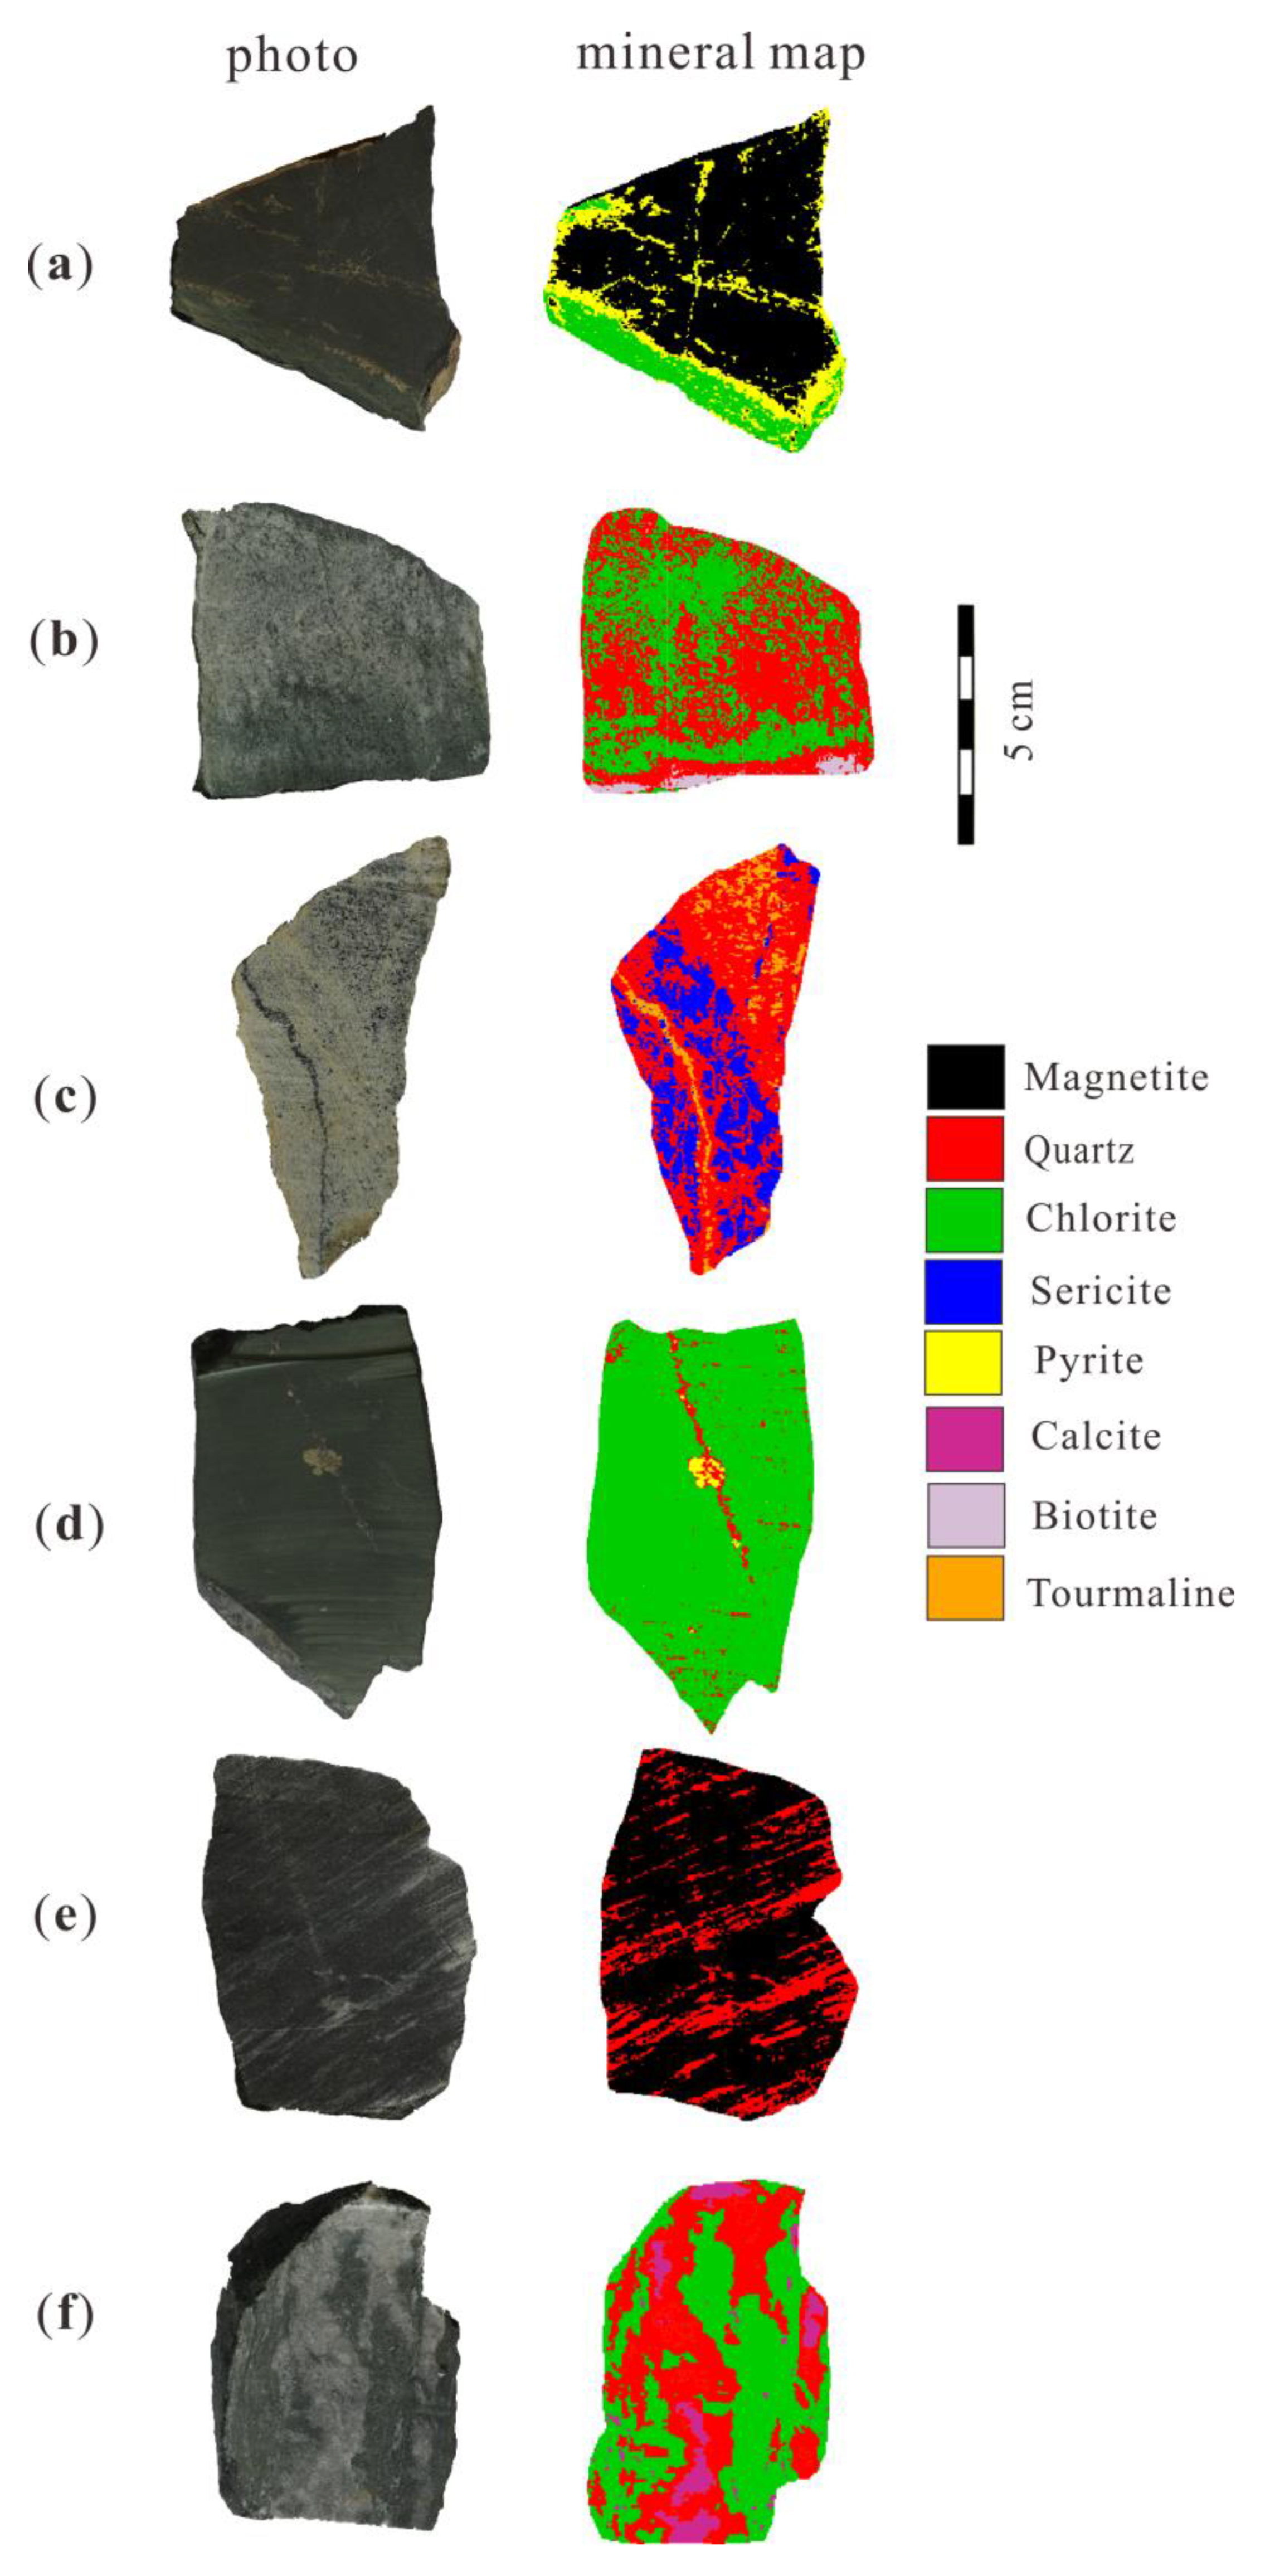
According to the HySpex data processing model, the endmember spectral library is shown in Figure 14. The chlorite, sericite, calcite, biotite, tourmaline, quartz, magnetite, and pyrite were extracted from the HySpex images.
Chlorite is a widespread alteration mineral in the Qidashan mining district, which manifests diagnostic absorptions around 2250 and 2350 nm [6,17]. Spectral absorption features ranging from 2245 to 2265 nm commonly result from Fe-OH vibration. Absorptions caused by Mg-OH vibration commonly occur in the 2330~2370 nm range [16]. The specific wavelength position of Fe-OH absorption feature varies with Fe and/or Mg content in octahedral sheet, i.e., Mg-rich chlorite is generally between 2245 and 2255 nm, whereas Fe-rich chlorite tends to be around 2265 nm. The Mg-OH wavelength for the pure chlorite rich in Mg is around 2330 nm and for Fe-rich chlorite is 2365 nm [24]. Some scholars believe that the OH absorption near 1400 nm is also positively correlated with the total Fe content in chlorite [17].
White mica is characterized by a major Al–OH band near 2200 nm and a subordinate absorption band near 2340 nm. The observed wavelength of the Al–OH band covers a wide range from 2185 to 2225 nm. This wavelength range indicates a compositional variation from paragonitic (Al-rich and Na-bearing, with Al–OH band near 2190 nm) through muscovite (K-rich and Al-rich, Al–OH band at around 2200 nm) to phengitic (Al-poor and Mg-rich or Fe2+-rich, with Al–OH band > 2210 nm) [24,38]. The wavelength of the Al-OH absorption in the Qidashan HySpex data range from 2196 to 2205 nm, suggestive of muscovite affinity.
Carbonate minerals mainly include calcite, magnesite, and dolomite. They can be distinguished by the absorption feature around 2300 nm. The vibration absorption band of CO32- in carbonate is located around 2340 nm for calcite, 2300 nm for magnesite, and 2320 nm for dolomite [39,40,41]. The main absorption band of biotite is the vibration of Mg-OH located around 2340 nm [16]. Tourmaline produces diagnostic absorptions at 2200 and 2360 nm, which are mainly caused by the Fe-OH and Mg-OH [6]. The spectrum of quartz is flat and no diagnostic absorption feature in SWIR except for OH and H2O; Magnetite and pyrite are opaque minerals that are known for low reflectivity and a few spectral features in the SWIR. Therefore, the VNIR data were used for mapping of these opaque minerals.
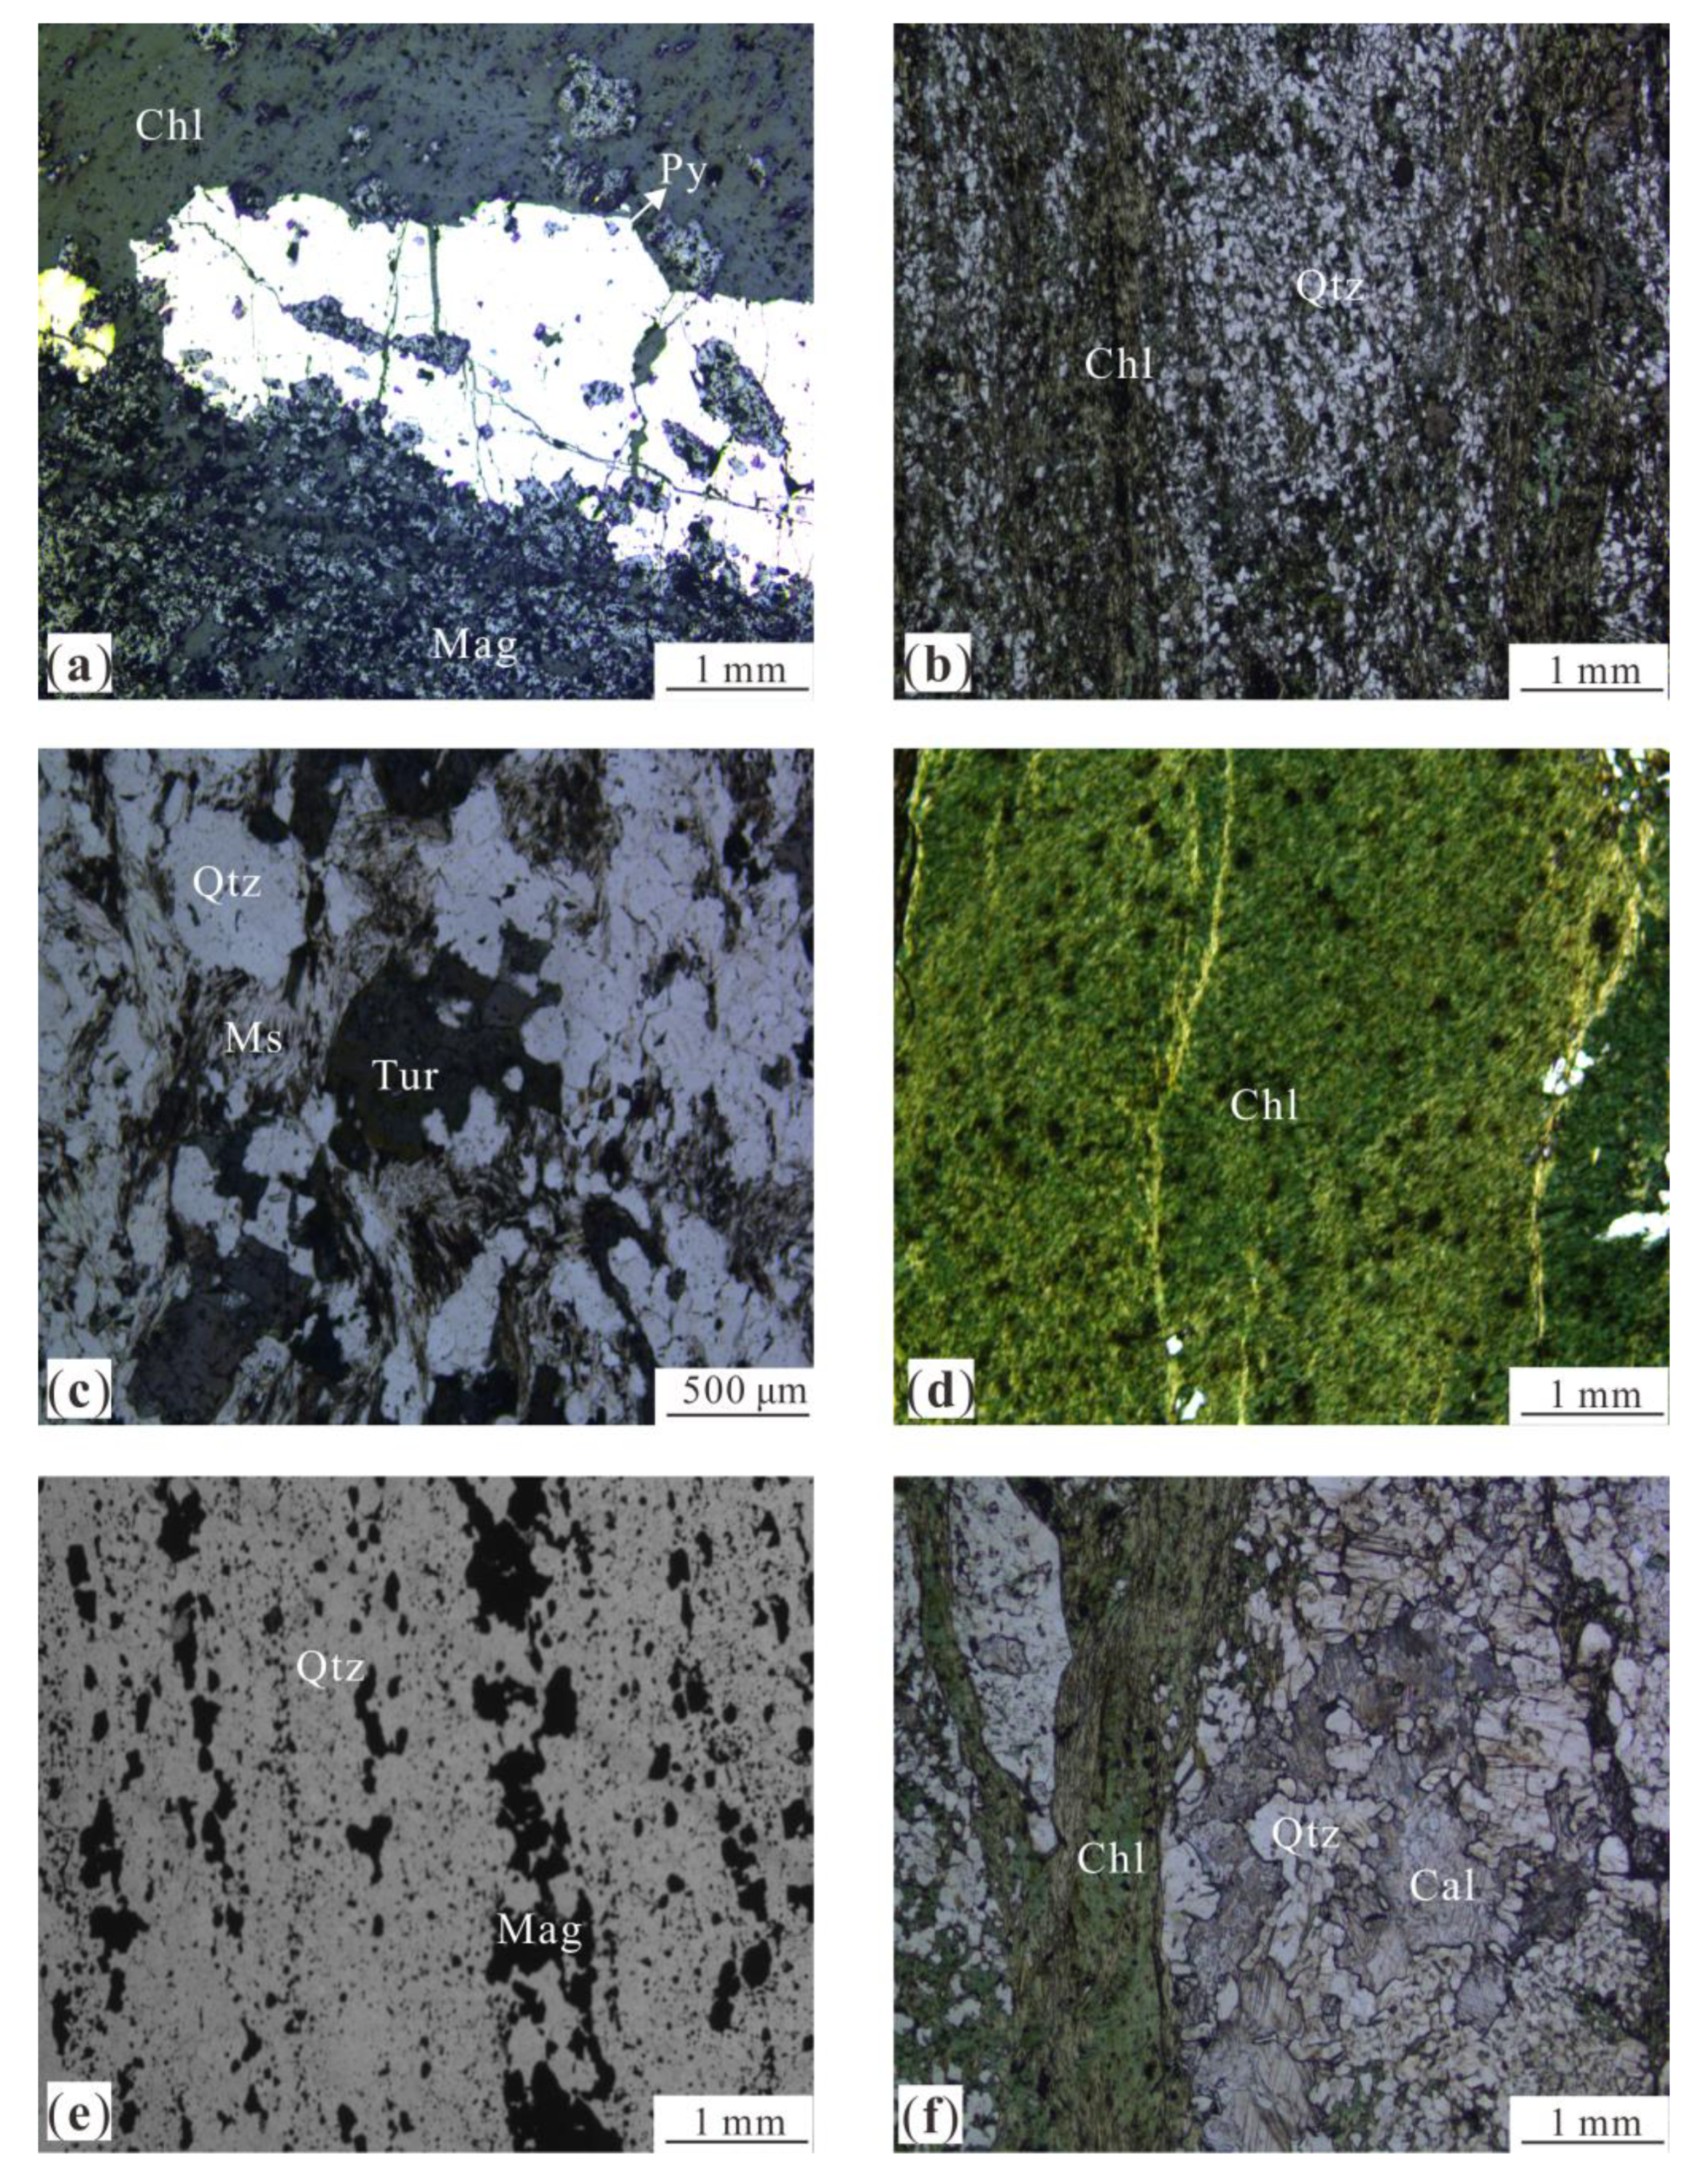
Figure 15 shows the results of mineral mapping from the HySpex data. Samples near BIFs were Q-4, Q-12, and Q-13 and near high-grade iron ore were Q-2, Q-9, and Q-11. Q-9 is sericite quartz schist whose main minerals are quartz and sericite, accompanied by tourmaline veinlets; Q-12 and Q-2 are BIFs and high-grade iron ore, respectively. Except for magnetite, Q-2 is accompanied by strong chloritization and pyritization, whereas Q-12 is mainly composed of banded quartz and magnetite with a width of about 1 mm. Q-4, Q-11, and Q-13 contain both chlorite and quartz. Q-11 is mainly composed of chlorite with minor quartz and pyrite. Q-4 and Q-13 contain more quartz than chlorite, which belong to chlorite quartz schist. Moreover, Q-4 and Q-13 also contain small amounts of calcite and biotite. The Leica DM4P microscope was used to check the classification results (Figure 16).

5.3. Mapping Absorption Features of Chlorite from the HySpex Data

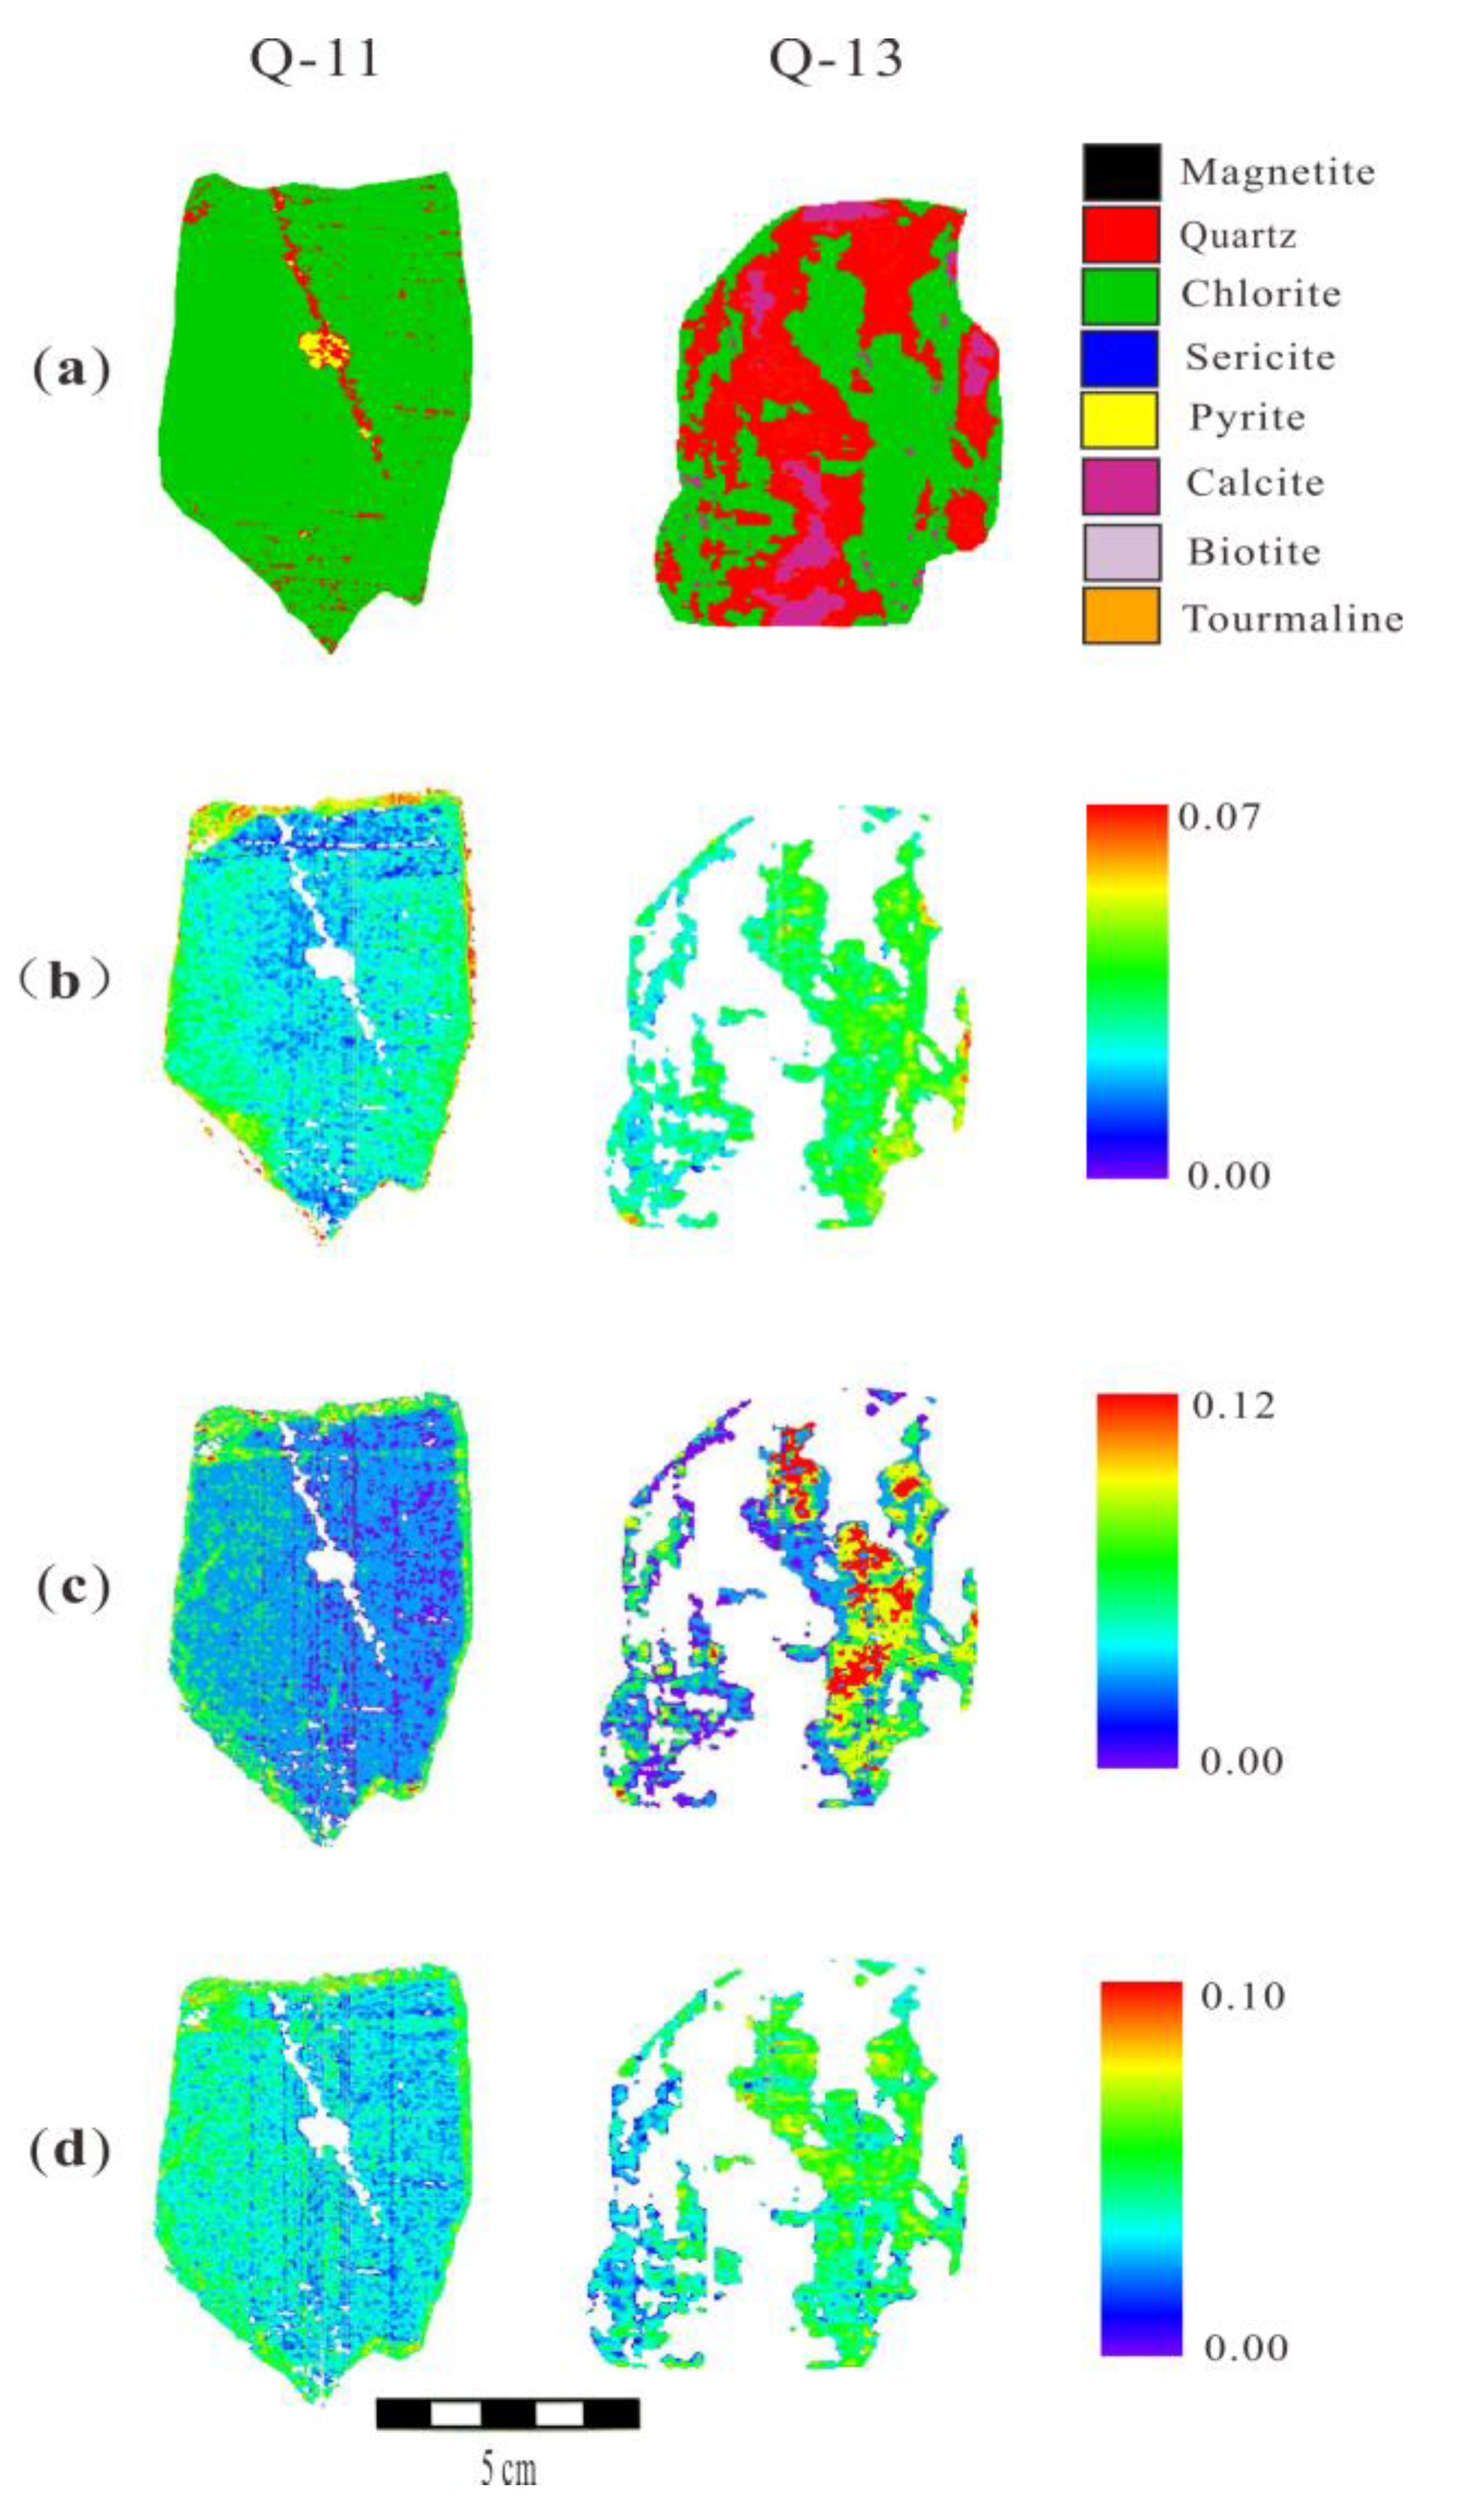
According to the HySpex data processing model, the wavelength position of OH, Fe-OH, and Mg-OH absorptions of chlorite were mapped. Figure 17 illustrates that there are obviously two kinds of chlorite, which have different absorption wavelengths of OH, Fe-OH, and Mg-OH. The absorption wavelengths of OH, Fe-OH, and Mg-OH related to high-grade ore (Q-2 and Q-11) are mostly between 1400 and 1410, 2260 and 2265, and 2360 and 2370, nm, respectively, whereas those related to BIFs (Q-4 and Q-13) are between 1390 and 1400, 2245 and 2255, and 2330 and 2350 nm. This result is consistent with the result of ASD spectrometer.
In order to verify the results of the spectral analysis, the chlorite in the Q-2, Q-11, Q-4, and Q-13 was analyzed by EPMA (Table 1). Note that when Na2O > 1.0%, CaO > 0.5%, or K2O > 0.5%, data were discarded as they suggested severe contamination by adjacent minerals. The structural formula of chlorite was calculated based on 28 oxygen atoms (Table 2). The distribution of the corresponding wavelengths and the cations in the octahedral sheet of chlorite are summarized in Figure 18.
Figure 18 illustrates that there are obviously two types of chlorites (Figure 18a): the wavelengths of OH, Fe-OH, and Mg-OH of chlorite related to high-grade iron ore (Q-2 and Q-11) are located at 1405~1410, 2260~2265, and 2360~2370 nm, respectively, whereas the corresponding wavelengths related to BIFs (Q-4 and Q-13) are all shorter. On the other hand, similar conclusions can be drawn from the molecular formula of the chlorite: the Fe content in Q-2 and Q-11 is higher than that in Q-4 and Q-13, whereas the Mg is just the opposite (Figure 18b). The AlVI in these two samples are approximately equal.
The absorption depth is also one of the spectral features. The absorption depths of OH, Fe-OH, and Mg-OH bands of chlorite in Q-11 and Q-13 are illustrated in Figure 19. In comparison with the wavelength, there is no obvious difference between the absorption depths of these samples.

6. Discussion

6.1. The Cause of Spectral Variation of Different Chlorites in Qidashan Iron Deposit

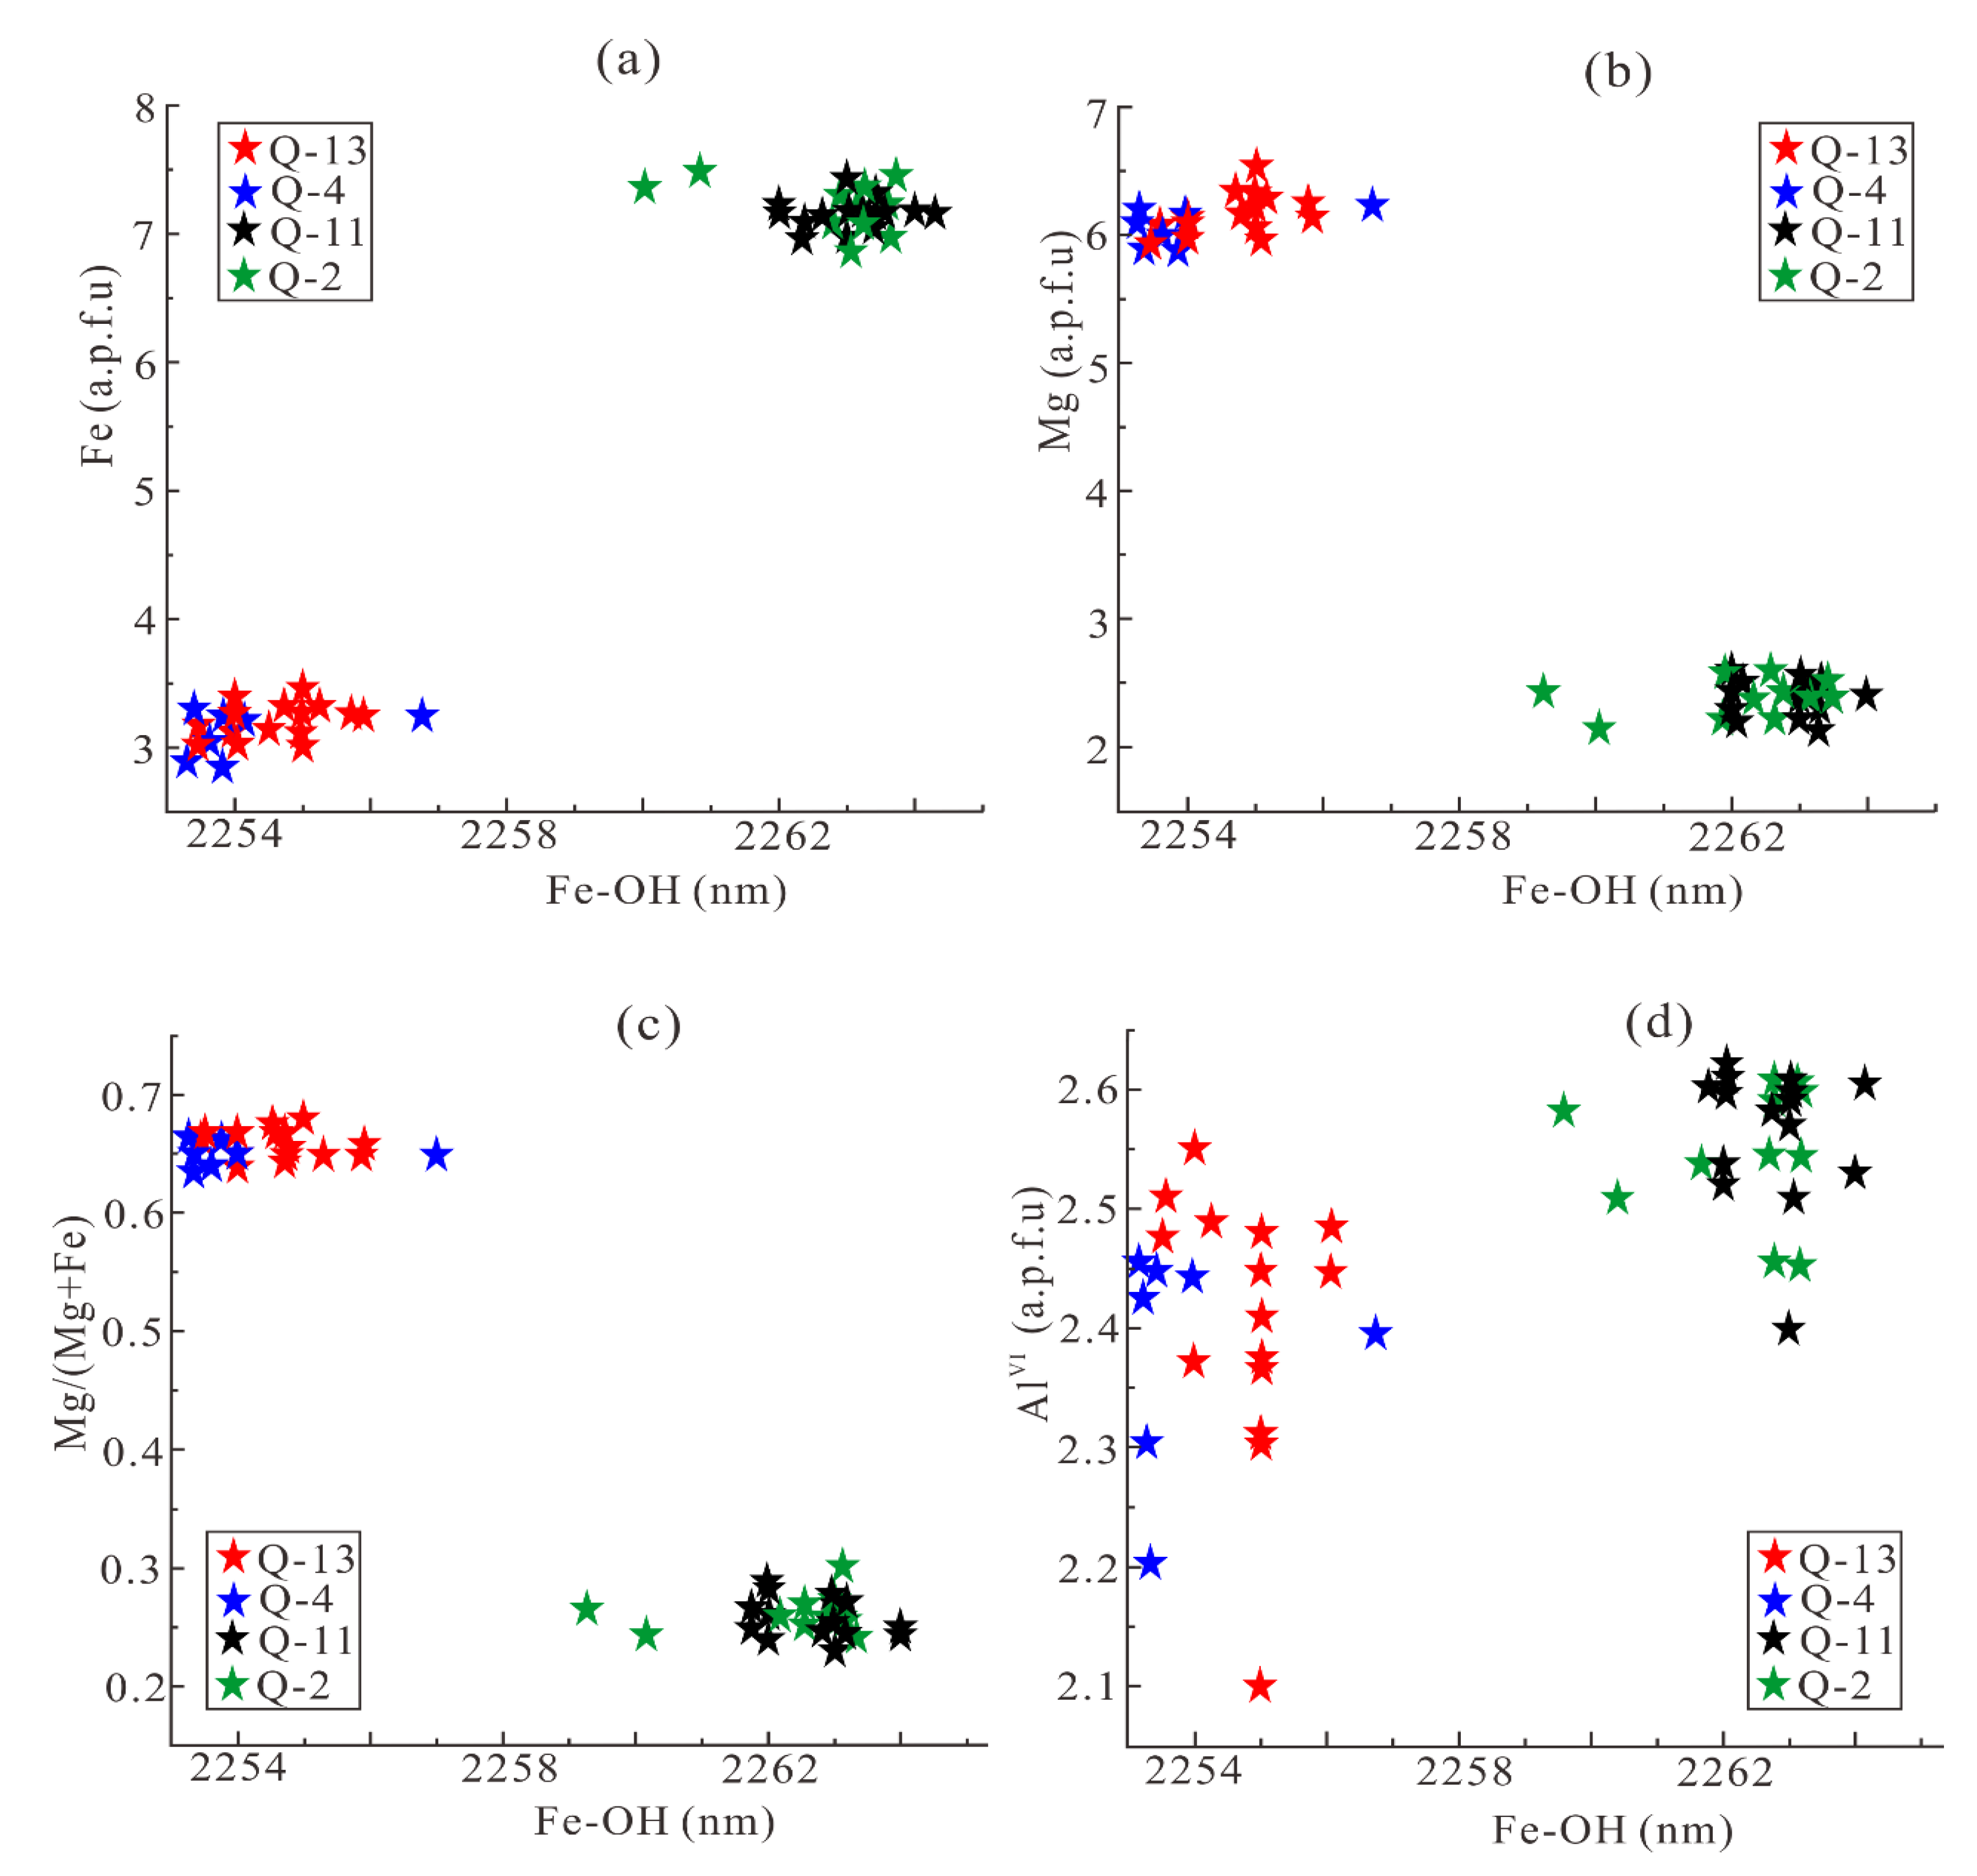
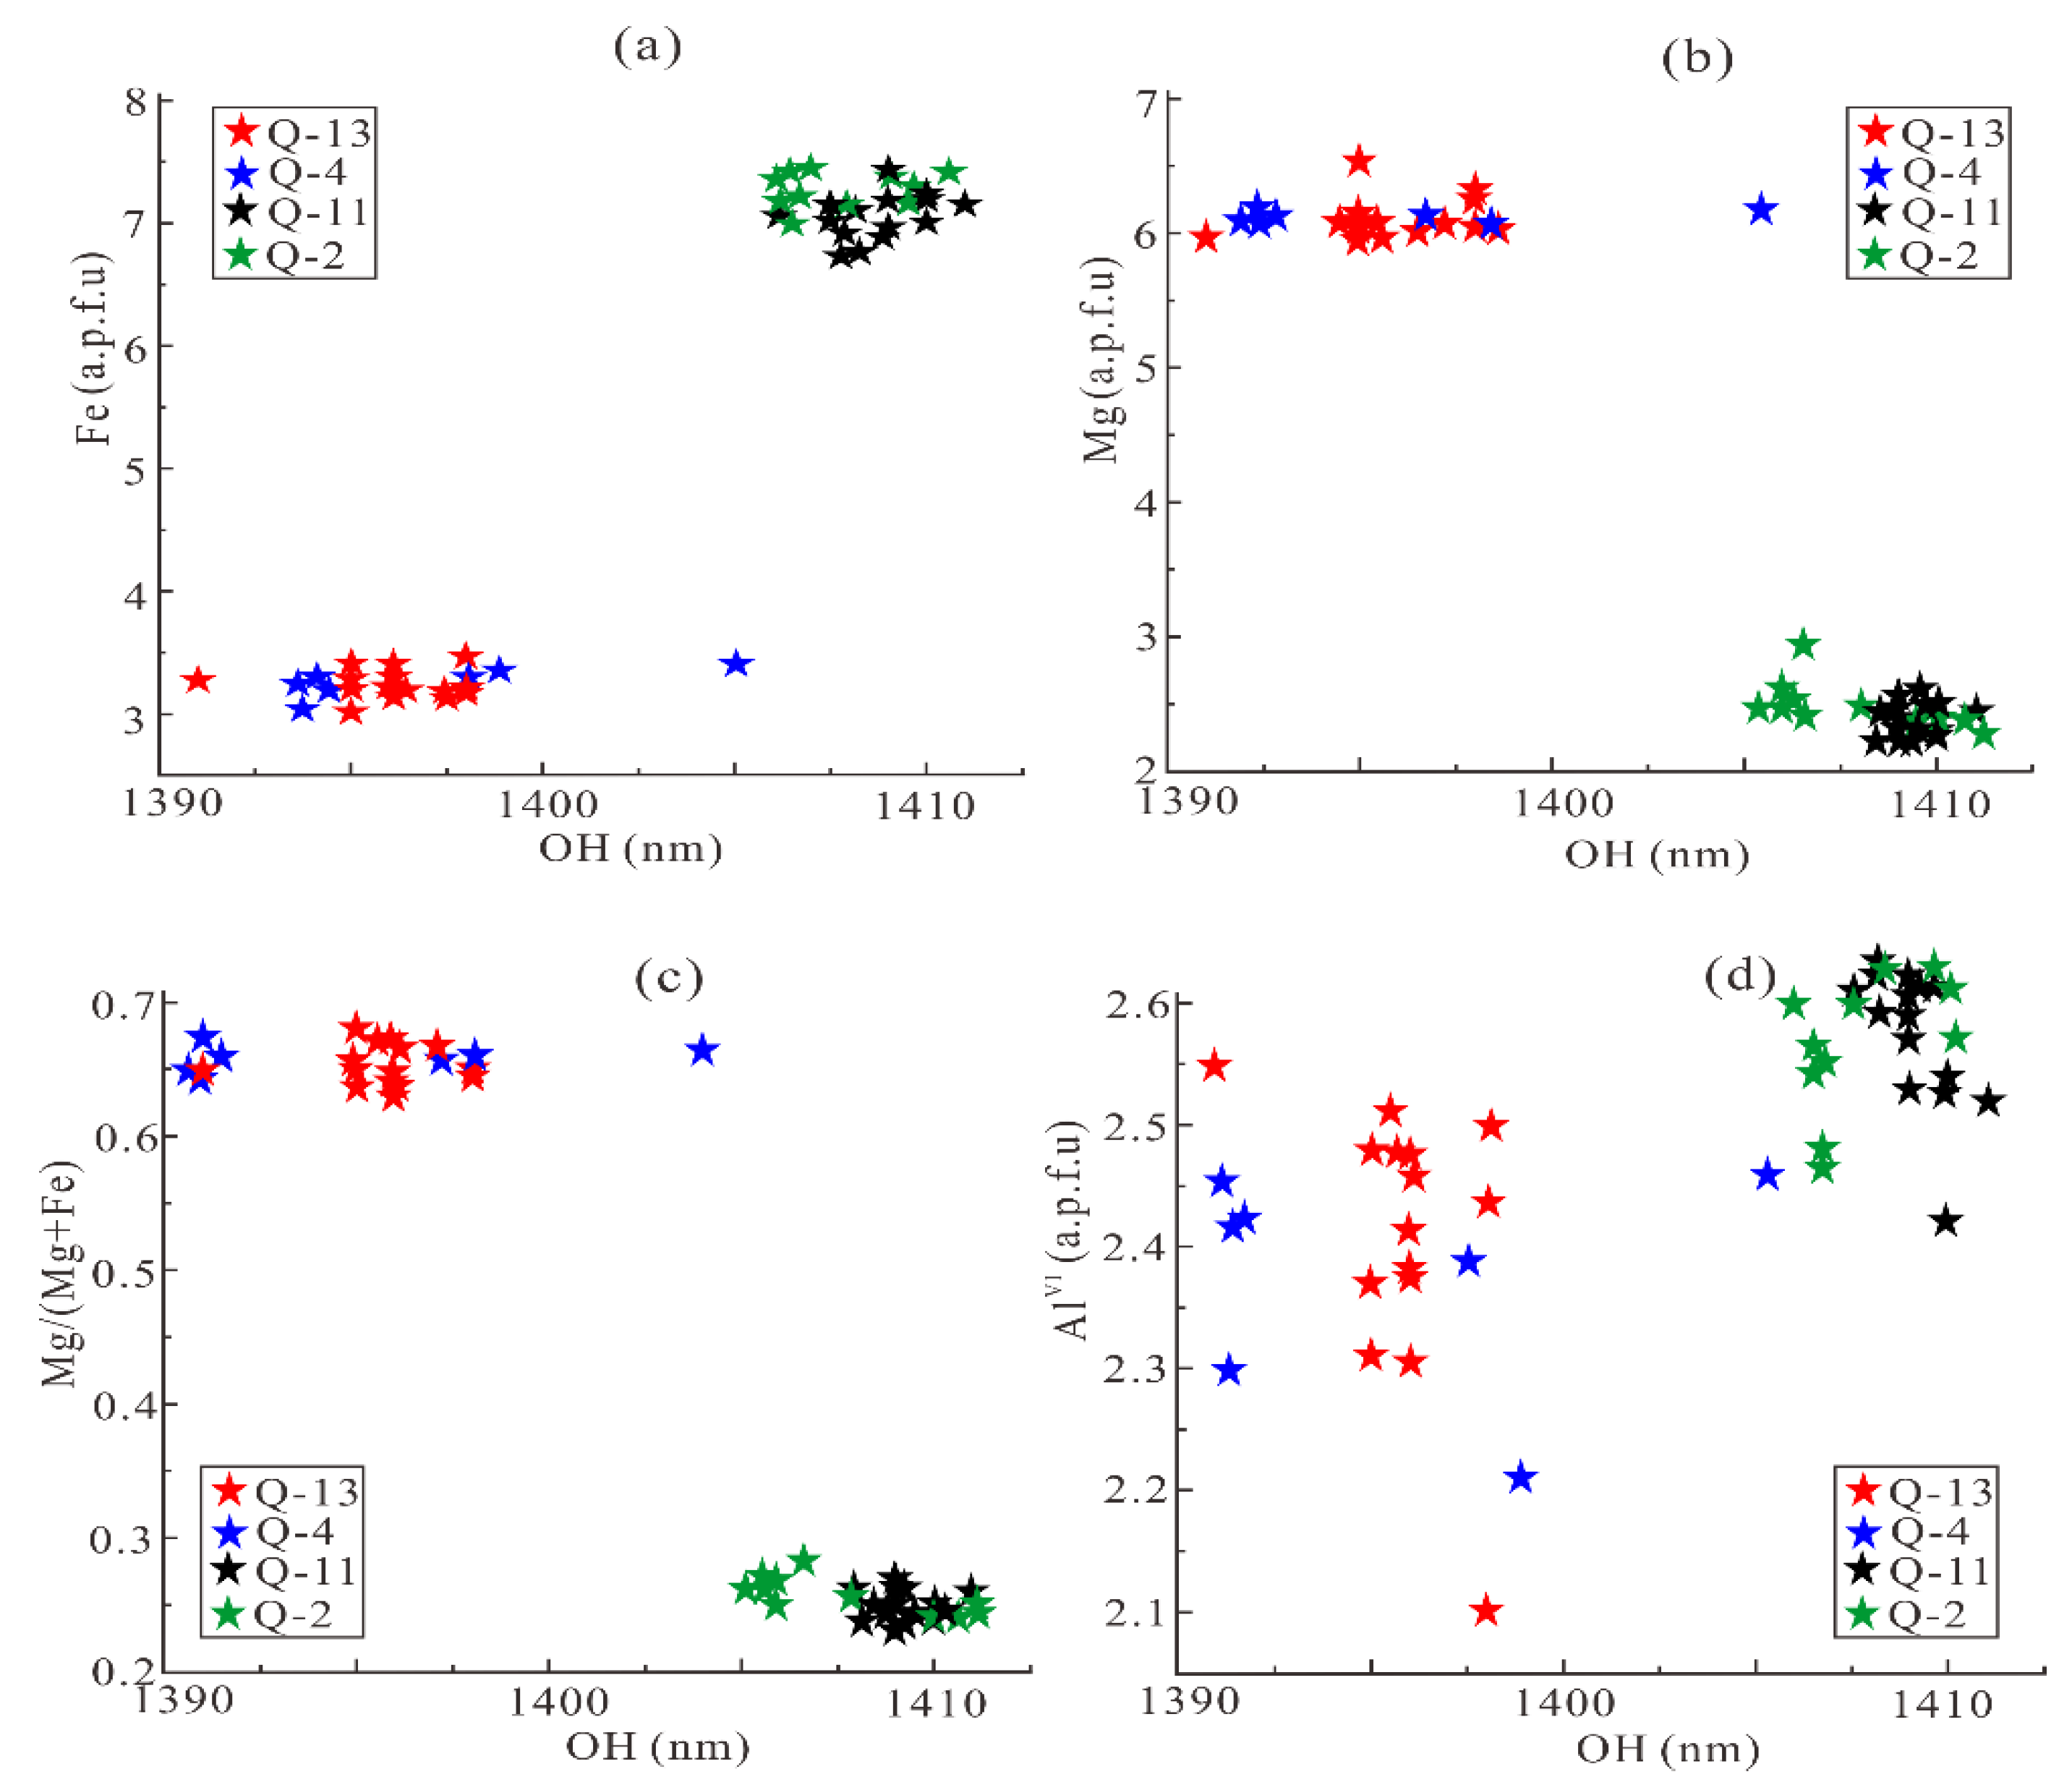
The spectral absorption features of chlorite are diagnostic to chemical composition variations. It can be inferred that the different absorption wavelengths of chlorite in the wall rock of BIFs and high-grade iron ore are due to their different chemical compositions. Previous studies have shown that the wavelength of Fe-OH is positively correlated with the relative amount of Fe2+ and inversely with the Mg2+ in the octahedral cation sites [6,24,42,43]. In the Qidashan Iron Deposit, the relationship between the wavelength positions of Fe-OH, Mg-OH, and OH and the content of cations in the octahedral layer of chlorite shows that the Fe-OH absorption band is positively correlated with the Fe and inversely related with Mg and Mg/(Mg + Fe) (Figure 20b,c), which is consistent with the result mentioned above. The Fe-OH band appears to be only weakly influenced by AlVI (Figure 20a,d). The other absorption bands manifest similar characteristics to those of Fe-OH (Figure 21 and Figure 22). The shorter wavelength of Fe-OH and/or Mg-OH indicates that chlorite in wall rocks around BIFs is Mg-rich (Q-4 and Q-13), whereas the longer wavelength is indicative of Fe-rich chlorite in wall rock around high-grade iron ore (Q-2 and Q-11).
Compared with the absorption wavelength, the relationship between the absorption depth and the specific chemical composition is not obvious. The absorption depth is usually related to the abundance of the absorber, but it is also strongly affected by the grain size of the material [15]. Therefore, the absorption depth of chlorite should be carefully applied in the practical mineral exploration.

6.2. Geological Significance and Application to Mineral Exploration

The above spectra and EPMA analysis show that the chemical composition of chlorite around BIFs and high-grade iron ore is obviously different. This is probably due to their different formation conditions. Previous studies on the Qidashan Iron Deposit showed that the BIFs in this area were deposited in an oxygen-deficient environment on the seafloor and, finally, formed through low-to-medium-grade metamorphism. The high-grade iron ores were formed from BIFs protore through iron reactivation-reprecipitation process by neutral-acidic hydrothermal solution. Correspondingly, the chlorites related to BIFs were formed in the low-to-medium-grade regional metamorphism, whereas the chlorites associated with high-grade iron ores were formed by neutral-acidic Fe-rich hydrothermal alteration, and the protoliths is argillaceous siltstone [14,44,45,46]. The difference in the chemical composition of chlorite caused by the forming conditions is well recorded in the wavelength position of chlorite. The Gongchangling Iron Deposit is the largest high-grade iron ore deposit in Anshan-Benxi area, where, similarly, the wall rocks around the high-grade iron ore suffered strong chloritization and the chlorite in alteration wall rocks is Fe-rich [13,14,47]; this is also the case for other high-grade iron ore sites such as Nanfen, Wangjiapuzi, etc. [14]. In this means, the wavelength of chlorite can be used as a favorable tool for the high-grade iron ore exploration in the entire Anshan-Benxi area. Since the bandpass of hyperspectral imaging systems is less than 10 nm, these results may also provide a basis for the aerial or satellite hyperspectral remote sensing mineral exploration in the near future.

6.3. Advantages and Disadvantages of Laboratory-Based Hyperspectral Imaging

Compared with point spectrometer, laboratory-based hyperspectral imaging has several advantages in extraction of mineralogical information, which are attributed to the high spatial resolution. First of all, the pixel size in hyperspectral image is much smaller than commonly used point spectrometer. For example, the probe size of the ASD FieldSpec-3 pro spectrometer used in this paper is 2 cm in diameter, whereas the pixel size of the HySpex image is 0.3 mm × 0.3 mm. The relatively small pixel size makes it possible to detect relatively small amounts of minerals whose spectral features are usually completely masked when measured by point spectrometer. The relatively small pixel size also provides spectra of pure minerals in hyperspectral imaging. Another advantage of hyperspectral imaging is that a large number of spectra are acquired simultaneously. By recording the number of pixels per mineral in the image, the mineralogy of samples can be quantified. This allows HySpex image to more accurately observe the details of minerals in the hand specimen, including mineral types, grain size, crosscutting, spatial distribution, paragenesis, etc., which can be used to determine the structure and texture of the rocks.
The disadvantage of laboratory-based hyperspectral imaging is relatively low S/N compared to point spectrometer. If a better S/N is required, it will take a long time to collect the images. Even in the same sensor, the different mineral combinations have a certain impact on the S/N. If low-reflectivity minerals are accompanied by the minerals of high-reflectivity (such as quartz), the S/N of image is also higher and the spectra of minerals can be identified. If most of the minerals are dark with low-reflectivity, the low S/N makes it difficult to identify. Thompson also noted that it is difficult to identify minerals with a content of less than 5%, unless the sample is a mixture with quartz and the mineral is highly reflective. However, where low reflectance minerals are present, recognition may require 20% or more of the mineral in the sample [48]. Therefore, a smoothing method should be used in actual operations to improve the S/N of the hyperspectral images.

7. Conclusions

Based on the study of hyperspectral imaging data in Qidashan iron mine, the following conclusions are drawn:
(1)
The results of mineral mapping and chlorite spectral features extraction in Qidashan Iron Deposit show that chlorite both occurs in the wall rocks around BIFs and high-grade iron ore. The wavelength position of OH, Fe-OH, and Mg-OH absorptions of chlorite around high-grade iron ore are between 1400 and 1410, 2260 and 2265, and 2360 and 2370 nm, respectively, whereas the corresponding wavelengths are between 1390 and 1400, 2245 and 2255, and 2330 and 2340 nm around BIFs.
(2)
The higher spatial resolution laboratory-based hyperspectral imaging can reflect the specific information of mineral species, mineral content, structure, and even the polytypes of the rock sample.
(3)
The relationship between cations in the chlorite octahedral layer and the absorption wavelengths of OH, Fe-OH, and Mg-OH indicates that Fe is positively related to the wavelength, whereas Mg and Mg/(Mg + Fe) are inversely related. The wavelength appears to be weakly influenced by AlVI. Nevertheless, the relative absorption depths of the OH, Fe-OH, and Mg-OH are a poor guide to chemical composition of chlorite.
(4)
The difference in the chemical composition of chlorite caused by the different formation conditions of BIFs and high-grade iron ore in Qidashan Iron Deposit is well recorded in the wavelength position of chlorite. This difference of the wavelength, in turn, can be used as a favorable tool for the exploration of high-grade iron ore in the Anshan-Benxi area. This chlorite hyperspectral imaging tool may also provide a basis for the aerial or satellite hyperspectral remote sensing mineral exploration in Anshan-Benxi area.

Author Contributions

D.H. processed the data and wrote the paper; Y.Y. conducted the paper revision and the discussion of the results; J.F. provided financial support and useful suggestions for the paper; J.R.M. provided assistance in HySpex data acquisition; K.S. reviewed the paper. All authors have read and agreed to the published version of the manuscript.

Funding

This research was funded by the National Key Research and Development Program of China (grant 2016YFC0801603).

Acknowledgments

We thank DiMap for access to the HySpex instruments used in the PSML, and we were also deeply indebted to the Qidashan Iron Deposit, Anshan Iron & Steel Group, for their kind help in field investigation and sampling.

Conflicts of Interest

The authors declare no conflict of interest.

References

  1. Clark, R.N. Water frost and ice: The near-infrared spectral reflectance 0.65–2.5 μm. J. Geophys. Res. Space Phys. 1981, 86, 3087–3096. [Google Scholar] [CrossRef]
  2. Hapke, B. Bidirectional reflectance spectroscopy: 1. Theory. J. Geophys. Res. Space Phys. 1981, 86, 3039–3054. [Google Scholar] [CrossRef]
  3. Clark, R.N.; Roush, T.L. Reflectance spectroscopy: Quantitative analysis techniques for remote sensing applications. J. Geophys. Res. Space Phys. 1984, 89, 6329–6340. [Google Scholar] [CrossRef]
  4. Bedini, E. Mineral mapping in the Kap Simpson complex, central East Greenland, using HyMap and ASTER remote sensing data. Adv. Space Res. 2011, 47, 60–73. [Google Scholar] [CrossRef]
  5. Dalm, M.; Buxton, M.W.; Van Ruitenbeek, F.J.; Voncken, J.H. Application of near-infrared spectroscopy to sensor based sorting of a porphyry copper ore. Miner. Eng. 2014, 58, 7–16. [Google Scholar] [CrossRef]
  6. Dalm, M.; Buxton, M.; Van Ruitenbeek, F. Discriminating ore and waste in a porphyry copper deposit using short-wavelength infrared (SWIR) hyperspectral imagery. Miner. Eng. 2017, 105, 10–18. [Google Scholar] [CrossRef]
  7. Neal, L.C.; Wilkinson, J.J.; Mason, P.J.; Chang, Z. Spectral characteristics of propylitic alteration minerals as a vectoring tool for porphyry copper deposits. J. Geochem. Explor. 2018, 184, 179–198. [Google Scholar] [CrossRef] [Green Version]
  8. De Linaje, V.A.; Khan, S.D.; Nicolás, V.A.D.L.D. Mapping of diagenetic processes in sandstones using imaging spectroscopy: A case study of the Utrillas Formation, Burgos, Spain. Sediment. Geol. 2017, 353, 114–124. [Google Scholar] [CrossRef]
  9. Greenberger, R.N.; Ehlmann, B.L.; Jewell, P.W.; Birgenheier, L.P.; Green, R.O. Detection of organic-rich oil shales of the green river formation, Utah, with ground-based imaging spectroscopy. In Proceedings of the 2016 8th Workshop on Hyperspectral Image and Signal Processing: Evolution in Remote Sensing, Los Angeles, CA, USA, 23 August 2016. [Google Scholar]
  10. Zaini, N.; Van Der Meer, F.; Van Der Werff, H. Determination of Carbonate Rock Chemistry Using Laboratory-Based Hyperspectral Imagery. Remote Sens. 2014, 6, 4149–4172. [Google Scholar] [CrossRef] [Green Version]
  11. Baissa, R.; Labbassi, K.; Launeau, P.; Gaudin, A.; Ouajhain, B. Using HySpex SWIR-320m hyperspectral data for the identification and mapping of minerals in hand specimens of carbonate rocks from the Ankloute Formation (Agadir Basin, Western Morocco). J. Afr. Earth Sci. 2011, 61, 1–9. [Google Scholar] [CrossRef]
  12. Lampinen, H.M.; Laukamp, C.; Occhipinti, S.A.; Hardy, L. Mineral footprints of the Paleoproterozoic sediment-hosted Abra Pb-Zn-Cu-Au deposit Capricorn Orogen, Western Australia. Ore Geol. Rev. 2018, 104, 436–461. [Google Scholar] [CrossRef]
  13. Wang, E.-D.; Xia, J.-M.; Fu, J.-F.; Jia, S.-S.; Men, Y.-K. Formation mechanism of Gongchangling high-grade magnetite deposit hosted in Archean BIF, Anshan-Benxi area, Northeastern China. Ore Geol. Rev. 2014, 57, 308–321. [Google Scholar] [CrossRef]
  14. Li, H.; Yang, X.-Q.; Li, L.-X.; Zhang, Z.-C.; Liu, M.-J.; Yao, T.; Chen, J. Desilicification and iron activation–reprecipitation in the high-grade magnetite ores in BIFs of the Anshan-Benxi area, China: Evidence from geology, geochemistry and stable isotopic characteristics. J. Asian Earth Sci. 2015, 113, 998–1016. [Google Scholar] [CrossRef]
  15. Clark, R.N. Spectroscopy of Rocks and Minerals, and Principles of Spectroscopy. In Remote Sensing for the Earth Sciences: Manual of Remote Sensing, 3rd ed.; Rencz, A.N., Ed.; John Wiley and Sons: New York, NY, USA, 1999; Volume 3, pp. 3–58. [Google Scholar]
  16. Clark, R.N.; King, T.V.V.; Klejwa, M.; Swayze, G.A.; Vergo, N. High spectral resolution reflectance spectroscopy of minerals. J. Geophys. Res. Space Phys. 1990, 95, 12653–12680. [Google Scholar] [CrossRef] [Green Version]
  17. King, T.V.V.; Clark, R.N. Spectral characteristics of chlorites and Mg-serpentines using high-resolution reflectance spectroscopy. J. Geophys. Res. Space Phys. 1989, 94, 13997–14008. [Google Scholar] [CrossRef]
  18. Hunt, G.R. Spectral signatures of particulate minerals in the visible and near infrared. Geophysics 1977, 42, 501–513. [Google Scholar] [CrossRef] [Green Version]
  19. Hunt, G.R. Near-infrared (1.3–2.4) μm spectra of alteration minerals—Potential for use in remote sensing. Geophysics 1979, 44, 1974–1986. [Google Scholar] [CrossRef]
  20. Bishop, J.L.; Lane, M.D.; Dyar, M.D.; Brown, A.J. Reflectance and emission spectroscopy study of four groups of phyllosilicates: Smectites, kaolinite-serpentines, chlorites and micas. Clay Min. 2008, 43, 35–54. [Google Scholar] [CrossRef]
  21. Bishop, J.L. Infrared Spectroscopic Analyses on the Nature of Water in Montmorillonite. Clays Clay Min. 1994, 42, 702–716. [Google Scholar] [CrossRef]
  22. Yang, M.; Ye, M.; Han, H.; Ren, G.; Han, L.; Zhang, Z. Near-Infrared Spectroscopic Study of Chlorite Minerals. J. Spectrosc. 2018, 2018, 6958260. [Google Scholar] [CrossRef]
  23. Burns, R.G. Mineralogical Applications of Crystal Field Theory; Cambridge University Press: London, UK, 1993; pp. 149–152. [Google Scholar]
  24. Yang, K.; Lian, C.; Huntington, J.F.; Peng, Q.; Wang, Q. Infrared spectral reflectance characterization of the hydrothermal alteration at the Tuwu Cu–Au deposit, Xinjiang, China. Miner. Depos. 2005, 40, 324–336. [Google Scholar] [CrossRef]
  25. James, H.L. Sedimentary facies of iron-formation. Econ. Geol. 1954, 49, 235–293. [Google Scholar] [CrossRef]
  26. Zhai, M.; Santosh, M. Metallogeny of the North China Craton: Link with secular changes in the evolving Earth. Gondwana Res. 2013, 24, 275–297. [Google Scholar] [CrossRef]
  27. Vaiphasa, C. Consideration of smoothing techniques for hyperspectral remote sensing. ISPRS J. Photogramm. Remote Sens. 2006, 60, 91–99. [Google Scholar] [CrossRef]
  28. Fraser, S.J.; Whitbourn, L.; Yang, K.; Ramanaidou, E.; Connor, P.; Poropat, G.; Soole, P.; Mason, P.; Coward, D.; Phillips, R. Mineralogical Face-Mapping Using Hyperspectral Scanning for Mine Mapping and Control. In Proceedings of the 6th International Mining Geology Conference, Darwin, NT, Australia, 21 August 2006; pp. 227–232. [Google Scholar]
  29. Ruffin, C.; King, R.L.; Younan, N.H. A Combined Derivative Spectroscopy and Savitzky-Golay Filtering Method for the Analysis of Hyperspectral Data. GISci. Remote Sens. 2008, 45, 1–15. [Google Scholar] [CrossRef]
  30. Chen, J.; Jönsson, P.; Tamura, M.; Gu, Z.; Matsushita, B.; Eklundh, L. A simple method for reconstructing a high-quality NDVI time-series data set based on the Savitzky–Golay filter. Remote Sens. Environ. 2004, 91, 332–344. [Google Scholar] [CrossRef]
  31. Savitzky, A.; Golay, M.J.E. Smoothing and Differentiation of Data by Simplified Least Squares Procedures. Anal. Chem. 1964, 36, 1627–1639. [Google Scholar] [CrossRef]
  32. Ostertagov, E.; Ostertag, O. Methodology and application of Savitzky-Golay moving average polynomial smoother. Glob. J. Pure Appl. Math. 2016, 12, 3201–3210. [Google Scholar]
  33. Tong, D.; Jia, Z.; Qin, X.; Cao, C.; Chang, C. An Optimal Savitzky-golay Filtering Based Vertical Handoff Algorithm in Heterogeneous Wireless Networks. J. Comput. 2014, 9, 2685–2690. [Google Scholar] [CrossRef] [Green Version]
  34. Mao, Y.; Wang, D.; Liu, S.; Song, L.; Wang, Y.; Zhao, Z. Research and Verification of a Remote Sensing BIF Model Based on Spectral Reflectance Characteristics. J. Indian Soc. Remote Sens. 2019, 47, 1051–1061. [Google Scholar] [CrossRef]
  35. Kruse, F.A.; Bedell, R.L.; Taranik, J.V.; Peppin, W.A.; Weatherbee, O.; Calvin, W.M. Mapping alteration minerals at prospect, outcrop and drill core scales using imaging spectrometry. Int. J. Remote Sens. 2011, 33, 1780–1798. [Google Scholar] [CrossRef] [PubMed] [Green Version]
  36. Boardman, J.W. Analysis, understanding and visualization of hyperspectral data last convex sets in n-space. In Proceedings of the SPIE Defense and Security-The International Scoiety for Optical Engineering, Orlando, FL, USA, 17 April 1995. [Google Scholar]
  37. Kruse, F.; Lefkoff, A.; Boardman, J.; Heidebrecht, K.; Shapiro, A.; Barloon, P.; Goetz, A. The spectral image processing system (SIPS)—Interactive visualization and analysis of imaging spectrometer data. Remote Sens. Environ. 1993, 44, 145–163. [Google Scholar] [CrossRef]
  38. Duke, E.F. Near infrared spectra of muscovite, Tschermak substitution, and metamorphic reaction progress: Implications for remote sensing. Geology 1994, 22, 621–624. [Google Scholar] [CrossRef]
  39. Van Der Meer, F. Spectral reflectance of carbonate mineral mixtures and bidirectional reflectance theory: Quantitative analysis techniques for application in remote sensing. Remote Sens. Rev. 1995, 13, 67–94. [Google Scholar] [CrossRef]
  40. Kurz, T.H.; Dewit, J.; Buckley, S.J.; Thurmond, J.B.; Hunt, D.W.; Swennen, R. Hyperspectral image analysis of different carbonate lithologies (limestone, karst and hydrothermal dolomites): The Pozalagua Quarry case study (Cantabria, North-west Spain). Sedimentology 2011, 59, 623–645. [Google Scholar] [CrossRef]
  41. Zaini, N.; Van Der Meer, F.D.; Van Der Werff, H. Effect of Grain Size and Mineral Mixing on Carbonate Absorption Features in the SWIR and TIR Wavelength Regions. Remote Sens. 2012, 4, 987–1003. [Google Scholar] [CrossRef] [Green Version]
  42. Yang, K.; Huntington, J.F.; Browne, P.R.; Ma, C. An infrared spectral reflectance study of hydrothermal alteration minerals from the Te Mihi sector of the Wairakei geothermal system, New Zealand. Geothermics 2000, 29, 377–392. [Google Scholar] [CrossRef]
  43. McLeod, R.L.; Gabell, A.R.; Gardavsky, V. Chlorite infrared spectral data as proximity indicators of volcanogenic massive sulfide mineralisation. In Proceedings of the Pacific Rim Congress 87, Gold Coast, Australia, 1 January 1987; pp. 321–324. [Google Scholar]
  44. Li, H.; Zhang, Z.; Li, L.; Zhang, Z.; Chen, J.; Yao, T. Types and general characteristics of the BIF-related iron deposits in China. Ore Geol. Rev. 2014, 57, 264–287. [Google Scholar] [CrossRef]
  45. Liu, M.J.; Zeng, Q.D.; Li, H.M.; Li, L.X.; Wen, Y.; Yao, L.D.; Gao, Y.S. Metallogenic epoch of high-grade iron ore deposits of iron activation and enrichment genesis in Anshan-Benxi area of Liaoning: Re-Os isotopic dating evidence of molybdenite from Qidashan iron deposit. Miner. Depos. 2017, 36, 237–249. [Google Scholar]
  46. Li, Y.H.; Zhang, Z.J.; Hou, K.J.; Duan, C.; Wang, D.F.; Hu, G.Y. The genesis of Gongchangling high-grade iron ores, Anshan-Benxi area, Liaoning province, NE China: Evidence from Fe-Si-O-S isotopes. Acta Geol. Sin. 2014, 88, 2351–2372. [Google Scholar]
  47. Chen, G.Y.; Sun, D.S.; Sun, C.M.; Li, M.H.; Wang, X.F.; Wang, Z.F. Genesis of Gongchanglin iron deposit. J. Mineral. Petrol. 1984, 4, 1–226. [Google Scholar]
  48. Thompson, A.J.B.; Hauff, P.L.; Robitaille, A.J. Alteration mapping in exploration: Application of short-wave infrared (SWIR) spectroscopy. Soc. Econ. Geol. Newsl. 1999, 39, 15–27. [Google Scholar]
Figure 1. The structure of chlorite.
Applsci 10 07444 g001
Figure 2. (a) Six-coordinated octahedron around Fe and (b) crystal field splitting of Fe2+ 3d orbitals in the regular octahedron. The octahedral distortion will cause further splitting.
Applsci 10 07444 g002
Figure 3. The spectral absorption features of chlorite [15,17,18].
Applsci 10 07444 g003
Figure 4. Schematic diagram of OH vibrations in octahedral sheet of chlorite. The OH-bending motion is shown in blue and the OH-stretching motion in yellow (modified from Bishop [20]).
Applsci 10 07444 g004
Figure 5. (a) Simplified regional geological map of Anshan area, (b) geological map of Qidashan Iron Deposit, and (c) sketch diagram of sampling.
Applsci 10 07444 g005
Figure 6. The laboratory-based hyperspectral imaging processing model.
Applsci 10 07444 g006
Figure 7. The instruments used for data acquisition in this paper: (a) HySpex hyperspectral imaging system and (b) Analytical Spectral Devices (ASD) FieldSpec-3 pro spectrometer.
Applsci 10 07444 g007
Figure 8. The principle of Savitzky–Golay filtering.
Applsci 10 07444 g008
Figure 9. The results of Savitzky–Golay filtering: (a) smooth result of 5 points and 2 order and (b) smooth result of 6 points and 2 order. A larger window will minimize the subtle spectral features (blue box).
Applsci 10 07444 g009
Figure 10. The visible and near-infrared spectral range (VNIR) spectra of magnetite, pyrite, and quartz: (a) spectra of pyrite and magnetite in Q-2 and (b) spectra of quartz and magnetite in Q-12.
Applsci 10 07444 g010
Figure 11. Comparison of original and continuum-removal spectrum.
Applsci 10 07444 g011
Figure 12. The point spectra of the samples: (a) samples near high-grade iron ore and (b) samples near banded iron formations (BIFs).
Applsci 10 07444 g012
Figure 13. Scatter diagram of the wavelength positions near 2250 and 2350 nm extracted from the point spectra.
Applsci 10 07444 g013
Figure 14. The endmember spectral library for the short-wave infrared spectroscopy (SWIR) mineral mapping.
Applsci 10 07444 g014
Figure 15. The result of hyperspectral mineral mapping: (a) the photo and mineral map of Q-2; (b) the photo and mineral map of Q-4; (c) the photo and mineral map of Q-9; (d) the photo and mineral map of Q-11; (e) the photo and mineral map of Q-12; (f) the photo and mineral map of Q-13.
Applsci 10 07444 g015
Figure 16. Photomicrographs of the samples (plane-polarized light): (a) the photomicrograph of Q-2; (b) the photomicrograph of Q-4; (c) the photomicrograph of Q-9; (d) the photomicrograph of Q-11; (e) the photomicrograph of Q-12; (f) the photomicrograph of Q-13.
Applsci 10 07444 g016
Figure 17. Results of the absorption wavelength position mapping of chlorite: (a) mineral map; (b) wavelength of OH; (c) wavelength of Fe-OH; (d) wavelength of Mg-OH.
Applsci 10 07444 g017
Figure 18. Scatter diagrams of the wavelength and molecular formula of chlorite: (a) scatter diagram of OH, Fe-OH, and Mg-OH bands and (b) scatter diagram of Mg, Fe, and AlVI cations; the data have been normalized.
Applsci 10 07444 g018
Figure 19. Results of the absorption depth of chlorite: (a) mineral map; (b) absorption depth of OH; (c) absorption depth of Fe-OH; (d) absorption depth of Mg-OH.
Applsci 10 07444 g019
Figure 20. The relationship between the wavelength of Fe-OH band and the content of cations in the octahedral layer of chlorite: (a) the relationship between Fe-OH and Fe; (b) the relationship between Fe-OH and Mg; (c) the relationship between Fe-OH and Mg/(Mg+Fe); (d) the relationship between Fe-OH and AlVI (the overlap points have been offset for clarity).
Applsci 10 07444 g020
Figure 21. The relationship between the wavelength of Mg-OH band and the content of cations in the octahedral layer of chlorite: (a) the relationship between Mg-OH and Fe; (b) the relationship between Mg-OH and Mg; (c) the relationship between Mg-OH and Mg/(Mg+Fe); (d) the relationship between Mg-OH and AlVI (the overlap points have been offset for clarity).
Applsci 10 07444 g021
Figure 22. The relationship between the wavelength of OH band and the content of cations in the octahedral layer of chlorite: ((a) the relationship between OH and Fe; (b) the relationship between OH and Mg; (c) the relationship between OH and Mg/(Mg + Fe); (d) the relationship between OH and AlVI (the overlap points have been offset for clarity)).
Applsci 10 07444 g022
Table 1. The electron probe microanalyzer (EPMA) analysis result of the chlorite chemical composition.
CommentK2ONa2OSiO2TiO2Al2O3FeOMgOMnOCaOClP2O5Total
Q-2-010.010.0122.390.0519.1635.876.600.1900.010.0284.31
Q-2-020.000.0122.650.0419.2036.636.460.150.040.030.0085.21
Q-2-030.000.0022.870.0419.1535.807.130.170.020.020.0085.20
Q-2-040.010.0223.400.0718.7136.487.130.130.030.010.0186.00
Q-2-050.030.0222.760.0319.5136.356.930.190.010.010.0385.87
Q-2-060.000.0322.840.0318.5636.766.970.170.200.010.0185.58
Q-2-070.000.0022.820.0619.6637.286.880.200.000.010.0086.91
Q-2-080.010.0123.210.0318.7237.516.180.150.000.010.0185.84
Q-2-090.000.0023.740.0618.7836.627.120.130.000.010.0086.46
Q-2-100.000.0023.280.0519.8337.137.000.150.000.000.0087.44
Q-2-110.010.0123.730.0718.6435.538.020.170.000.010.0086.19
Q-11-010.010.0322.810.0319.7737.117.050.150.000.010.0086.97
Q-11-020.000.0022.890.0519.6436.967.170.190.000.010.0089.91
Q-11-030.010.0023.180.0419.5337.566.770.160.000.000.0087.25
Q-11-040.010.0123.000.0220.1136.387.620.150.000.020.0187.33
Q-11-050.010.0122.680.0618.2337.226.330.130.230.000.0184.93
Q-11-060.000.0122.940.0319.4237.147.080.210.000.010.0086.84
Q-11-070.020.0423.310.0319.5436.587.080.160.010.020.0086.79
Q-11-080.000.0022.990.0219.9836.257.350.200.000.020.0086.81
Q-11-090.000.0023.390.0119.8636.477.200.190.000.000.0087.12
Q-11-100.000.0017.840.0313.7446.616.020.180.060.010.0184.5
Q-11-110.000.0022.960.0519.9436.527.050.120.050.010.0186.71
Q-11-120.000.0122.610.0519.9836.437.110.160.000.010.0086.36
Q-11-130.000.0023.020.0319.4937.196.460.160.000.010.0086.36
Q-11-140.000.0322.750.0519.8937.197.000.180.000.030.0087.12
Q-11-150.000.0022.750.0420.0637.176.910.190.000.000.0287.14
Q-13-010.000.0026.620.0219.8718.6019.050.400.000.000.0084.56
Q-13-020.030.0226.510.0418.6118.9519.120.390.020.000.0083.69
Q-13-030.030.0227.010.0519.7018.8419.490.390.000.000.0285.55
Q-13-040.010.0028.360.0116.8919.7520.280.380.040.010.0185.74
Q-13-050.030.0327.870.0418.6117.3821.200.400.000.010.0085.57
Q-13-060.000.0025.650.0520.2618.8419.910.390.030.000.0085.13
Q-13-070.010.0326.410.0319.5519.0719.770.380.020.000.0085.27
Q-13-080.010.0127.10.0218.9118.7819.870.380.000.010.0185.1
Q-13-090.000.0126.290.0420.1318.9919.610.410.000.000.0085.48
Q-13-100.010.0126.90.0519.718.8919.800.360.000.010.0185.74
Q-13-110.000.0027.170.0419.3218.8419.310.400.000.010.0285.11
Q-13-120.020.0026.820.0219.6818.3619.440.360.000.010.0084.71
Q-13-130.020.0127.050.0319.5018.5619.390.420.000.010.0084.99
Q-13-140.080.0127.010.0319.0418.6620.550.360.000.000.0185.75
Q-13-150.020.0026.670.0319.7418.9219.680.400.000.000.0085.46
Q-4-010.000.0626.100.0219.4918.8419.330.390.010.100.0184.35
Q-4-020.060.0130.320.1116.1818.6319.500.350.040.010.0085.21
Q-4-030.040.0027.340.0419.2319.0219.390.340.000.000.0085.46
Q-4-040.000.0226.840.0219.2719.0619.440.390.030.010.0085.08
Q-4-050.000.0328.480.0318.2517.4619.670.420.000.000.0184.71
Q-4-060.010.0026.740.0519.0818.9819.620.380.000.010.0084.87
Q-4-070.030.1027.650.0217.9618.8019.670.370.000.130.0084.73
Table 2. Calculation of the chlorite structural formula (based on 28 oxygen atoms).
CommentSiAlIVAlVITiFe3+Fe2+MnMgCaNaKClMg/(Fe + Mg)
Q-2-015.272.732.600.010.007.110.042.310.000.000.000.010.25
Q-2-025.282.722.580.010.007.200.032.250.010.010.000.020.24
Q-2-035.312.692.560.010.007.000.032.470.000.000.000.020.26
Q-2-045.392.612.480.010.007.070.032.450.010.020.010.010.26
Q-2-055.252.752.570.010.007.090.042.380.010.020.010.010.25
Q-2-065.312.692.420.010.007.260.032.420.000.020.000.000.25
Q-2-075.212.792.530.010.007.220.042.340.000.020.000.010.24
Q-2-085.402.602.530.010.007.320.032.140.000.000.000.000.23
Q-2-095.442.562.520.010.007.030.022.430.000.000.000.000.26
Q-2-105.282.722.580.010.017.090.032.360.000.000.000.010.25
Q-2-115.422.582.450.010.006.830.032.730.000.000.010.010.29
Q-11-015.202.802.530.000.007.180.032.400.000.020.000.010.25
Q-11-025.222.782.520.010.007.150.042.440.000.000.000.000.25
Q-11-035.282.722.540.010.007.230.032.300.000.000.000.000.24
Q-11-045.192.812.570.000.006.970.032.560.000.010.010.020.27
Q-11-055.332.672.400.010.007.430.032.220.060.030.010.000.23
Q-11-065.242.762.490.000.007.210.042.410.000.010.000.010.25
Q-11-075.312.692.580.000.007.020.032.410.000.030.010.010.26
Q-11-085.232.772.600.000.006.960.042.490.000.000.000.010.26
Q-11-095.302.702.620.000.006.950.042.430.020.000.000.000.26
Q-11-104.423.582.610.000.006.870.042.220.010.000.000.000.24
Q-11-115.242.762.610.010.007.020.022.400.000.000.000.010.25
Q-11-125.182.822.590.010.007.070.032.430.000.010.000.010.26
Q-11-135.302.702.600.010.007.200.032.220.000.000.000.010.24
Q-11-145.182.822.540.010.007.190.032.370.000.030.000.020.25
Q-11-155.182.822.580.010.007.170.042.340.000.000.000.000.25
Q-13-015.612.392.550.000.093.180.075.980.000.000.000.000.65
Q-13-025.672.332.370.010.033.360.076.100.010.010.010.000.64
Q-13-035.632.372.480.010.063.220.076.060.000.010.000.000.65
Q-13-045.932.072.100.000.023.430.076.330.010.000.000.000.65
Q-13-055.762.242.310.010.042.970.076.540.000.020.020.000.69
Q-13-065.392.612.410.010.003.390.076.230.010.000.000.000.65
Q-13-075.542.462.390.000.003.380.076.290.000.020.000.000.65
Q-13-085.692.312.370.000.033.260.076.220.000.010.000.010.65
Q-13-095.502.502.470.010.003.330.076.120.000.010.000.000.65
Q-13-105.602.402.440.010.033.260.066.150.000.010.000.010.65
Q-13-115.692.312.470.010.103.200.076.030.000.000.000.000.65
Q-13-125.632.372.510.000.083.140.066.080.000.000.010.000.65
Q-13-135.672.332.490.010.093.160.076.050.000.000.010.000.65
Q-13-145.622.382.300.000.003.280.066.370.000.010.040.000.66
Q-13-155.582.422.450.000.023.290.076.140.000.000.010.000.65
Q-4-015.542.462.420.000.003.350.076.120.000.050.000.070.65
Q-4-026.241.762.200.020.153.050.065.980.010.000.010.010.66
Q-4-035.712.292.450.010.093.230.066.040.000.000.020.000.65
Q-4-045.642.362.420.000.043.310.076.090.010.020.000.010.65
Q-4-055.942.062.450.000.222.830.076.120.000.020.000.010.68
Q-4-065.642.362.380.010.023.330.076.170.000.000.000.010.65
Q-4-075.822.182.290.000.073.240.076.170.000.080.010.090.66
Publisher’s Note: MDPI stays neutral with regard to jurisdictional claims in published maps and institutional affiliations.