A Novel Optimization Algorithm for Echium amoenum Petals Drying


1
Department of Agricultural Machinery Mechanics, Azadshahr Branch, Islamic Azad University, Azadshahr 49617-89985, Iran
2
Institute of Mechanical Engineering, Warsaw University of Life Sciences, 02-787 Warsaw, Poland
*
Author to whom correspondence should be addressed.
Appl. Sci. 2020, 10(23), 8387; https://doi.org/10.3390/app10238387
Submission received: 15 October 2020
/
Revised: 16 November 2020
/
Accepted: 22 November 2020
/
Published: 25 November 2020
(This article belongs to the Special Issue Recent Advances in Sustainable Process Design and Optimization)
Abstract
:A novel multi-objective optimization algorithm was developed, which was successfully applied in the drying process. The effect of drying parameters (air velocity (vd), drying temperature (Td)) on the energy consumption (EC) and the quality parameters of Echium amoenum petals in fluidized drying were experimentally studied. The following quality parameters were examined: the color difference, the bioactive compounds as losses of total antioxidant capacity (TAC) and losses of phenolic (TPC), flavonoids (TFC) and anthocyanin (A). The six optimization objectives included simultaneous minimization of the quality parameters and energy consumption. The objective functions represent relationships between process variables and optimization objectives. The relations were approximated using an Artificial Neural Network (ANN). The Pareto optimal set with a nondominated sorting genetic algorithm was developed. No unequivocal solution to the optimization problem was found. Cannot be obtained E. amoenum petals characterized a low color change at low energy consumption due to its fluidized drying. Unique Pareto optimal solutions were found: Td = 54 °C and vd = 1.0 m/s–for the strategy in which the lower losses of TAC, TFC and A are most important, and Td = 59.8 °C and vd = 0.52 m/s–for the strategy in which the lower losses of TPC and TFC are important with accepted EC values. The results of this research are essential for the improvement of industrial dehydration of E. amoenum petals in order to maintain their high content of bioactive compounds with low energy consumption and low colour change
1. Introduction
Many biochemical reactions in the body produce active oxygen species that are capable of destroying biomolecules [1]. The production of nitrogen oxide derivatives and forms of active oxygen is one of the causes of cancers and cardiovascular diseases [2]. Antioxidants are effective compounds that can prevent the oxidation of macromolecules such as proteins, nucleic acids and lipids [3]. These compounds trap free radicals and cause detoxification [4]. Some of these compounds are made with antioxidant or anti-oxidant properties as secondary metabolites of plants in nature, including compounds such as phenols, flavonoids, steroids, and terpenoids [5,6]. Dried petals of Borage Iranian (Echium amoenum Fisch. and C. A. Mey) contain considerably high amounts of phenol, flavonoids and anthocyanins [7] that play a major role in antioxidant activity [8]. For this reason, traditional medicine it is used as a drug for the treatment of depression [9], neurological problems [10,11,12], obsessive-compulsive disorder [10,13], anxiety [14], as an analgesic [15], for the prevention of inflammation and irritation of the kidneys and ducts, for rheumatism and heart disease [9], for colds, pneumonia, bronchitis [16,17], as a mucolytic drug, blood purifier, healer of soda diseases [18,19], and due to its importance to the immune system [20], it is even recommended for the prevention of gastric cancer and diabetes [16,17].
The E. amoenum petals of the medicinal plant should be dried immediately and stirred to avoid microbial damage during drying. Improper processing and the use of inappropriate parameters for drying have negative effects on the therapeutic properties of pharmaceutical products [21]. Therefore, in energy-intensive processes such as drying, the key challenge is to find the most efficient way to produce a better-quality product with minimal energy consumption.
The fluidized bed drying (FBD) is a more attractive choice for drying medicinal plants [22,23] and to produce advanced functional materials such as nutrients, dietary supplements and herbal remedies [24,25] because of the intense mixing resulting in high heat and mass transfer rates as well as uniformity, which makes it possible to control the bed conditions even at temperatures causing thermal degradation [24,26]. This method is suitable for heat-sensitive foods aiming to retain the bioactive compound because it prevents overheating [24,27,28,29]. Due to their high drying efficiency, FBD is suitable for use in large-scale operations [30,31] and is typically an economical method compared to other drying techniques. Therefore, FBDs are cheaper, easier and more attractive for use in industry, and even for farmers to produce high-quality products [27].
Determining the optimal dehydration parameters is very important for solving the challenges in product quality and optimizing the amount of energy consumption for drying. However, there is little information in the literature about this subject. Balbay et al. [32] used ANNs to optimize the drying of Siirt pistachios. A backpropagation learning algorithm with Levenberg-Marguardt (LM) and scaled conjugate gradient and sigmoid transfer function in the network were used. The best LM algorithm had 15 neurons and the value of R2 = 99.99% [32]. Feed Forward Neural Networks were used for modelling the nonlinear behavior of drying terebinth fruit, and was able to predict the optimal conditions for drying rate, energy consumption, moisture ratio and shrinkage [33]. A trained feedforward multilayer perceptron with back-propagation algorithm was able to predict the physicochemical properties of raspberries in a fluidized bed dryer [34].
Yüzgeç et al. [35] presented four models (modelling based on mass and heat transfer, modelling based on the mechanism of diffusion, ANN and ANFIS) to predict production performance and Baker’s yeast temperature in the fluidized bed drying. It was found that the overall performance of the ANFIS model is better than the other three models [35]. Hashemi Shahraki et al. [36] performed the optimization of the fluidized bed drying of a sesame seed to find the least change in color and texture using the response surface method and genetic algorithm. The coefficients of Response Surface Methodology (RSM) models were optimized using the genetic algorithm (GA). GA-optimized models had better fitness than RSM models. [36]. Nazghelichi et al. [37] used the integration of RSM and GA to develop an ANN to optimize the FBD of the carrot. The results showed that this approach (RSM with GA) is a useful tool to find the optimal topology of ANN for predicting energy and exergy in FBD [37]. Amiri Chayjan et al. [38] predicted optimal drying conditions of pistachio for effective moisture diffusion, shrinkage, drying time, specific energy consumption, and color change as a function of fluidized bed drying conditions with RSM [38]. Tasirin et al. [39] used the Taguchi method to optimize the drying of bird’s eye chilli in an FBD. They also obtained similar results when using the one factor at a time (OFAT) method [39].
Various methods such as mathematical modelling, regression analysis and ANN have been used to predict the drying rate. However, few studies have been conducted on the modelling of product quality parameters.
The tested product: E. amoenum, as mentioned, is a medicinal plant and the use of inappropriate parameters for drying have negative effects on the therapeutic properties of pharmaceutical dried products. It also requires, as with the case of any product, an appropriate colour of dried material. Drying is a very energy-consuming process, so it seems advisable to carry out this process with low energy expenditure. However, in the case of drying E. amoenum petals, where the quality directly affects the price of the dried petals (and poor-quality product is worthless), the drying process should be carried out with the lowest possible energy expenditure.
The presented study investigated the effect of drying process variables (air temperature (Td) and air velocity and (vd)) on the following quality parameters of E. amoenum petals: the color difference and the bioactive compounds as loss of total antioxidant capacity, loss of total phenolic content, loss of total flavonoids content, anthocyanin loss and energy consumption for fluidized drying. The study focuses on multi-objective optimization (MOO) of the process variables. The goal in an MOO problem is to optimize the several objective functions simultaneously and thus finding the best parameters for E. amoenum petals drying process.
2. Materials and Methods
2.1. Material
Fresh E. amoenum petals were harvested in Afratape village, Golestan Province, Iran. The samples were collected every day and were kept in the refrigerator at 4 ± 0.5 °C before the beginning of the tests. The initial moisture content of the freshly harvested E. amoenum petals was about 8.67–10.29 d.b. and was reduced to the final moisture content about 0.058–0.041 d.b. at the end of the drying process for the safe storage.
2.2. Drying Process
To conduct experiments, a pilot-scale FBD was constructed in the Department of Agricultural Machinery Mechanics of Azadshahr University. FBD consists of three electric heaters, each of 800 W for heating air, a 1.5 kW fan for circulating air, a drying chamber with dimensions of 0.3 × 0.3 × 0.9 m and a switchboard to control and regulate drying temperature (with accuracy ±0.1 °C) and air velocity (with accuracy ±0.1 m/s). The relative humidity of the drying air was about 35%. The size of its gas distribution chamber is approximately 0.25 × 0.25 × 0.3 m, made with a stainless-steel plate of 1 mm thickness. A perforated distributor plate, with a thickness of 1 mm and holes of 3 mm in diameter, was firmly fixed to the bottom of the chamber.
At the beginning of each experiment, the air temperature and velocity were fixed when there was no sample in the FBD. To stabilize the drying conditions, the dryer was operated with no sample in the chamber for 30 min. The loading density of fresh E. amoenum petals was 1.4 kg/m2. More details of the device and the testing method can be found in previous research studies [40].
2.3. Quality Parameters
2.3.1. Color Measurement
Color preserving is crucial when processing food and herbs. Indeed, the first quality feature that a consumer notices when deciding to buy is product color. The machine vision was used to capture fresh and dried E. amoenum petals. The visual system consists of a black wooden box with dimensions of 50 × 50 × 50 cm, four fluorescent lamps of 18 W located on the wall of the box at 45° for illumination, and a Sony Cyber-shot DSC-W370 digital camera with 14 Mpx of the resolution, which was placed vertically at a distance of 22.5 cm from the samples. Digital images were processed by MATLAB software in Lab color model to evaluate color changes. The color difference (CD) was calculated based on the following optimized formula by the CIE committee
where ΔL, ΔC, ΔH are the differences in brightness, chroma, and hue angle of the dried sample from the reference (fresh) sample, respectively, KL, KC, KH are the parameter factors that describe the effect of the change from reference conditions (for reference conditions, they are all in 1), and SL, SC, SH are the weighting functions (SL = 1, SC = 1 + 0.045C, and SH = 1 = 0.015C).
2.3.2. Phytochemical Properties Measurement
Extract Preparation
Rufino et al. [41] procedure was used to prepare the extract. The dried sample was ground and passed through a sieve (40-mesh). A total of 2 g of sample powder was added to 4 mL of 50% ethanol v/v). The mixture was mixed to homogenize it and was then was kept at room temperature. After 1 h, the supernatant was transferred to a volumetric flask. A total of 4 mL of 70% acetone was added to the rest of the extract and homogenized using a mixer and kept at room temperature for 1 h. the obtained supernatant was transferred to the same flask containing the first supernatant and the solution volume was brought to 100 mL by distilled water and mixed well. Extraction was performed in triplicate for each treatment.
Determination of Antioxidant Activity by DPPH Method
To assess the antioxidant potential by DPPH free radical scavenging, changes in (DPHH) absorbance are examined. 1, 1-diphenyl-2-picrylhydrazyl (DPPH) is a stable free radical that can accept an electron or hydrogen molecule and become a neutral and stable molecule. DPPH has a strong absorption at a wavelength of 517 nm due to its odd electron; at this stage, the methanolic solution of DPPH is a deep purple color. In the presence of antioxidants, the odd electron can become an electron pair. Regarding the number of electrons received, absorption is reduced. At this stage, the color of the solution turns yellow/colorless. Using this absorption change, the ability of different compounds for free radical scavenging can be measured. The amount of change in the absorption of each sample depends on the ability of the radical adsorbent.
To determine the antioxidant activity, 1 mL of DPPH methanol solution (1 mM), was mixed with 3 mL of sample extract. The mixtures were maintained in a dark place at room temperature; after 30 min, the absorbance was read at 517 nm. The experiment was repeated three times for each sample solution. Antioxidant activity was calculated as the inhibition percentage was calculated by
where Asample is the absorbance of DPPH with the extracts and Acontrol is the absorbance of DPPH without the extracts.
Measurement of Total Phenolic Content (TPC)
The total phenol content (TPC) was determined using Folin-Ciocalteu assay by a UV/Vis spectrophotometer. A total of 10 mg m/L of the extract was mixed with 1 mL of Folin-Ciocalteu’s reagent, and after 3 min, 0.8 mL of Na2CO3 (2%) was added, and then the volume was increased to 10 mL with water/methanol (4:6). After 30 min, the absorbance of the samples was measured at 740 nm. Tannic acid (0–800 mg/L) was used as the standard calibration curve, the TPC was reported to mg of tannic acid equivalent per gram of extract. The experiments were repeated in triplicate and their mean was reported.
Measurement Anthocyanin Content (A)
For determination of anthocyanins content (A), 0.1 g of the sample was soaked in 10 mL of acidified methanol (methanol/HCl = 99:1, v/v). The extract was maintained for 24 h in the dark at 25 °C. The extract was then centrifuged at 5000 rpm for 5 min. Absorption of the supernatant was measured at 550 nm.
Evaluation of Total Flavonoid Content (TFC)
The Dowd method, modified by Arvouet-Grand et al. [42], was used to measure the total amount of flavonoids. Briefly, in this method, 5 mL of 2% AlCl3 in methanol was mixed with the same volume of aqueous extract. After 10 min, the absorbance of the extract solution and the blank solution (containing 5 mL of the extract with 5 mL of ethanol without AlCl3 was read at 415 nm. Then, the total flavonoid content was determined using the quercetin standard curve (0–100 mgL) and was expressed as mg of quercetin equivalent per gram of dry mass of petals.
Losses of phytochemical properties of E. amoenum petals were calculated as the percentage difference between the mentioned contents for dried (d) and fresh (f) materials according to the following formulas
2.4. Energy Consumption
The total energy consumption (EC) required for drying per kilogram of dried petals consists mainly of the thermal energy (Eth) needed to remove water from the crops, and the mechanical energy (Emec) needed for the conveyance or airflow, which was calculated by [43]
where Acsa is the cross-section area (m2), va is the dryer air velocity (m/s), ρa is the air density (kg/m3), Ca is the air specific heat capacity (kJ/(kg·K)), ΔT is the temperature difference (°C), t is the drying time (s).
The mechanical energy used for conveyance or airflow by a fan was calculated by [44]
where ΔP is the pressure drop of the crop (Pa).
2.5. Objective Functions
Objective functions used by MOOGA algorithm represent relationships between Td, vd (process variables; drying air temperature: 40, 50, and 60 °C, air flow velocity: 0.5, 0.75, and 1.0 m/s) and energy consumption (EC) for the drying process and quality characteristics of the dried material obtained (CD, Aloss, TACloss, TFCloss, TPCloss). Details about the used data are presented in Table 1.
The relations were approximated using ANN which topology is shown in Figure 1 (three-layer NN). The ANN task was to map input variables: Td and vd on to six outputs (CD, Aloss, TACloss, TFCloss, TPCloss) to obtain high correlation coefficient (R) and the lowest Mean Squared Error (MSE). The inputs and outputs of ANN were normalized (divide by maximum values, respectively) to obtain the range 0–1.
The actual values of the input variables were chosen randomly from a fixed set of data in each case. For this set of data, three levels of drying air temperature and three levels of air flow velocity were used (see Table 2). Seventy-three repetitions were performed for each level (3·Td·3·vd). A total of 657 different results was obtained.
Chosen cases (657 cases from the experiments) were randomly divided into the following sets: 98 samples (15%), 461 samples (70%) for testing, and 98 samples (15%) for validation sets. The network used the default Lavenberg–Marquardt (L-M) algorithm for the training procedure. L-M locates the local minimum of a multivariate function, expressed as the sums of squares of several of non-linear, real-valued functions as demonstrated in paper [45]. In this study, the maximum number of epochs to train, the initial momentum and mu increase factor term were: 100, 0.4 and 10, respectively. The minimum value of MSE was always reached well within that number. The training process was repeated several times in order to obtain the best performance of ANN. All trials were implemented in MATLAB Neural Networks Toolbox R2018a. Moreover, the optimal experiment that minimizes the number of ANN models trained and validated and maximized the model accuracy has been done. The architecture of ANN parameters such as the number of neurons in the hidden layer, activate function in hidden and output layers and statistical values MSE and R were estimated in Table 3.
It can be seen from Table 3, the lowest MSE = 0.000292 and high R-value = 0.9922 for Item 3 was obtained.
2.6. Multi-Objective Optimization Problem
The MOO task consisted in the determination of the set of optimal conditions of the drying process. All the functions were minimalized (EC, CD, Aloss, TACloss, TFCloss, TPCloss) subject to constraints on the process variables (drying parameters: Td, vd). Equation (9) presents the mentioned MOO problem.
The Pareto front for this multiobjective optimization problem was generated using a nondominated sorting genetic algorithm (NSGA II). The algorithm was implemented in MATLAB Global Optimization Toolbox R2018a. Subsequent steps of this algorithm are presented, i.e., in [46]. The genetic algorithm parameters are shown in Table 4.
3. Results and Discussion
3.1. Data
The statistics of the used data are presented in Table 1.
3.2. Objective Functions
To approximate functional relations between air drying temperature, drying air velocity (Td and vd) and energy consumption drying and quality parameters (CD, Aloss, TACloss, TFCloss, TPCloss) of dried E. amoenum petals, different ANN structures (with various transfer functions) were tested. Considering the lowest MSE, the best result (MSE = 0.00029) was obtained for the ANN structure which consisted of eight nodes in the hidden layer (see Figure 1, Table 2).
The hidden and output layers of the best ANN structure processed data with a log-sigmoid transfer function both in output and hidden layers, respectively, as demonstrated in Figure 1 (see Table 3, Item 3). The ANN training phase was stopped at the 21st iteration as shown in Figure 2. It can be seen that test set error and validation error have similar characteristics. The following final MSE values were obtained: 0.00075, 0.00029, 0.0021 for training, validation and test sets, respectively. Therefore, the final mean-square error is small. Linear regression between the network outputs and the corresponding targets is shown in Figure 3. The following R: 0.9933, 0.9974, and 0.9818 for training, validation and test sets, respectively, indicated that data from the ANN were in agreement with the experimental data. Finally, the R-value is over 0.99 for the total response (see Figure 3).
The ANN training phase was stopped at the 21st iteration (Figure 2). The following final MSE values were obtained: 0.00075, 0.00029, 0.0021 for training, validation and test sets, respectively. The R of 0.9933, 0.9974, and 0.9818 for training, validation and test sets, respectively, indicated that data from the ANN were in agreement with the experimental data (Figure 3). The hidden and output layers of the best ANN structure processed data with a log-sigmoid transfer function (Figure 1).
The energy consumption for drying process was determined with the following formula (from ANN, taking into account multiplication by ECmax)
whereas quality parameters of dried petals from formulas (from ANN, taking into account multiplication by the appropriate quality parameters maximum values)
where F(i=1÷8) from
Equations (10)–(15) (respected normalization) were used for algorithm (Equation (9)).
The validation of the model (ANN) using the validation set and, additionally, all data, to demonstrate the reliability of predicted values was conducted. The R for validation and all data was 0.9974 and 0.9922 (Figure 3), whereas mean square errors (MSE) were 0.00026 and 0.00029, respectively. This confirms the accuracy and consistency of the proposed model.
3.3. Multi-Objective Optimization
The MOO problem formulated in Equation (9) was solved with the genetic algorithm using the initial population size of 40. Table 3 shows the controlled parameters of NSGA II. The optimization problem converged to the Pareto optimum set after 146 genetic algorithm generations. In the study, the probability of mutation and crossover and were 0.15 and 0.85, respectively. One hundred and eighty design points formed Pareto set given in Table A1. Figure A1 presents the impact of Td and va on EC, CD, and quality parameters (Aloss, TACloss, TFCloss, TPCloss) of the Echium amoenum petals (data from Table A1).
Figure 4 shows the Pareto fronts for EC and CD, Aloss, TACloss, TFCloss, TPCloss, respectively.
The smallest values of EC were obtained for ID134, ID132, and ID131 (278.3, 288.8, and 295.5 MJ/kg, respectively). It corresponds to the following drying parameters: Td = 60.00 °C and vd = 0.50 m/s, Td = 59.84 °C and vd = 0.50 m/s, Td = 59.77 °C and vd = 0.50 m/s, respectively. However, due to the very small differences between the individual values of drying parameters obtained and the lack of such precise settings, it can be assumed that the best parameters due to energy savings are the following: Td = 60 °C and vd = 0.5 m/s. Assuming that the temperature and velocity of the drying air can be set (in the dryer) with an accuracy of 0.5 °C and 0.02 m/s, drying at Td = 60.0 ± 0.5 °C and vd = 0.5 ± 0.02 m/s allows for obtaining Echium amoenum petals with the following parameters: TACloss, TFCloss, Aloss, TPCloss, CD, EC: 45.5%, 28.0%, 47.3%, 29.8%, 36.7, and 328.8 MJ/kg, respectively (average values for mentioned ranges of Td and vd).
However, additionally taking into account the quality parameters of the obtained dried material, it should be noted that these solutions (as mentioned above, for ECmin-ID134, ID132, and ID131) CD are 36.16, 36.65 and 36.87, respectively, and they are very different from CDmin = 19 (1.90, 1.93, and 1.94 times higher, respectively). Thus, the dried petals obtained at low-energy expenditure (long drying time) are characterized by significant petal color changes (large CD) (see Figure 4b). Pareto front (Figure 4b) indicates the following solutions: ID70, ID75 and ID84, for which EC is 835.6, 804.8, and 766.4 MJ/kg, respectively, and CD are 30.7, 31.6, and 31.8, respectively. These solutions are obtained for the following drying process parameters: air drying temperature 44.47, 45.42, and 45.41 °C, and air-drying velocity 0.50, 0.51, and 0.50 m/s. However, due to the very small differences between each value of Td and vd obtained and the inability to set these parameters so precisely (adjustment by 0.02 °C and 0.01 m/s), it can be assumed that the best parameters due to the simultaneous energy-saving and color preservation are the following: Td = 45.5 °C and vd = 0.5 m/s. However, for these solutions, EC, CD, Aloss, TACloss, TFCloss, TPCloss are respectively about 2.9, 1.7, 1.7, 2.2, 8.6, and 2.5 times higher than their minimum values. CD was always conflicting with other quality parameters (see Figure 4b). Assuming that the temperature and velocity of the drying air can be set (in the dryer) with an accuracy of 0.5 °C and 0.02 m/s, drying at Td = 45.5 ± 0.5 °C and vd = 0.5 ± 0.02 m/s allows for obtaining Echium amoenum petals with the following parameters: TACloss, TFCloss, Aloss, TPCloss, CD, EC: 36.6%, 43.3%, 60.0%, 47.9%, 33.6, and 702.3 MJ/kg, respectively (average values for mentioned ranges of Td and vd).
Dried petals with low A, TAC, TFC and TPC losses also cannot be obtained with the least energy expenditure. For the obtained solutions (for ECmin), Aloss, TACloss, TFCloss and TPCloss are as follows: for ID134: 45.7%, 49.4%, 27.5%, 30.8%, for ID132: 46.6%, 48.9%, 27.1%, 32.2%, and for ID131: 47.1%, 48.5%, 26.9%, 32.7%, respectively. Therefore, these values are about 1.2, 3.1, 4.0, and 1.5 times higher than the lowest values, respectively, whereas for Aloss min, TACloss min, TFCloss min, and TPCloss min, the energy consumption is 434.8 (ID92: Td = 53.94 °C, vd = 1.00 m/s), 1344.3 (ID1: Td = 40.00 °C, vd = 0.60 m/s), 666.3 (ID 26: Td = 50.59 °C, vd = 1.00 m/s) and 507.5 MJ/kg (ID62: Td = 60.00 °C, vd = 0.58 m/s), respectively.
For TACloss Pareto front (Figure 4a) indicates solutions ID54, ID55 and ID69, for which EC is 526.0, 520.2, and 456.2 MJ/kg, while TACloss is 31.9, 32.0, and 33.2%, respectively. These solutions are obtained for the following drying process parameters: air drying temperature 59.94, 60.00, and 53.35 °C, and air-drying velocity 0.65, 0.61, and 1.00 m/s. However, for these solutions, EC is 1.9, 1.9, and 1.6, CD 2.0, Aloss is 1.3, 1.3, and 1.0, TACloss is 4.5, 4.6, and 2.1, TFCloss is 4.6, 4.6, and 1.26, and TPCloss 1.1, 1.0, and 1.8 times higher than their minimum values. Therefore, ID69 is better than ID54 and ID55 from the EC, Aloss, TACloss, and TFCloss point of view. Assuming the mentioned accuracy of Td and vd setting, drying at Td = 53.5 ± 0.5 °C and vd = 1.0 ± 0.02 m/s (parameters from ID 69) allows for obtaining Echium amoenum petals with the following parameters: TACloss, TFCloss, Aloss, TPCloss, CD, EC: 35.0%, 9.0%, 39.1%, 37.7%, 38.3, and 445.5 MJ/kg, respectively (average values for mentioned ranges of Td and vd).
For Aloss Pareto front (Figure 4d), solutions are indicated for ID134 and ID116, for which EC is 278.2, and 410.3 MJ/kg, while Aloss is 45.7 and 39.6%, respectively. These solutions are obtained for the following drying process parameters: air drying temperature 60.00 and 55.12 °C, and air-drying velocity 0.50 and 1.00 m/s. However, for these solutions, EC is 1.0 and 1.5, CD is 1.9 and 2.0, Aloss is 1.2 and 1.0, TACloss is 3.2 and 2.8, TFCloss is 4.0 and 1.7, and TPCloss is 1.5 and 1.7 times higher than their minimum values. Therefore, ID116 is better than ID134 from the TFCloss point of view. Assuming the mentioned accuracy of Td and vd setting, drying at Td = 55.0 ± 0.5 °C and vd = 1.0 ± 0.02 m/s (parameters from ID 134) allows for obtaining Echium amoenum petals with the following parameters: TACloss, TFCloss, Aloss, TPCloss, CD, EC: 35.8%, 10.2%, 42.1%, 40.4%, 38.1, and 499.4 MJ/kg, respectively (average values for mentioned ranges of Td and vd).
For TFCloss Pareto front (Figure 4c) solutions for ID69 (TFCloss = 8.6% and EC = 456.2), ID 92 (TFCloss = 9.4% and EC = 434.8), ID109 (TFCloss = 10.3% and EC = 420.2 MJ/kg), and ID116 (TFC = 11.3% and EC = 410.3 MJ/kg) are indicated. These solutions are obtained for the following drying process parameters: air drying temperature 53.35, 53.94, 54.51 and 55.12 °C, and air-drying velocity 1.00 m/s. However, for these solutions, EC is 1.6, 1.6, 1.5 and 1.5, CD is 2.0, Aloss is 1.0, TACloss is 2.1, 2.4, 2.6 and 2.8, TFCloss is 1.3, 1.4, 1.5 and 1.7, and TPCloss is 1.8, 1.8, 1.7 and 1.7 times higher than its minimum values. Assuming the mentioned accuracy of Td and vd setting, drying at Td = 53.5 ± 0.5 °C and vd = 1.0 ± 0.02 m/s (parameters from IDs: 69, 109—those are better from the TACloss and TFCloss point of view) allows for obtaining Echium amoenum petals with the following parameters: TACloss, TFCloss, Aloss, TPCloss, CD, EC: 35.0%, 9.0%, 39.1%, 39.1%, 38.3, and 445.5 MJ/kg, respectively (average values for mentioned ranges of Td and vd).
For TPCloss Pareto front (Figure 4e) indicates solutions ID94 (TPCloss = 25.2% and EC = 445.5 MJ/kg), ID107 (TPCloss = 26.0% and EC = 410.1 MJ/kg), ID 117 (TPCloss = 27.0% and EC = 348.6 MJ/kg) and ID113 (TPCloss = 27.6% and EC = 364.9 MJ/kg). These solutions are obtained for the following drying process parameters: air-drying temperature 59.76, 59.82, 59.98 and 59.86°C, and air-drying velocity 0.54, 0.53, 0.51 and 0.52 m/s, respectively. However, for these solutions, EC is 1.6, 1.5, 1.3 and 1.3, CD is 2.0, 2.0, 1.9 and 1.9, Aloss is 1.3, 1.3, 1.2 and 1.2, TACloss is 2.4, 2.5, 2.8 and 2.7, TFCloss is 4.4, 4.3, 4.2 and 4.2, and TPCloss is 1.2, 1.2, 1.3 and 1.3 times higher than their minimum values. Due to the very small differences between the individual values of drying parameters obtained and the lack of such precise settings, it can be assumed that the best parameters due to energy savings are following: Td = 60.0 °C and vd = 0.52 m/s. Assuming the mentioned accuracy of Td and vd setting, drying at Td = 60.0 ± 0.5 °C and vd = 0.52 ± 0.02 m/s can obtain Echium amoenum petals with the following parameters: TACloss, TFCloss, Aloss, TPCloss, CD, EC: 44.0%, 28.3%, 47.7.1%, 29.0%, 36.8, and 349.1 MJ/kg, respectively (average values for mentioned ranges of Td and vd).
It can be stated that there is no unequivocal solution to the optimization problem written by Equation (9). The solutions relate to the Echium amoenum petals drying parameters at which the lowest values of individual quality parameters, EC or CD, sometimes groups of the parameters were obtained. However, CD was always conflicting with other quality parameters (see Figure 4b), so this parameter was omitted in further considerations.
Figure 6 shows the four solutions for the optimization task. The ID92 is characterized by EC = 434.8 MJ/kg (1.6 times higher than ECmin), whereas Aloss = 39.0 (the lowest of all obtained optimization solutions), TACloss = 36.8% (2.4 times higher than TACloss min), TFCloss = 9.4% (1.4 times higher than TFCloss min), and TPCloss is 37.0% (1.4 times higher than TPCloss min) (CD = 38.3—2.2 times higher than CDmin). The parameters of the drying process for ID92 are the following: Td = 53.94 °C and vd = 1.00 m/s. The ID109 solution differs only in value of Td (Td is 0.57 °C higher than for ID92 and amounts to 54.51 °C (vd = 1.00 m/s). For this solution, EC is a little lower (420 MJ/kg), but TACloss is higher (40.1%).
The next ID107 solution (EC = 410.1 MJ/kg) is characterized by the lowest of the four solutions TPCloss = 26.0% (1.2 times higher than TPCloss min). For this solution, TACloss is higher than for the previously mentioned ID92 and lower than ID109 (TACloss = 39.2%-2.5 times higher than TACloss min), but TFCloss and Aloss are already much bigger: TFCloss = 29.6% (4.3 times higher than TFCloss min), and Aloss = 48.7% (1.3 times higher than Aloss min), CD is high and amount 37%. The parameters of the drying process for ID107 are the following: Td = 59.82 °C and vd = 0.53 m/s. A similar solution is ID111 for which EC, TFCloss, Aloss are lower and amount to 381.3 MJ/kg, 29.1%, 48.12%, while TACloss and TPCloss are larger (41.2% and 27.0%, respectively); CD is high: 36.9%. The parameters of the drying process for ID111 are very similar to ID107 and amount: Td = 59.85 °C and vd = 0.52 m/s. For this solution, EC is little lower (381.3 MJ/kg), but TACloss and TPCloss are higher (41.2 and 27.0%, respectively).
Figure 6 shows Pareto fronts for EC and, simultaneously, Aloss, TACloss, TFCloss, and TPCloss.
Considering the maximum values of TACloss max = 80.5%, TFCloss max = 70.9%, Aloss max = 76.9%, and TPCloss max = 60.6%, it can be assumed that for the four indicated solutions, the losses do not differ significantly and are much smaller than the mentioned maximum losses.
However, where the quality of the dried product directly affects the price (poor-quality product is worthless), the drying process should be carried out with the acceptable (not always the lowest) energy expenditure. For the strategy in which, apart from EC minimization, the lower losses of TAC, TFC and A are most important, while accepting quite high TPCloss and high CD, the drying parameters of E. amoenum petals are the following: Td = 54.0 °C and vd = 1.0 m/s. Assuming the mentioned accuracy of Td and vd setting, drying at Td = 54.0 ± 0.5 °C and vd = 1.0 ± 0.02 m/s can obtain Echium amoenum petals with the following parameters: TACloss, TFCloss, Aloss, TPCloss, CD, EC: 36.8%, 9.4%, 39.0%, 38.3%, 37.1, and 434.9 MJ/kg, respectively (average values for mentioned ranges of Td and vd). However, when apart from EC minimization, low losses of TPC and TFC are important; with losses of TAC and CD similar to those mentioned previously, the drying parameters of E. amoenum petals are the following: Td = 59.8 °C and vd = 0.53 m/s. Assuming the mentioned accuracy of Td and vd setting, drying at Td = 60.0 ± 0.5 °C and vd = 0.52 ± 0.02 m/s can obtain Echium amoenum petals with the following parameters: TACloss, TFCloss, Aloss, TPCloss, CD, EC: 44.0%, 28.3%, 47.7%, 29.0%, 36.8, and 349.1 MJ/kg, respectively (average values for mentioned ranges of Td and vd).
Jafarian et al. [47] optimized a counter-flow indirect dew-point evaporative cooler precise model. In an MOO task, the NSGA II is often used. NSGA II has commonly been used to understand a wide range of problems such as a heating, cooling, and power system integrated with biomass gasification [48,49], waste heat recovery systems [50] and organic Rankine cycle [51]. Moreover, the NSGA II algorithm was widely used in the food industry for the determination of Biot mass number [52] and the mass diffusion coefficient [53] in the drying process. Winiczenko et al. [54,55] successfully applied the algorithm to the rehydration process.
4. Conclusions
The effect of Td (40–60 °C) and vd (0.5–1 m/s) in fluidized drying on the energy consumption and the quality parameters (TACloss, TPCloss, TFCloss and Aloss) of E. amoenum petals was studied. A novel multi-objective optimization (MOO) algorithm, based on Pareto optimization, genetic algorithm (GA) and artificial neural network (ANN), was developed. The following optimization objectives of Aloss, CD, EC, TACloss, TFCloss and TPCloss were used for its simultaneous minimization. The objective functions were developed by using ANN. The Pareto optimal set was developed with the non-dominated sorting genetic algorithm II.
It can be stated that there is no unequivocal solution to the optimization problem. The quality of dried E. amoenum petals directly affects the price of the dried flakes (and poor-quality product is worthless). Therefore, the drying process does not have to be carried out with the lowest energy consumed, but only with the low possible energy expenditure.
Cannot be obtained E. amoenum petals characterized a low color change at low energy expenditure for fluidized drying.
The smallest value of energy consumption (EC = 278.3 MJ/kg) was obtained for the following drying parameters: Td = 60.0 °C and vd = 0.50 m/s.
The following solutions were obtained considering the simultaneous minimization of EC and loss of: A (and low TFCloss) Td = 55.0 °C, vd = 1.0 m/s, TAC and TFC Td = 53.4 °C, vd = 1.0 m/s, TPC Td = 60.0 °C, vd = 0.52 m/s, CD Td = 45.5 °C, vd = 0.5 m/s.
A unique Pareto optimal solution was found at Td = 54 °C and vd = 1.0 m/s—for the strategy in which the lower losses of TAC, TFC and A are most important at the accepted EC value, resulting in 36.8%, 9.4%, 39.0%, 434.9 MJ/kg, 37.1%, 38.3 for TACloss, TFCloss, Aloss, EC, TPCloss, and CD, respectively.
The next unique Pareto optimal solution was found at Td = 59.8 °C and vd = 0.52 m/s—for the strategy in which, the lower losses of TPC and TFC are important at accepted EC values, resulting in 44.0%, 28.3%, 47.7%, 349.1 MJ/kg, 29.0%, 36.8 for TACloss, TFCloss, Aloss, EC, TPCloss, and CD respectively.
The results of this research are essential for the improvement in the industrial dehydration of E. amoenum petals to maintain their high content of bioactive compounds with low energy consumption and low colour change.
Author Contributions
Conceptualization, F.N. and K.G.; methodology, F.N., K.G. and R.W.; software and validation, K.G. and R.W.; formal analysis and investigation, F.N., K.G. and R.W.; resources, F.N.; writing—original draft preparation, F.N., K.G. and R.W.; writing—review and editing, K.G.; visualization, K.G.; supervision, K.G. and R.W. All authors have read and agreed to the published version of the manuscript.
Funding
This research received no external funding.
Conflicts of Interest
The authors declare no conflict of interest.
Appendix A

Table A1.
Pareto optimal set.
| ID | Td (°C) | vd (m/s) | TACloss (%) | TFCloss (%) | Aloss (%) | EC (MJ/kg) | TPCloss (%) | CD (-) |
|---|---|---|---|---|---|---|---|---|
| 1 | 40.000 | 0.6028 | 15.5858 | 70.8745 | 68.7699 | 1344.28 | 46.1350 | 21.0011 |
| 2 | 40.000 | 0.6001 | 15.6012 | 70.8748 | 68.8430 | 1343.89 | 46.2663 | 20.6208 |
| 3 | 40.134 | 0.6064 | 15.7583 | 70.8605 | 68.5418 | 1342.17 | 45.9180 | 22.0248 |
| 4 | 40.221 | 0.5851 | 16.1691 | 70.8504 | 69.1502 | 1335.38 | 47.1364 | 19.5874 |
| 5 | 40.000 | 0.5788 | 16.5041 | 70.8493 | 69.8209 | 1330.07 | 48.2291 | 19.0219 |
| 6 | 40.888 | 0.6071 | 17.1377 | 70.7215 | 67.5978 | 1321.18 | 45.5829 | 25.4078 |
| 7 | 40.859 | 0.5708 | 17.3711 | 70.7689 | 69.0575 | 1316.73 | 47.7881 | 20.0681 |
| 8 | 40.964 | 0.5633 | 18.0330 | 70.7329 | 69.4783 | 1304.84 | 48.6995 | 20.1816 |
| 9 | 40.802 | 0.5564 | 18.8029 | 70.7086 | 70.4593 | 1288.28 | 50.3152 | 20.5535 |
| 10 | 41.721 | 0.5531 | 19.5171 | 70.5514 | 68.9342 | 1276.96 | 48.8205 | 21.4891 |
| 11 | 42.091 | 0.5887 | 19.6477 | 70.2024 | 66.0556 | 1272.02 | 45.2829 | 27.6331 |
| 12 | 40.577 | 0.5463 | 20.5847 | 70.6162 | 72.0233 | 1241.84 | 52.9722 | 22.5080 |
| 13 | 40.553 | 0.5438 | 21.1197 | 70.5796 | 72.3701 | 1225.79 | 53.5775 | 23.1716 |
| 14 | 42.144 | 0.5423 | 21.1422 | 70.3358 | 69.1900 | 1239.82 | 49.9232 | 22.6491 |
| 15 | 41.589 | 0.5386 | 21.4824 | 70.4404 | 70.9708 | 1224.87 | 52.1253 | 22.9470 |
| 16 | 42.807 | 0.5490 | 21.6218 | 69.9080 | 66.7102 | 1230.98 | 47.2828 | 24.2905 |
| 17 | 41.660 | 0.5344 | 22.2704 | 70.3605 | 71.3702 | 1201.61 | 52.8887 | 23.7347 |
| 18 | 43.173 | 0.5614 | 22.3986 | 69.1387 | 64.7806 | 1206.82 | 45.4343 | 27.6069 |
| 19 | 43.297 | 0.5570 | 22.7985 | 68.9722 | 64.7386 | 1196.69 | 45.6191 | 27.4233 |
| 20 | 42.452 | 0.5300 | 23.3083 | 70.0258 | 70.0803 | 1179.22 | 51.8709 | 24.3546 |
| 21 | 40.615 | 0.5330 | 23.5134 | 70.3661 | 73.5354 | 1143.12 | 55.6526 | 26.0738 |
| 22 | 43.252 | 0.5359 | 23.7092 | 69.3147 | 66.9747 | 1175.00 | 48.6325 | 25.2399 |
| 23 | 41.406 | 0.5278 | 23.8769 | 70.2442 | 72.7607 | 1142.02 | 54.9546 | 25.7457 |
| 24 | 41.162 | 0.5278 | 24.1238 | 70.2500 | 73.2173 | 1128.20 | 55.5052 | 26.2727 |
| 25 | 42.813 | 0.5269 | 24.2144 | 69.7217 | 69.5615 | 1154.61 | 51.6737 | 25.0430 |
| 26 | 50.591 | 0.9999 | 24.5102 | 6.84569 | 41.9597 | 666.275 | 44.9053 | 37.4724 |
| 27 | 40.481 | 0.5273 | 25.2813 | 70.1761 | 74.3836 | 1066.89 | 56.9869 | 28.2821 |
| 28 | 41.649 | 0.5214 | 25.3363 | 70.0328 | 73.1127 | 1089.76 | 55.7523 | 27.1048 |
| 29 | 40.268 | 0.5260 | 26.0489 | 70.0881 | 74.8092 | 1027.36 | 57.5725 | 29.3358 |
| 30 | 41.493 | 0.5181 | 26.4113 | 69.9193 | 73.8011 | 1040.44 | 56.7117 | 28.4200 |
| 31 | 49.749 | 0.9860 | 26.7558 | 7.12927 | 41.9010 | 675.647 | 44.4061 | 37.4590 |
| 32 | 43.919 | 0.5239 | 26.8407 | 67.6590 | 66.5582 | 1076.45 | 49.6296 | 27.2909 |
| 33 | 42.630 | 0.5144 | 26.9370 | 69.4720 | 71.9537 | 1049.71 | 55.0790 | 27.5885 |
| 34 | 43.245 | 0.5159 | 27.0288 | 68.9459 | 70.0725 | 1060.92 | 53.2611 | 27.1378 |
| 35 | 43.111 | 0.5139 | 27.3586 | 69.0393 | 70.7779 | 1045.18 | 54.0670 | 27.4946 |
| 36 | 44.638 | 0.5436 | 27.7207 | 62.7990 | 61.9428 | 1028.16 | 45.1789 | 31.3429 |
| 37 | 44.323 | 0.5234 | 28.0671 | 65.9500 | 65.2116 | 1033.29 | 48.8051 | 28.4362 |
| 38 | 44.078 | 0.5172 | 28.3639 | 66.9800 | 67.1126 | 1023.14 | 50.8391 | 28.0583 |
| 39 | 44.401 | 0.5220 | 28.4895 | 65.5307 | 65.1426 | 1018.22 | 48.9286 | 28.6694 |
| 40 | 41.243 | 0.5114 | 28.8391 | 69.5810 | 74.9239 | 920.616 | 58.2657 | 31.0604 |
| 41 | 45.028 | 0.5403 | 29.2165 | 59.2599 | 61.0678 | 967.715 | 45.0479 | 32.3714 |
| 42 | 44.913 | 0.5284 | 29.4566 | 61.5194 | 62.4430 | 973.776 | 46.6515 | 30.6108 |
| 43 | 40.556 | 0.5124 | 29.6740 | 69.4811 | 75.6816 | 855.236 | 59.0421 | 32.5339 |
| 44 | 45.149 | 0.5341 | 29.8902 | 58.5777 | 61.1454 | 946.937 | 45.5170 | 32.0171 |
| 45 | 44.473 | 0.5140 | 30.0455 | 65.0186 | 66.2225 | 962.562 | 50.6645 | 29.1488 |
| 46 | 45.284 | 0.5661 | 30.3912 | 51.2274 | 60.0866 | 875.445 | 44.3100 | 36.7234 |
| 47 | 44.722 | 0.5161 | 30.4066 | 63.4119 | 64.9155 | 948.113 | 49.5622 | 29.6542 |
| 48 | 44.760 | 0.5154 | 30.6353 | 63.1196 | 64.8806 | 939.589 | 49.6288 | 29.7694 |
| 49 | 43.769 | 0.5045 | 30.8322 | 67.3715 | 70.4261 | 921.979 | 54.8267 | 29.5713 |
| 50 | 40.793 | 0.5062 | 31.3291 | 69.1400 | 75.9172 | 781.205 | 59.4893 | 33.5674 |
| 51 | 45.604 | 0.5688 | 31.4580 | 46.2762 | 59.6851 | 817.464 | 44.3646 | 37.6547 |
| 52 | 45.782 | 0.5644 | 31.8243 | 44.9343 | 59.3789 | 804.178 | 44.2784 | 37.5585 |
| 53 | 44.838 | 0.5104 | 31.8570 | 62.3900 | 65.4709 | 894.793 | 50.7025 | 30.1863 |
| 54 | 59.941 | 0.6518 | 31.9310 | 31.0738 | 50.8695 | 526.021 | 22.7013 | 37.6509 |
| 55 | 60.000 | 0.6115 | 31.9469 | 31.6509 | 50.0663 | 520.214 | 21.2203 | 37.2300 |
| 56 | 45.782 | 0.5331 | 32.0650 | 50.4278 | 59.4735 | 848.728 | 44.9372 | 33.9206 |
| 57 | 43.700 | 0.5000 | 32.1938 | 67.2148 | 71.4045 | 864.085 | 56.0519 | 30.5423 |
| 58 | 45.087 | 0.5122 | 32.2700 | 60.1736 | 64.1653 | 877.199 | 49.6670 | 30.6848 |
| 59 | 45.960 | 0.5401 | 32.3050 | 47.0179 | 58.8761 | 822.488 | 44.3654 | 35.2275 |
| 60 | 46.010 | 0.5425 | 32.3841 | 45.9620 | 58.7633 | 813.481 | 44.2534 | 35.6436 |
| 61 | 45.922 | 0.5330 | 32.5086 | 48.4669 | 59.1390 | 827.981 | 44.8301 | 34.2934 |
| 62 | 59.999 | 0.5821 | 32.5624 | 31.7383 | 49.5725 | 507.509 | 20.9404 | 37.0085 |
| 63 | 40.251 | 0.5055 | 32.5827 | 68.8473 | 76.4657 | 697.505 | 60.0583 | 34.9319 |
| 64 | 45.524 | 0.5186 | 32.6326 | 55.0583 | 61.5357 | 852.724 | 47.3451 | 31.9131 |
| 65 | 40.765 | 0.5023 | 32.7415 | 68.8262 | 76.2224 | 711.395 | 59.9114 | 34.5437 |
| 66 | 59.680 | 0.5939 | 32.8222 | 30.4087 | 51.2409 | 515.148 | 24.3646 | 37.8991 |
| 67 | 45.759 | 0.5218 | 32.9667 | 51.7326 | 60.3665 | 831.444 | 46.3713 | 32.7629 |
| 68 | 46.290 | 0.5402 | 33.2192 | 42.5454 | 58.2868 | 776.855 | 44.2263 | 36.0174 |
| 69 | 53.349 | 1.0000 | 33.2257 | 8.60094 | 39.1274 | 456.219 | 38.4671 | 38.1894 |
| 70 | 44.469 | 0.5009 | 33.3552 | 64.3361 | 68.7220 | 835.616 | 54.1281 | 30.6962 |
| 71 | 46.381 | 0.5335 | 33.7758 | 42.1080 | 58.1531 | 765.606 | 44.4871 | 35.4775 |
| 72 | 46.289 | 0.5299 | 33.7780 | 43.6502 | 58.4139 | 774.659 | 44.8008 | 34.8860 |
| 73 | 59.841 | 0.5637 | 33.8146 | 30.9301 | 49.9328 | 491.492 | 22.8749 | 37.3018 |
| 74 | 46.437 | 0.5311 | 34.0835 | 41.5876 | 58.0821 | 756.977 | 44.6133 | 35.3431 |
| 75 | 45.424 | 0.5083 | 34.1712 | 56.2996 | 63.5236 | 804.760 | 49.9078 | 31.5912 |
| 76 | 40.255 | 0.5000 | 34.4667 | 68.3615 | 76.7749 | 609.041 | 60.4905 | 35.9966 |
| 77 | 59.099 | 0.5722 | 34.5130 | 28.2904 | 53.1085 | 503.679 | 30.0839 | 38.8465 |
| 78 | 40.161 | 0.5000 | 34.6309 | 68.3050 | 76.8392 | 597.709 | 60.5489 | 36.1576 |
| 79 | 59.973 | 0.5508 | 34.7398 | 31.2630 | 48.9291 | 471.406 | 21.9331 | 36.8246 |
| 80 | 45.564 | 0.5074 | 34.8147 | 54.4744 | 63.1152 | 779.902 | 49.8239 | 31.9246 |
| 81 | 40.000 | 0.5000 | 34.9154 | 68.2019 | 76.9444 | 578.368 | 60.6444 | 36.4260 |
| 82 | 59.794 | 0.5513 | 35.0108 | 30.5053 | 49.8079 | 473.530 | 23.8691 | 37.3249 |
| 83 | 45.702 | 0.5076 | 35.2064 | 52.6205 | 62.5324 | 763.706 | 49.4808 | 32.2149 |
| 84 | 45.409 | 0.5036 | 35.2697 | 56.2343 | 64.4647 | 766.372 | 51.1901 | 31.8008 |
| 85 | 46.288 | 0.5163 | 35.3186 | 44.2816 | 59.2547 | 739.745 | 46.5377 | 33.7303 |
| 86 | 46.700 | 0.5242 | 35.3628 | 38.6027 | 57.7125 | 715.622 | 45.0214 | 35.2261 |
| 87 | 46.033 | 0.5113 | 35.4529 | 47.9701 | 60.6969 | 746.255 | 47.9488 | 32.9478 |
| 88 | 59.879 | 0.5452 | 35.6059 | 30.6939 | 49.2019 | 461.112 | 23.3175 | 37.0443 |
| 89 | 46.825 | 0.5242 | 35.6568 | 37.0966 | 57.4609 | 701.996 | 44.9338 | 35.4718 |
| 90 | 46.318 | 0.5140 | 35.7858 | 43.8369 | 59.3950 | 725.441 | 46.9174 | 33.6733 |
| 91 | 58.880 | 0.5512 | 36.3600 | 27.2964 | 53.3569 | 479.777 | 32.6907 | 39.0414 |
| 92 | 53.939 | 1.0000 | 36.7557 | 9.39434 | 39.0208 | 434.842 | 36.9683 | 38.3352 |
| 93 | 46.214 | 0.5073 | 36.8255 | 45.1165 | 60.6016 | 698.199 | 48.5288 | 33.2768 |
| 94 | 59.763 | 0.5382 | 36.8879 | 29.9447 | 49.4814 | 445.508 | 25.1815 | 37.2906 |
| 95 | 46.958 | 0.5143 | 37.3581 | 35.3654 | 57.5611 | 657.082 | 46.0526 | 34.9500 |
| 96 | 47.226 | 0.5173 | 37.4271 | 32.6200 | 56.8453 | 644.409 | 45.3970 | 35.6154 |
| 97 | 59.708 | 0.5343 | 37.6947 | 29.5376 | 49.5717 | 435.388 | 26.2064 | 37.3959 |
| 98 | 59.113 | 0.5364 | 38.1019 | 27.4990 | 52.0843 | 447.379 | 31.8769 | 38.6070 |
| 99 | 46.859 | 0.5090 | 38.1658 | 36.1990 | 58.2353 | 639.575 | 47.1164 | 34.5085 |
| 100 | 48.672 | 0.5258 | 38.3068 | 24.1953 | 55.6542 | 575.447 | 44.5490 | 38.0699 |
| 101 | 46.562 | 0.5051 | 38.3141 | 39.8437 | 59.6512 | 643.887 | 48.4268 | 33.9083 |
| 102 | 46.624 | 0.5051 | 38.4785 | 38.9629 | 59.4319 | 637.482 | 48.3202 | 34.0153 |
| 103 | 46.982 | 0.5079 | 38.7019 | 34.5880 | 57.9816 | 621.470 | 47.1781 | 34.6711 |
| 104 | 47.045 | 0.5079 | 38.8427 | 33.8518 | 57.8027 | 615.947 | 47.0963 | 34.7710 |
| 105 | 58.968 | 0.5322 | 39.0621 | 26.8445 | 52.4079 | 437.302 | 33.6279 | 38.7930 |
| 106 | 48.810 | 0.5204 | 39.1500 | 23.3134 | 55.2566 | 559.828 | 44.7873 | 37.8055 |
| 107 | 59.816 | 0.5268 | 39.2046 | 29.5511 | 48.6925 | 410.084 | 26.0331 | 37.0406 |
| 108 | 47.256 | 0.5061 | 39.7098 | 31.3221 | 57.3671 | 587.809 | 47.1865 | 35.0257 |
| 109 | 54.508 | 1.0000 | 40.0664 | 10.2798 | 39.1615 | 420.183 | 35.6689 | 38.4790 |
| 110 | 48.577 | 0.5117 | 40.4615 | 23.1311 | 54.9428 | 542.093 | 45.4546 | 36.9439 |
| 111 | 59.844 | 0.5195 | 41.2409 | 29.1232 | 48.1230 | 381.308 | 27.0237 | 36.8839 |
| 112 | 58.039 | 0.5215 | 42.1880 | 23.9532 | 54.3615 | 414.195 | 41.1841 | 39.6514 |
| 113 | 59.860 | 0.5158 | 42.4534 | 28.8611 | 47.7969 | 364.905 | 27.6420 | 36.7969 |
| 114 | 58.945 | 0.5175 | 42.8107 | 25.7902 | 51.6970 | 386.419 | 36.1783 | 38.6917 |
| 115 | 59.841 | 0.5143 | 43.0324 | 28.6368 | 47.7761 | 358.066 | 28.2115 | 36.8297 |
| 116 | 55.116 | 1.0000 | 43.1670 | 11.3378 | 39.5858 | 410.292 | 34.5031 | 38.6324 |
| 117 | 59.976 | 0.5128 | 43.4414 | 29.0487 | 46.9871 | 348.594 | 27.0568 | 36.4174 |
| 118 | 59.561 | 0.5136 | 43.6132 | 27.4655 | 49.0314 | 359.252 | 31.4166 | 37.5287 |
| 119 | 59.728 | 1.0000 | 43.6925 | 22.8926 | 45.1382 | 449.982 | 25.0679 | 38.1739 |
| 120 | 59.856 | 0.5122 | 43.8052 | 28.4865 | 47.5463 | 347.847 | 28.5651 | 36.7621 |
| 121 | 45.875 | 0.8931 | 45.2709 | 10.4006 | 40.1815 | 555.382 | 37.3554 | 38.0971 |
| 122 | 59.158 | 1.0000 | 45.3964 | 20.9157 | 45.1683 | 440.309 | 27.7278 | 38.6335 |
| 123 | 44.563 | 0.8879 | 45.4699 | 10.0605 | 40.8465 | 661.976 | 38.9996 | 37.6515 |
| 124 | 51.609 | 0.5000 | 45.7376 | 17.8572 | 53.5657 | 432.356 | 47.6500 | 38.4335 |
| 125 | 45.259 | 0.8875 | 45.8463 | 10.4058 | 40.3297 | 583.888 | 37.6486 | 37.9806 |
| 126 | 60 | 0.5057 | 46.4558 | 28.3297 | 46.2691 | 311.418 | 28.8048 | 36.2478 |
| 127 | 45.579 | 0.8863 | 46.5858 | 10.7442 | 40.2284 | 550.463 | 36.9306 | 38.1536 |
| 128 | 59.999 | 0.5039 | 47.3473 | 28.0837 | 46.0996 | 301.162 | 29.4200 | 36.2231 |
| 129 | 59.596 | 0.5041 | 47.5954 | 26.5108 | 48.0828 | 309.954 | 33.7648 | 37.3234 |
| 130 | 58.669 | 0.5044 | 47.9450 | 23.7058 | 51.5452 | 328.681 | 41.2854 | 38.8813 |
| 131 | 59.764 | 0.5021 | 48.4520 | 26.8800 | 47.1033 | 295.467 | 32.6772 | 36.8740 |
| 132 | 59.841 | 0.5012 | 48.8544 | 27.0555 | 46.6381 | 288.801 | 32.1621 | 36.6514 |
| 133 | 56.387 | 0.5000 | 49.2614 | 19.8441 | 54.6667 | 349.268 | 49.0778 | 39.8969 |
| 134 | 60.000 | 0.5000 | 49.4027 | 27.5199 | 45.6965 | 278.242 | 30.8390 | 36.1600 |
| 135 | 57.204 | 0.5000 | 49.7252 | 20.6144 | 53.9997 | 333.247 | 47.9628 | 39.7597 |
| 136 | 42.813 | 0.8725 | 50.1373 | 11.0467 | 41.9201 | 796.301 | 39.7337 | 37.1548 |
| 137 | 42.688 | 0.8725 | 50.5409 | 11.1310 | 42.1006 | 815.967 | 39.9327 | 37.0784 |
| 138 | 43.193 | 0.8554 | 51.3762 | 12.1084 | 40.7913 | 630.871 | 36.6778 | 37.8667 |
| 139 | 42.215 | 0.8598 | 52.2223 | 12.1541 | 41.8650 | 795.187 | 38.8742 | 37.1293 |
| 140 | 43.073 | 0.8492 | 52.2998 | 12.6920 | 40.8526 | 612.876 | 36.1078 | 37.9802 |
| 141 | 41.902 | 0.8442 | 53.7151 | 13.7760 | 41.5134 | 738.529 | 37.1919 | 37.3385 |
| 142 | 41.898 | 0.8338 | 54.5485 | 15.0577 | 41.4416 | 680.287 | 35.9118 | 37.6340 |
| 143 | 40.029 | 0.7876 | 54.7425 | 41.2993 | 45.9544 | 884.387 | 34.3823 | 36.0081 |
| 144 | 42.330 | 0.8154 | 55.1864 | 17.5144 | 42.8762 | 570.405 | 34.5823 | 38.5146 |
| 145 | 41.797 | 0.8054 | 55.4097 | 20.4765 | 43.6637 | 604.704 | 34.5449 | 38.3638 |
| 146 | 41.225 | 0.8542 | 55.4434 | 14.2039 | 43.0684 | 923.723 | 39.6268 | 36.4880 |
| 147 | 41.403 | 0.8664 | 55.9242 | 13.1669 | 43.7443 | 981.324 | 40.9211 | 36.3234 |
| 148 | 40.507 | 0.8116 | 56.2913 | 25.2199 | 43.1649 | 819.550 | 35.3048 | 36.6127 |
| 149 | 40.545 | 0.8365 | 56.6608 | 18.8091 | 43.2491 | 933.584 | 38.2381 | 36.1543 |
| 150 | 41.164 | 0.8641 | 56.8806 | 13.8508 | 43.9995 | 1004.67 | 40.9338 | 36.1734 |
| 151 | 40.820 | 0.8579 | 57.7335 | 15.2446 | 44.1617 | 1020.57 | 40.6202 | 35.9904 |
| 152 | 42.029 | 0.8944 | 57.8736 | 11.9453 | 45.2191 | 1082.63 | 43.0325 | 36.0160 |
| 153 | 40.764 | 0.8596 | 58.3146 | 15.3538 | 44.4235 | 1041.20 | 40.8816 | 35.8890 |
| 154 | 40.015 | 0.8389 | 58.5608 | 21.9292 | 44.6049 | 1053.31 | 39.3423 | 35.3033 |
| 155 | 41.103 | 0.8724 | 58.8645 | 13.8301 | 44.8631 | 1069.93 | 41.8600 | 35.8994 |
| 156 | 40.264 | 0.8481 | 58.8845 | 18.7420 | 44.6186 | 1057.34 | 40.1442 | 35.5276 |
| 157 | 43.220 | 0.9306 | 60.0827 | 11.5561 | 46.5592 | 1155.83 | 44.5017 | 35.7222 |
| 158 | 40.393 | 0.8619 | 60.8652 | 16.8524 | 45.4152 | 1113.21 | 41.4841 | 35.4126 |
| 159 | 40.127 | 0.8594 | 61.8278 | 18.4751 | 45.8224 | 1139.80 | 41.4885 | 35.1183 |
| 160 | 40.507 | 0.8741 | 63.1968 | 15.9313 | 46.1929 | 1160.10 | 42.4115 | 35.2690 |
| 161 | 42.058 | 0.9140 | 63.9741 | 12.7639 | 46.8656 | 1185.91 | 43.9841 | 35.4766 |
| 162 | 40.731 | 0.8848 | 64.6624 | 15.0846 | 46.6353 | 1183.50 | 42.9724 | 35.2405 |
| 163 | 40.564 | 0.8844 | 65.6333 | 15.6985 | 46.9008 | 1198.46 | 42.9984 | 35.0921 |
| 164 | 40.569 | 0.8920 | 67.7084 | 15.8189 | 47.4562 | 1225.94 | 43.3209 | 34.9230 |
| 165 | 40.444 | 0.8920 | 68.4482 | 16.2952 | 47.6604 | 1235.77 | 43.3310 | 34.8078 |
| 166 | 40.033 | 0.8848 | 68.8889 | 18.0805 | 47.8874 | 1246.28 | 43.1227 | 34.5286 |
| 167 | 41.783 | 0.9250 | 69.3261 | 14.0605 | 47.9984 | 1245.94 | 44.1387 | 35.0084 |
| 168 | 41.769 | 0.9272 | 69.9927 | 14.2335 | 48.1457 | 1252.72 | 44.1503 | 34.9467 |
| 169 | 41.718 | 0.9295 | 70.8740 | 14.4986 | 48.3361 | 1261.32 | 44.1458 | 34.8611 |
| 170 | 41.508 | 0.9276 | 71.5386 | 14.8512 | 48.4590 | 1267.28 | 44.0755 | 34.7810 |
| 171 | 41.904 | 0.9413 | 72.6955 | 14.9051 | 48.7758 | 1279.00 | 44.2026 | 34.6910 |
| 172 | 40.138 | 0.9126 | 74.3338 | 17.9720 | 49.2147 | 1297.14 | 43.6576 | 34.1689 |
| 173 | 41.516 | 0.9470 | 75.2540 | 16.0395 | 49.3469 | 1301.10 | 44.0190 | 34.3856 |
| 174 | 41.150 | 0.9432 | 75.8196 | 16.5507 | 49.4815 | 1306.05 | 43.9144 | 34.2808 |
| 175 | 41.736 | 0.9608 | 76.5284 | 16.4527 | 49.6767 | 1311.89 | 43.9728 | 34.2412 |
| 176 | 41.141 | 0.9557 | 77.3241 | 17.1872 | 49.8796 | 1318.63 | 43.8126 | 34.0876 |
| 177 | 40.694 | 0.9701 | 79.0754 | 18.4062 | 50.3985 | 1333.24 | 43.5631 | 33.7820 |
| 178 | 40.000 | 0.9687 | 79.6255 | 19.3879 | 50.6419 | 1338.86 | 43.4302 | 33.5853 |
| 179 | 40.000 | 1.0000 | 80.4607 | 19.5847 | 50.8631 | 1344.63 | 43.2752 | 33.4946 |
| 180 | 40.000 | 1.0000 | 80.4607 | 19.5847 | 50.8631 | 1344.63 | 43.2752 | 33.4946 |
Figure A1.
The impact of Td and va on: (a) EC, (b) CD, and quality parameters (c) Aloss, (d) TACloss, (e) TFCloss, (f) TPCloss of the Echium amoenum petals.
Figure A1.
The impact of Td and va on: (a) EC, (b) CD, and quality parameters (c) Aloss, (d) TACloss, (e) TFCloss, (f) TPCloss of the Echium amoenum petals.

References
- Kris-Etherton, P.M.; Hecker, K.D.; Bonanome, A.; Coval, S.M.; Binkoski, A.E.; Hilpert, K.F.; Griel, A.E.; Etherton, T.D. Bioactive compounds in foods: Their role in the prevention of cardiovascular disease and cancer. Am. J. Med. 2002, 113, 71–88. [Google Scholar] [CrossRef]
- Zheng, W.; Wang, S. Antioxidant activity and phenolic compounds in selected herbs. J. Agric. Food Chem. 2001, 49, 5165–5170. [Google Scholar] [CrossRef] [PubMed]
- Parker, T.D.; Adams, D.A.; Zhou, K.; Harris, M.; Yu, L. Fatty Acid Composition and Oxidative Stability of Cold-Pressed Edible Seed Oils. J. Food Sci. 2003, 68, 1240–1243. [Google Scholar] [CrossRef]
- Alinejad, M.; Motamedzadegan, A.; Rezaei, M. Functional properties and antioxidant activities of protein hydrolysates from whitecheeck shark (Carcharhinus dussumieri) meat. Iran. J. Food Sci. Technol. 2016, 13, 159–169. [Google Scholar]
- Saboora, A.; Dadmehr, K.; Ranjbar, M. Total phenolic and flavonoid contents and investigation on antioxidant properties of stem and leaf extracts in six Iranian species of wild Dianthus L. Iran. J. Med. Aromat. Plants 2013, 29, 281–295. [Google Scholar]
- Sathishkum, R.; Lakshmi, P.T.V.; Annamalai, A. Effect of Drying Treatment on the Content of Antioxidants in Enicostemma littorale Blume. Res. J. Med. Plant 2009, 3, 93–101. [Google Scholar] [CrossRef]
- Nouri, M.; Farajdokht, F.; Torbati, M.; Ranjbar, F.; Hamedyazdan, S.; Araj-khodaei, M.; Sadigh-Eteghad, S. A Close Look at Echium amoenum Processing, Neuroactive Components, and Effects on Neuropsychiatric Disorders. Galen Med. J. 2019, 8, 1–17. [Google Scholar] [CrossRef]
- Yazdi, M.T.; Khara, J.; Husaindokht, M.; Sadeghnia, H.; Bahabadi, S.E.; Amiri, M.; Darroudi, M. Assessment of phytochemical components and antioxidant activity of Rheum turkestanicum Janisch. Stud. Med. Sci. 2020, 31, 75–81. [Google Scholar]
- Daneshfar, A. Investigation of Genetic Diversity and Reproductive Changes (Growth, Flowering and Yield of Active Ingredients) in Various Populations Iranian Amoenum Echium Fisch & May; Tarbiat Modares University: Tehran, Iran, 2009. [Google Scholar]
- Salehzadeh, A. Investigation on Different Species of Borage in the Plant Markets of Iran and Comparison with Standard Species; University of Esfahan: Isfahan, Iran, 1989. [Google Scholar]
- Andersen, Ǿ.M.; Markham, K.R. Flavonoids: Chemistry, Biochemistry, and Applications; Taylor and Francis: London, UK; New York, NY, USA, 2006. [Google Scholar]
- Pascual-Teresa, S.; Sanchez-Ballesta, M. Anthocyanins: From plant to health. Phytochem. Rev. 2008, 7, 281–299. [Google Scholar] [CrossRef]
- Sayahbargard, M.; Boostani, H.; Sayah, M.; Fazileh, F.; Kamalinezhad, M.; Akhondzadeh, S. Efficacy of aqueous extract of Echium Amoenum L. in the treatment of mild to moderate obsessive-compulsive disorder. J. Med. Plants 2005, 15, 43–50. [Google Scholar]
- Rabbani, M.; Sajjadi, S.E.; Vaseghi, G.; Jafarian, A. Anxiolytic effects of Echium amoenum on the elevated plus-maze model of anxiety in mice. Fitoterapia 2004, 75, 457–464. [Google Scholar] [CrossRef] [PubMed]
- Heidari, M.R.; Azad, E.M.; Mehrabani, M. Evaluation of the analgesic effect of Echium amoenum Fisch & C.A. Mey. Extract in mice: Possible mechanism involved. J. Ethnopharmacol. 2006, 103, 345–349. [Google Scholar] [CrossRef] [PubMed]
- Zargari, A. Medicinal Plants; Tehran University Publication: Tehran, Iran, 1996. [Google Scholar]
- Rezaei, K.; Shahrokhi, S.; Davoodzadeh, M.; Tarahi, M. Effect of brewed borage on urine biochemistry and blood of patients with chronic failure of non-dialysis kidney. J. Lorestan Univ. Med. Sci. 2004, 20, 11–15. [Google Scholar]
- Abed, A.; Minaiyan, M.; Ghannadi, A.; Mahzouni, P.; Babavalian, M. Effect of Echium amoenum Fisch. Et Mey a traditional Iranian herbal remedy in an experimental model of acute pancreatitis. ISRN Gastroenterol. 2012. [Google Scholar] [CrossRef] [PubMed] [Green Version]
- Abbaszadeh, S.; Radjabian, T.; Taghizadeh, M. Identification and determination of phytosterols in oilseeds of some populations from two Iranian Echium species. Iran. J. Med. Aromat. Plants 2013, 28, 741–755. [Google Scholar]
- Amirghofran, Z.; Azadbakht, M.; Keshavarzi, F. Echium amoenum stimulate of lymphocyte proliferation and inhibit of humoral antibody synthesis. Iran. J. Med. Sci. 2000, 25, 119–124. [Google Scholar]
- Baanoni, S. Industrial Drying Process Guide; Shahid Chamran University of Ahvaz: Ahvaz, Iran, 2011. [Google Scholar]
- Mujumdar, A.; Devahastin, S. Fluidized Bed Drying. In Developments in Drying; Mujumdar, A., Ed.; Kasetsart University Press: Bangkok, Thailand, 2000; pp. 59–111. [Google Scholar]
- Uckan, G.; Ulku, S. Drying of Grains in a Batch Fluidized-Bed Dryer. In Drying of Soil & Recent International Developments; Majumdar, A., Ed.; Wiley Eastern Ltd.: New Delhi, India, 1986. [Google Scholar]
- Kathirvel, K.; Gariepy, Y.; Orsat, V.; Raghavan, G.S.V. Microwave Drying—A Promising Alternative for the Herb Processing Industry. In Proceedings of the 2006 CSBE/SCGAB, Edmonton, AB, Canada, 16–19 July 2006; American Society of Agricultural and Biological Engineers: St. Joseph, MI, USA, 2006. [Google Scholar]
- Lee, D.-J.; Jangam, S.; Mujumdar, A.S. Some Recent Advances in Drying Technologies to Produce Particulate Solids. KONA Powder Part. J. 2013, 30, 69–83. [Google Scholar] [CrossRef] [Green Version]
- Hu, X. Fluidized-Bed Drying and Microwave-Assisted Fluidized-Bed Drying of Carrot Slices. Master’s Thesis, McGill University, Monteal, QC, Canada, 2016. [Google Scholar]
- Chua, K.J.; Chou, S.K. Low-cost drying methods for developing countries. Trends Food Sci. Technol. 2003, 14, 519–528. [Google Scholar] [CrossRef]
- Nadi, F. Bioactive compound retention in Echium amoenum Fisch. & C. A. Mey. petals: Effect of fluidized bed drying conditions. Int. J. Food Prop. 2017, 20. [Google Scholar] [CrossRef] [Green Version]
- Zhang, M.; Chen, H.; Mujumdar, A.S.; Tang, J.; Miao, S.; Wang, Y. Recent developments in high-quality drying of vegetables, fruits, and aquatic products. Crit. Rev. Food Sci. Nutr. 2017, 57, 1239–1255. [Google Scholar] [CrossRef]
- Puspasari, I.; Talib, M.Z.M.; Daud, W.R.W.; Tasirin, S.M. Fluidization characteristics of oil palm frond particles in agitated bed. Chem. Eng. Res. Des. 2013, 91, 497–507. [Google Scholar] [CrossRef]
- Yang, W.-C. Handbook of fluidization and fluid-particle systems. China Particuol. 2003, 1, 137. [Google Scholar] [CrossRef]
- Balbay, A.; Şahin, Ö.; Karabatak, M. An Investigation of Drying Process of Shelled Pistachios in a Newly Designed Fixed Bed Dryer System by Using Artificial Neural Network. Dry. Technol. 2011, 29, 1685–1696. [Google Scholar] [CrossRef]
- Kaveh, M.; Chayjan, R.A. Mathematical and neural network modelling of terebinth fruit under fluidized bed drying. Res. Agric. Eng. 2016, 61, 55–65. [Google Scholar] [CrossRef] [Green Version]
- Yousefi, G.; Emam-Djomeh, Z.; Omid, M.; Askari, G.R. Prediction of Physicochemical Properties of Raspberry Dried by Microwave-Assisted Fluidized Bed Dryer Using Artificial Neural Network. Dry. Technol. 2014, 32, 4–12. [Google Scholar] [CrossRef]
- Yüzgeç, U.; Türker, M. Comparison of Different Modeling Concepts for Drying Process of Baker’s Yeast. IFAC Proc. Vol. 2009, 42, 816–821. [Google Scholar] [CrossRef]
- Shahraki, M.H.; Jafari, S.M.; Mashkour, M.; Esmaeilzadeh, E. Optimization of Closed-Cycle Fluidized Bed Drying of Sesame Seeds Using Response Surface Methodology and Genetic Algorithms. Int. J. Food Eng. 2014, 10, 167–181. [Google Scholar] [CrossRef]
- Nazghelichi, T.; Aghbashlo, M.; Kianmehr, M.H. Optimization of an artificial neural network topology using coupled response surface methodology and genetic algorithm for fluidized bed drying. Comput. Electron. Agric. 2011, 75, 84–91. [Google Scholar] [CrossRef]
- Chayjan, R.A.; Kaveh, M.; Dibagar, N.; Nejad, M.Z. Optimization of Pistachio Nut Drying in a Fluidized Bed Dryer with Microwave Pretreatment Applying Response Surface Methodology. Chem. Prod. Process Model. 2017, 12. [Google Scholar] [CrossRef]
- Tasirin, S.M.; Kamarudin, S.K.; Ghani, J.A.; Lee, K.F. Optimization of drying parameters of bird’s eye chilli in a fluidized bed dryer. J. Food Eng. 2007, 80, 695–700. [Google Scholar] [CrossRef]
- Nadi, F. Development of a new model for mass transfer kinetics of petals of Echium amoenum Fisch. & C.A. Mey. under fluidized bed conditions. Food Technol. Biotechnol. 2016, 54. [Google Scholar] [CrossRef]
- Rufino, M.S.M.; Alves, R.E.; Brito, E.S.; Morais, S.M.; Sampaio, C.G.; Pérez-Jiménez, J.; Saura-Calixto, F.D. Metodologia Científica: Determinação da Atividade Antioxidante Total Emfrutas Pela Captura Do Radical Livre ABTS; Embrapa Agroindústria Tropical: Fortaleza, Brazil, 2007. [Google Scholar]
- Arvouet-Grand, A.; Vennat, B.; Pourrat, A.; Legret, P. Standardization of Propolis Extract and Identification of Principal Constituents. J. Pharm. Belg. 1994, 49, 462–468. [Google Scholar] [PubMed]
- Motevali, A.; Minaei, S.; Banakar, A.; Ghobadian, B.; Khoshtaghaza, M.H. Comparison of energy parameters in various dryers. Energy Convers. Manag. 2014, 87, 711–725. [Google Scholar] [CrossRef]
- Vieira, M.G.A.; Estrella, L.; Rocha, S.C.S. Energy Efficiency and Drying Kinetics of Recycled Paper Pulp. Dry. Technol. 2007, 25, 1639–1648. [Google Scholar] [CrossRef]
- Hagan, M.T.; Menhaj, M. Training feed-forward networks with the Marquardt algorithm. IEEE Trans. Neural. Netw. 1999, 5, 989–993. [Google Scholar] [CrossRef] [PubMed]
- Winiczenko, R.; Górnicki, K.; Kaleta, A.; Martynenko, A.; Janaszek-Mańkowska, M.; Trajer, J. Multi-objective optimization of convective drying of apple cubes. Comput. Electron. Agric. 2018, 145, 341–348. [Google Scholar] [CrossRef]
- Jafarian, H.; Sayyaadi, H.; Torabi, F. Modeling and optimization of dew-point evaporative coolers based on a developed GMDH-type neural network. Energy Convers. Manag. 2017, 143, 49–65. [Google Scholar] [CrossRef]
- Li, C.Y.; Wu, J.Y.; Chavasint, C.; Sampattagul, S.; Kiatsiriroat, T.; Wang, R.Z. Multi-criteria optimization for a biomass gasification-integrated combined cooling, heating, and power system based on life-cycle assessment. Energy Convers. Manag. 2018, 178, 383–399. [Google Scholar] [CrossRef]
- Zhang, X.; Li, H.; Liu, L.; Bai, C.; Wang, S.; Song, Q.; Zeng, J.; Liu, X.; Zhang, G. Optimization analysis of a novel combined heating and power system based on biomass partial gasification and ground source heat pump. Energy Convers. Manag. 2018, 163, 355–370. [Google Scholar] [CrossRef]
- Khanmohammadi, S.; Saadat-Targhi, M.; Al-Rashed, A.A.A.A.; Afrand, M. Thermodynamic and economic analyses and multi-objective optimization of harvesting waste heat from a biomass gasifier integrated system by thermoelectric generator. Energy Convers. Manag. 2019, 195, 1022–1034. [Google Scholar] [CrossRef]
- Özahi, E.; Tozlu, A.; Abuşoğlu, A. Thermoeconomic multi-objective optimization of an organic Rankine cycle (ORC) adapted to an existing solid waste power plant. Energy Convers. Manag. 2018, 168, 308–319. [Google Scholar] [CrossRef]
- Górnicki, K.; Winiczenko, R.; Kaleta, A. Estimation of the biot number using genetic algorithms: Application for the drying process. Energies 2019, 12, 2822. [Google Scholar] [CrossRef] [Green Version]
- Winiczenko, R.; Górnicki, K.; Kaleta, A. Evaluation of the mass diffusion coefficient and mass biot number using a nondominated sorting genetic algorithm. Symmetry 2020, 12, 260. [Google Scholar] [CrossRef] [Green Version]
- Winiczenko, R.; Górnicki, K.; Kaleta, A.; Janaszek-Mańkowska, M.; Trajer, J. Multi-objective optimization of the apple drying and rehydration processes parameters. Emir. J. Food Agric. 2018, 30, 1–9. [Google Scholar] [CrossRef]
- Winiczenko, R.; Górnicki, K.; Kaleta, A.; Janaszek-Mańkowska, M.; Choińska, A.; Trajer, J. Apple Cubes Drying and Rehydration. Multiobjective Optimization of the Processes. Sustainability 2018, 10, 4126. [Google Scholar] [CrossRef] [Green Version]
Figure 1.
The best Artificial Neural Network (ANN) structure.
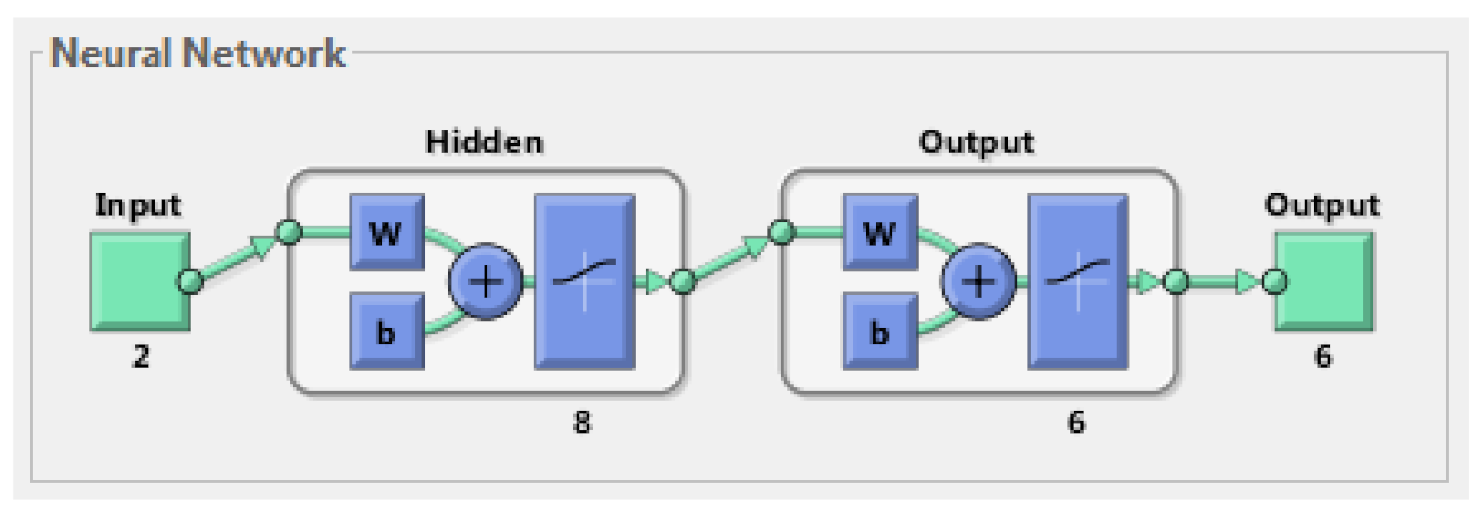
Figure 2.
Changes in the MSE calculated for the following sets: test, training and validation.

Figure 3.
The ANN goodness of fit.
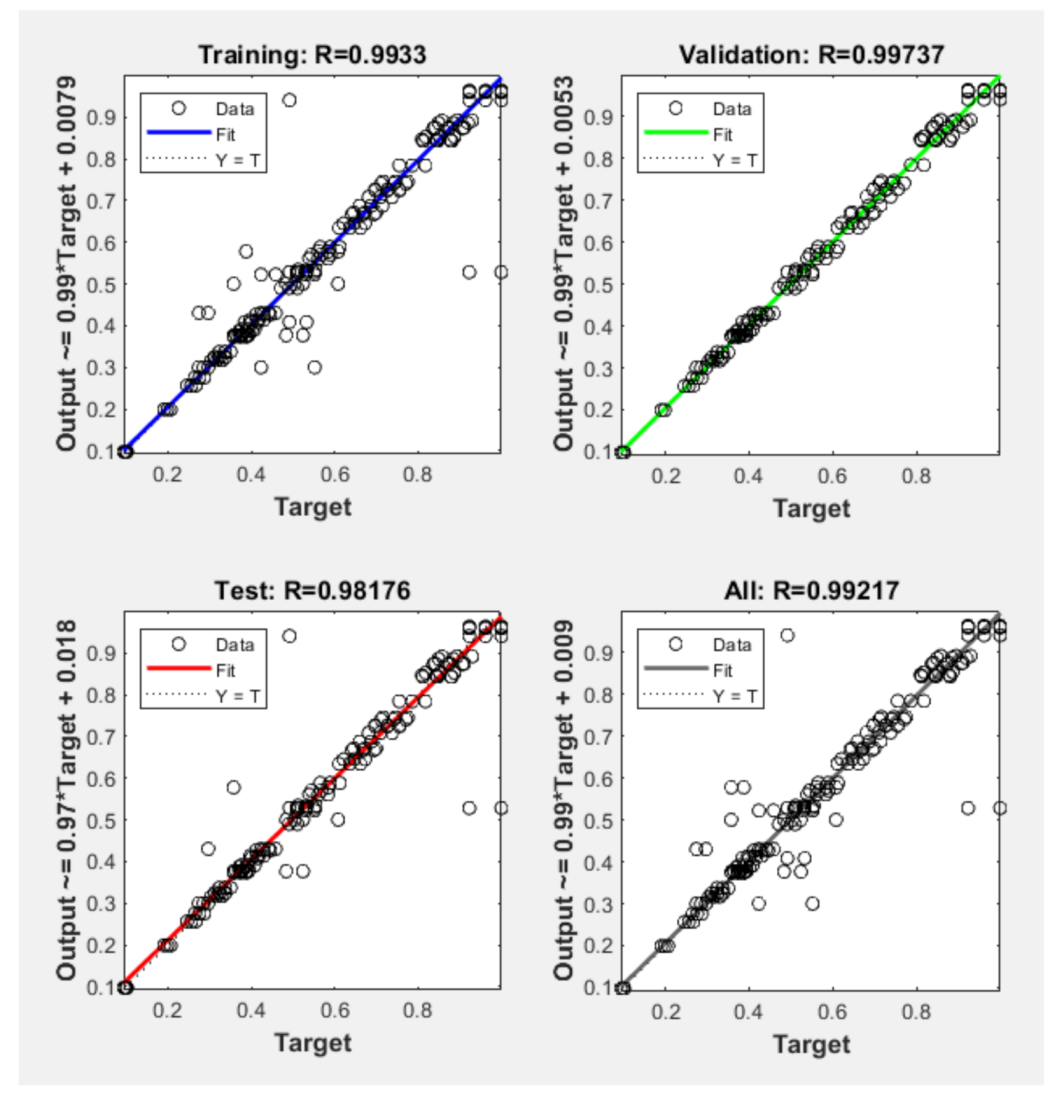
Figure 4.
Pareto fronts-two-dimensional views: (a) EC-TACloss, (b) EC-CD, (c) EC-TFCloss, (d) EC-Aloss, (e) EC-TPCloss; O–the best solutions, +—data, ■—ECmin, ■—TACloss min, ▲—TFCloss min, ▼—Aloss min, ►—TPCloss min, ◄—CDmin.
Figure 4.
Pareto fronts-two-dimensional views: (a) EC-TACloss, (b) EC-CD, (c) EC-TFCloss, (d) EC-Aloss, (e) EC-TPCloss; O–the best solutions, +—data, ■—ECmin, ■—TACloss min, ▲—TFCloss min, ▼—Aloss min, ►—TPCloss min, ◄—CDmin.

Figure 5.
Pareto fronts-two-dimensional views: (a) TFCloss-TACloss, (b) Aloss-TFCloss, (c) Aloss-TACloss; +—data, ■—ECloss min, ■—TACloss min, ▲—TFCloss min, ▼—Aloss min, ►—TPCloss min, ◄—CDmin.
Figure 5.
Pareto fronts-two-dimensional views: (a) TFCloss-TACloss, (b) Aloss-TFCloss, (c) Aloss-TACloss; +—data, ■—ECloss min, ■—TACloss min, ▲—TFCloss min, ▼—Aloss min, ►—TPCloss min, ◄—CDmin.
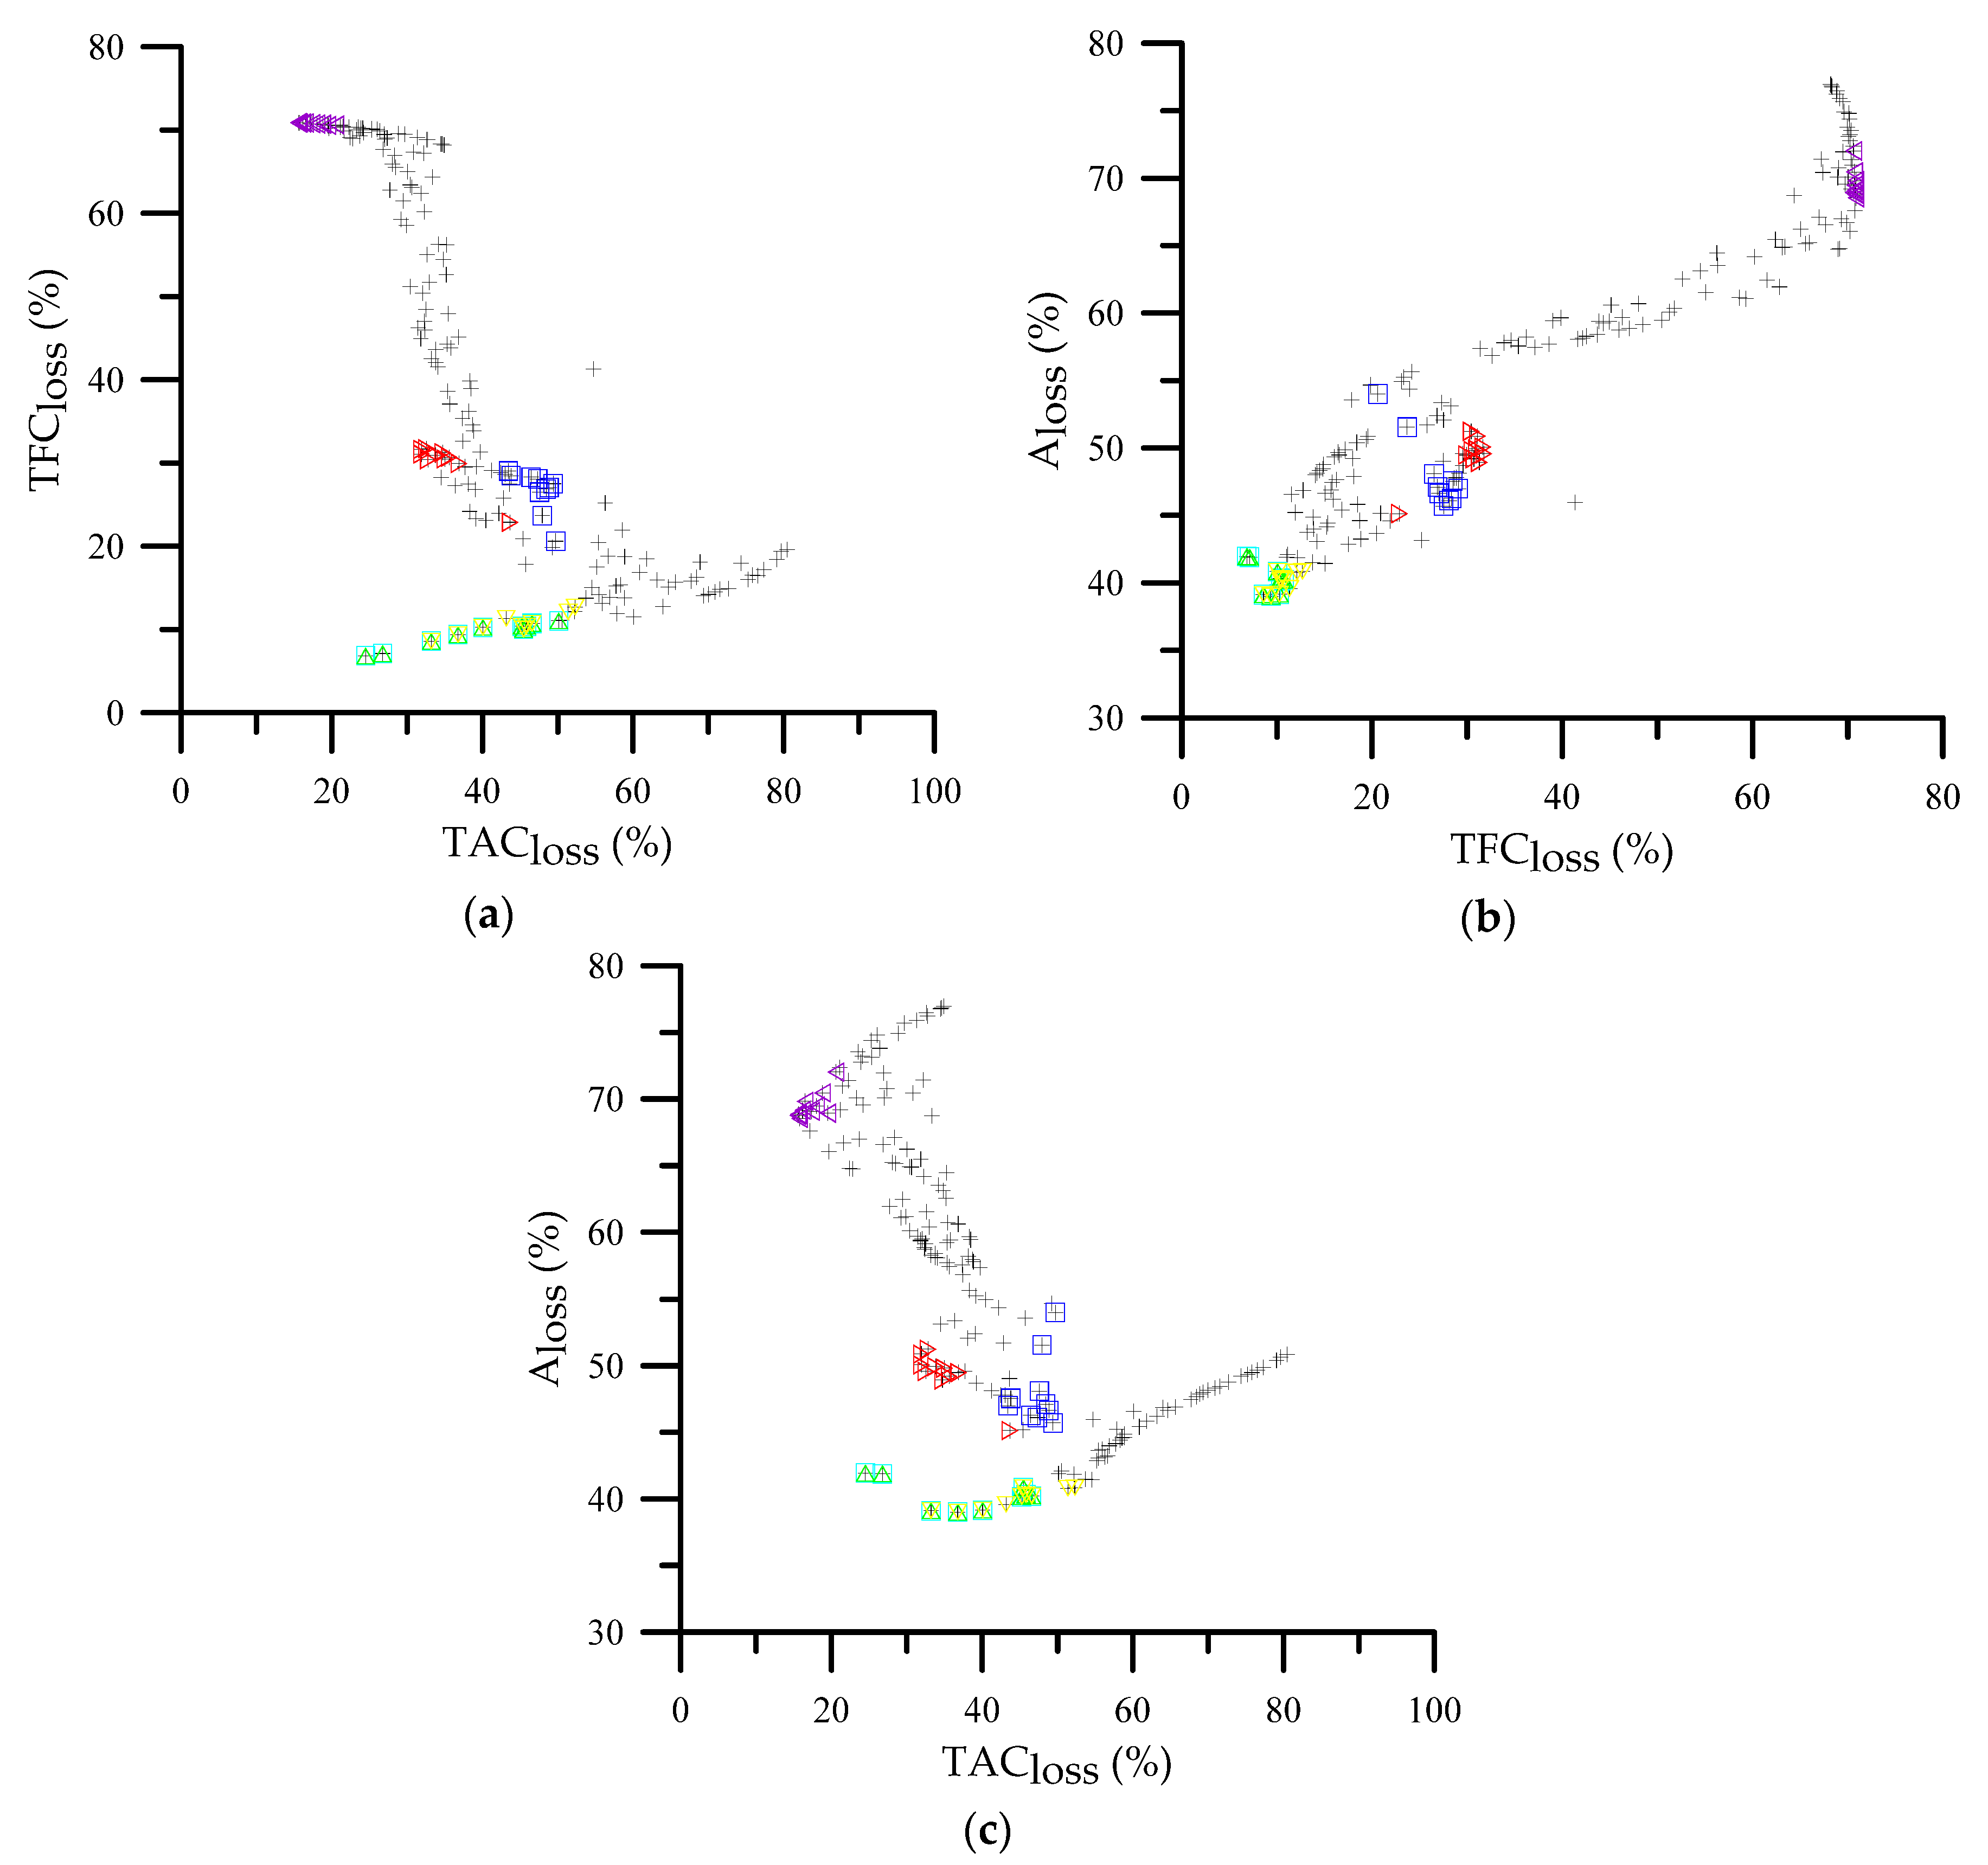
Figure 6.
Pareto fronts-two-dimensional views: (a) EC-TACloss-TFCloss, (b) EC-Aloss-TPCloss; O—the best solutions, +—data.
Figure 6.
Pareto fronts-two-dimensional views: (a) EC-TACloss-TFCloss, (b) EC-Aloss-TPCloss; O—the best solutions, +—data.

Table 1.
The statistics of data.
| Data | Statistical Parameter | ||
|---|---|---|---|
| Mean ± SD (Range) | Coefficient of Variation | Skewness Coefficient | |
| Aloss, % | 53.29 ± 9.84 (41.00–80.09) | 0.19 | 1.35 |
| CD,- | 41.29 ± 7.92 (30.75–55.49) | 0.19 | 0.26 |
| EC, MJ/kg | 654.92 ± 309.06 (266.39–1397.36) | 0.47 | 1.11 |
| TACloss, % | 43.51 ± 15.55 (23.41–85.45) | 0.36 | 1.44 |
| TFCloss, % | 30.80 ± 19.00 (6.65–70.99) | 0.62 | 0.98 |
| TPCloss, % | 39.78 ± 11.31 (22.52–62.91) | 0.28 | 0.10 |
Table 2.
Process variables and their bounds.
| Item | Parameter | Unit | Factor Levels | ||
|---|---|---|---|---|---|
| 1 | Td | °C | 40 | 50 | 60 |
| 2 | vd | m/s | 0.5 | 0.75 | 1 |
Table 3.
Optimization of Artificial Neural Network (ANN) architecture.
| Item | Activate Function in the Hidden Layer | Number of Neurons in the Hidden Layer | Activate Function in the Output Layer | Statistical Performance | |
|---|---|---|---|---|---|
| MSE | R-Value | ||||
| 1 | log-sigmoid | 4 | log-sigmoid | 0.004546 | 0.9552 |
| 2 | log-sigmoid | 6 | log-sigmoid | 0.000844 | 0.9895 |
| 3 | log-sigmoid | 8 | log-sigmoid | 0.000292 | 0.9922 |
| 4 | log-sigmoid | 4 | pureline | 0.006726 | 0.9428 |
| 5 | log-sigmoid | 6 | pureline | 0.001043 | 0.9903 |
| 6 | log-sigmoid | 8 | pureline | 0.000684 | 0.9915 |
| 7 | Tansig | 4 | pureline | 0.005523 | 0.9472 |
| 8 | Tansig | 6 | pureline | 0.000888 | 0.9897 |
| 9 | Tansig | 8 | pureline | 0.000792 | 0.9914 |
| 10 | Tansig | 4 | log-sigmoid | 0.003880 | 0.9672 |
| 11 | Tansig | 6 | log-sigmoid | 0.000765 | 0.9908 |
| 12 | Tansig | 8 | log-sigmoid | 0.000741 | 0.9911 |
Table 4.
The Nondominated Sorting Genetic Algorithm (NSGA II) parameters.
| Population Type | Double Vector |
|---|---|
| Crossover function | Intermediate |
| Crossover rate | 85% |
| Migration | Forward |
| Mutation function | Uniform |
| Mutation rate | 15% |
| Number of generations | 300 × number of variables |
| Pareto front population fraction | 0.8 |
| Population size | 20·number of variables |
| Selection function | Tournament size = 2 |
Table 5.
Constants (weights and biases) Dij in Equation (17).
| i | Di1 | Di2 | Di3 |
|---|---|---|---|
| 1 | −35.560371 | 1.530375 | 35.746782 |
| 2 | 5.264209 | −34.088544 | 9.816984 |
| 3 | 22.479106 | −27.444875 | 6.052853 |
| 4 | −17.140856 | −32.840889 | 30.725816 |
| 5 | 21.678617 | 31.658204 | −31.391203 |
| 6 | −23.550824 | 28.269281 | −7.366114 |
| 7 | 39.790524 | 16.976584 | −38.393101 |
| 8 | 28.398313 | −24.399395 | 1.949355 |
Publisher’s Note: MDPI stays neutral with regard to jurisdictional claims in published maps and institutional affiliations. |
© 2020 by the authors. Licensee MDPI, Basel, Switzerland. This article is an open access article distributed under the terms and conditions of the Creative Commons Attribution (CC BY) license (http://creativecommons.org/licenses/by/4.0/).
Share and Cite
MDPI and ACS Style
Nadi, F.; Górnicki, K.; Winiczenko, R. A Novel Optimization Algorithm for Echium amoenum Petals Drying. Appl. Sci. 2020, 10, 8387. https://doi.org/10.3390/app10238387
AMA Style
Nadi F, Górnicki K, Winiczenko R. A Novel Optimization Algorithm for Echium amoenum Petals Drying. Applied Sciences. 2020; 10(23):8387. https://doi.org/10.3390/app10238387
Chicago/Turabian StyleNadi, Fatemeh, Krzysztof Górnicki, and Radosław Winiczenko. 2020. "A Novel Optimization Algorithm for Echium amoenum Petals Drying" Applied Sciences 10, no. 23: 8387. https://doi.org/10.3390/app10238387
Note that from the first issue of 2016, this journal uses article numbers instead of page numbers. See further details here.