Temperature and Pulse-Energy Range Suitable for Femtosecond Pulse Transmission in Si Nanowire Waveguide


1
Department of Physics, College of Liberal Arts and Sciences, National University of Defense Technology, Changsha 410073, China
2
College of Information and Communication, National University of Defense Technology, Changsha 410073, China
3
School of Physics and Optoelectronic Engineering, Xidian University, Xi’an 710071, China
*
Author to whom correspondence should be addressed.
Appl. Sci. 2020, 10(23), 8429; https://doi.org/10.3390/app10238429
Submission received: 28 October 2020
/
Revised: 18 November 2020
/
Accepted: 20 November 2020
/
Published: 26 November 2020
(This article belongs to the Section Optics and Lasers)
Abstract
:We experimentally measured the femtosecond pulse transmission through a silicon-on-insulator (SOI) nanowire waveguide under different temperatures and input pulse energy with a cross-correlation frequency-resolved optical gating (XFROG) measurement setup. The experimental results demonstrated that the temperature and pulse energy dependence of the Si photonic nanowire waveguide (SPNW) is interesting rather than just monotonous or linear, and that the suitable temperature and pulse-energy range is as suggested in this experiment, which will be valuable for analyzing the practical design of the operating regimes and the fine dispersion engineering of various ultrafast photonic applications based on the SPNWs. The research results will contribute to developing the SPNWs with photonic elements and networks compatible with mature complementary metal–oxide–semiconductors (CMOS).
1. Introduction
With the ability to tightly confine optical modes [1] and its compatibility with mature complementary metal–oxide–semiconductors (CMOS) technologies [2], silicon photonic nanowire waveguides (SPNWs) have been extensively studied [3,4,5] for various photonic technologies, such as temporal soliton-effects compression [6,7,8], four-wave mixing [9,10,11], optical switching [12], and all-optical modulation [13,14]. As a basic platform for many photonic technologies and elements, such as silicon photonic crystal waveguide [15,16] and micro-rings [17,18,19,20], which can be widely used in many applications [15,16,17,18,21], the SPNWs’ flexibility for applications should be analyzed, especially their environmental temperature adaptability [19,20,22,23]. The thermo-optic coefficient (TOC) of 1.86 × 10⁻⁴ K−1 is large enough to show that the device is extremely sensitive to temperature [23,24]. The thermo-optic coefficient, nonlinear refractive index [25], Kerr nonlinearity, and two-photon absorption [26,27] have been researched in many materials such as Si, Si3N4, and SiOx [26,27,28]. The Mach-Zehnder interferometer (MZI)-based temperature sensor with hybrid waveguides on silicon [4,23,29], the all-silicon interferometer [30], the precision distance measurement [27], and so on have been designed and applied in many optical, chemical, or biological processes.
For further applications in optical communications, optical signal processing, and microwave photonics, if the long pulse, i.e., the pulse duration, are not shorter than 1 ns, they will be displaced by ultra-short pulses such as femtosecond pulses and solitons [31,32]. Therefore, besides under room temperature, the propagation of the femtosecond pulses in the SPNW under a suitable range temperature around room temperature with a suitable range pulse energy is necessary for the dispersion engineering photonic elements based on the SPNWs, which have to consider the Group velocity dispersion (GVD) and various nonlinear factors that affect the pulses evolution, including self-phase modulation (SPM), two-photon absorption (TPA), free carrier absorption (FCA) and free carrier dispersion (FCD), and so on.
With the sensitive cross-correlation frequency-resolved optical gating (XFROG) measurement setup [33,34], we measured the picojoule femtosecond pulse propagation in a silicon-on-insulator (SOI) nanowire waveguide under different temperatures around room temperature for various inputs of pulse energy, so as to find the suitable temperature and pulse energy range for future applications. Variations of the temporal pulse profile and the wavelength profile under different temperatures demonstrate that the temperature and pulse energy dependence of the SPNW is not monotonous and linear, which will be valuable for analysis of the design of operating regimes and the fine dispersion engineering of various ultrafast photonic elements based on the SPNWs for optical communication, optical computing, and microwave photonics.
2. Measurement Details
The SPNW for our experiment is fabricated on a SOI wafer, which has a profile of 250 nm-Si, 3 µm-SiO2, and 500 µm-Si. The SPNW is designed as a cross-section of A0 = 450 nm × 250 nm and has a length of L = 4 mm, and is further covered by a 3-µm top silicon oxide layer. Furthermore, mode adapters are integrated into the waveguide input and output coupling facets to reduce the coupling loss to less than 3 dB per facet and suppress any facet Fabry-Perot oscillations [31]. Figure 1 shows the scanning electron microscope (SEM) image and 3-D structural detail chart of the SPNW.
The temporal and spectral profiles of the pulses were measured by the experimental setup with an attojoule-sensitive XFROG as shown in Figure 2. The mode-locked femtosecond pulse fiber laser is customized by CSA IoP, which can output femtosecond pulses with pulse duration FWHM of 150 fs and wavelength FWHM of 60 nm. To measure dynamics of ultra-short femtosecond pulses, we constructed a sensitive second-harmonic XFROG setup based on a BBO crystal (1-mm thickness, provided by CASTECH INC. CHINA) and a Horiba JY FHR1000 spectrometer with a SYMPHONY II UVCCD-1024 × 256-BIDD detector, which enabled the minimum detected pulse energy to be down to about 500 aJ, and the spectral resolution to be better than 0.1 nm. There was also a programmable, finely motorized translation stage, THORLABS Z825, which enabled the finely moving controlled retro reflector mirror to provide temporal resolution down to less than 1 fs for the measurement setup. The input pulse energy can be finely controlled by a set of half-wave plates and linear polarizers mounted on a motorized rotation stage. In order to finely control the temperature of the SPNW chip for measurement (DUT in Figure 2), the SPNW chip was bonded on a thermoelectric cooler (TEC) driven by a TEC temperature controller (THORLABS TED4015), which can provide a temperature control range of −55 to 150 °C and a temperature control resolution better than 0.002 °C. The output pulse will also be measured by an optical spectrum analyzer (Anritsu MS96A), which has a measurement wavelength resolution of 0.02 nm. A flip mirror will switch the optical path for OSA and XFROG measurements.
3. Experimental Results
The experimental results retrieved from the data measured by XFROG and OSA are shown in Figures 4–9, where the data measured by OSA were calibrated during the retrieval of data In the experiments, the pulse energy was chosen discretely, i.e., 1.1, 2.7, 5.3, 13.3, 26.7, and 35.2 pJ, respectively, and the temperature was set to 12, 25, and 52.8 °C for every pulse energy measurement. The central wavelength of the input femtosecond pulse for measurements was 1550 nm, the temporal and spectral profiles of which are shown in Figure 3. The input pulse contains double temporal peaks (as shown in Figure 3a), with FWHM 113.4 fs and 89.3 fs, and a hollow down to 0.4 existing in the normalized wavelength profile to perform double spectral peaks, which will help us to analyze the dynamics further.
Figure 4 and Figure 5 illustrate that the pulse will show pulse acceleration, splitting, and trailing, which become more obvious when the input pulse energy increases at room temperature (25 °C) and low temperature (12 °C). Furthermore, the front sub-pulse shows pulse acceleration with low input pulse energies, and shows broadening and multiple tiny spikes splitting with higher input pulse energies. Furthermore, from the spectral lines, we found that the output pulse had a sharp peak in a long wavelength with higher input pulse energy.
As shown in Figure 6, we found that, under high temperature and low pulse energy, the pulse will have a temporal profile where the acceleration will dominate the transmission, and the corresponding blue shift is clearly noticeable in the spectral lines. With the increase of pulse energy, the relative intensity of long wavelength sub-pulse increases, while the blue shift sub-pulse gradually weakens, which was the result of the output of red shift spectral peak and trailing temporal pulse.
4. Analysis and Discussion
According to the above experimental results, the femtosecond pulse will undergo a much different propagation in the waveguide for different temperatures and input pulse energy, which may owe to the thermal characteristics and the free carrier effects of the silicon. Silicon is temperature sensitive, with a large TOC of about 1.86 × 10⁻⁴ K−1. There may be many kinds of nonlinear effects with the femtosecond pulse propagation in the SPNW, such as the SPM, TPA, FCA, FCD, and Kerr nonlinearity. The main phenomena are pulse acceleration, blue shift and red shift, pulse broadening, and pulse compression with different temperatures and inputs of pulse energy, as shown in Figure 7, Figure 8, Figure 9, Figure 10, Figure 11 and Figure 12. When only the SPM and GVD are considered, the produced chirp just affects the blue shift of the pulse and is symmetrical to the front and back edges of the pulse [35]. At the same time, the TPA is proportional to the light intensity in the SOI waveguide, which produces a large number of free carriers, and then the FCD and FCA change. Kerr nonlinearity is based on the second order refractive index, and the temperature changes the index of the SPNW. The experiment above changed the inputs of pulse energy and the temperatures of the SPNW, and then separated the effect of the temperature on the refractive index as the thermo-optic effect (TOE) [36] in order to discuss the influence of temperature of the pulse transmission in the SPNW more clearly.
According to Figure 7, Figure 8 and Figure 9, in the case of low pulse energy, with the increase of temperature, the blue shift will be more remarkable and the pulse acceleration will be more developed, which is considered to be mainly induced by the FCA in silicon nanowire waveguides [35]. We also can find that, in the case of low pulse energy, the femtosecond pulse will be split into two temporal sub-peaks at low temperature, while it will be split into three spectral sub-peaks at high temperature, i.e., 1520 nm, 1540 nm, and 1584 nm at 52.8 °C, which also confirms that the FCA effect has taken place, and that the red shift was simultaneously induced by the dispersive wave.
For the high pulse energy cases, as shown in Figure 10, Figure 11 and Figure 12, the temporal pulse split and pulse broadening was remarkable, while the spectral energy was concentrated on the red-shift wavelength, and the blue-shift part weakened and even disappeared gradually. Furthermore, the pulses decelerated rather than accelerated, which could be the result of the weakening and disappearing of the blue-shift part. Therefore, the pulse propagation will not mainly depend on the temperature, which confirms that the FCA will dominate the propagation for high pulse energy cases, in which strong pulses will produce high concentration free carriers. Thus, for the high pulse energy cases, the output pulse is similar and independent of temperature and input energy, which leads to output pulses with narrow spectral bands.
The data for Figure 7, Figure 8, Figure 9, Figure 10, Figure 11 and Figure 12 are listed in Table 1, Table 2 and Table 3. The output sharp pulses perform enhanced acceleration and pulse compression with the increase of temperature when there is a higher input of pulse energy. Relative to 12 °C, the output of sharp pulse acceleration is 283.5 fs at 25 °C and 1278.6 fs at 52.8 °C for an input energy of 1.1 pJ, 554.9 fs at 25 °C and 1834.9 fs at 52.8 °C for an input energy of 2.7 pJ, and 285.7 fs at 25 °C and 1620.2 fs at 52.8 °C for an input energy of 5.3 pJ, as shown in Table 3.
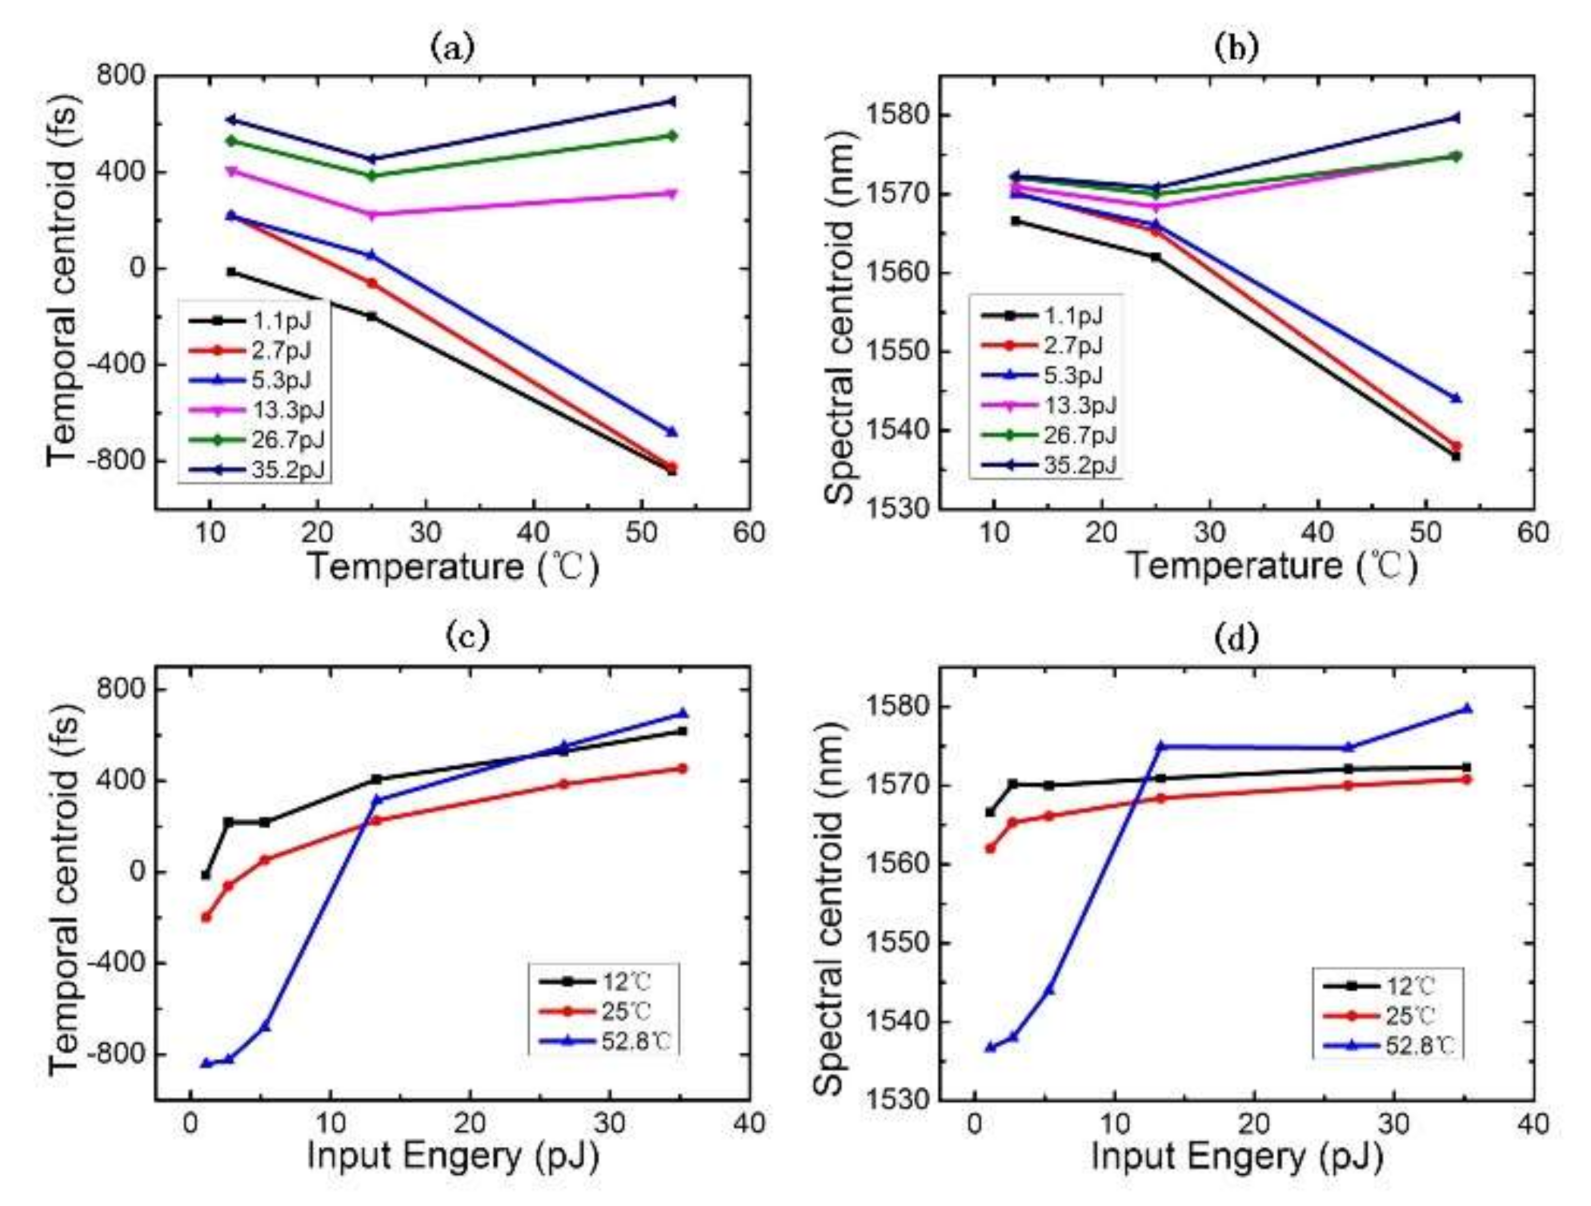
As shown in Figure 13, the output pulse temporal centroids agree with the spectral centroids for different coupled input pulse energies at different temperatures. When the energy of input pulses increased, the TPA intensity increased, as did the enhancement of FCA and FCD, and the output pulses showed pulse deceleration and red shift. The same phenomenon was illustrated in Figure 13c,d. The FCA of SPNW for femtosecond pulses caused pulse deceleration, and the TOE caused the move in the opposite direction for the femtosecond pulse [36]. Further, Figure 13a shows that the TOE caused pulse acceleration and the effect was nonlinear. The FCD of SPNW for femtosecond pulse caused pulse red shift and the TOE caused the blue shift [36]. Figure 13b shows that the TOE caused pulse blue shift and the effect was nonlinear.
As the silicon has a large temperature sensitivity due to the TOC, the indexes of the SPNW are influenced by TOC. The measurements indicate that the asymmetry of FCA and FCD is enhanced and that the nonlinear influence of TOE makes the relative intensity distribution of pulse energy change, which causes the change in pulse velocity and pulse acceleration. With the increasing temperature, the output pulses will be split and broadened to a great extent with high input pulse energy, as shown in Figure 10, Figure 11 and Figure 12 and Table 1. The TPA and FCD affect pulse broadening and splitting [35], which may lead to multi sub-peaks such as the left, the center, and the right peaks as shown in Table 1, Figure 13b, and Table 2.
In brief, for low pulse energy inputs, we should make the waveguide work at low temperature to achieve major narrow spectral peaks and temporal peaks. While for high pulse energy input, the waveguide can work stably at a wide range of temperatures.
5. Conclusions
We have observed the femtosecond pulses transmit in SPNW with different input energies at different temperatures by experiments. The large thermo-optic coefficient (TOC) of silicon has high temperature sensitivity for the device controlled by temperature. The femtosecond pulses transmit nonlinear characteristics such as SPM, FCA, FCD, TPA, Kerr nonlinearity, and TOE in SPNW. TPA intensity is influenced by the input pulse energy and can influence the free carrier concentration. Thus, TPA intensity can influence FCA and FCD. The FCA of the SPNW for femtosecond pulses causes pulse deceleration. The FCD of the SPNW for femtosecond pulses causes pulse red shift. The TOE caused pulse acceleration and blue shift, and this influence is of nonlinear variation. The output pulses are characterized by acceleration, splitting, compression, and broadening for different input energies at various temperatures. These results provide basic references for researching SPNW for femtosecond pulse applications such as photonic networks. They also show that the SPNW exports single peak femtosecond pulses with dual-peak femtosecond input pulses and achieves pulse acceleration by adjusting the SPNW temperatures and the input pulse energies. The silicon nanowire waveguide will output long wavelength sharp pulses with small central wavelength disparity by controlling the temperature and input energy. For different inputs of pulse energy, we should make the waveguide work in corresponding suitable temperatures. The research results will contribute to the SPNWs’ development for photonic elements and networks compatible with mature CMOS.
Author Contributions
Conceptualization, X.L.; and X.W.; validation, M.F.; investigation, J.L.; data curation, X.W.; writing—original draft preparation, X.W.; writing—review and editing, X.L.; supervision, H.Y.; All authors have read and agreed to the published version of the manuscript.
Funding
National Science Foundation of China (NSFC) (61070040, 61108089, 61205087, 61107005 62005207), Hunan Provincial Natural Science Foundation of China (805297133191), Natural Science Foundation of Shaanxi Province (2019JQ-648).
Acknowledgments
The authors acknowledge assistance from Ken Liu.
Conflicts of Interest
The authors declare no conflict of interest.
References
- Almeida, V.R.; Barrios, C.A.; Panepucci, R.R.; Lipson. M. All-optical control of light on a silicon chip. Nature 2004, 431, 1081–1084. [Google Scholar] [CrossRef]
- Dai, D.; Bowers, J.E. Novel concept for ultracompact polarization splitter-rotator based on silicon nanowires. Opt. Express 2011, 19, 10940–10949. [Google Scholar] [CrossRef] [Green Version]
- Foster, M.A.; Turner, A.C.; Lipson, M.; Gaeta, A.L. Nonlinear optics in photonic nanowires. Opt. Express 2008, 16, 1300–1320. [Google Scholar] [CrossRef] [PubMed]
- Velasco, A.V.; Cheben, P.; Bock, P.J.; Delâge, A.; Schmid, J.H.; Lapointe, J.; Janz, S.; Calvo, M.L.; Xu, D.; Czyk, M.A.F.; et al. High-resolution Fourier-transform spectrometer chip with microphotonic silicon spiral waveguides. Opt. Lett. 2013, 38, 706–708. [Google Scholar] [CrossRef] [PubMed]
- Liu, K.; Xu, W.; Zhu, Z.H.; Ye, W.M.; Yuan, X.D.; Zeng, C. Wave propagation in deep-subwavelength mode waveguides. Opt. Lett. 2012, 37, 2826–2828. [Google Scholar] [CrossRef] [PubMed]
- Tan, D.T.H.; Sun, P.C.; Fainman, Y. Monolithic nonlinear pulse compressor on a silicon chip. Nat. Commun. 2010, 1, 116. [Google Scholar] [CrossRef] [Green Version]
- Foster, M.A.; Gaeta, A.L.; Cao, Q.; Trebino, R. Soliton-effect compression of supercontinuum to few-cycle durations in photonic nanowires. Opt. Express 2005, 13, 6848–6855. [Google Scholar] [CrossRef]
- Zhou, H.; Huang, S.; Li, X.; McMillan, J.F.; Zhang, C.; Wong, K.K.; Yu, M.; Lo, G.; Kwong, D.; Qiu, K.; et al. Real-time dynamics and cross-correlation gating spectroscopy of free-carrier Drude slow-light solitons. Light Sci. Appl. 2017, 6, P49–P56. [Google Scholar] [CrossRef] [Green Version]
- Driscoll, J.B.; Ophir, N.; Grote, R.R.; Dadap, J.I.; Panoiu, N.C.; Bergman, K.; Osgood, R.M. Width-modulation of Si photonic wires for quasi-phase-matching of four-wave-mixing: Experimental and theoretical demonstration. Opt. Express 2012, 20, 9227–9242. [Google Scholar] [CrossRef]
- McMillan, J.F.; Yu, M.; Kwong, D.-L.; Wong, C.W. Observations of four-wave mixing in slow-light silicon photonic crystal waveguides. Opt. Express 2010, 18, 15484–15497. [Google Scholar] [CrossRef] [Green Version]
- Kuyken, B.; Verheyen, P.; Tannouri, P.; Liu, X.; Campenhout, J.V.; Baets, R.; Green, W.M.J.; Roelkens, G. Generation of 3.6 μm radiation and telecom-band amplification by four-wave mixing in a silicon waveguide with normal group velocity dispersion. Opt. Lett. 2014, 39, 1349–1352. [Google Scholar] [CrossRef] [Green Version]
- Yin, L.; Zhang, J.; Fauchet, P.M.; Agrawal, G.P. Optical switching using nonlinear polarization rotation inside silicon waveguides. Opt. Lett. 2009, 34, 476–478. [Google Scholar] [CrossRef]
- Jacome, K.L.; Poulton, C.; Leuthold, J.; Freude, W. Nonlinear silicon-on-insulator waveguides for all-optical signal processing. Opt. Express 2007, 15, 5976–5990. [Google Scholar]
- Husko, C.A.; Rossi, A.; Combrie, S.; Tran, Q.V.; Raineri, F.; Wong, C.W. Ultrafast all-optical modulation in GaAs photonic crystal cavities. Appl. Phys. Lett. 2009, 94, 021111. [Google Scholar] [CrossRef]
- Colman, P.; Husko, C.; Combrie, S.; Sagnes, I.; Wong, C.W.; de Rossi, A. Temporal solitons and pulse compression in photonic crystal waveguides. Nat. Photonics 2010, 4, 862–868. [Google Scholar] [CrossRef]
- Kondo, K.; Baba, T. Dynamic wavelength conversion in copropagating slow-light pulses. Phys. Rev. Lett. 2014, 112, 223904. [Google Scholar] [CrossRef]
- Wakabayashi, R.; Fujiwara, M.; Yoshino, K.; Nambu, Y.; Sasaki, M.; Aoki, T. Time-bin entangled photon pair generation from Si micro-ring resonator. Opt. Express 2015, 23, 1103–1113. [Google Scholar] [CrossRef] [Green Version]
- Uddin, M.R.; Lingas, N.A.; Nakarmi, B.; Won, Y.H. Waveguide side-wall angle dependant resonance of a Si micro ring-resonato. In Proceedings of the Conference on Lasers and Electro-Optics Pacific Rim Optical Society of America, Busan, Korea, 24–28 August 2015. [Google Scholar]
- Guha, B.; Cardenas, J.; Lipson, M. Athermal silicon microring resonators with titanium oxide cladding. Opt. Express 2013, 21, 26557–26563. [Google Scholar] [CrossRef] [Green Version]
- Teng, J.; Dumon, P.; Bogaerts, W.; Zhang, H.; Jian, X.; Han, X.; Zhao, M.; Morthier, G.; Baets, R. Athermal Silicon-on-insulator ring resonators by overlaying a polymer cladding on narrowed waveguides. Opt. Express 2009, 17, 14627–14632. [Google Scholar] [CrossRef] [Green Version]
- Nguyen, H.C.; Sakai, Y.; Shinkawa, M.; Ishikura, N.; Baba, T. Photonic crystal silicon optical modulators carrier-injection and depletion at 10 Gb/s. IEEE J. Quantum Electron. 2012, 48, 210–220. [Google Scholar] [CrossRef]
- Guan, X.; Wang, X.; Frandsen, L.H. Optical temperature sensor with enhanced sensitivity by employing hybrid waveguides in a silicon Mach-Zehnder interferometer. Opt. Express 2016, 24, 16349–16356. [Google Scholar] [CrossRef] [PubMed] [Green Version]
- Klimov, N.N.; Mittal, S.; Berger, M.; Ahmed, Z. On-chip silicon waveguide Bragg grating photonic temperature sensor. Opt. Lett. 2015, 40, 3934–3936. [Google Scholar] [CrossRef] [PubMed]
- Furukawa, K.; Ohsuye, K. Effect of culture temperature on a recombinant CHO cell line producing a Cterminal α-amidating enzyme. Cytotechnology 1998, 26, 153–164. [Google Scholar] [CrossRef] [PubMed]
- Trenti, A.; Borghi, M.; Biasi, S.; Ghulinyan, M.; Ramiro-Manzano, F.; Pucker, G.; Pavesi, L. Thermo-optic coefficient and nonlinear refractive index of silicon oxynitride waveguides. AIP Adv. 2018, 8, 025311. [Google Scholar] [CrossRef]
- Sinclair, G.F.; Tyler, N.A.; Barreto, D.S.J.; Thompson, M.G. Temperature dependence of the Kerr nonlinearity and two-photon absorption in a silicon waveguide at 1.55 μm. Phys. Rev. Appl. 2019, 11, 044084. [Google Scholar] [CrossRef] [Green Version]
- Tanaka, Y.; Tominaka, S.; Kurokawa, T. Precision distance measurement using a twophoton absorption process in a silicon avalanche photodiode with saw-tooth phase modulation. Appl. Opt. 2015, 54, E35–E40. [Google Scholar] [CrossRef]
- Arbabi, A.; Goddard, L.L. Measurements of the refractive indices and thermo-optic coefficients of Si3N4 and SiOx using microring resonances. Opt. Lett. 2013, 38, 3878–3881. [Google Scholar] [CrossRef]
- Uenuma, M.; Moooka, T. Temperature-independent silicon waveguide optical filter. Opt. Lett. 2009, 34, 599–601. [Google Scholar] [CrossRef]
- Guan, X.; Frandsen, L.H. All-silicon interferometer with multimode waveguides for temperature-insensitive filters and compact biosensors. Opt. Express 2019, 27, 753–760. [Google Scholar] [CrossRef]
- Yin, L.; Lin, Q.; Agrawal, G.P. Soliton fission and supercontinuum generation in silicon waveguides. Opt. Lett. 2007, 32, 391–393. [Google Scholar] [CrossRef]
- Fleischer, J.W.; Segev, M.; Efremidis, N.K.; Christodoulides, D.N. Observation of two-dimensional discrete solitons in optically-induced nonlinear photonic lattices. Nature 2003, 422, 147–150. [Google Scholar] [CrossRef] [PubMed]
- Reid, D.T.; Loza-Alvarez, P.; Brown, C.T.A.; Beddard, T.; Sibbett, W. Amplitude and phase measurement of mid-infrared femtosecond pulses by using cross-correlation frequency-resolved optical gating. Opt. Lett. 2000, 25, 1478–1480. [Google Scholar] [CrossRef] [PubMed]
- Parker, D.S.N.; Nunn, A.D.G.; Minns, R.S.; Fielding, H.H. Frequency doubling and fourier domain shaping the output if a femtosecond optical parametric amplifier: Easy access to tuneable femtosecond pulse shapes in the deep ultraviolet. Appl. Phys. B 2009, 94, 181–186. [Google Scholar] [CrossRef]
- Liao, J.; Marko, M.; Li, X.; Jia, H.; Liu, J.; Tan, Y.; Yang, J.; Zhang, Y.; Tang, W.; Yu, M.; et al. Cross-correlation frequency-resolved optical gating and dynamics of temporal solitons in silicon nanowire waveguides. Opt. Lett. 2013, 38, 4401–4404. [Google Scholar] [CrossRef] [PubMed]
- Nikitin, A.A.; Kondrashov, A.V.; Vitko, V.V.; Ryabcev, L.A.; Zaretskaya, G.A.; Cheplagin, N.A.; Konkin, D.A.; Kokolov, A.A.; Babak, L.I.; Ustinov, A.B.; et al. Carrier-induced optical bistability in the silicon micro-ring resonators undercontinuous wave pumping. Opt. Commun. 2020, 480, 126456. [Google Scholar] [CrossRef]
Figure 1.
The structural diagram of the Si photonic nanowire waveguide (SPNW). (a) 3-D structure detail chart with top right 45-degree view. (b) Top view SEM of the partial SPNW before overlaying the top silicon oxide layer. (c) SEM of the right view after overlaying the top silicon oxide layer.
Figure 1.
The structural diagram of the Si photonic nanowire waveguide (SPNW). (a) 3-D structure detail chart with top right 45-degree view. (b) Top view SEM of the partial SPNW before overlaying the top silicon oxide layer. (c) SEM of the right view after overlaying the top silicon oxide layer.

Figure 2.
The experimental setup with cross-correlation frequency-resolved optical gating (XFROG). BS: Beam splitter; FL: Focusing lens; TEC: Thermo electric cooler; DUT: SPNW chip; TED 4015: TEC temperature controller; FM: Flip mirror; RF: Reflector; OSA: optical spectrum analyzer; DM: D-shaped mirror; RM: Retro reflector mirror; CL: Bi-convex lens; BBO: barium borate crystal; SM: Spectrometer with charge-coupled detector (CCD).
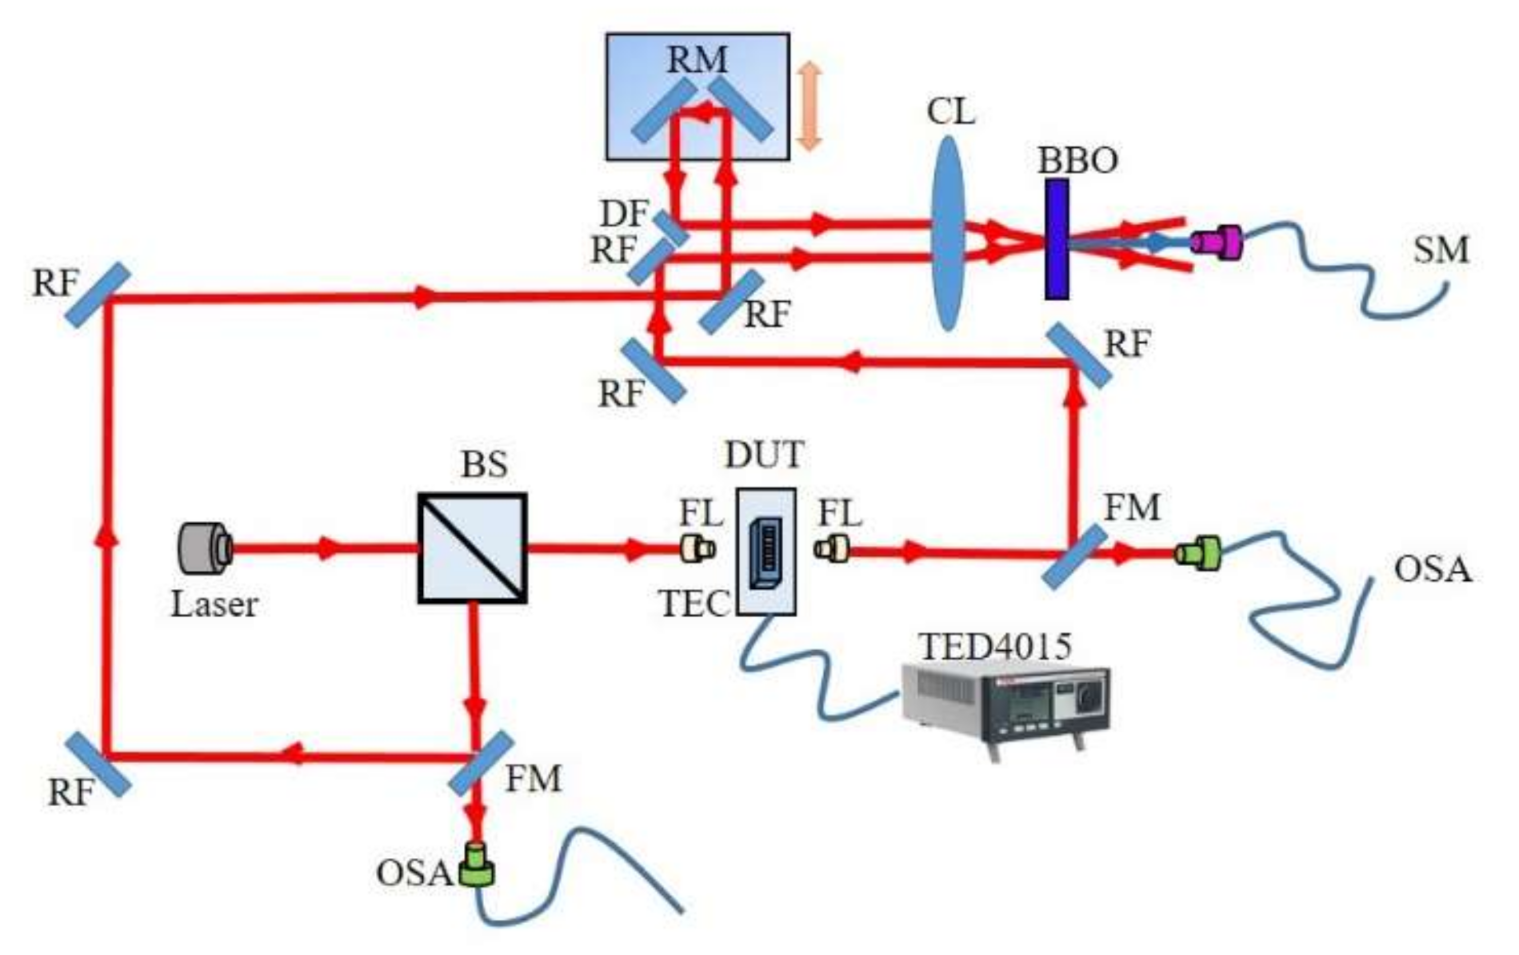
Figure 3.
Temporal intensity profiles (a) and spectral intensity profiles (b) of the input pulses.

Figure 4.
Temporal and spectral intensity profiles of the output pulses retrieved from the XFROG measurements for the coupled pulse energies that increased from 1.1 pJ to 35.2 pJ at the temperature of 12 °C.
Figure 4.
Temporal and spectral intensity profiles of the output pulses retrieved from the XFROG measurements for the coupled pulse energies that increased from 1.1 pJ to 35.2 pJ at the temperature of 12 °C.

Figure 5.
Temporal and spectral intensity profiles of the output pulses retrieved from the XFROG measurements for the coupled pulse energies that increased from 1.1 pJ to 35.2 pJ at the temperature of 25 °C.
Figure 5.
Temporal and spectral intensity profiles of the output pulses retrieved from the XFROG measurements for the coupled pulse energies that increased from 1.1 pJ to 35.2 pJ at the temperature of 25 °C.

Figure 6.
Temporal and spectral intensity profiles of the output pulses retrieved from the XFROG measurements for the coupled pulse energies that increased from 1.1 pJ to 35.2 pJ at the temperature of 52.8 °C.
Figure 6.
Temporal and spectral intensity profiles of the output pulses retrieved from the XFROG measurements for the coupled pulse energies that increased from 1.1 pJ to 35.2 pJ at the temperature of 52.8 °C.
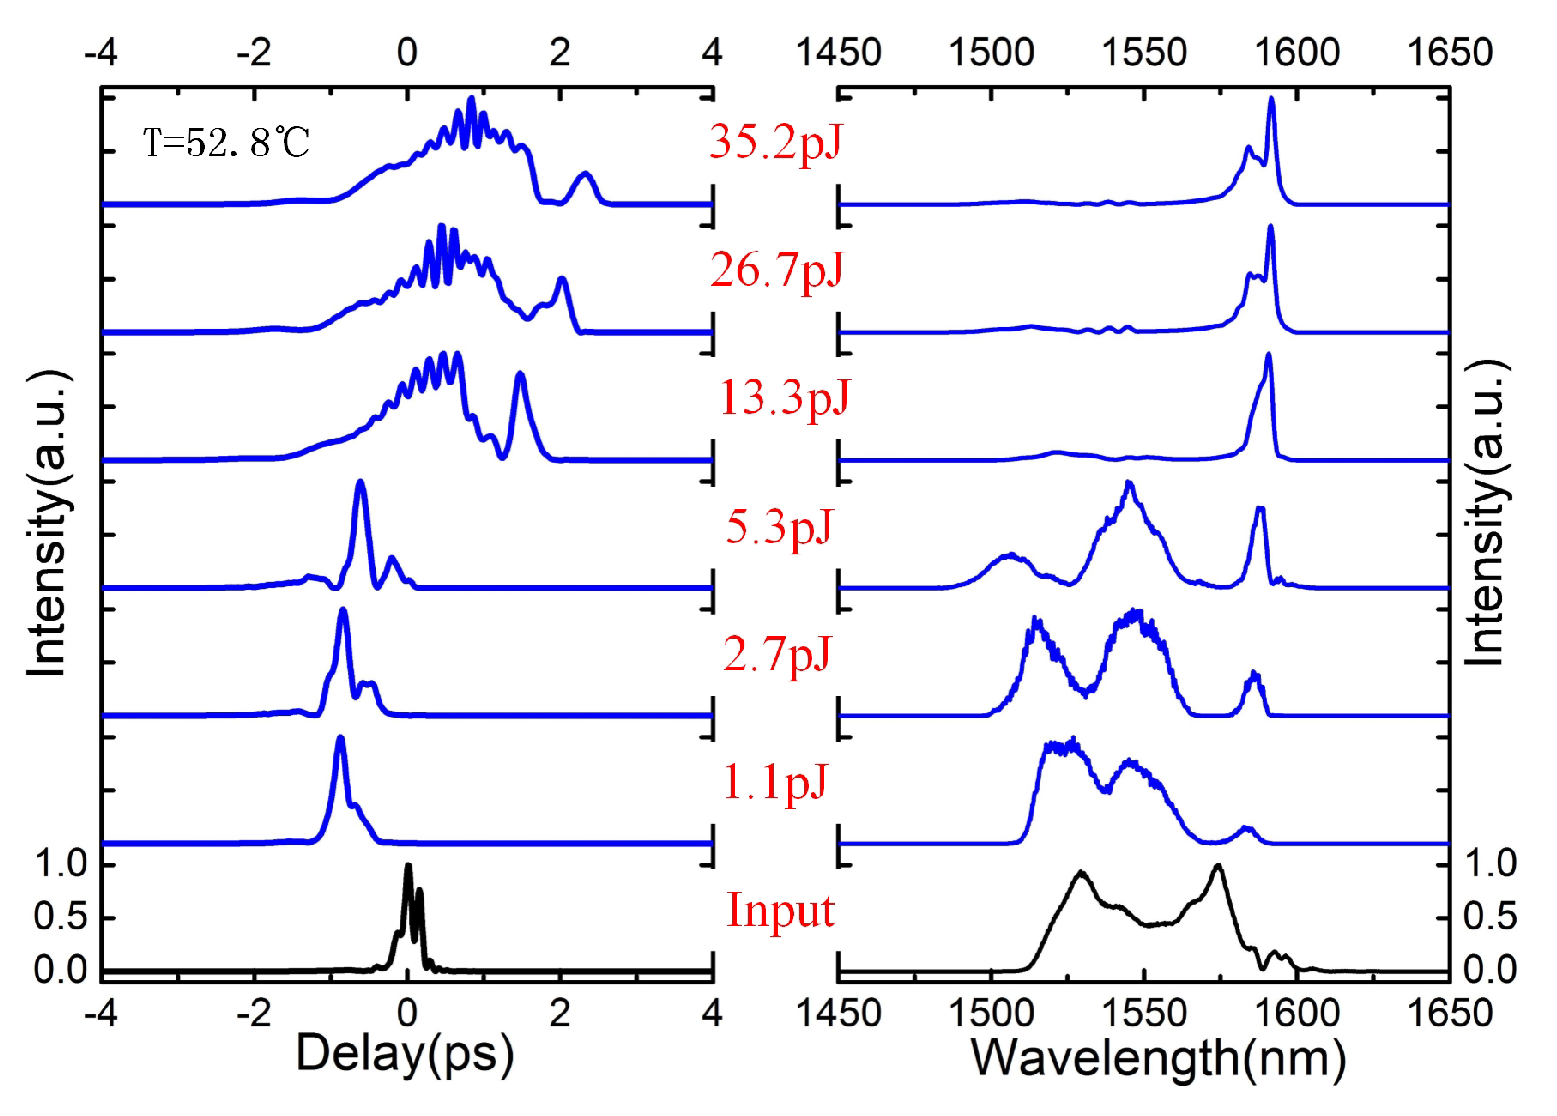
Figure 7.
Temporal intensity profiles (a) and spectral intensity profiles (b) of the output pulses retrieved from the XFROG measurements for 1.1 pJ input pulse energy at temperatures of 12 °C, 25 °C, and 52.8 °C.
Figure 7.
Temporal intensity profiles (a) and spectral intensity profiles (b) of the output pulses retrieved from the XFROG measurements for 1.1 pJ input pulse energy at temperatures of 12 °C, 25 °C, and 52.8 °C.
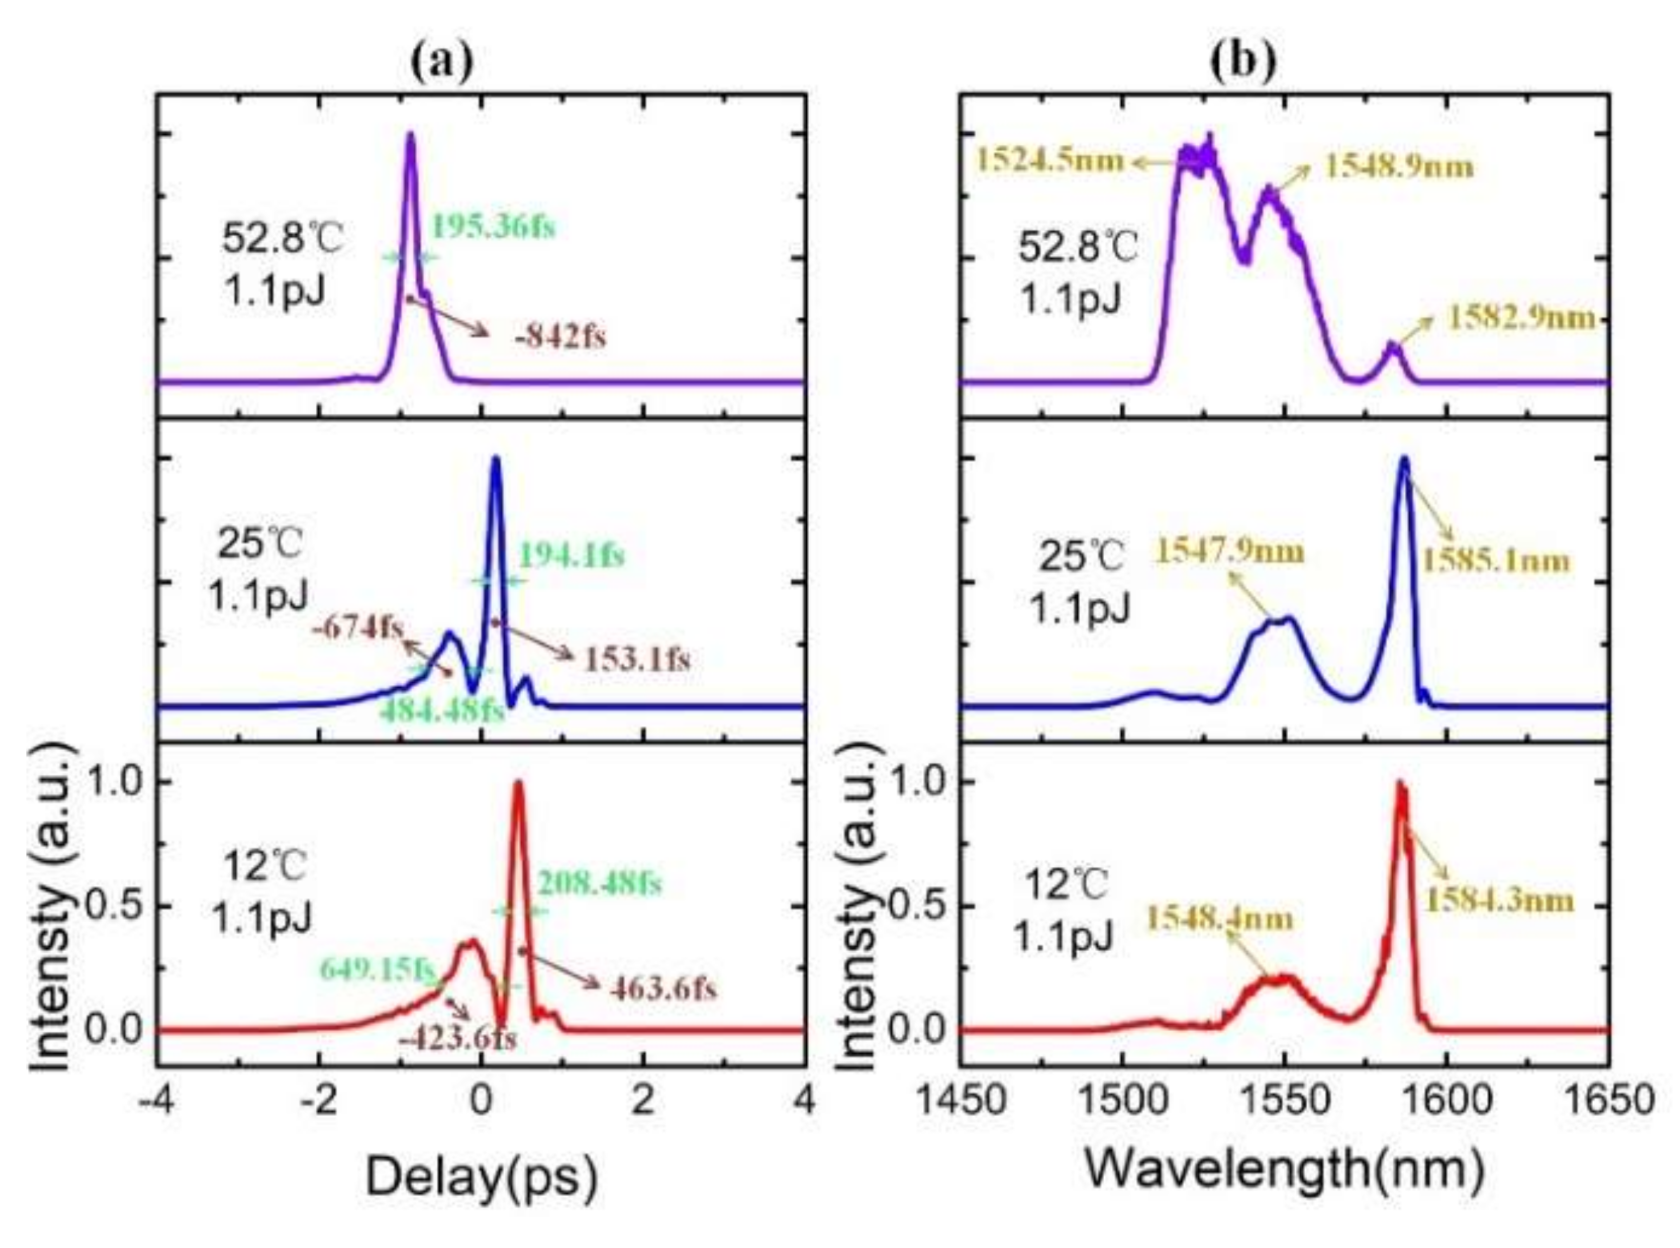
Figure 8.
Temporal intensity profiles (a) and spectral intensity profiles (b) of the output pulses retrieved from the XFROG measurements for 2.7 pJ input pulse energy at temperatures of 12 °C, 25 °C, and 52.8 °C.
Figure 8.
Temporal intensity profiles (a) and spectral intensity profiles (b) of the output pulses retrieved from the XFROG measurements for 2.7 pJ input pulse energy at temperatures of 12 °C, 25 °C, and 52.8 °C.
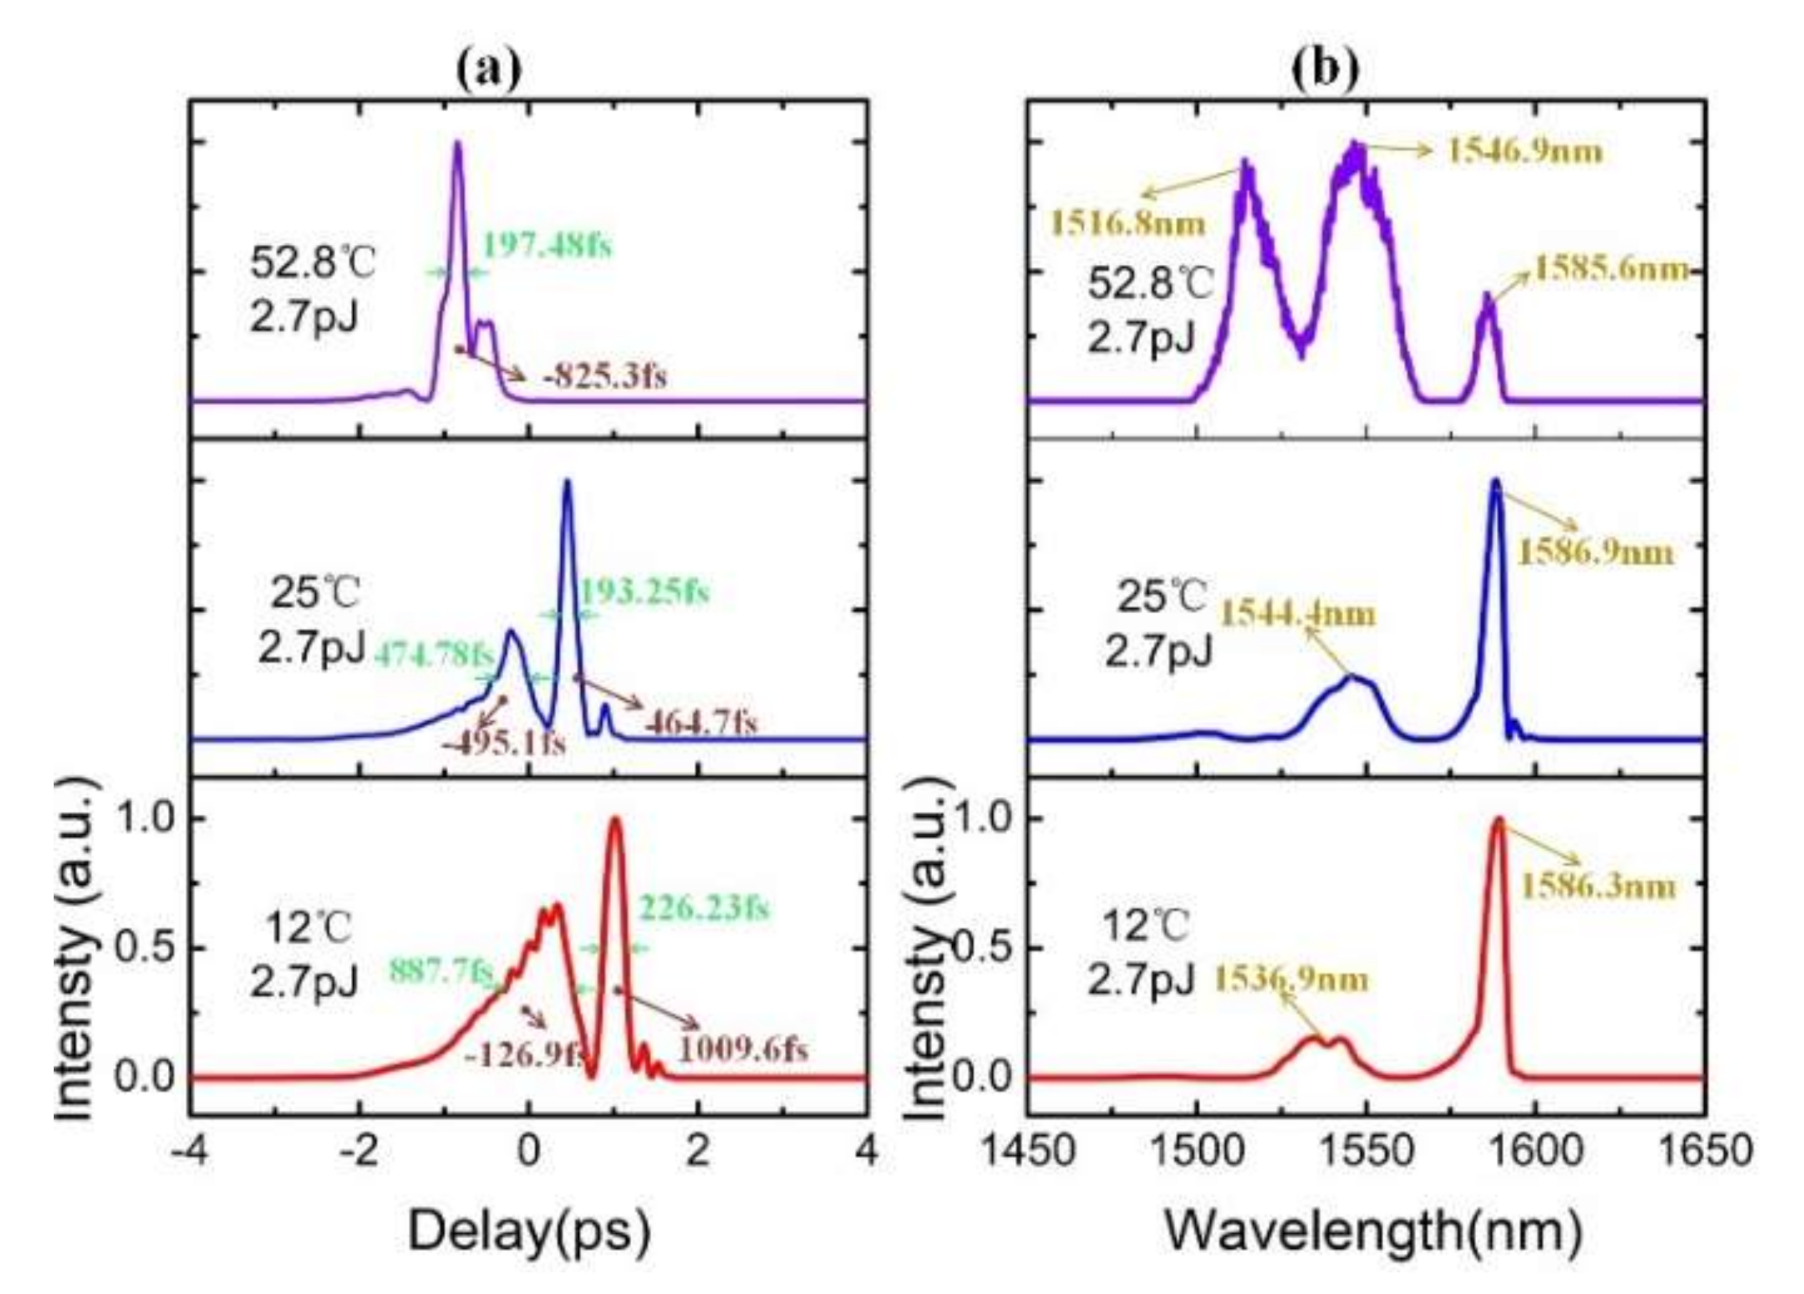
Figure 9.
Temporal intensity profiles (a) and spectral intensity profiles (b) of the output pulses retrieved from the XFROG measurements for 5.3 pJ input pulse energy at temperatures of 12 °C, 25 °C, and 52.8 °C.
Figure 9.
Temporal intensity profiles (a) and spectral intensity profiles (b) of the output pulses retrieved from the XFROG measurements for 5.3 pJ input pulse energy at temperatures of 12 °C, 25 °C, and 52.8 °C.
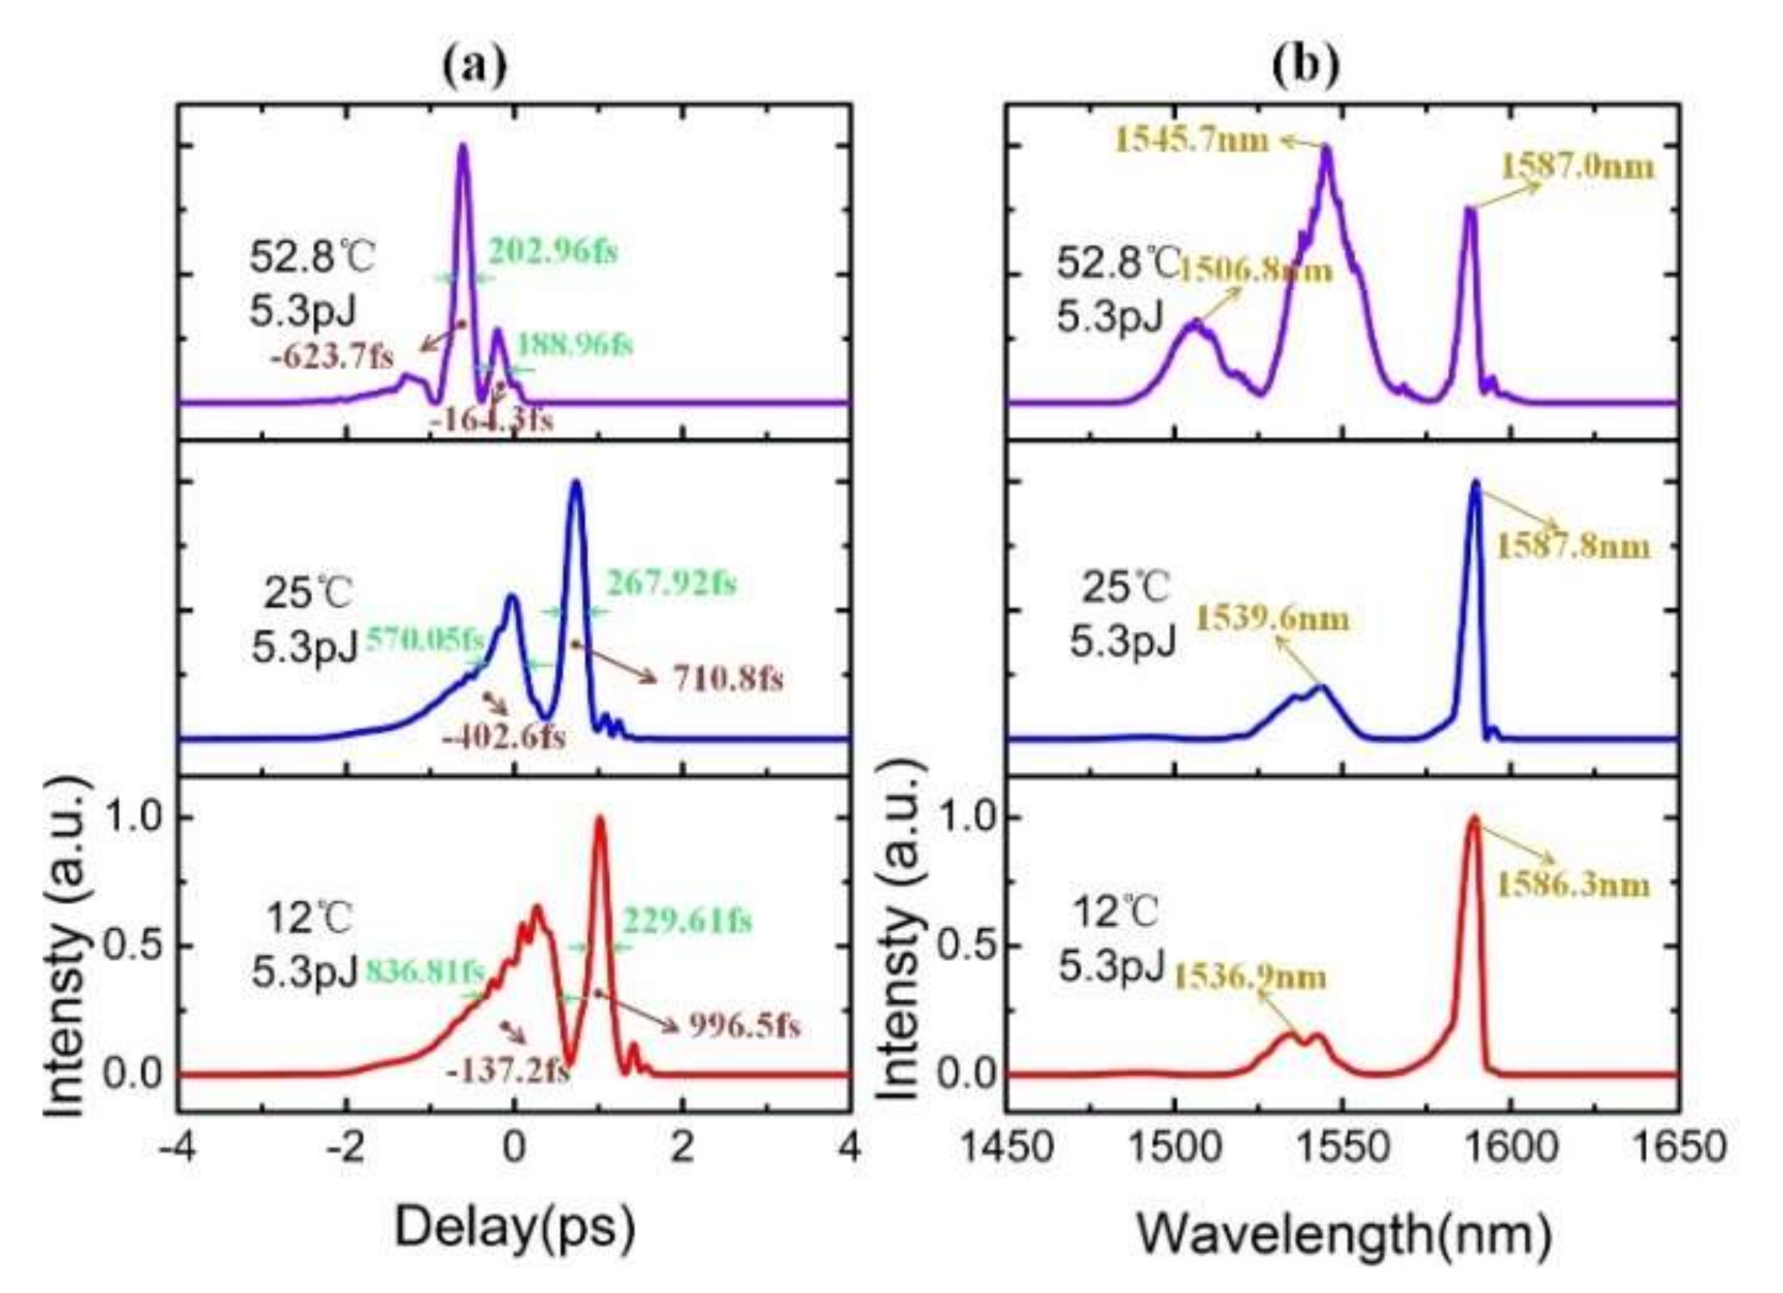
Figure 10.
Temporal intensity profiles (a) and spectral intensity profiles (b) of the output pulses retrieved from the XFROG measurements for 13.3 pJ input pulse energy at temperatures of 12 °C, 25 °C, and 52.8 °C.
Figure 10.
Temporal intensity profiles (a) and spectral intensity profiles (b) of the output pulses retrieved from the XFROG measurements for 13.3 pJ input pulse energy at temperatures of 12 °C, 25 °C, and 52.8 °C.

Figure 11.
Temporal intensity profiles (a) and spectral intensity profiles (b) of the output pulses retrieved from the XFROG measurements for 26.7 pJ input pulse energy at different temperatures of 12 °C, 25 °C, and 52.8 °C.
Figure 11.
Temporal intensity profiles (a) and spectral intensity profiles (b) of the output pulses retrieved from the XFROG measurements for 26.7 pJ input pulse energy at different temperatures of 12 °C, 25 °C, and 52.8 °C.

Figure 12.
Temporal intensity profiles (a) and spectral intensity profiles (b) of the output pulses retrieved from the XFROG measurements for 35.2 pJ input pulse energy at temperatures of 12 °C, 25 °C, and 52.8 °C.
Figure 12.
Temporal intensity profiles (a) and spectral intensity profiles (b) of the output pulses retrieved from the XFROG measurements for 35.2 pJ input pulse energy at temperatures of 12 °C, 25 °C, and 52.8 °C.
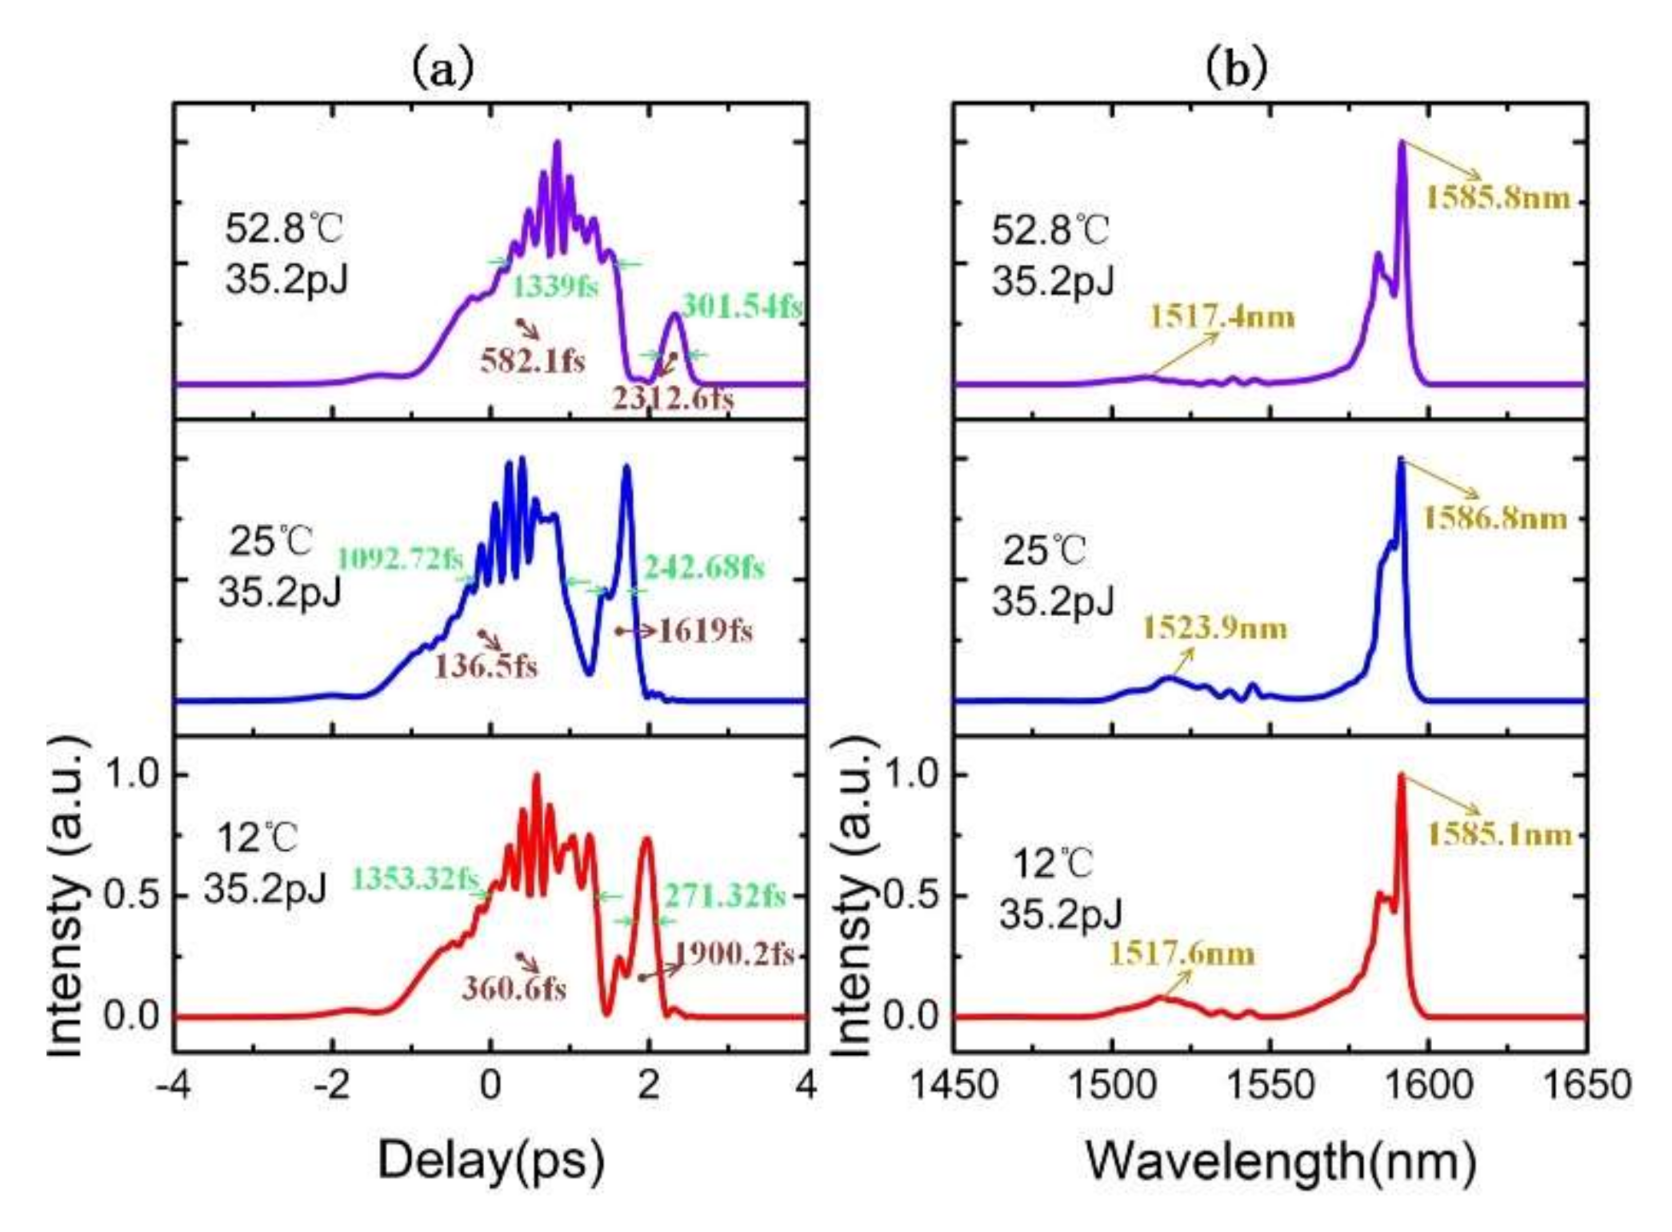
Figure 13.
Temporal centroid (a,c) and spectral centroid (b,d) for different input pulses energies while the SPNW is at different temperatures.
Figure 13.
Temporal centroid (a,c) and spectral centroid (b,d) for different input pulses energies while the SPNW is at different temperatures.

Table 1.
Pulse duration of the output pulses measured by XFROG (FWHM).
| Pulse Energy (pJ) | 12.0 °C | 25.0 °C | 52.8 °C | ||||||
|---|---|---|---|---|---|---|---|---|---|
| FWHM (fs) | FWHM (fs) | FWHM (fs) | |||||||
| Ahead | Back | Total | Ahead | Back | Total | Ahead | Back | Total | |
| 1.1 | 649.15 | 208.48 | 208.48 | 484.48 | 194.10 | 194.10 | 195.36 | NON | 195.36 |
| 2.7 | 887.7 | 226.23 | 226.23 | 474.78 | 193.25 | 193.25 | 197.48 | NON | 197.48 |
| 5.3 | 836.81 | 229.61 | 229.61 | 570.05 | 267.92 | 267.92 | 202.96 | 188.96 | 202.96 |
| 13.3 | 1135.16 | 273.88 | 273.88 | 1046.80 | 321.30 | 321.30 | 1046.63 | 225.64 | 1046.63 |
| 26.7 | 1230.85 | 276.72 | 1230.85 | 1126.26 | 246.35 | 246.35 | 1125.00 | 378.96 | 1125.00 |
| 35.2 | 1353.32 | 271.32 | 1353.32 | 1092.72 | 242.68 | 242.68 | 1339.00 | 301.54 | 1339.00 |
Table 2.
Spectral pulse centroids of the output pulses.
| Pulse Energy (pJ) | 12.0 °C | 25.0 °C | 52.8 °C | ||||||
|---|---|---|---|---|---|---|---|---|---|
| Centroid (nm) | Centroid (nm) | Centroid (nm) | |||||||
| Left | Center | Right | Left | Center | Right | Left | Center | Right | |
| 1.1 | 1548.4 | NON | 1584.3 | 1547.9 | NON | 1585.1 | 1524.5 | 1548.9 | 1582.9 |
| 2.7 | 1536.9 | NON | 1586.3 | 1544.4 | NON | 1586.9 | 1516.8 | 1546.9 | 1585.6 |
| 5.3 | 1536.9 | NON | 1586.3 | 1539.6 | NON | 1587.8 | 1506.8 | 1545.7 | 1587.0 |
| 13.3 | 1527.0 | NON | 1586.2 | 1531.4 | NON | 1587.9 | 1528.9 | NON | 1587.6 |
| 26.7 | 1520.1 | NON | 1585.3 | 1525.9 | NON | 1587.2 | 1519.3 | NON | 1586.1 |
| 35.2 | 1517.6 | NON | 1585.1 | 1523.9 | NON | 1586.8 | 1517.4 | NON | 1585.8 |
Table 3.
Temporal pulse centroids of the output pulses.
| Pulse Energy (pJ) | 12.0 °C | 25.0 °C | 52.8 °C | ||||||
|---|---|---|---|---|---|---|---|---|---|
| Centroid (fs) | Centroid (fs) | Centroid (fs) | |||||||
| Ahead | Back | Total | Ahead | Back | Total | Ahead | Back | Total | |
| 1.1 | −423.6 | 463.6 | −14.1 | −674.0 | 153.1 | −199.0 | NON | NON | −842.0 |
| 2.7 | −126.9 | 1009.6 | 218.9 | −495.1 | 464.7 | −60.1 | NON | NON | −825.3 |
| 5.3 | −137.2 | 996.5 | 217.5 | −402.6 | 710.8 | 53.1 | −623.7 | −164.3 | −680.3 |
| 13.3 | 105.4 | 1455.0 | 406.5 | 175.5 | 1105.1 | 224.7 | 101.5 | 1519.8 | 313.1 |
| 26.7 | 192.9 | 1608.5 | 529.8 | 35.2 | 1474.4 | 384.9 | 346.0 | 1950.2 | 551.9 |
| 35.2 | 360.6 | 1900.2 | 617.9 | 136.5 | 1619.0 | 454.0 | 582.1 | 2312.6 | 694.0 |
Publisher’s Note: MDPI stays neutral with regard to jurisdictional claims in published maps and institutional affiliations. |
© 2020 by the authors. Licensee MDPI, Basel, Switzerland. This article is an open access article distributed under the terms and conditions of the Creative Commons Attribution (CC BY) license (http://creativecommons.org/licenses/by/4.0/).
Share and Cite
MDPI and ACS Style
Wang, X.; Fu, M.; Yang, H.; Liao, J.; Li, X. Temperature and Pulse-Energy Range Suitable for Femtosecond Pulse Transmission in Si Nanowire Waveguide. Appl. Sci. 2020, 10, 8429. https://doi.org/10.3390/app10238429
AMA Style
Wang X, Fu M, Yang H, Liao J, Li X. Temperature and Pulse-Energy Range Suitable for Femtosecond Pulse Transmission in Si Nanowire Waveguide. Applied Sciences. 2020; 10(23):8429. https://doi.org/10.3390/app10238429
Chicago/Turabian StyleWang, Xiaochun, Meicheng Fu, Heng Yang, Jiali Liao, and Xiujian Li. 2020. "Temperature and Pulse-Energy Range Suitable for Femtosecond Pulse Transmission in Si Nanowire Waveguide" Applied Sciences 10, no. 23: 8429. https://doi.org/10.3390/app10238429
Note that from the first issue of 2016, this journal uses article numbers instead of page numbers. See further details here.