Detecting Deformation on Pantograph Contact Strip of Railway Vehicle on Image Processing and Deep Learning

1
Department of Transportation Engineering, Korea University of Science & Technology, Daejeon 34113, Korea
2
Smart Electrical & Signaling Division, Korea Railroad Research Institute, Gyeonggi-do 16105, Korea
*
Author to whom correspondence should be addressed.
Appl. Sci. 2020, 10(23), 8509; https://doi.org/10.3390/app10238509
Submission received: 8 July 2020
/
Revised: 18 November 2020
/
Accepted: 24 November 2020
/
Published: 28 November 2020
(This article belongs to the Special Issue Computing and Artificial Intelligence for Visual Data Analysis)
Abstract
:An electric railway vehicle is supplied with electricity by an OCL (Overhead Contact Line) through the contact strip of its pantograph. This transmitted electricity is then used to power the electrical equipment of the railway vehicle. This contact strip wears out due to contact with the OCL. In particular, deformations due to chipping and material loss occur because of friction with the fittings on the OCL. These deformations on the contact strip affect its power transmission quality because of contact loss with the OCL. However, it is difficult to monitor the contact strip during operation and judge its condition in order to implement accident prevention measures. Thus, in this study, we developed a contact strip monitoring method based on image processing for inspection. The proposed method measures the deformation in the contact strip based on an algorithm that determines the wear on the deformed contact strip using deep learning and image processing. The image of the contact strip is acquired by installing a camera and laser to capture the pantograph as it passes the setup. The proposed algorithm is able to determine the wear size by extracting the edges of the laser line using deep learning and estimating the fitted line of the deformations based on the least squares method.
1. Introduction
Due to the proliferation of high-speed railway lines and other improvement projects, electric railway systems in the Korea are being expanded recently [1]. A typical electric railway system consists of a power system and an OCL (Overhead Contact Line) [2]. The OCL transmits electricity to a railway vehicle through contact with the pantograph installed on its roof [3]. In particular, the pantograph transmits electricity from the OCL to the electric machinery through its contact strip [4]. The contact strip of the pantograph is periodically replaced because it wears out owing to frequent contact with the OCL [5]. Deformations such as cracks and chipping often occur on the contact strip owing to friction with fittings on the OCL [6,7]. These deformations affect quality of the power transmission to the railway vehicle because of arcing due to contact loss with the OCL [8]. Moreover, these deformations also cause economic loss because of the need for frequent replacement of the contact strip and accidents due to interruptions in the electricity supply of the railway vehicle [9,10]. In Korea, railway technicians decide to replace worn-out contact strip on the railway vehicle based on visual inspection in order to prevent accidents [9]. However, because these visual inspections are performed only when the railway vehicles are not in service, it is difficult to prevent accidents due to strip deformations when they are in operation. Therefore, recently, pantograph monitoring systems based on image processing have been developed to check the condition of the contact strip [11,12,13,14,15]. This monitoring system composed of a camera and a laser are installed on the OCL. However, change in the thickness of the contact strip due to deformation can only be detected by extracting the shape and edge of the contact strip from the captured images [14,16]. In addition, the hardware including camera and laser sensor is expensive.
In this study, we propose a simple algorithm to measure the size of a wear on a deformed contact strip based on deep learning and image processing. The measurement target is a contact strip used in Korean high-speed railways. The image is acquired using a monitoring method developed in the laboratory. The experimental contact strip is physically machined to create wear, which is measured using our proposed approach. The ROI (Regions of Interest) is performed using deep learning and image processing of the deformed contact strip. The laser line acquired from the image of the contact strip is extracted through edge detection. Then, the least squares method is applied on the captured laser line to extract the fitted line of the contact strip. Subsequently, the laser line and the fitted line are compared with each other to determine the pixels indicating wear, in order to estimate the wear size. Finally, the sizes of the deformations are obtained via blob processing, which are then compared with the actual values to prove the accuracy of our proposed approach.
2. Materials and Methods
2.1. Contact Strip of the Pantograph
The contact strip of the pantograph is made of carbon. The contact area between the pantograph and the OCL is indicated in the schematic diagram shown in Figure 1a. As can be seen from the figure, the OCL is installed in a zigzag manner using poles [17]. The contact area is within ±20 cm from the center of the contact strip and enables the transmission of stable electric power to the railway vehicle while it is in contact with the OCL. A picture of an actual contact strip used in a high-speed railway vehicle in Korea is shown in Figure 1b.
The front views of the different types of deformations that can occur on the contact strip are shown in Figure 2; these deformations include chipping, material loss, and abnormal wear, which can occur during installation of fittings, due to changes in ground height, or because of staggering of the OCL [18].
Chipping wear only occurs on the upper part of the contact strip due to the strong impact of the fittings installed on the OCL; in this condition, the contact strip develops a wide split in the vertical direction. In contrast, abnormal wear occurs when the OCL is in contact with only a specific area of the contact strip despite the zigzag OCL structure. In this study, the contact strip used to test our proposed algorithm is physically machined to recreate the wear conditions shown in Figure 2.
The contact strip (Yujin Machinery Ltd., Gyeonggi-Do, Korea) for simulation is physically machined as shown in Figure 3. The shape of deformations are made by machine with reference to the existing contact strip detection technology [18]. The wear size is machined step by step to check that the basic shape is measured in image processing. Here, W is the width and H is the height which is the thickness of the contact strip.
2.2. Monitoring Equipment for the Pantograph
In this study, pantograph monitoring equipment based on image processing is implemented in the laboratory to measure the deformation in the contact strip. The monitoring equipment consists of a camera, laser, and illuminator as shown in Figure 4. It is installed in the laboratory to monitor the front and top of the contact strip. The configuration and main specifications of this monitoring equipment are shown in Table 1. The camera is a NIR (Near Infrared Ray) type with a resolution of 2048 × 1088, which considers the environment of the railway line and sharpness of the laser line on the contact strip. It is set by checking the exposure value that determines the amount of light and the gain value that amplifies the light according to the acquired image. Considering the external environment and image processing requirement, the laser line selected in our study is an IR (Infrared Ray) type; in particular, three laser lines are configured to measure the wear size on the contact area of the contact strip. These sensors are installed vertically to indicate the laser on the contact strip passing the monitoring equipment. It is calibrated by adjusting the sensitivity and thickness through a laser on the contact strip in the monitor. A trigger sensor detects the pantograph installed on the roof of the train before it passes through the camera and accordingly sends a motion signal to the components, i.e., the lasers, the illuminator and the cameras. It is calibrated by adjusting the position while checking the laser on the contact strip of the monitor. The illuminator (Cree, North Carolina, US) is a strobe-type source that generates light sufficient for acquiring images in a short time even in a dark environment such as a tunnel. The target image is to detect the contact strip (Yujin Machinery Ltd., Gyeonggi-Do, Korea) of the HEMU-430x (Highspeed Electric Multiple Unit-430 km/h eXperiment). Image processing is performed by applying the contact strip for simulation to detect the target image.
The camera is calibrated to derive accurate information of the image. The image is generally converted to a 2D coordinate in the 3D world coordinate and is influenced by the intrinsic parameter and extrinsic parameter in the camera. The intrinsic parameter is the focal length which is the distance between the lens and the image sensor, the principal point is the distance from the center of the lens to the image sensor, and the skew coefficient indicates the degree of tilt of the cell arrangement from the image sensor. The external parameters are estimated with the transformation and movement matrix parameters, considering the intrinsic parameters. The calibration of the camera installed in the monitoring equipment has 14 images that are moved on the checkerboard and result in an average reprojection pixel error, with an optimization algorithm to estimate the intrinsic and extrinsic parameters. Table 2 shows the results of the internal parameters to which the optimization algorithm is applied [19]. These show the focal length and pub of each axis, and the skew coefficient. As shown in Figure 5, the average reprojection image shows the error, comparing the pixels of the original image and the optimal pixels, using 14 images. The overall average error is 0.78 pixels. This result is applied to wear measurement in the image processing.
Figure 6 shows images of a deformed contact strip of a pantograph acquired by the monitoring equipment. This image is taken through the camera as a passively moving pantograph passes the trigger signal. In particular, Figure 6a shows a physically machined abnormal contact strip, which is used to measure deformations such as chipping, loss, and abnormal wear using our proposed equipment, while Figure 6b shows a normal contact strip that is machined evenly from the center to represent conditions of the wear which the highway speed railway in Korea is accustomed to. In this study, the abnormal contact strip shown in Figure 6a is used to closely test the wear measurement algorithm.
2.3. Wear Measurement Algorithm for the Contact Strip
The flow chart of the algorithm used for measuring the deformation condition on the front view of the contact strip is shown in Figure 7. The area of the contact strip in the image acquired by the proposed monitoring system is shown as a ROI using deep learning [20]. The laser line in the image of the contact strip is acquired to determine the deformation condition of the contact strip; in particular, the fitted line of the contact strip is extracted based on this laser line using the least squares method [20]. In order to measure the wear size, the image of the contact strip with the fitted line and laser line is subjected to post-processing to measure the size of the deformations.
2.3.1. Deep-Learning for ROI Detection
In image processing, deep learning is a CNN (Convolution Neural Network) structure used for object detection, division and classification. In this study, R (Regions)-CNN-based deep learning is applied to automatically extract the ROI of the contact strip. R-CNN is a basic algorithm used to detect objects, and the flow is shown in Figure 8. Searching the entire area of the input image slows down the process, so we apply the Selective Search algorithm to extract a box containing 2000 objects. At this time, the size of the box is 277 × 227. Next, a 4096-dimensional feature vector is extracted via a pre-trained CNN (ConvNet) and created to a fixed length. The extracted vector is classified into a bounding box using an SVM (Support Vector Machine) classifier trained for each class (objection). The Non-Maximum Suppression method selects only the box with the highest score and removes the rest, to distinguish multiple boxes at the same location The bounding boxes for the classified images found using the Selective Search algorithm are inaccurate, so the regression model is adjusted to correct the box position.
The trained convnet is shown in the Alexnet structure of the Caffe library, considering the image recognition rate. Alexnet shows the basic structure, as in Figure 9. The convolution layer, which consists of five convolution layers and three fully-connected layers, is combined with an 11 × 11, 3 × 3 mask filter to characterize the image. Then, relu which stacks multiple layers is a nonlinear function and an activation function. This function is applied to determine whether to transfer the output value to the next layer. The polling layer performs a 3 × 3 max pooling to avoid overfitting. Here, the pooling is a method of resizing the convolution layer to derive a new layer. The softmax function that normalizes to an output value between 0 and 1 is applied effectively to classify the output value (relu) for the Fully Connected layer (fc layer). The fc layer connects front layer and back layer. A cross-entropy loss function that reduces the difference between the real value and predicted value is applied to find the appropriate weight. The accuracy is confirmed to compare the input image with the image of the training model. The training data is classified into five classes with 400 images of 8 bit/image in the Graphics Processing Unit (GPU) environment of GTX 1080 which is a device that processes graphics. The data is divided into 80% training and 20% test, and 94% accuracy is confirmed through 10,000 iterations.
The test results of the training model are represented with an accuracy of 84% from the IOU (Intersection Over Union) score compared to the input image of the chipped contact strip and the trained CNN model, as shown in Figure 10. Here, overkill is a result of overfitting and underkill is a result of underfitting. In this study, the wear size is measured by extracting the ROI of the image of the contact strip, which has the highest score in the five classes.
2.3.2. Image Processing for Wear Measurement
The target image is preprocessed before extracting the edge pixels. The noise in the acquired image is removed by applying a Gaussian filter represented by Equation (1) to improve the distribution of the grey level on the image [21]. Here, x is a horizontal coordinate, y is a vertical coordinate, μ refers to an average for σ, and σ refers to a standard deviation for smoothing the image by Equation (1). If μ of each coordinate equals zero, σ of each coordinate equals σ. Pixels are accurately extracted for edge detection according to σ because the decrease of σ results in a smaller standard deviation difference in a Gaussian distribution. The σ is fixed at 1 in this study.
After applying the Gaussian filter, the top-hat transformation is used to brighten the white pixels of the laser line by Equation (2). This is derived by commuting images and structuring elements with the opening operator. Here, f is original image and b is a structuring element. The preprocessed image shows two laser lines included in white pixels as shown Figure 11. The top laser line, which is an area contrasted with the background, is selected for edge detection.
The local processing method for the linking edge is applied, considering simple pixels for edge detection using Open eVision library [22]. Local processing computes the pixels and angles of the vectorized images. The pixel compares the difference between the coordinates of the edge pixel (s,t) and the coordinates (x,y) around the edge with the threshold value (E) as shown in Equation (3). The angle is compared with the threshold value (A) in the same way as the size, as in Equation (4), to determine the edge direction.
The size and angle of the image increases the computation since all neighboring pixels of the image must be considered. For this, the area processing is organized as in Equation (5), and the g (x,y) of edge detection is divided into 0 or 1 as a binary image. Here, TM is the threshold value of the magnitude, and TA is the error range of the angle. In this study, the image of the contact strip is converted into a binary image of 0 and 255.
The fitted line is extracted by applying the least squares method based on Equation (6) for comparison with the laser line. This method determines the parameter of the estimation function by minimizing the residual sum of squares, which represents the error between the laser line and the fitted line of the estimation function. Here, the laser line is the measured edge on the image and the estimation function is the polynomial. The laser line is derived as an estimate from the polynomial and fitted into a curve. In Equation (6), yi represents the pixel value of the laser line obtained from the acquired image and xi is the estimation data based on the pixels of the laser line through the polynomial. f(xi) is the polynomial function of xi and ri is the edge of the fitted line from the difference between the measured value (laser line) and the estimated value (polynomial function). A fitted line is the result of minimizing the squared difference value by subtracting the edge pixel of the laser and the estimated data.
The proposed estimation function involves transforming the determined polynomial for the laser line into a matrix in the form given by Equation (7). To obtain matrix X, the parameter of the estimation model that minimizes the residual sum of squares is derived using pseudo inverse as in Equation (8).
X = prinv(A)B
The fitted line obtained by applying the least squares method for the pantograph used in our study is shown in Figure 12. Figure 12a shows the first fitted line of reference obtained based on the laser line shown in Figure 6, using our estimation method with a five-degree polynomial for fitting, while Figure 12b shows the second fitted line obtained using the same estimation method, but with the first base line as input instead of the acquired laser line.
Figure 13 shows the fitted lines obtained from the degree of the polynomial in the estimation method in order to confirm the accuracy of the used polynomial function. As shown in Figure 13b, it is confirmed that the fitted curve obtained using the fifth-order polynomial is suitable as the contact strip.
After determining the fitted line of the contact strip, the wear size of the contact strip is measured using the post-processing method based on blob detection. Blob detection performs labeling from a target pixel to a neighboring pixel based on the subpixel in a binary image [23]. The neighboring pixels are grouped in eight directions by setting the threshold of the target image. In this study, the threshold is set to 0 and 255. Pixels are expressed in terms of wear size by converting µm/pixel into mm/pixel. As shown in Figure 14a, the contact strip is indicated by overlapping the laser line and the fitted line. The pixels’ wear size is shown through the overlap of two lines, along with Figure 14b. Furthermore, the wear size is determined through the blob process as shown in Figure 14c. The wear size in the blob processing of the image is computed by substituting the physical value into Equation (9). Here, PSwa is the pixel size of the physical wear measurement range, D is the physical wear measurement range, and Pwa is the number of pixels in the physical wear measurement range. In this study, the measurement range is applied to the width considering the structure of the contact strip. D is 40 cm, Pwa is 410 pixels which is measured with the visual check, and PSwa is computed at 976 µm/pixel as shown in Equation (9). The pixels of the camera are corrected according to the wear measurement range, converted to 10−3 units, and this unit is shown in the blob box of the image.
3. Results
Our measurement results for wear on the contact strip are shown in Figure 15. In particular, the result obtained by processing the first fitted line is shown in Figure 15a, while that obtained by processing the second fitted line is shown in Figure 15b. It is clear that the deformation results for the contact strip are more accurate (by one additional point) in Figure 15b than in Figure 15a. By applying the fitted line result of the bottom laser line to the results shown in Figure 15b, the detected deformations increased, as indicated via blue boxes in Figure 15c. It is found that the blue box has not accurately measured the size of wear without the blob process.
The wear results shown in Figure 15b are compared with the physical measurement values shown in Figure 4 in order to verify the accuracy of the target image by the proposed algorithm. The total thickness of the wear of the target image that is measured via visual inspection in the laboratory is 20 mm. As shown in Figure 14, W is the width and H is the thickness of the wear at different locations on the contact strip. As shown in Table 3, the results of the comparison with the physical measurement value show that the width at P1 has a maximum error of 9.04 mm and a minimum of 1.04 mm at P6. In terms of thickness, a maximum error of 6.01 mm was observed at P3, while a minimum error of 0.01 mm is realized at P4 and P2. The average error of the wear shape excluding P1 is 1.52 mm width, and 3.58 mm height.
Furthermore, Figure 16 shows the wear detection results obtained by analyzing the target image of the contact strip in normal wear condition. The total thickness of the wear is 108 mm and a width of 10 mm is machined off from the center of the contact strip. The wear measurement results indicated an error of 9 mm and 4 mm in terms of width and thickness, respectively, compared with the physical values.
The correlation formula is extracted based on the results in Figure 15b to check the change in the image measurement values according to the physical measurement values. The correlation formula between the physical measurement value and the image measurement value is shown by a trend line (orange line) as shown in Figure 17. The P1 in Figure 17 is excluded because the shape of wear is different. The trend line shows the formula in the linear distribution to derive the correlation by checking the coefficient that determines the accuracy. The image values (y-axis intercept) obtained by substituting for 180 mm width and 10 mm height of the physical values (x-axis intercept) of the contact strip in Figure 16 via the correlation formula is 104 mm width and 9 mm height (thickness). The result of the comparison of the derived image values of the correlation formula and the image values of Figure 15 is shown, with a difference of 2 mm in width and 3 mm in height. In the future, the correlation formula generated from the type of wear is expected to reduce the difference between the image value and the physical value.
4. Conclusions
In electric railway vehicles, the health of the contact strip of the pantograph is regularly verified through visual inspection at the railway vehicle garage after train service to check for wear and deformation. However, existing inspection methods only measure the remaining thickness of the contact strip via visual check after driving the railway vehicle.
In this study, we propose an algorithm that measures both the width and the thickness (height) of the wear size on the contact strip using the least squares method and deep learning. Monitoring equipment is configured for image acquisition of the machined contact strip. Deep learning based on ROI is used to find the automatic coordinates of the image. The original shape of the contact strip is fitted based on the detected edge of a laser line by applying the least squares method to the coordinates. The wear size of the deformed contact strip is measured by comparing the fitted line and the laser line. In addition, wear size is measured by the algorithm in the target image. In addition, the correlation between the physical value and the image measurement value of the same deformed shape is indicated in the error.
However, the proposed algorithm is limited because it requires the adjusting of the parameters according to the changed shape of the contact strip and the type of railway vehicle. The monitoring equipment needs to calibrate the sensitivity of the laser to the value of the illuminator depending on the installation location. It is important to optimize the trigger timing so that the laser on the contact strip is fixed according to the velocity of the railway vehicle. In the future we plan to test through the construction of a testbed based on the proposed algorithm. In addition, we plan to study the optimized function for the fitting, using the images obtained in the field test.
Author Contributions
Conceptualization, K.-M.N., K.L. and H.K.; methodology, K.-M.N. and K.L.; software, K.-M.N.; formal analysis, K.-M.N. and K.L.; writing—original draft preparation, K.-M.N.; writing—review and editing, K.-M.N., K.L., S.-K.S. and H.K.; visualization, K.-M.N.; project administration, S.-K.S.; Supervision, H.K. All authors have read and agreed to the published version of the manuscript.
Funding
This research was funded by R&D Program of the Korea Railroad Research Institute, PK2003C1.
Acknowledgments
This research was supported by a grant from R&D Program of the Korea Railroad Research Institute, Republic of Korea.
Conflicts of Interest
The authors declare no conflict of interest.
References
- Kim, H.; Sultana, S. The impacts of high-speed rail extensions on accessibility and spatial equity changes in South Korea from 2004 to 2018. J. Transp. Geogr. 2015, 45, 48–61. [Google Scholar] [CrossRef] [Green Version]
- Kang, G.; Jung, I.; Kim, J.-y.; Seo, M. Preliminary Study on the Simulation for Urban Railway Facility Performance Assessment. J. Korea Acad. Ind. Coop. Soc. 2020, 21, 190–198. [Google Scholar]
- Femine, A.D.; Gallo, D.; Giordano, D.; Landi, C.; Luiso, M.; Signorino, D. Power Quality Assessment in Railway Traction Supply Systems. IEEE Trans. Instrum. Meas. 2020, 69, 2355–2366. [Google Scholar] [CrossRef]
- Song, Y.; Liu, Z.; Lu, X. Dynamic Performance of High-Speed Railway Overhead Contact Line Interacting With Pantograph Considering Local Dropper Defect. IEEE Trans. Veh. Technol. 2020, 69, 5958–5967. [Google Scholar] [CrossRef]
- Na, K.-M.; Lee, K.; Kim, H.; Cho, C.J.; Choi, W.; Park, Y. Implementation of Image Processing in Studying Contact Conditions of Overhead Contact Line-Pantograph at 400 km/h. J. Electr. Eng. Technol. 2020, 15, 989–995. [Google Scholar] [CrossRef]
- Yang, H.; Wang, K.; Liu, Y.; Fu, L.; Cui, X.; Jiang, G.; Hu, B. The formation of the delamination wear of the pure carbon strip and its influence on the friction and wear properties of the pantograph and catenary system. Wear 2020, 203343. [Google Scholar] [CrossRef]
- Ostlund, S.; Gustafsson, A.; Buhrkall, L.; Skoglund, M. Condition monitoring of pantograph contact strip. In Proceedings of the 4th IET International Conference on Railway Condition Monitoring (RCM 2008), Derby, UK, 18–20 June 2008; p. 37. [Google Scholar]
- Wei, W.; Wu, J.; Gao, G.; Gu, Z.; Liu, X.; Zhu, G.; Wu, G. Study on Pantograph Arcing in a Laboratory Simulation System by High-Speed Photography. IEEE Trans. Plasma Sci. 2016, 44, 2438–2445. [Google Scholar] [CrossRef]
- Kim, J.-M.; Kim, Y.-S. Network Design for Construction of Remote Diagnosis System for Power Facilities of Electric Railway. Trans. Korean Inst. Electr. Eng. 2009, 58, 432–436. [Google Scholar]
- Bucca, G.; Collina, A. A procedure for the wear prediction of collector strip and contact wire in pantograph–catenary system. Wear 2009, 266, 46–59. [Google Scholar] [CrossRef]
- Zhang, H.; Luo, L.; Yang, K.; Wang, L.; Gao, X. Improved multi-scale wavelet in pantograph slide edge detection. Optik 2014, 125, 5681–5683. [Google Scholar] [CrossRef]
- Lu, S.; Liu, Z.; Li, D.; Shen, Y. Automatic wear measurement of pantograph slider based on multi-view analysis. IEEE Trans. Ind. Inform. 2020, 1. [Google Scholar] [CrossRef]
- Huang, S.; Zhai, Y.; Zhang, M.; Hou, X. Arc detection and recognition in pantograph–catenary system based on convolutional neural network. Inf. Sci. 2019, 501, 363–376. [Google Scholar] [CrossRef]
- Balestrino, A.; Bruno, O.; Landi, A.; Sani, L. Automatic processing analysis of infrared images for monitoring pantograph catenary interactions. Comput. Methods Exp. Meas. XIII 2007, 46, 819–828. [Google Scholar] [CrossRef] [Green Version]
- Aydin, I.; Karakose, M.; Akin, E. A New Contactless Fault Diagnosis Approach for Pantograph-Catenary System Using Pattern Recognition and Image Processing Methods. Adv. Electr. Comput. Eng. 2014, 14, 79–88. [Google Scholar] [CrossRef]
- Zhang, Y.; Yang, K.; Wyant, J.C.; Wang, L.; Gao, X.; Smythe, R.A.; Wang, H.; Zhao, Q.; Wang, Z.; Peng, C. Application of CCD measurement technique for wear on pantograph sliding plates. In Proceedings of the 4th International Symposium on Advanced Optical Manufacturing and Testing Technologies: Optical Test and Measurement Technology and Equipment, Chengdu, China, 19–21 November 2008. [Google Scholar]
- Karakose, E.; Gencoglu, M.T.; Karakose, M.; Aydin, I.; Akin, E. A New Experimental Approach Using Image Processing-Based Tracking for an Efficient Fault Diagnosis in Pantograph–Catenary Systems. IEEE Trans. Ind. Inform. 2017, 13, 635–643. [Google Scholar] [CrossRef]
- Doyle, S.; Bastucescu, C.; Vale, T. Pantograph condition monitoring system for automated maintenance inspections and prevention of overhead wiring tear downs. In Proceedings of the CORE 2016: Conference on Railway Excellence (CORE 2016), Victoria, Australia, 16–18 May 2016; pp. 178–187. [Google Scholar]
- Zhang, Z. A flexible new technique for camera calibration. IEEE Trans. Pattern Anal. Mach. Intell. 2000, 22, 1330–1334. [Google Scholar] [CrossRef] [Green Version]
- Wei, X.; Jiang, S.; Li, Y.; Li, C.; Jia, L.; Li, Y. Defect Detection of Pantograph Slide Based on Deep Learning and Image Processing Technology. IEEE Trans. Intell. Transp. Syst. 2019, 21, 947–958. [Google Scholar] [CrossRef]
- Deng, G.; Cahill, L. An adaptive Gaussian filter for noise reduction and edge detection. In Proceedings of the 1993 IEEE conference record nuclear science symposium and medical imaging conference, San Francisco, CA, USA, 31 October–6 November 1993; pp. 1615–1619. [Google Scholar]
- Shih, F.Y.; Cheng, S. Adaptive mathematical morphology for edge linking. Inf. Sci. 2004, 167, 9–21. [Google Scholar] [CrossRef]
- Hinz, S. Fast and subpixel precise blob detection and attribution. Proceedings of IEEE International Conference on Image Processing 2005, Genova, Italy, 14–16 September 2006; p. III-457. [Google Scholar]
Figure 1.
Contact strip of the pantographs used in high-speed electric railway vehicles. (a) Schematic diagram of contact area (top view). (b) Actual picture of contact strip showing wear condition.
Figure 1.
Contact strip of the pantographs used in high-speed electric railway vehicles. (a) Schematic diagram of contact area (top view). (b) Actual picture of contact strip showing wear condition.

Figure 2.
Different deformation conditions that occur on the contact strip of the pantograph (front view).
Figure 2.
Different deformation conditions that occur on the contact strip of the pantograph (front view).
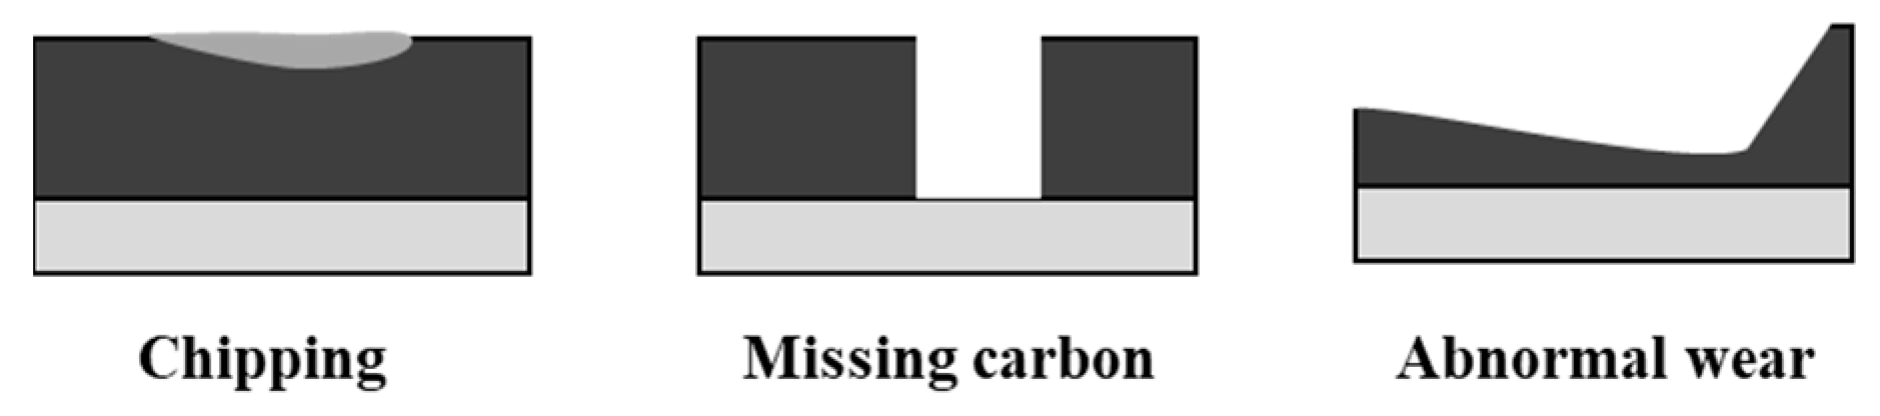
Figure 3.
Physical contact strip of the simulation with sizes of the deformations.
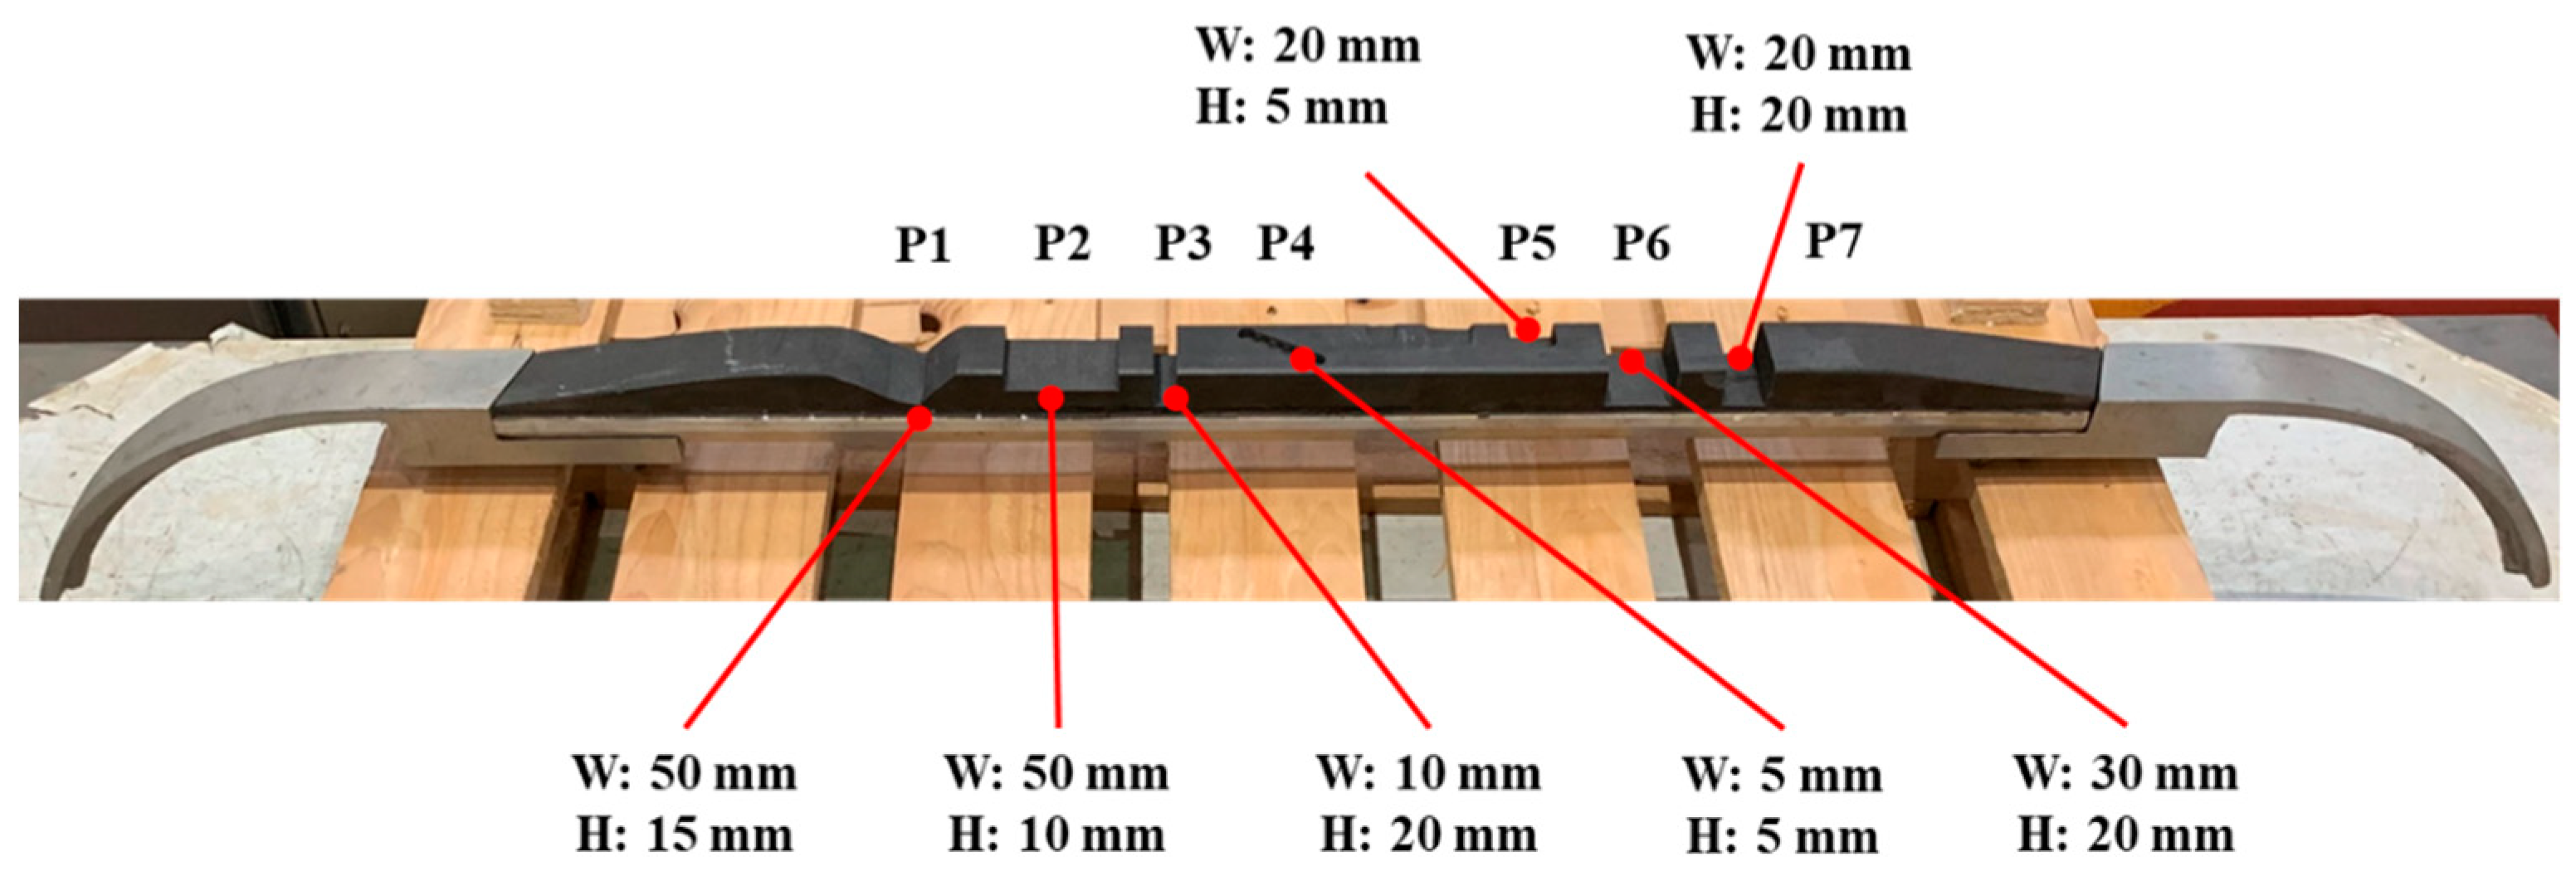
Figure 4.
Configuration for the image acquisition of the proposed pantograph monitoring equipment.

Figure 5.
Result of mean reprojection error image.
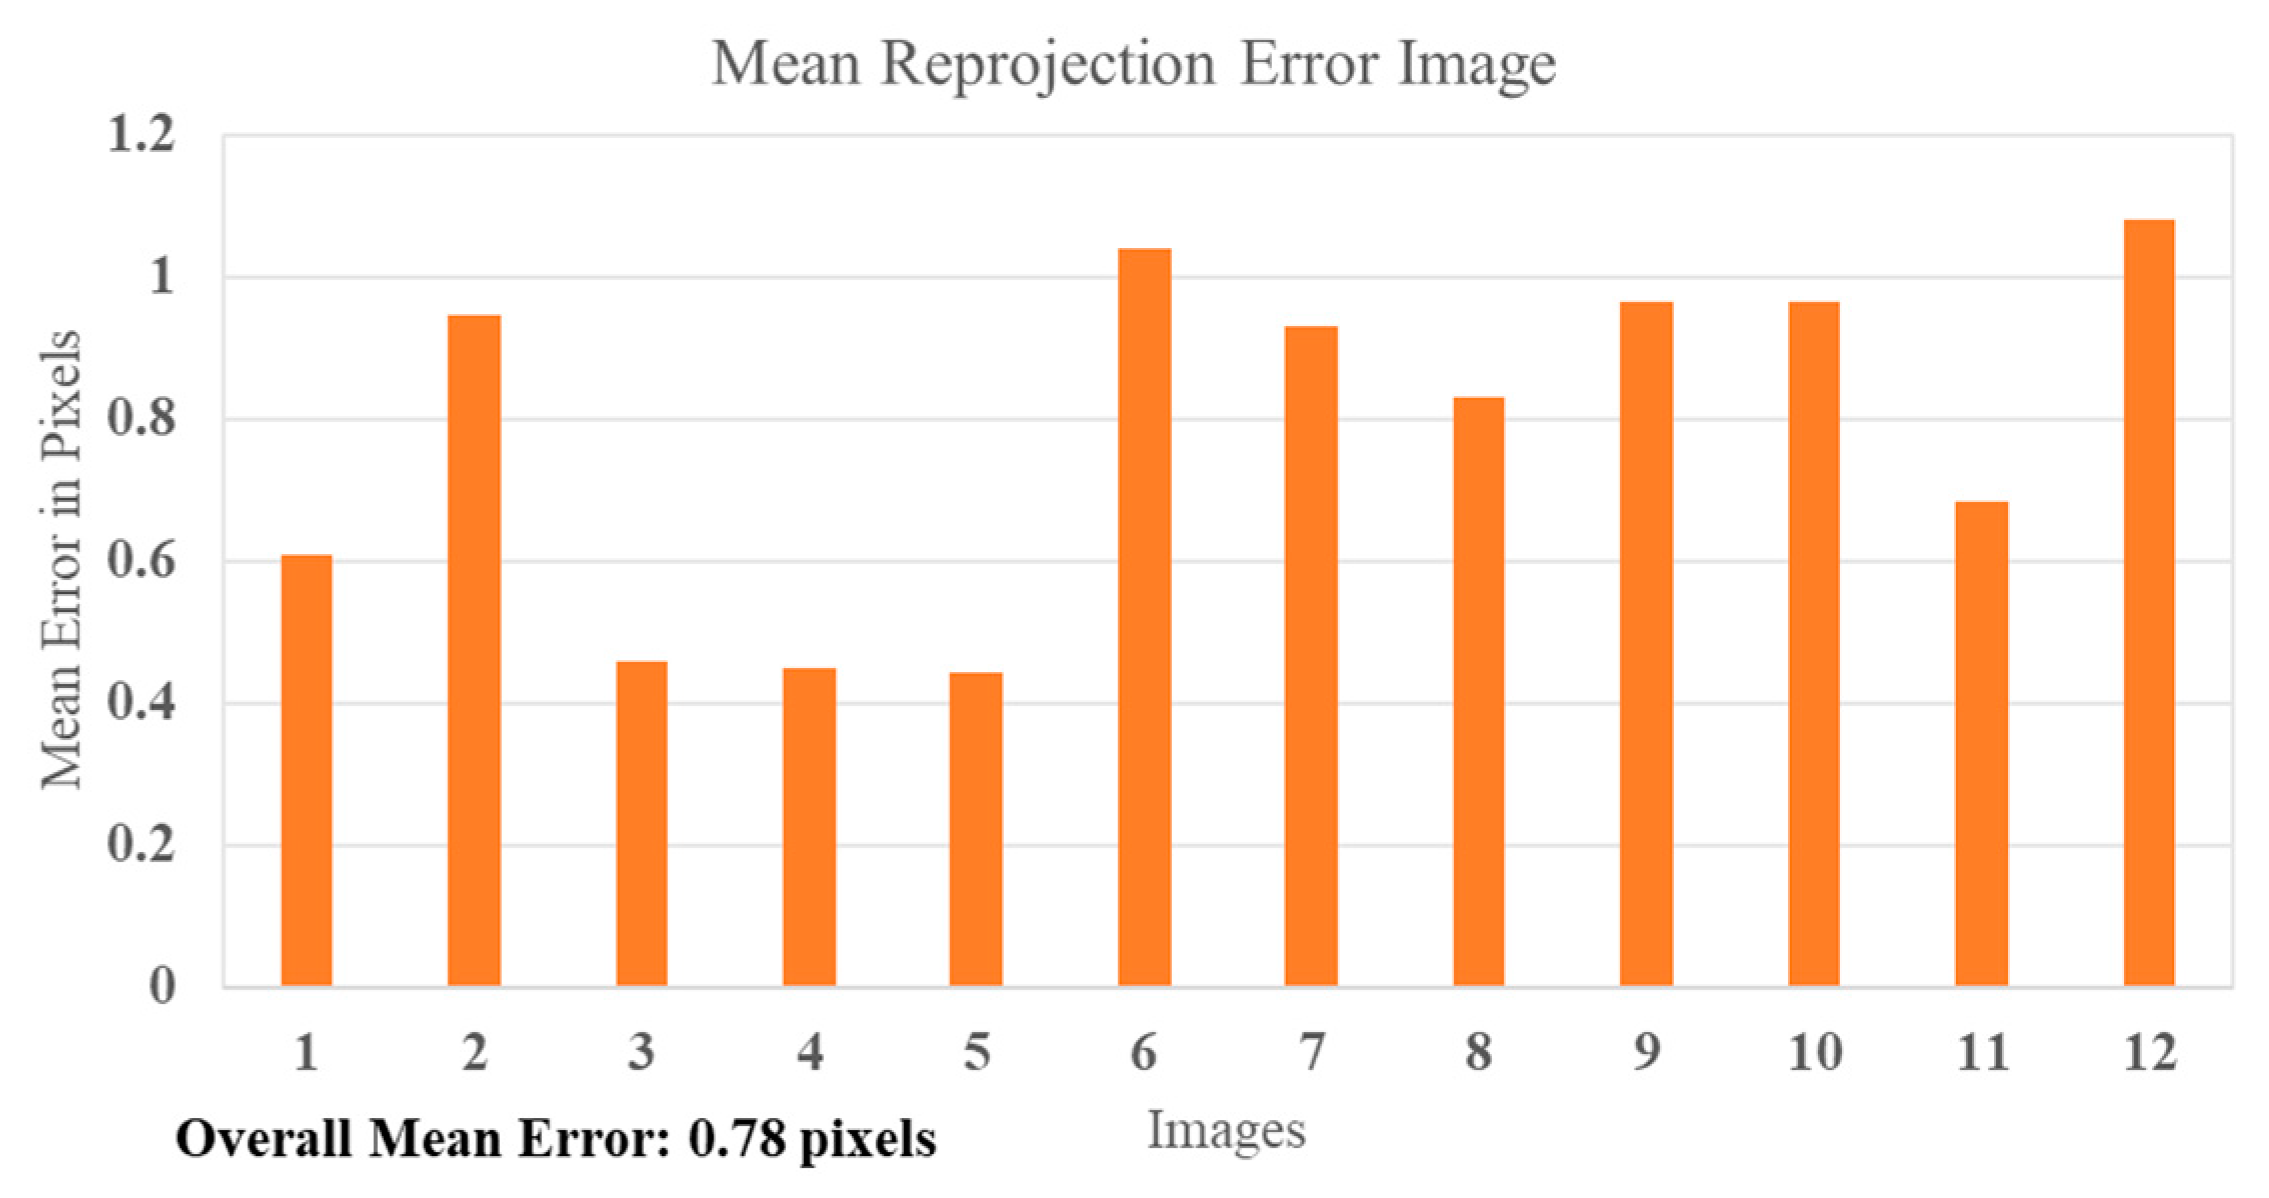
Figure 6.
Images of pantograph acquired using our proposed monitoring system under (a) abnormal and (b) normal wear condition (HEUM-430x).
Figure 6.
Images of pantograph acquired using our proposed monitoring system under (a) abnormal and (b) normal wear condition (HEUM-430x).
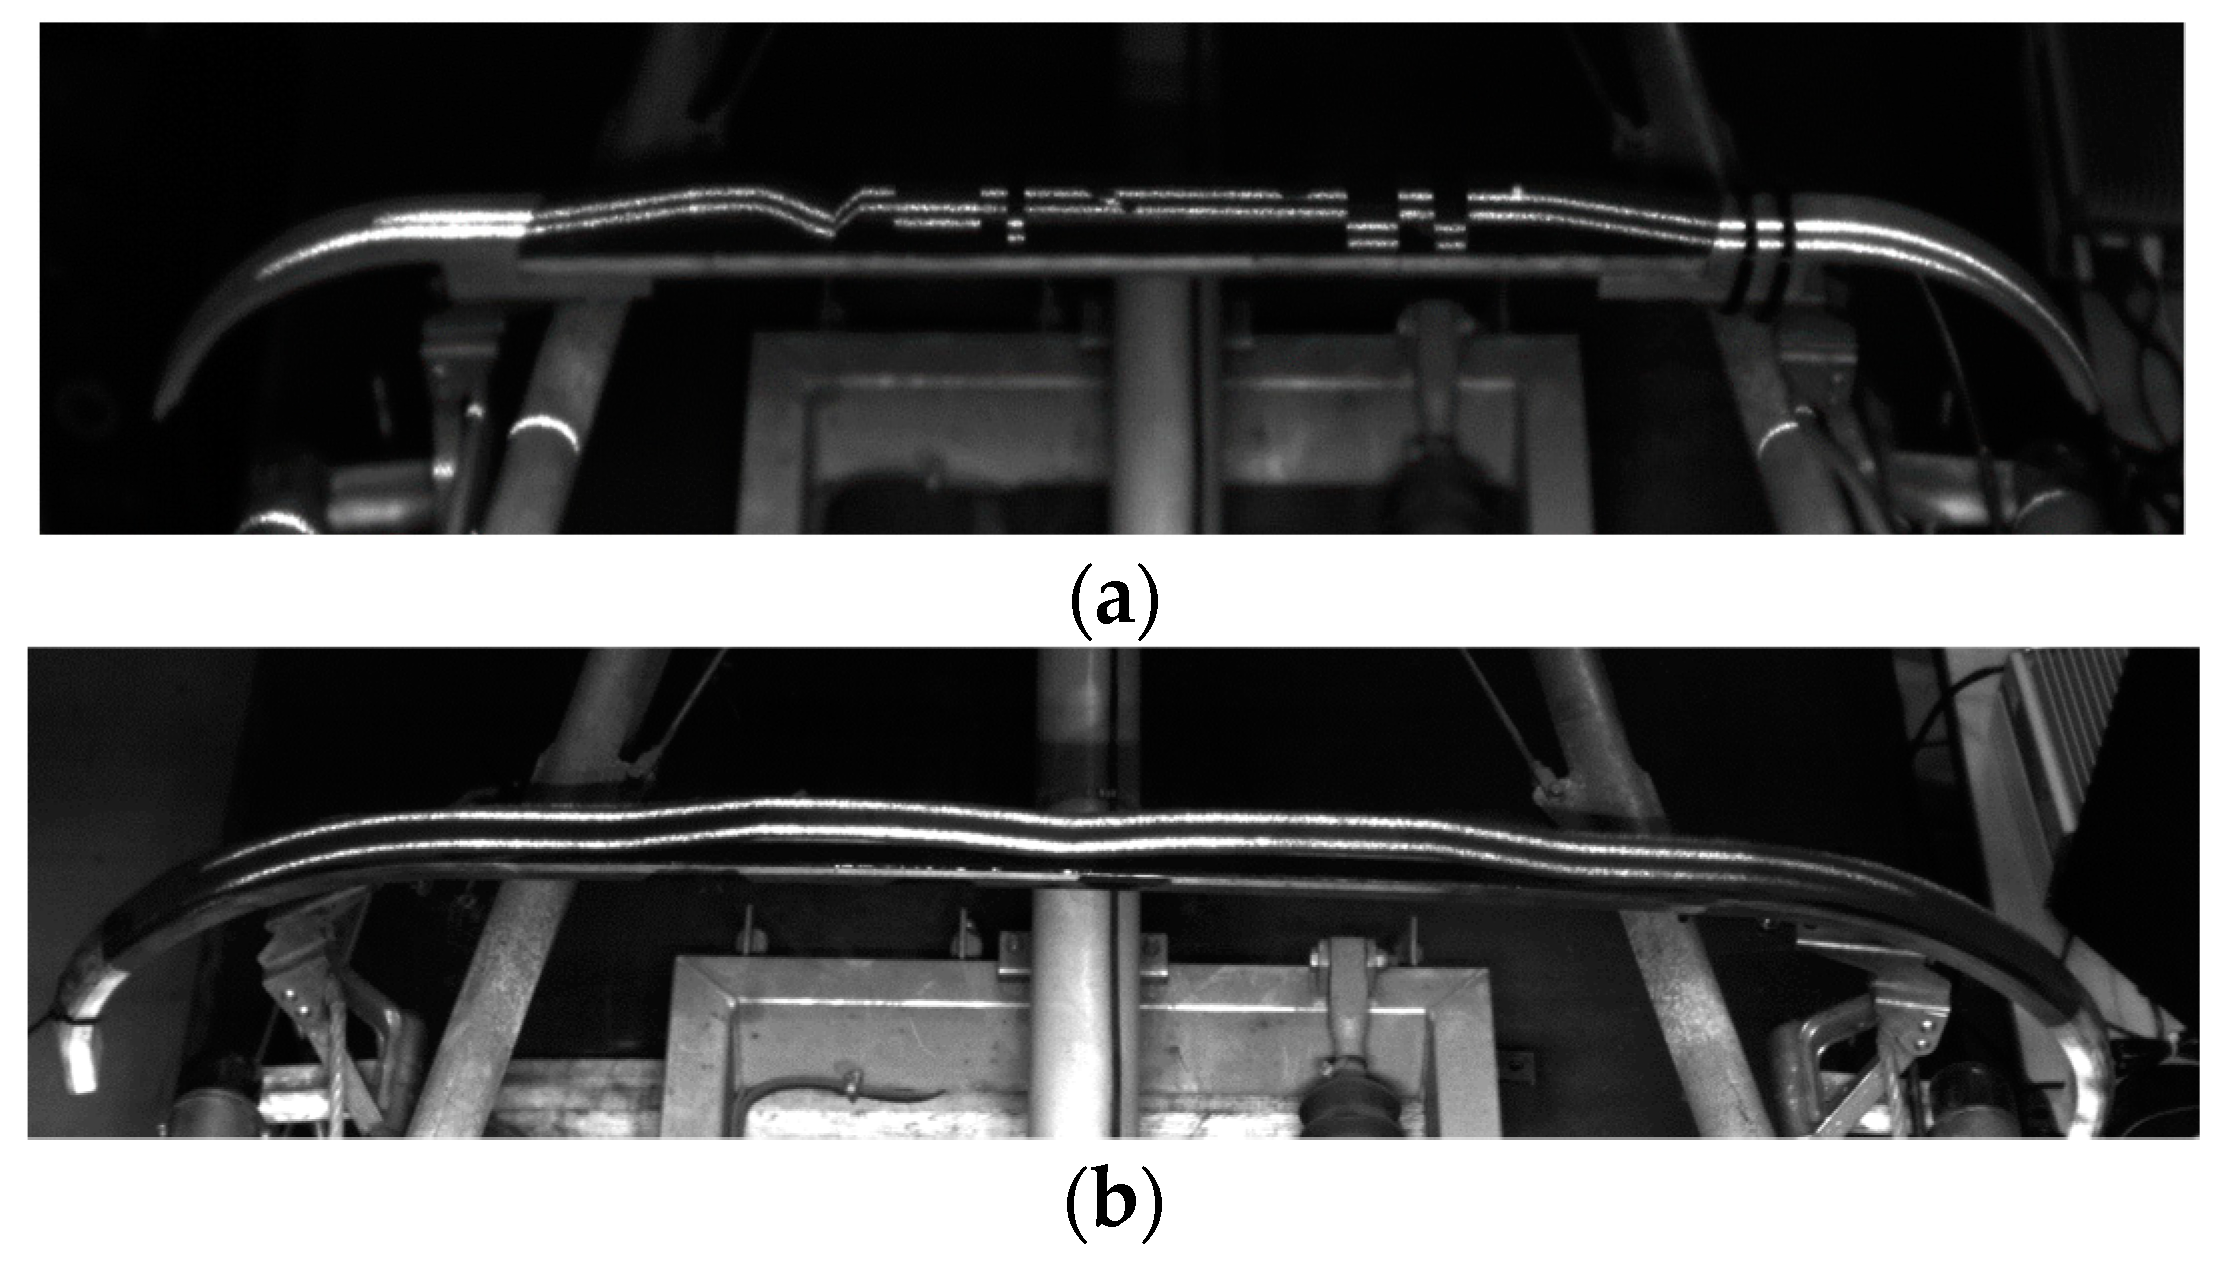
Figure 7.
Flow chart of the wear measurement algorithm for the contact strip.
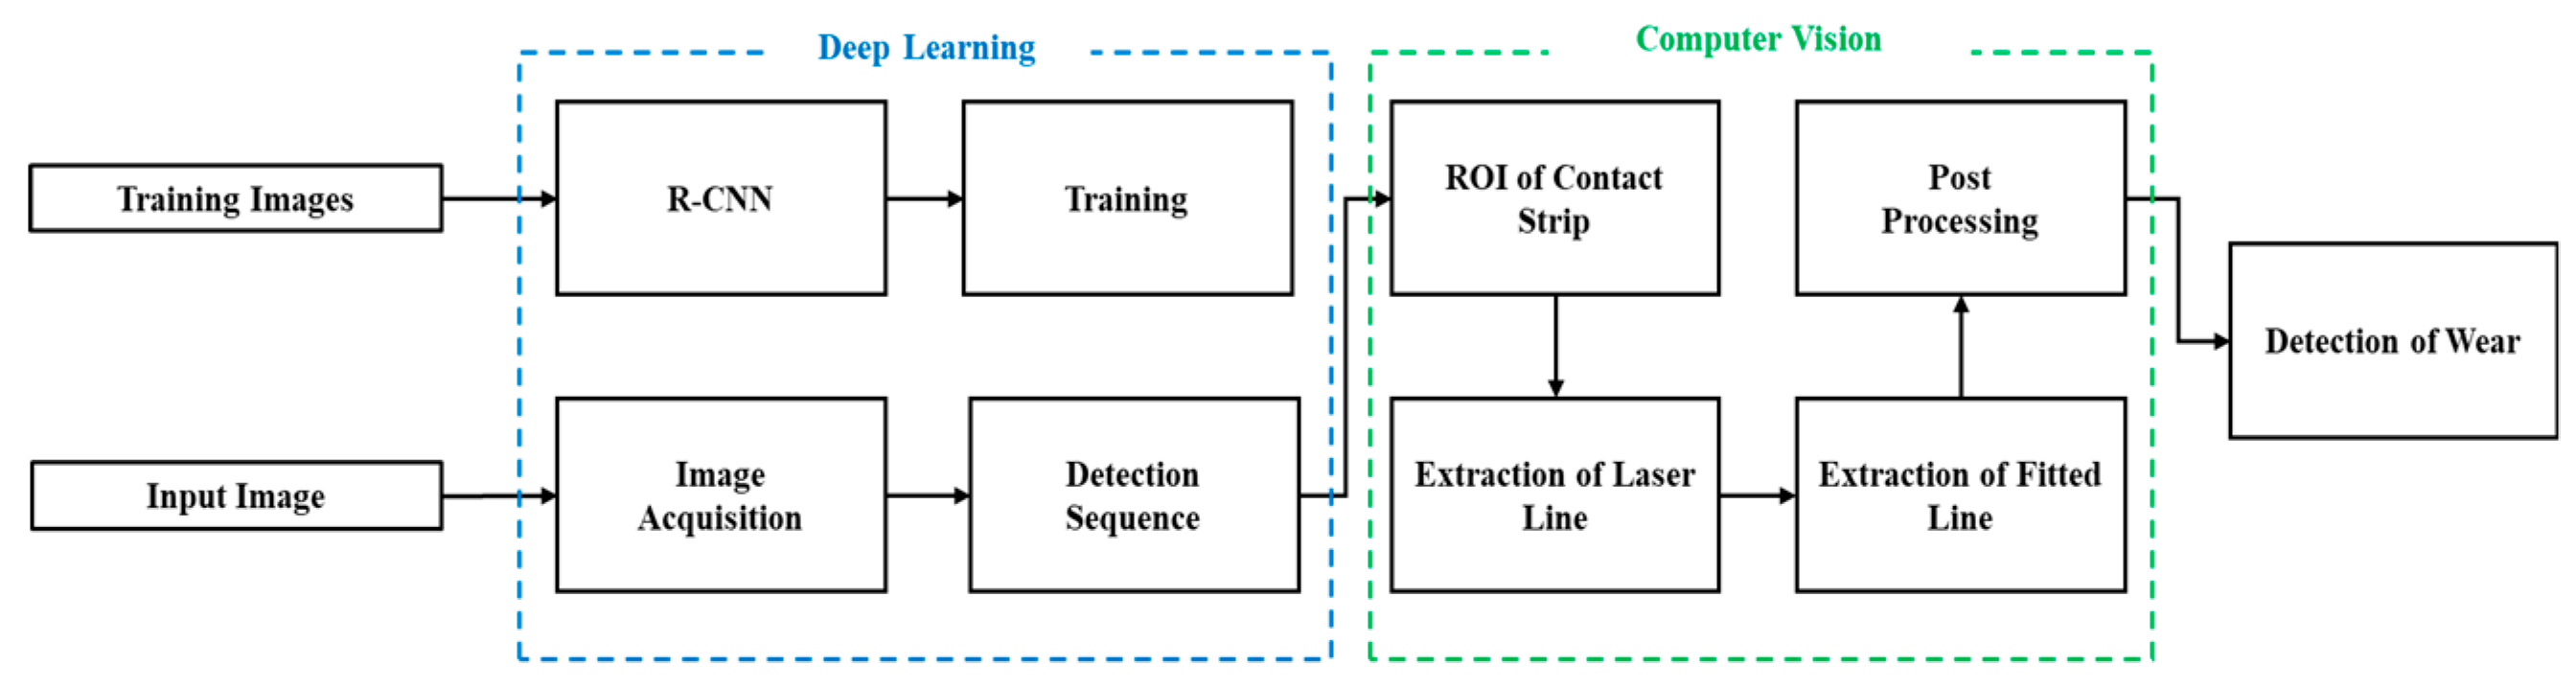
Figure 8.
Flow of Regions – Convoluted Neural Network (R-CNN).
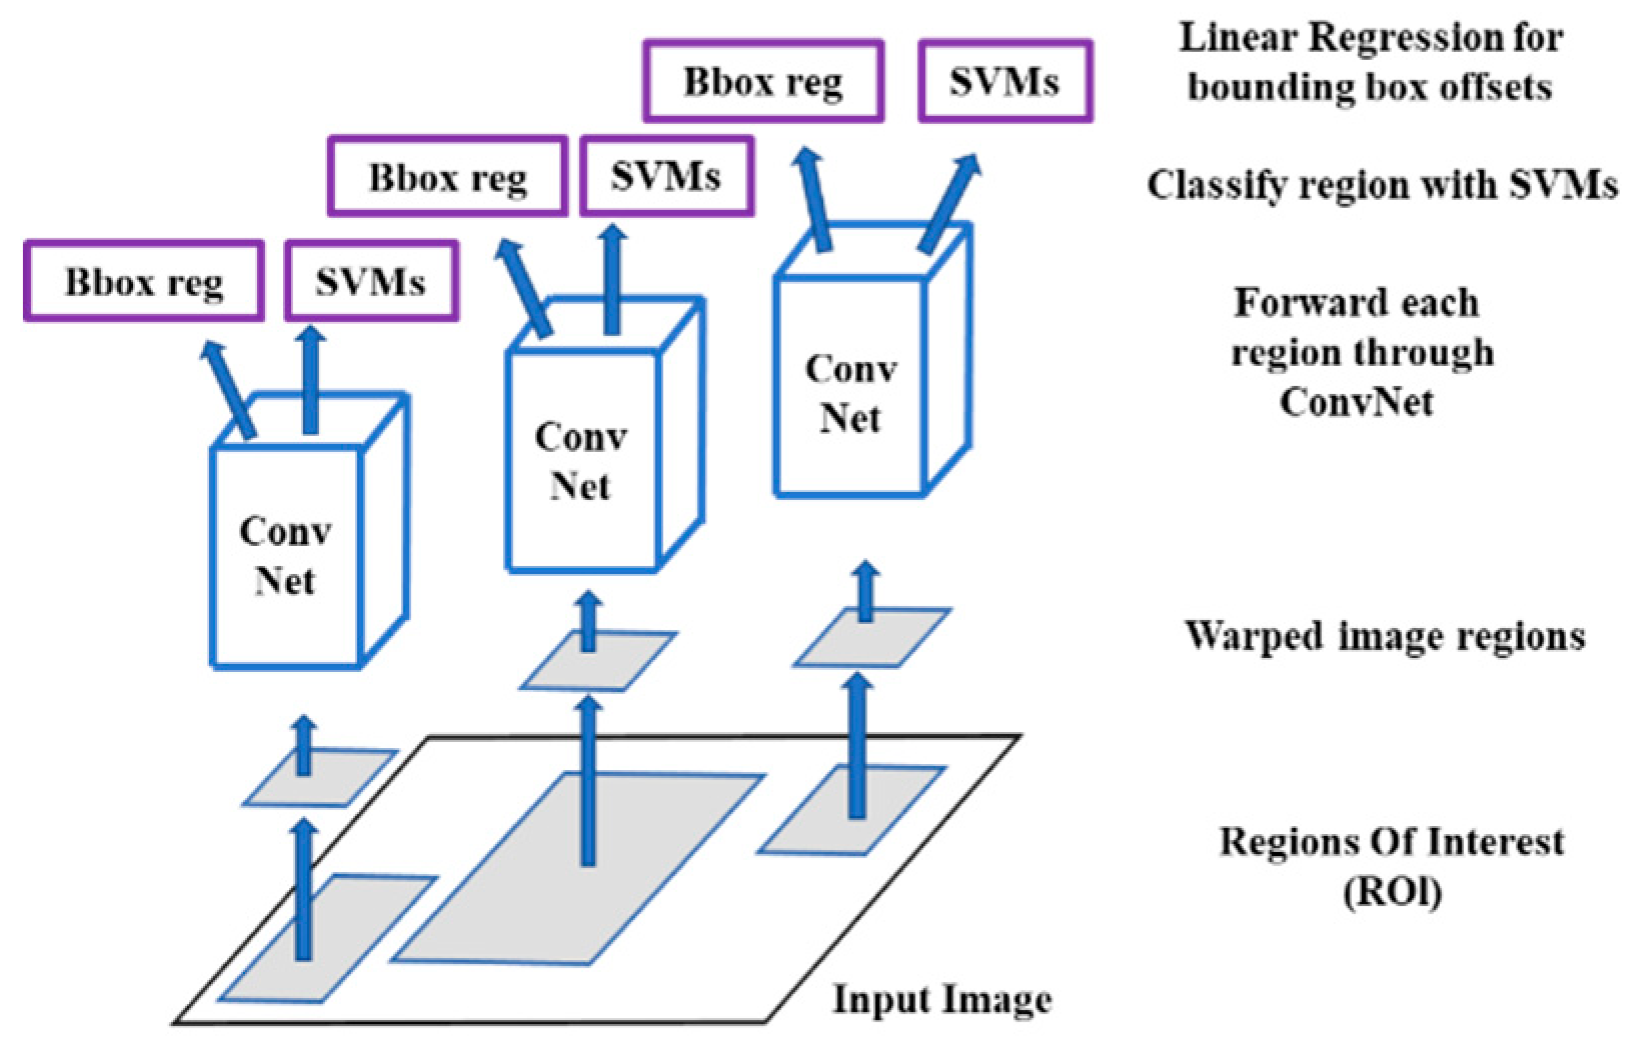
Figure 9.
Basic flow chart of CNN (ConvNet).
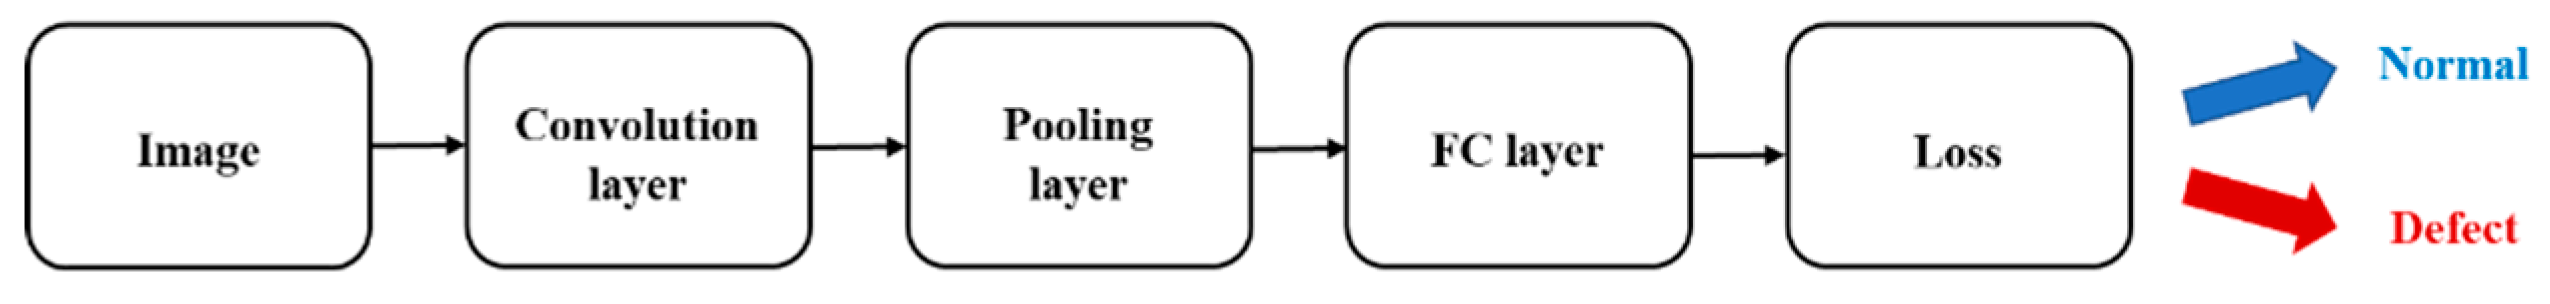
Figure 10.
Detection of pantograph contact strip from R-CNN.

Figure 11.
Extraction of top laser line on the acquired image of the contact strip.
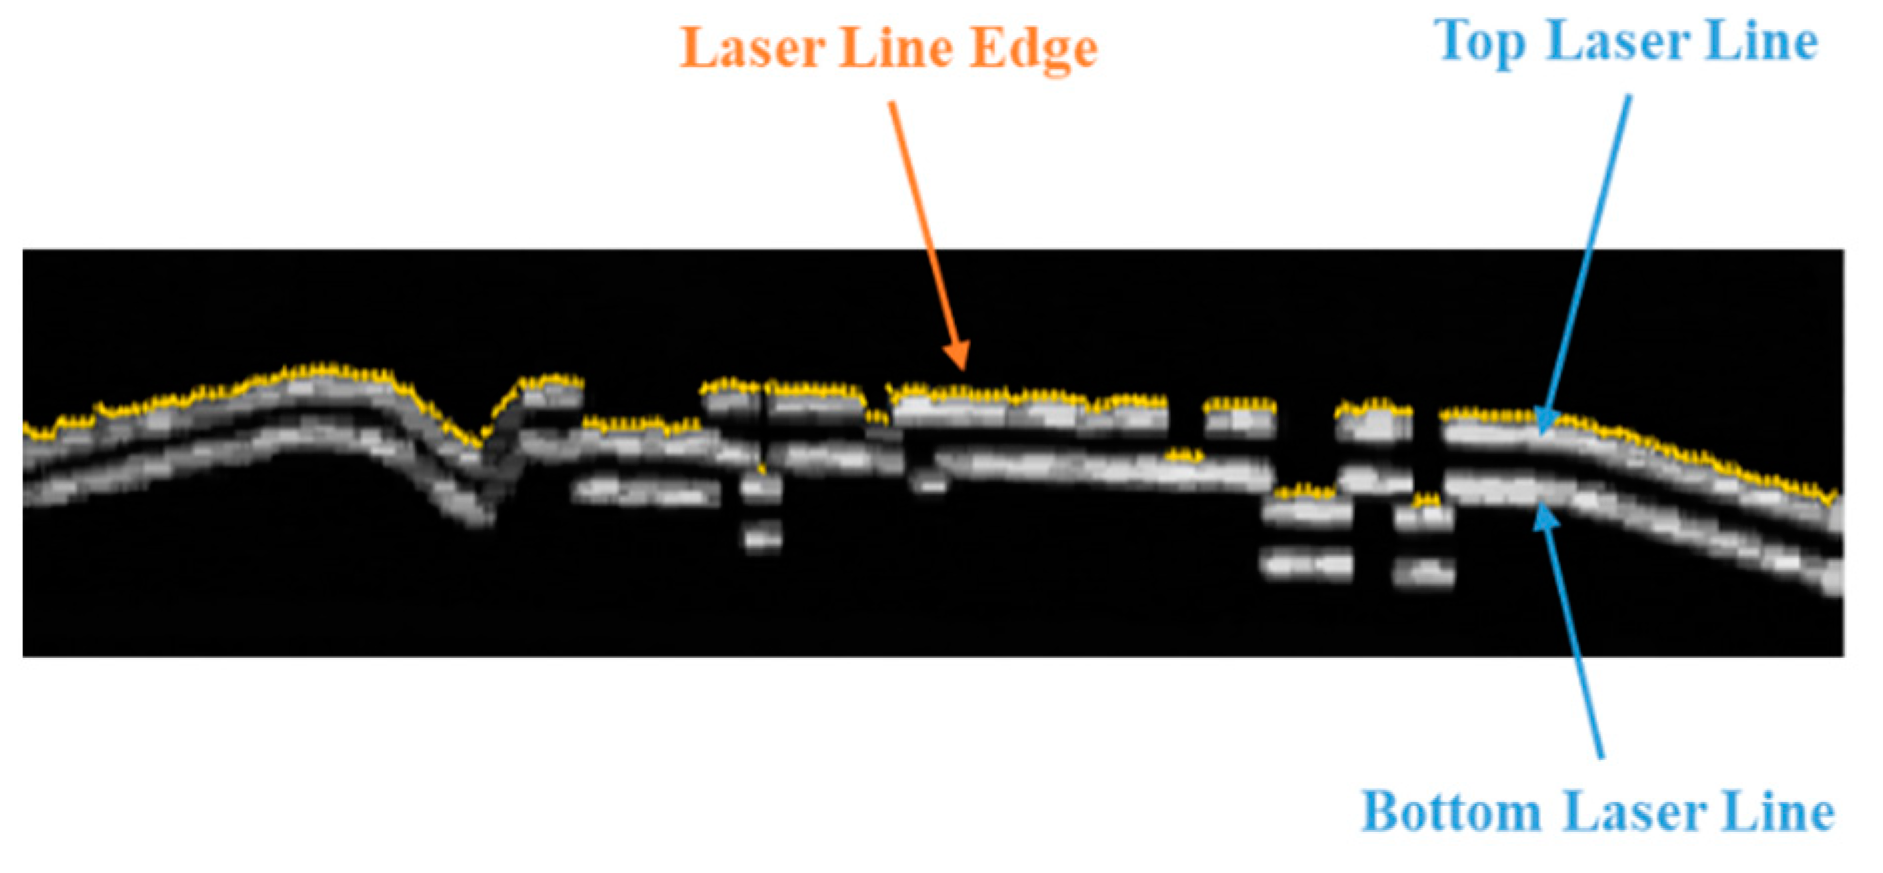
Figure 12.
Fitted line estimation results for the (a) first line and (b) second line.

Figure 13.
Fitted lines obtained by applying polynomials of the (a) third, (b) fifth, and (c) sixth degrees in the estimation method.
Figure 13.
Fitted lines obtained by applying polynomials of the (a) third, (b) fifth, and (c) sixth degrees in the estimation method.
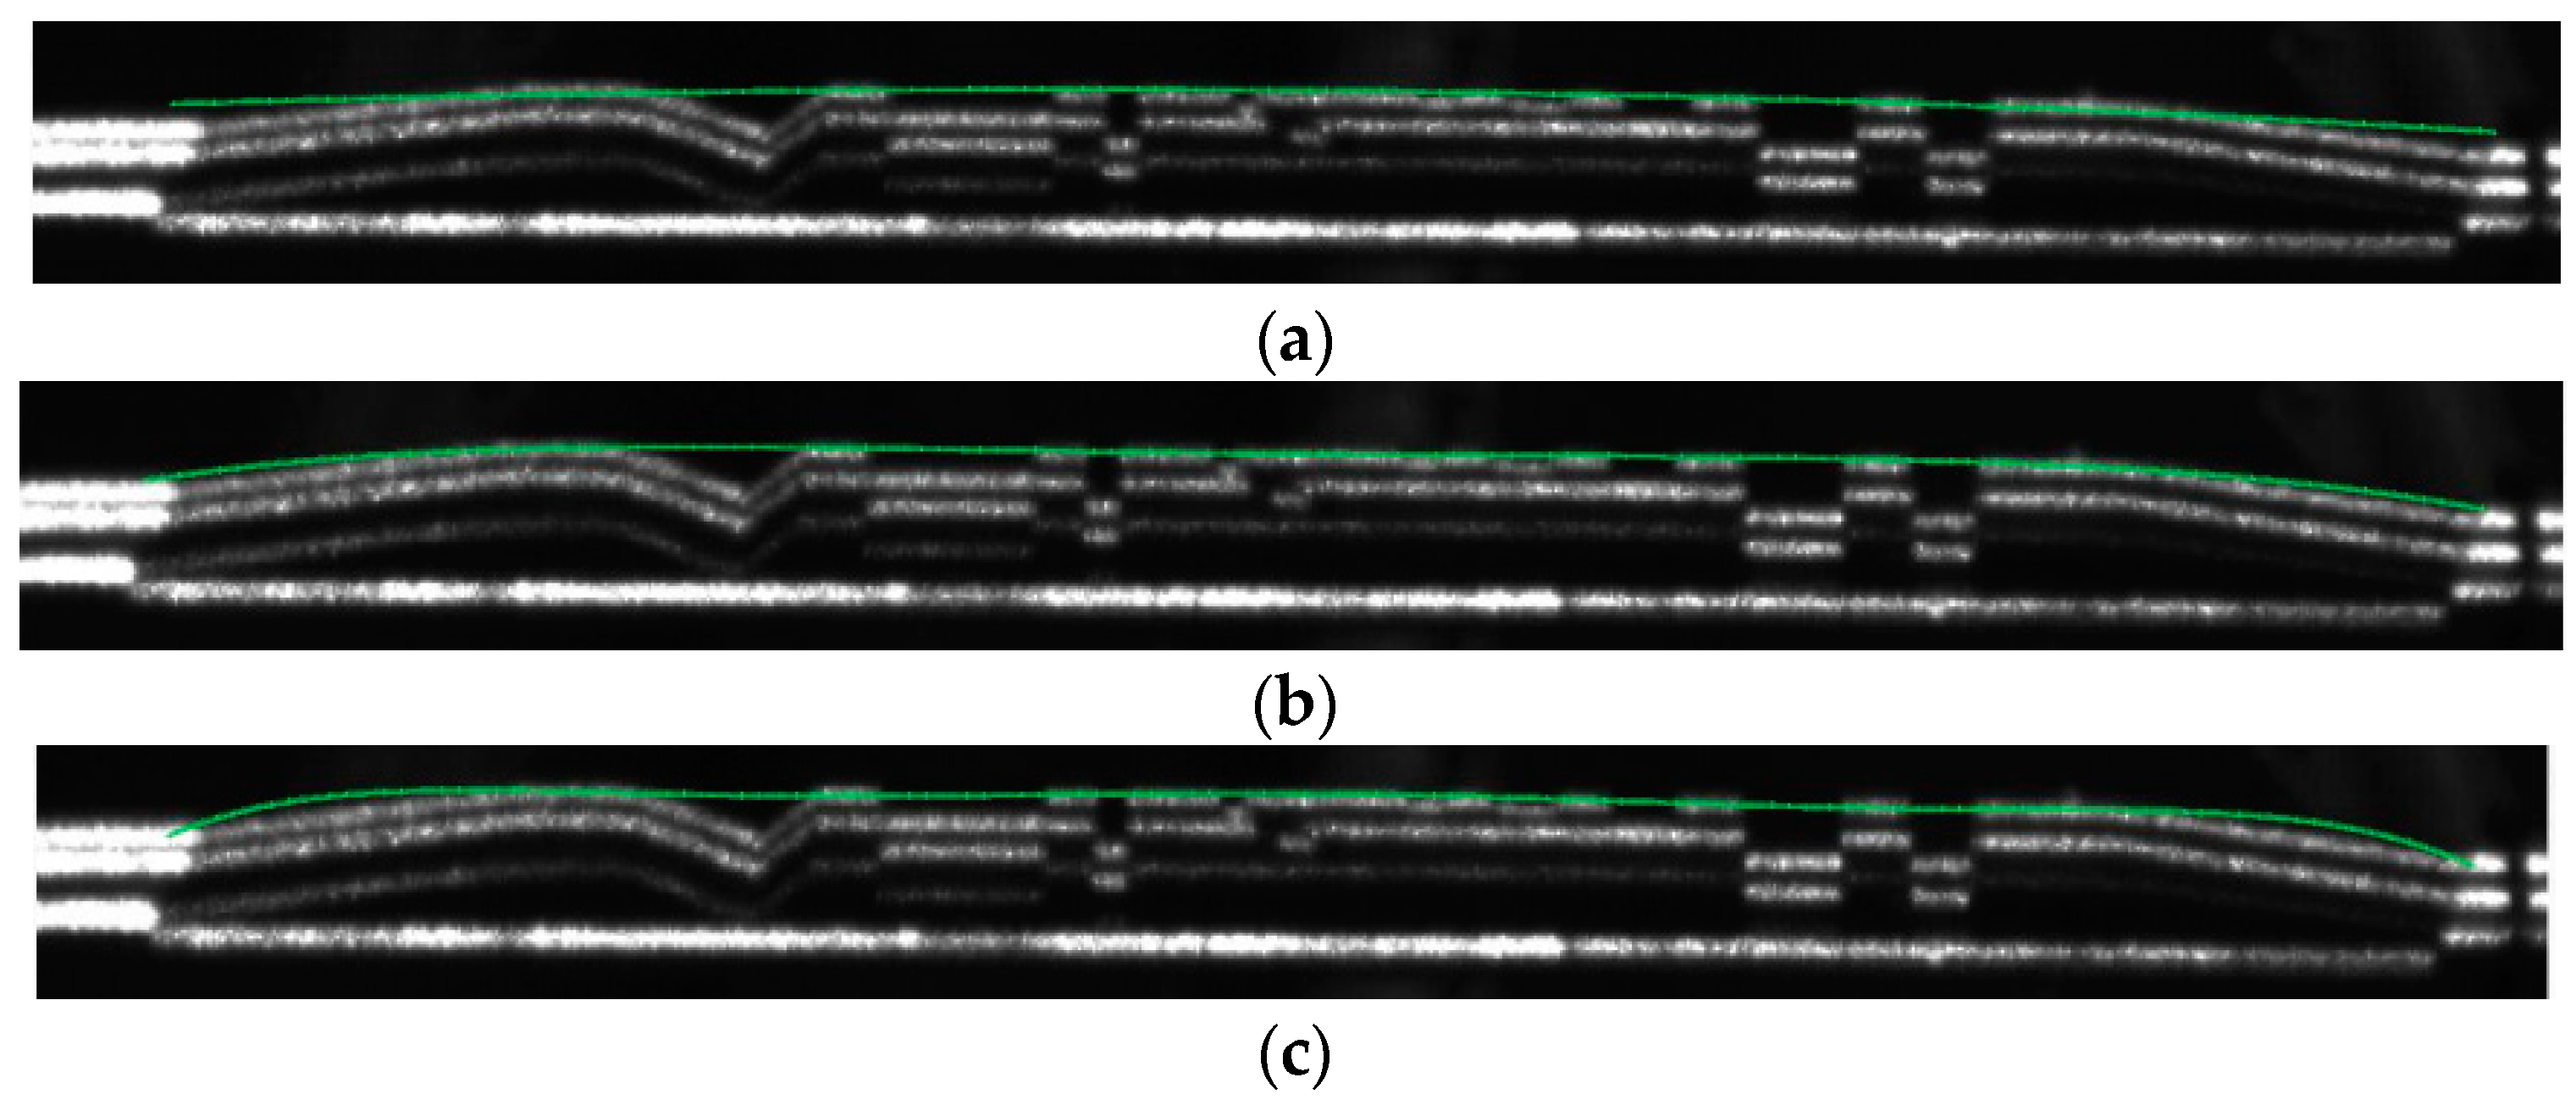
Figure 14.
Post-processing for measurements of the contact strip: (a) overlay of laser line and base line, (b) extraction of the wear size between the base line and laser line, and (c) size determination via blob processing.
Figure 14.
Post-processing for measurements of the contact strip: (a) overlay of laser line and base line, (b) extraction of the wear size between the base line and laser line, and (c) size determination via blob processing.


Figure 15.
Wear measurement results for the contact strip using the (a) first top fitted line, (b) second top fitted line, and (c) bottom fitted line.
Figure 15.
Wear measurement results for the contact strip using the (a) first top fitted line, (b) second top fitted line, and (c) bottom fitted line.

Figure 16.
Result of wear measurement in normal contact strip.
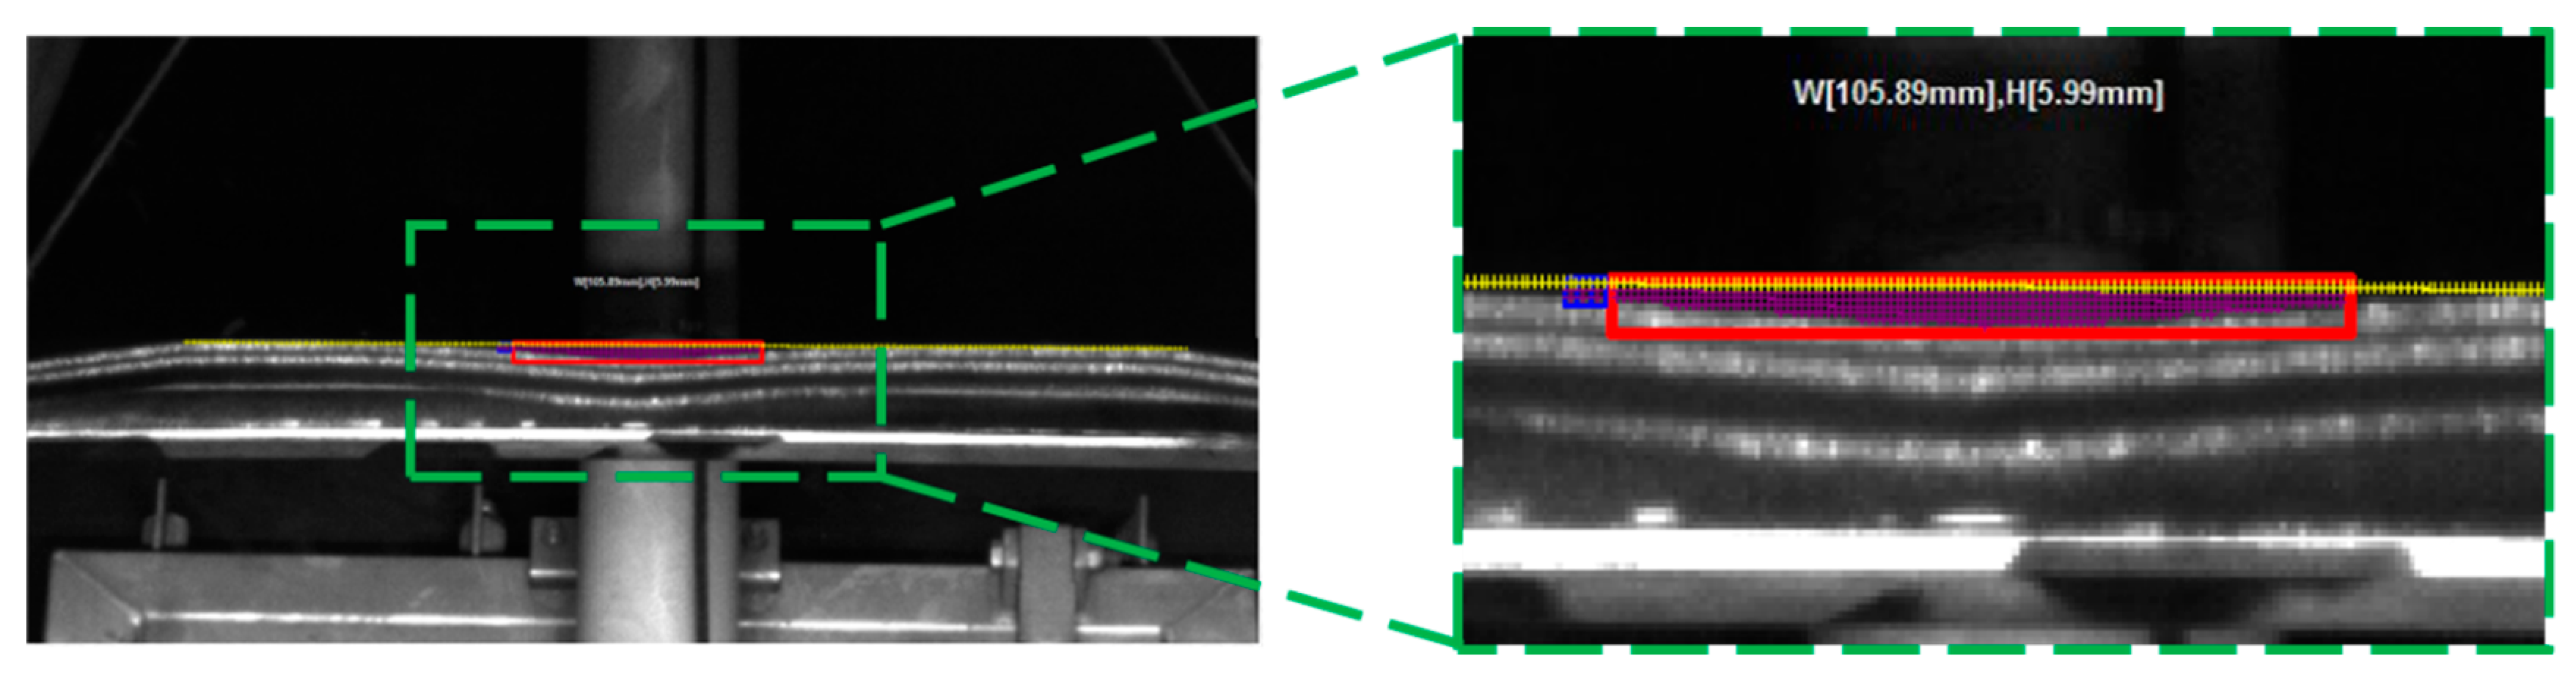
Figure 17.
Correlation graph between the wear value of image and physical value: (a) width; (b) thickness.
Figure 17.
Correlation graph between the wear value of image and physical value: (a) width; (b) thickness.


Table 1.
Specification of the monitoring equipment.
| Equipment | Specifications | Contents | Manufacturer |
|---|---|---|---|
| Near Infrared Ray (NIR) camera | Resolution | 2048(H) × 1088(V) | Allied Vision, Pennsylvania, USA |
| Pixel size | 5.5 µm × 5.5 µm | ||
| ADC (Analog to Digital Converter) | 12 bit | ||
| Line laser sensor | Wavelength | 635 nm to 980 nm | Z-Laser, Freiburg, Germany |
| Gaussian profile (Line) | 3° to 90° | ||
| Homogeneous intensity profile (Line) | 10° to 90° | ||
| Trigger sensor | Response time | 1.5 ms to 256 ms | Banner, Minnesota, USA |
| Resolution | <0.3 ms to 4 ms | ||
| Sensing range | 50 mm to 24,000 mm |
Table 2.
Intrinsic parameter after optimization.
| Intrinsic Parameters | x | y |
|---|---|---|
| Focal length (pixels) ± Error range | 2867.3350 ± 17.0844 | 2861.6535 ± 16.9425 |
| Principal point (pixels) | 1453.0524 ± 22.0096 | 332.7520 ± 15.5928 |
| Skew coefficient | −2.3252 ± 2.1299 | |
Table 3.
Error result of the physical value and the detection value of the simulation contact strip.
Table 3.
Error result of the physical value and the detection value of the simulation contact strip.
| Item | P1 | P2 | P3 | P4 | P5 | P6 | P7 |
|---|---|---|---|---|---|---|---|
| Width | 9.04 mm | 1.45 mm | 2.01 mm | 1.99 mm | 2.11 mm | 1.03 mm | 2.02 mm |
| Height | 4.01 mm | 2.01 mm | 6.01 mm | 2.00 mm | 4.99 mm | 5.02 mm | 5.02 mm |
Publisher’s Note: MDPI stays neutral with regard to jurisdictional claims in published maps and institutional affiliations. |
© 2020 by the authors. Licensee MDPI, Basel, Switzerland. This article is an open access article distributed under the terms and conditions of the Creative Commons Attribution (CC BY) license (http://creativecommons.org/licenses/by/4.0/).
Share and Cite
MDPI and ACS Style
Na, K.-M.; Lee, K.; Shin, S.-K.; Kim, H. Detecting Deformation on Pantograph Contact Strip of Railway Vehicle on Image Processing and Deep Learning. Appl. Sci. 2020, 10, 8509. https://doi.org/10.3390/app10238509
AMA Style
Na K-M, Lee K, Shin S-K, Kim H. Detecting Deformation on Pantograph Contact Strip of Railway Vehicle on Image Processing and Deep Learning. Applied Sciences. 2020; 10(23):8509. https://doi.org/10.3390/app10238509
Chicago/Turabian StyleNa, Kyung-Min, Kiwon Lee, Seung-Kwon Shin, and Hyungchul Kim. 2020. "Detecting Deformation on Pantograph Contact Strip of Railway Vehicle on Image Processing and Deep Learning" Applied Sciences 10, no. 23: 8509. https://doi.org/10.3390/app10238509
Note that from the first issue of 2016, this journal uses article numbers instead of page numbers. See further details here.