Featured Application
Hydrothermally carbonized digestate from biogas systems can be applied to crops soils to reduce soil CO2 fluxes in some cases.
Abstract
Miscanthus x giganteus (miscanthus), a perennial biomass crop, allocates more carbon belowground and typically has lower soil greenhouse gas (GHG) emissions than conventional feedstock crops, but best practices for nutrient management that maximize yield while minimizing soil GHG emissions are still debated. This study evaluated the effects of four different fertilization treatments (digestate from a biodigester, synthetic fertilizer (urea), hydrochar from the hydrothermal carbonization of digestate, and a control) on soil GHG emissions and biomass yield of an established miscanthus stand grown on abandoned agricultural land. Soil GHG fluxes (including CH4, CO2, and N2O) were sampled in all treatments using the static chamber methodology. Average biomass yield varied from 20.2 Mg ha−1 to 23.5 Mg ha−1, but there were no significant differences among the four treatments (p > 0.05). The hydrochar treatment reduced mean CO2 emissions by 34% compared to the control treatment, but this difference was only statistically significant in one of the two sites tested. Applying digestate to miscanthus resulted in a CH4 efflux from the soil in one of two sites, while soils treated with urea and hydrochar acted as CH4 sinks in both sites. Overall, fertilization did not significantly improve biomass yield, but hydrochar as a soil amendment has potential for reducing soil GHG fluxes.
1. Introduction
Nutrient management in crops can be the largest factor affecting life cycle greenhouse gas (GHG) emissions of advanced bioenergy systems [1]. Synthetic fertilizers are typical in industrial agricultural systems but require substantial energy to produce and sometimes have unintended negative consequences (e.g., volatilization to atmosphere, reduced soil health, and nutrient runoff), especially when applied in excess of crop nutrient demands. Alternative soil amendments, including digestate and hydrochars, have the potential to reduce these undesirable impacts [2,3]. Digestate is a renewable form of fertilizer that is produced as a coproduct of biogas production from organic matter (e.g., food waste, manure, or crop residue) [4,5], while hydrochar is a stable, hydrophobic, high carbonaceous product formed when organic material is processed through hydrothermal carbonization (a thermochemical pretreatment process whereby biomass is treated under hot pressurized water) [3,6].
One of the main challenges for growing commercial bioenergy crops is to produce high yields with minimal fertilizer application and other inputs while also avoiding competition with food crops [7]. Perennial grasses have been proposed as feasible bioenergy crops due to their high yield capacity, ability to grow on marginal lands without displacing food crops, and belowground carbon (C) allocation that enhances soil C sequestration [8,9,10,11]. One such perennial crop is Miscanthus x giganteus (miscanthus), which is a widely recognized advanced biofuel feedstock [11,12,13,14,15,16,17].
Research over the past decade indicates that advanced lignocellulosic biofuel feedstocks like miscanthus have greater GHG mitigation potential than Zea mays (maize) [10,18] but the sustainability and financial profitability of any energy crop depend in part on the application and management of nitrogen (N) fertilizers [19]. There is no consensus about the effects of N fertilizer application on miscanthus biomass yield, with various long-term studies around the world reporting variable productivity with fertilizer [20,21,22,23]. Some studies have found no correlation between N fertilization and the biomass productivity of miscanthus [7,24], while others observed a small response in biomass yield [25]. Initial site conditions prior to the application of N fertilizer could affect biomass responses to N fertilizer.
The inconsistent effect of N fertilizer application on miscanthus yields, in combination with the evidence that miscanthus crops do not always require N inputs, underscores the importance of evaluating alternative soil amendments. Several studies have measured greenhouse gas (GHG) emissions from miscanthus production [26,27,28,29] and established a link between the application of N fertilizer and soil GHG emissions. In order to protect soil N reserves and decrease the potential of soil GHG emissions while also maximizing biomass yield, a more targeted fertilization approach might be required.
One strategy is to determine nutrient requirements using a method based on the amounts of N removed at harvest, which led Cadoux et al. [30] to recommend a maximum nutrient fertilization of 98 kg N ha−1 y−1, 4.7 kg P ha−1 y−1, and 140 kg K ha−1 y−1 for a dry matter yield of 20 Mg miscanthus ha−1 at harvest (except when soil nutrient contents are already high). Due to the potential adverse impacts of applying fertilizer on soil and water quality, research is still needed to test alternative forms of fertilization that could potentially increase the yield of perennial crops while decreasing the net GHG emissions.
Digestate from anaerobic digestion (AD) provides an alternative to synthetic fertilizers. It is the nutrient rich solid waste left after the production of biogas via AD. The application of AD digestate as an organic fertilizer can increase the amount of N available to crops, biomass yield, and also improve soil physical properties [2]. Barbosa et al. [2] applied AD digestate as a plant fertilizer to Sida hermaphrodita (Virginia fam- petal), maize, and Medicago sativa L. (Alfalfa) and found the effect on biomass production was similar to synthetic NPK (Nitrogen, Phosphorus, and Potassium) fertilizer. Similarly, Koszel and Lorencowicz [31] compared the application of digestate and synthetic NPK fertilizer in alfalfa and found that macronutrients increased in leaves of the alfalfa fertilized with digestate. Recently, Czubaszek et al. [32] applied digestate from wetland biomass to soils and confirmed that digestate resulted in an increase in GHG fluxes to the atmosphere due to the mineralization of its easily biodegradable organic compounds. Barbosa et al. [2] and Verdi et al. [33] did not find a yield difference in maize treated with digestate and urea fertilizer, but noted that digestate released 23% more N2O gases while urea emitted 66% more NH3 gas.
Hydrothermal carbonization (HTC) is a thermochemical pretreatment process where biomass is treated under hot pressurized water to produce hydrochar, a carbon-rich product [3]. Although there is a wealth of research on the application of biochar (the product of pyrolysis of raw biomass feedstocks) to soil, little is known about soil amendment with hydrochar and its impact on soil microorganisms that cycle nutrients [3]. The HTC method has the advantage of being able to utilize wet feedstocks [34], and thus additional energy will not be needed to dry the feedstock before being fed into the HTC reactor. As an organic fertilizer, the application of hydrochar in agriculture is encouraged as a replacement for chemical fertilizers because its application has been linked to a reduction in GHG emissions [35].
Despite the potential benefits, some studies find contradictory responses of soils to hydrochar. Kammann et al. [36] discovered that hydrochars only reduced N2O emissions initially but significantly increased N2O emissions up to 302% compared to a control treatment when N fertilizer was added. A recent soil column experiment by Hou et al. [37] investigated the effect of sawdust-derived hydrochar on yield and N2O fluxes in rice paddies and found an increase in yield with a decrease in N2O emissions. Chu et al. [38] observed a 13.5–26.8% increase in rice yield when hydrochar derived from Chlorella vulgaris was applied in a soil column experiment, but they report a 2.17–2.82-fold increase in N2O emissions from amended treatments compared to a control treatment. The few studies investigating hydrochar effects on GHG are mainly conducted in soil columns in a laboratory setting [36,37,38] which may not fully explain the soil responses in field conditions. Field studies with hydrochar are rare, and the effects of hydrochar application are still uncertain.
While several studies have investigated the effects of synthetic N fertilization on the yield and GHG emissions in miscanthus plots, at the time of this writing no studies have determined the relative response of miscanthus to digestate and hydrochar soil amendments compared to a synthetic N fertilizer. Therefore, the objective of this study was to evaluate the effects of three different fertilization treatments (urea, digestate from an anaerobic digester, and hydrochar) on biomass yield and soil GHG fluxes in an established miscanthus stand grown on abandoned land. We hypothesized that the urea would result in the greatest biomass yield compared to the other treatments and the control. With respect to soil GHG fluxes, it was expected that urea would result in greater CH4, CO2, and N2O fluxes compared to the other treatments. We also hypothesized that raw digestate would result in lower biomass yield compared to the urea, greater biomass than the hydrochar treatment, and greater soil fluxes of CO2, CH4, and N2O than hydrochar-amended soils. The final hypothesis was that hydrochar application would result in biomass yields similar to the control, but reduced CO2, CH4, and N2O fluxes compared to the other treatments.
2. Materials and Methods
2.1. Study Site and Experimental Design
The study was conducted at the Ridges Land Laboratory located on the Ohio University main campus in Athens, Ohio, USA (39.32° N and 82.12° W). Mean annual precipitation at this location was 101 cm and the mean annual temperature was 15 °C. Two separate sites (A and B) each originally included three replicated plots of bioenergy crops. This experiment uses a randomized block design with all treatments replicated within four of the six original plots, two of which are located at each of the two sites. The experimental plots of miscanthus, planted in 2013 from rhizomes spaced 76 cm apart, were randomly assigned to locations within the two sites, and each plot was sized 10 m × 10 m. Site A was historically used for pasture while site B was historically managed for hay, but neither site was managed for the 23 years prior to crop planting in 2013. The sites were primarily dominated by grasses before planting and there was significant deer herbivory that prevented woody plant establishment. The soils of sites A and B consist of Aquic Hapludalfs with silty loam texture and Typic Hapludalfs with silty clay loam texture, respectively. The mineral N and C amounts in the soils, based on soil cores taken in 2013 before the miscanthus plots were planted, were on average 0.28% N and 2.66% C at site A and 0.26% N with 3.18% C at site B.
No fertilizer application occurred since the establishment of the miscanthus plots in 2013, so this study was the first to examine the effects of fertilizer application on the yield and GHG emissions at the site. Two 10 m × 10 m miscanthus plots (blocks) at site A and two 10 m × 10 m miscanthus plots (blocks) at site B were each divided into four 3 m × 3 m subplots (treatment groups): (1) hydrochar, (2) digestate, (3) urea (NH2CONH2), and (4) control (i.e., no fertilizer applied). To reduce bias, treatments were randomized among the subplots. Figure 1 depicts the layout of Miscanthus x giganteus plots at site A and site B. A1 and A2 are situated at site A while B1 and B2 are situated at site B. Random numbers were generated and used to assign a soil collar to a particular location in the plot. The numbers, e.g., (8,7), represent the coordinates of the position of each collar measured in meters starting from the southeast corner of the plot (Figure 1).
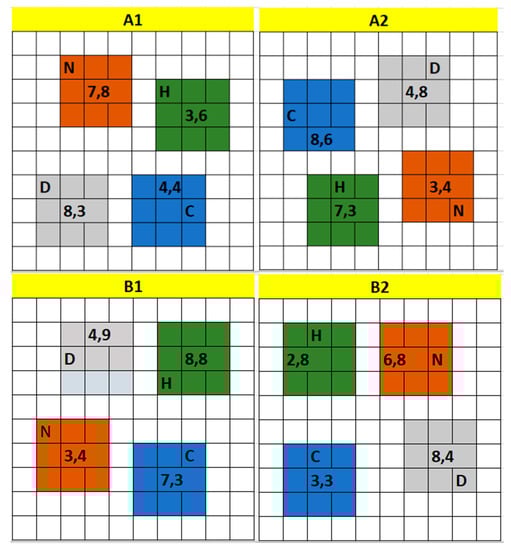
Figure 1.
Layout of the blocks showing randomized locations of subplots. “C” = control treatment, “D” = digestate treatment, “N” = urea treatment, “H” = hydrochar treatment. Blocks A1 and A2 are located in site A while blocks B1 and B2 are located in site B. Numbers separated by commas indicate coordinates (m) of soil collar measured from the southeast corner of the plot.
2.2. Treatments
All fertilizers were applied on 14 June 2018. Treatments were applied at an equal rate of 100 kg N ha−1 (10 g N m−2), similar to the recommended fertilization rate (98 kg N ha−1) proposed by Cadoux et al. [30] to maintain a dry miscanthus yield of 20 Mg ha−1 at harvest. For the synthetic fertilizer treatment, each 3 m × 3 m subplot received 0.19 kg of dry urea. The digestate was obtained from an anaerobic digester situated in an experimental greenhouse where studies on the potential of biogas production from food waste were ongoing [39]. The N concentration of the digestate was 3.1 g L−1 with a moisture content of 92%. The C concentration of the digestate was 34% [40].
Each 3 m × 3 m digestate-treatment subplot received 28.8 L of digestate (to match an application rate of 100 kg N ha−1). The hydrochar was produced at the Institute for Sustainable Energy and Environment at Ohio University. Hydrothermal carbonization was performed on the digestate at 200 °C in a 7.6-L batch reactor fabricated by Parr Instrument Company (Moline, IL, USA). The N content of the hydrochar was 2.59% and the C content was 44.4%. The final hydrochar obtained was in a slurry form. Each 3 m × 3 m subplot received 13.2 L of hydrochar.
2.3. Biomass Sampling
The miscanthus plots at the Ridges Land Laboratory were established in 2013, and the annual biomass produced was measured starting in the 3rd growing season (2015). Biomass measurements were made every fall just after senescence, usually in November. In each of the six miscanthus plots (three at each site), two subsamples of 1 m2 were harvested by hand and weighed. Hand-held clippers were used to cut 10 cm tissue subsamples from the bottom, middle, and top of the stems of three randomly chosen plants (n = 9) to estimate plant moisture and tissue N composition. A 1-m buffer area was left at the edge of each subplot when conducting subsampling to reduce the impact of edge effects. Total plant fresh mass was recorded immediately after harvest, and then dry mass was determined by drying the stems in an oven at 65 ± 5 °C until a constant dry weight was obtained (~48 h).
Biomass sampling in each of the fertilizer treatments was accomplished on 7 December 2018 after the miscanthus had completely senesced. In each subplot, a 1 m2 quadrat was cut by hand with a machete to measure plant biomass and tissue composition following the same procedure described above for all prior years.
2.4. Measurement and Analysis of Soil Gas Fluxes
To measure soil GHG fluxes, the static chamber method was employed; gas emissions from the soil surface were trapped in a chamber and flux rates determined by taking static measurements of the change in gas concentrations over time within the headspace [41]. Soil collars were installed within each subplot on 15 May 2018 at a depth of 6 cm below ground with 5 cm of the collar above the soil surface. The sampling of soil GHG fluxes began a week after the application of fertilizer treatments (22 June 2018), and was done once a week continuously for 17 weeks until 25 October 2018. This gas sampling method was used because it was relatively inexpensive to set up compared to other methods of GHG sampling, and it also allowed for the investigation of several sites simultaneously.
Sixteen 25 cm diameter polyvinyl chloride (PVC) collars were installed into the soil. The volume of each chamber was 0.0115 m3 consisting of the volume of the cap (0.0095 m3) and the volume of the collar (0.01146 m3). The collars remained in the soil throughout the study. The chamber caps were made of PVC with two septa sampling ports, one for inserting a needle to serve as a pressure vent, and the other for sampling the gas from the chamber. Flexible PVC cloth was attached to the rims of sampling caps to ensure an airtight seal between the cap and the collar. A 12V, 7.5 Ah/20 h battery pack (Drenaline Long Lasting Outdoor Product Batteries, Model #12VB) was used to power a small fan inside the chamber used to continuously circulate and mix the headspace gases during the 30 min sampling period.
Samples were collected from the chamber headspace in 30 mL quantities at three timepoints (0, 15, and 30 min) after the chamber was sealed. The gas samples were each injected into a 10 mL glass serum vial fit with airtight rubber septa and placed in Ziploc bags. Gas samples were analyzed as soon as possible after sampling from the field (within 1–2 days) and stored at 2 °C when it was not feasible to run the samples the same day as the sampling. A gas chromatograph with a custom configuration for simultaneous CO2, CH4, and N2O analysis (Bruker Daltonics Inc, Billerica, MA, USA) was used to analyze the gas samples. Chamber temperatures were measured using a True RMS Industrial Multimeter (Extech® Instruments, Waltham, MA, USA) at each headspace gas sampling time (0, 15, and 30 min). In addition to collecting the headspace temperature and gas samples, soil moisture and soil temperature were measured using a soil moisture meter at a distance of approximately 70 cm away from the soil chamber but within the subplot (General Tools DSMM500) and a DSMM600 Soil Condition Meter, respectively. Soil moisture and temperature were recorded during the 30-min sampling interval for each of the 16 subplots. Weekly samples were generally taken between 11 a.m. and 4 p.m. when air temperatures were near the maximum for the day. The concentration of the gases in ppm obtained from the gas chromatograph was converted from volumetric to mass using the Ideal Gas Law to calculate the amount of each gas in moles:
where P = pressure of the gas, V = volume inside sampling chamber (µL), n = number of moles of the gas (moles), R = universal gas constant = 0.082 L atm/k mole, and T = temperature in Kelvin.
Using the molecular weights and moles of each gas, the mass (g) was calculated using the equation:
where m = mass (g), n = amount of gas (moles), and M = molecular mass of gas (g mol−1).
Gas fluxes were obtained by performing regression analysis between the concentration of gas and the time of each gas sample. The slope (g min−1) was divided by the collar footprint (m2) and the result multiplied by 60 to estimate flux in g m−2 h−1 for CO2. Fluxes for N2O and CH4 were calculated in µg m−2 h−1. To obtain weekly cumulative fluxes, the following equation was used:
Weekly flux = flux (g m−2 h−1) × 24 h day−1 × 7 days.
Weekly fluxes for all 17 weeks of sampling were then summed to obtain the cumulative emissions for the period of the study.
2.5. Statistical Analysis
To investigate the effects of the four treatments (digestate, hydrochar, urea, and control) on cumulative GHG fluxes and biomass yield, linear mixed models within the nlme package in R [42] were run with CO2, flux, CH4 flux, and N2O flux and biomass yield as dependent variables, treatment and site as interacting fixed effects, and block included as a random effect to improve estimation of the variance. For repeated measures comparisons, treatment (subplot) was included in the mixed effect model as a fixed effect and nested within block to account for non-independence due to repeated measures, while date of sampling (week) and site included as additional fixed effects.
An unpaired t-test (SigmaPlot version 14.0, Systat Software, Inc., San Jose, CA, USA, www.systatsoftware.com) was used to detect significant differences in fluxes within treatments between sites if no significant differences were detected using the linear mixed models. In cases where datasets had non-normal distribution, the Mann–Whitney test was applied instead of the t-test. Model residuals were checked for normality using Q-Q plots in R. The relationship between soil fluxes, temperature, and moisture was tested using the Spearman’s rank correlation test in GraphPad Prism version 8.3.0 for Windows, GraphPad software, San Diego, CA, USA. All graphing was done using SigmaPlot version 14.0. An alpha of 0.05 was used for all statistical comparisons.
3. Results
3.1. Soil Temperature and Moisture
The mean atmospheric temperature for the growing season (i.e., April–September) was 10.5 °C, with mean maximum and minimum atmospheric temperatures of 29 °C and 5.9 °C, respectively. Soil temperature in all treatments ranged between 20 and 28 °C in the summer with the highest temperature of 28 °C on both 14 July and 4 September in the plots with the urea-N treatment. The lowest soil temperature measured was on 25 October (10 °C in all treatments). The average soil temperature during the study period at sites A and B was 21 °C and 22 °C, respectively.
The total precipitation for the growing season was 90.55 cm with most of the rainfall occurring in June and September. The minimum soil moisture was 10% volumetric water content (VWC), which was recorded in the control treatment at site A on 29 July. The maximum soil moisture was 50% VWC recorded in the hydrochar treatment at site B on 11 September. The average soil moisture at site A in all treatments was 15% VWC, and the average soil moisture at site B in all treatments was 28% VWC. A nested one-way ANOVA was used to test if treatment had an effect on the variation in soil moisture within sites. The results indicated that treatment had no significant effect on soil moisture, but there was however a significant effect of site on soil moisture (p < 0.001) that is most likely related to the difference in soil texture (site B has greater clay content and is less well drained than site A).
3.2. Biomass Yield
In the year the fertilizers were applied, senescence occurred later than usual, and the harvest date was also later as a result. Typical practice is to harvest biomass after the stems have completely senesced. Oven dried biomass yield was measured on 7 December 2018 (Table 1). The average dry biomass yields without fertilizer additions and measured in the same way from 2015 to 2018, are summarized in Table 2. After fertilizer treatments were applied in 2018, there were no significant differences between the dry biomass yields of the four treatments (Table 1).

Table 1.
Summary of average miscanthus biomass yields for the growing season of 2018 from subplots treated with digestate, hydrochar, urea, and a control treatment (with standard deviations) (n = 4 for all measurements). Average dry biomass yield was calculated by averaging biomass yield in four blocks (plots) for each treatment *.
Table 2.
Summary of miscanthus dry biomass yields with no fertilizer applied from 2015 to 2018 (with standard deviations) (n = 3 for all measurements).
3.3. CO2 Fluxes
Prior to the application of the treatments, baseline GHG fluxes from the soil in all plots were measured. Both the highest (0.092 mg CO2 m−2 h−1) and lowest (−0.012 mg CO2 m−2 h−1) baseline soil CO2 fluxes occurred in site A. The highest flux of CO2 in the week following treatment application was measured in site A (0.959 mg CO2 m−2 h−1) in the digestate treatment (Figure 2b). In the samples collected during the week following application of the fertilizer treatments, soils in all the treatment subplots were a source of CO2, with the exception of the digestate treatment at site B, which instead acted as a very weak sink (−0.023 mg CO2 m−2 h−1) from the atmosphere (Figure 3b).
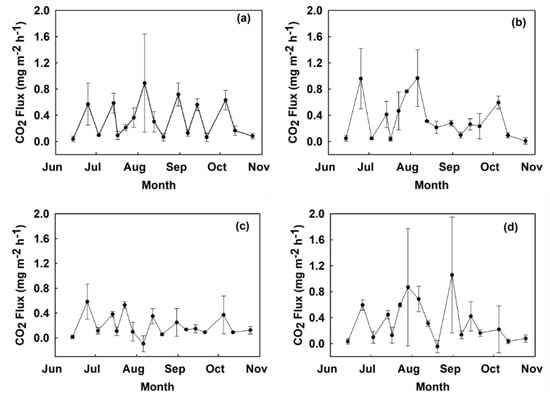
Figure 2.
Time series CO2 fluxes measured from June to October 2018 at site A in mg m−2 h−1 by treatment: (a) control, (b) digestate, (c) hydrochar, (d) urea. Values show a mean across two replicated plots with error bars representing the standard error.
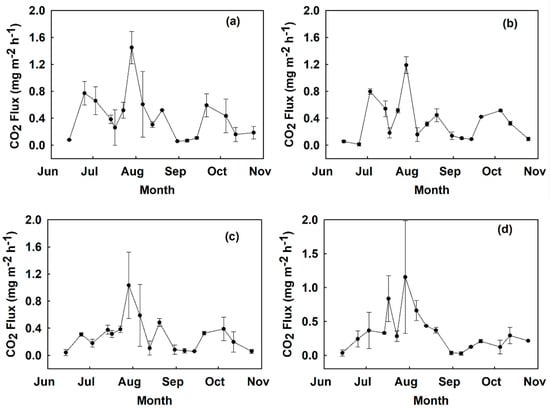
Figure 3.
Time series CO2 fluxes measured from June to October 2018 at site B in mg m−2 h−1 by treatment: (a) control, (b) digestate, (c) hydrochar, (d) urea. Values show a mean across two replicated plots with error bars representing the standard error.
Generally, soil CO2 fluxes in all the treatments were higher in the month of August (Figure 2 and Figure 3). The absolute highest CO2 flux occurred on the 7th week of sampling from the control treatment plot at site A with 1.45 mg CO2 m−2 h−1, and the lowest flux occurred in the hydrochar treatment at site A on 6 August (−0.092 mg CO2 m−2 h−1). The month of October brought a decrease in CO2 fluxes in all treatments as temperatures dropped below 15 °C.
Cumulative CO2 fluxes were not affected by fertilizer treatment (Figure 4) or site when tested with the linear mixed model. There was no significant interaction between treatment and site. There was however a statistically significant difference between hydrochar treatments at site A than site B (p < 0.01) detected with a post-hoc Mann–Whitney test. For repeated measures comparisons, test results suggest there was a statistically significant effect of sampling date on CO2 fluxes in the four treatments (p < 0.001). A Bonferroni multiple comparison test showed that CO2 fluxes in week 7 of sampling were significantly greater than CO2 fluxes in weeks 1, 3, 4, 5, 6, 9, 10, 11, 12, 13, 14,15, 16, and 17 (p < 0.05). CO2 fluxes in weeks 2, 4, 6, 7, and 8 were significantly greater than CO2 fluxes in week 1 (p < 0.05). CO2 fluxes in week 2 were significantly greater than CO2 fluxes in weeks 12 and 17 (p < 0.05). Finally, CO2 fluxes in week 8 were significantly greater than CO2 fluxes in weeks 12, 16, and 17 (p < 0.05).
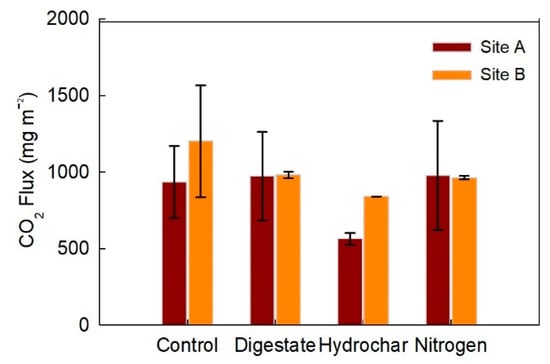
Figure 4.
Cumulative CO2 fluxes in mg m−2 from subplots in sites A and B treated with digestate, hydrochar, urea (nitrogen), and control treatments from June–October 2018. Values are a mean of two replicated plots with error bars representing the standard error.
Mean instantaneous and mean cumulative fluxes were statistically similar in across all treatments when tested with the linear mixed model, but CO2 fluxes generally were lower in the hydrochar treatment plots. Mean instantaneous fluxes were 0.246 mg CO2 m−2 h−1 in the hydrochar-treated soils (0.198 mg CO2 m−2 h−1 in site A, and 0.294 mg CO2 m−2 h−1 in site B), 0.340 mg CO2 m−2 h−1 in the urea-treated soils, 0.342 mg CO2 m−2 h−1 in the digestate-treated soils, and 0.374 mg CO2 m−2 h−1 in the control treatment soils. The average cumulative CO2 fluxes across all four blocks in each treatment were: control (1068.21 mg m−2), digestate (977.24 mg m−2), hydrochar (702.20 mg m−2) and urea (970.11 mg m−2). Hydrochar treatments produced 34% less cumulative CO2 fluxes than control treatments at site A (p < 0.05 as resolved with a Mann–Whitney test).
Soil CO2 fluxes were positively correlated with soil temperature in the urea treated plots (r = 0.21, p < 0.05) and the hydrochar treated plots (r = 0.24, p < 0.05), as shown in Figure 5. There was no correlation between CO2 fluxes and soil temperature in the control plots nor in the digestate plots (Figure 5).
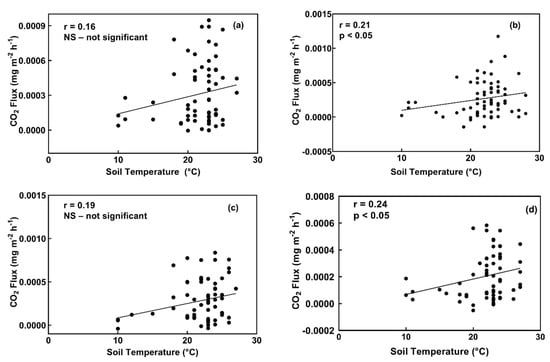
Figure 5.
CO2 fluxes vs. soil temperature at 10 cm in control treatment plots (a), and plots treated with urea (b), digestate (c), and hydrochar (d).
3.4. CH4 Fluxes
All plots became a sink of CH4 on 29 July (Figure 6 and Figure 7). The lowest absolute fluxes occurred during the months of September and October. Total cumulative CH4 fluxes over the period of the study at site A were −24.2 µg CH4 m−2 in digestate, −13.7 µg CH4 m−2 in control, −20.1 µg CH4 m−2 in urea, and −19.9 µg CH4 m−2 in hydrochar treated plots. The total cumulative CH4 flux over the period of the study at site B was 25.9 µg CH4 m−2 in digestate, −2.13 µg CH4 m−2 in control, −8.49 µg CH4 m−2 in urea, and −9.17 µg CH4 m−2 in hydrochar treated plots (Figure 8).
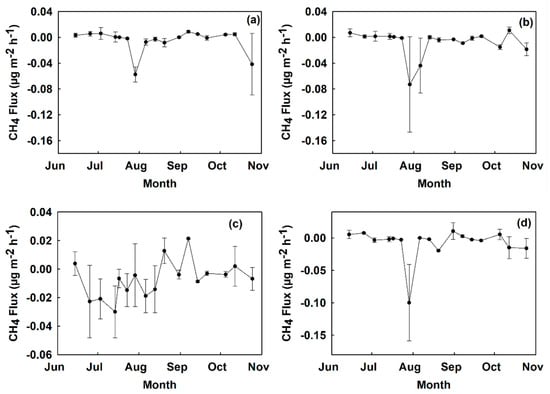
Figure 6.
Time series CH4 fluxes measured from June to October 2018 at site A in µg CH4 m−2 h−1 by treatment: (a) control, (b) digestate, (c) hydrochar, and (d) urea. Values show a mean across two replicated plots with error bars representing the standard error.
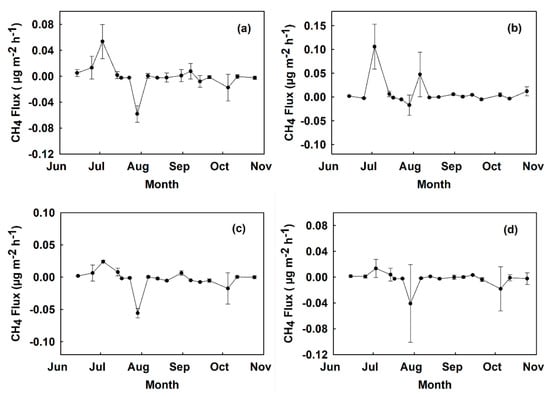
Figure 7.
Time series CH4 fluxes measured from June to October 2018 at site B in µg CH4 m−2 h−1 by treatment: (a) control, (b) digestate, (c) hydrochar, and (d) urea. Values show a mean across two replicated plots with error bars representing the standard error.
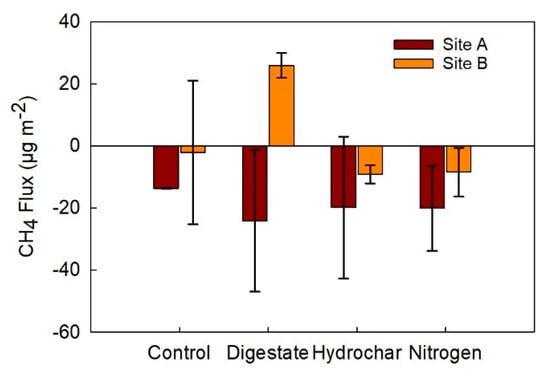
Figure 8.
Cumulative CH4 fluxes in µg m−2 from subplots in sites A and B treated with digestate, hydrochar, urea (nitrogen), and the control treatment from June–October 2018. Values show a mean across two replicated plots with error bars representing the standard error.
Cumulative CH4 fluxes were not affected by fertilizer treatment (Figure 8) or site. There was no significant interaction between treatment and site. In site B, however, the CH4 flux in digestate treatment plots was significantly greater than CH4 fluxes in the hydrochar treatment (p < 0.05; Figure 8).
In repeated measures comparisons, test results suggest there was a statistically significant effect of sampling date on CH4 fluxes in the four treatments (p < 0.001). A Bonferroni multiple comparison test showed that CH4 fluxes in week 3 of sampling were significantly higher than CH4 fluxes in weeks 6, 10, 14, 15 and 17 (p < 0.05). Furthermore, CH4 fluxes in week 7 of sampling were significantly lower than CH4 fluxes in all other weeks (p < 0.001).
Mean instantaneous fluxes ranged from −0.0085 µg CH4 m−2 h−1 in the digestate treatment plots at site A to 0.0091 µg CH4 m−2 h−1 in digestate treatment plots at site B. The average cumulative CH4 fluxes across all four blocks in each treatment were: control (−7.91 µg m−2), digestate (0.85 µg m−2), hydrochar (−14.53 µg m−2), and urea (−14.32 µg m−2). CH4 fluxes in control plots were positively related to soil moisture (r = 0.25, p < 0.05), although the positive trend is driven by the CH4 fluxes measured for timepoints with soil moisture contents between 10 and 23% and there is wide variation (Figure 9). CH4 fluxes were also positively related to soil moisture in digestate plots (r = 0.31, p < 0.01) (Figure 9).
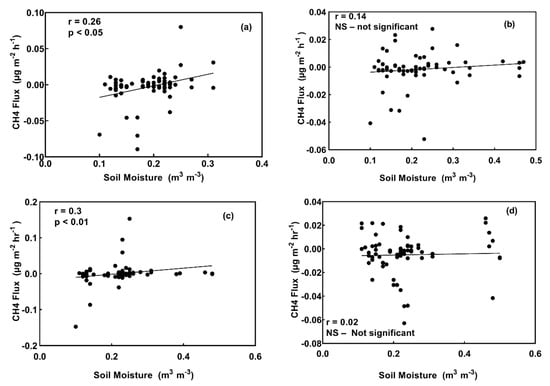
Figure 9.
CH4 fluxes vs. soil temperature at 10 cm in control treatment plots (a), and plots treated with urea (b), digestate (c), and hydrochar (d).
3.5. N2O Fluxes
Soil N2O fluxes were usually negligible, but there were occasional fluxes observed in all treatments in site B except hydrochar. Control plots at both site A and B were insignificant sources of N2O fluxes to the atmosphere (Figure 10). Digestate-treated plots were also an insignificant source of atmospheric N2O, while urea treatment plots were an insignificant sink of N2O. The hydrochar treatment plots were a weak N2O sink only at site A. The only N2O fluxes detected in the urea treatment plots occurred during the first four weeks after the fertilizer treatment was applied at both sites A and B. For the rest of the sampling period, no N2O fluxes were detected in the urea treatment plots. The detection limit of the GC used for analysis was 7 ppb N2O.
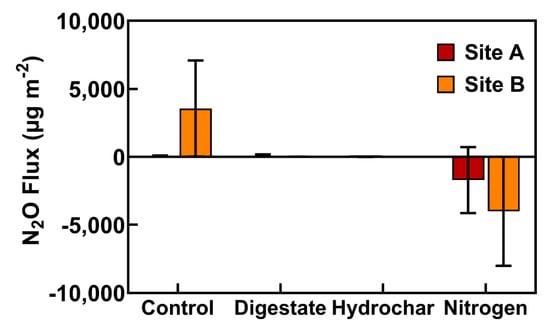
Figure 10.
Cumulative N2O fluxes in µg m−2 from subplots in sites A and B treated with digestate, hydrochar, urea (nitrogen), and control treatment from June–October 2018. Values show a mean across two replicated plots with error bars representing the standard error.
Mean cumulative N2O fluxes were not significantly different from zero, and there were no significant differences between fertilizer treatments over the sampling period. In addition, there was no significant effect of sampling date on N2O fluxes. Soil moisture and temperature were also not significantly correlated with N2O fluxes. The control treatment plots had the highest mean N2O fluxes to the atmosphere, with a mean cumulative flux of 51.60 µg N2O m−2 at site A and 3554 µg N2O m−2 at site B. The mean cumulative N2O fluxes from the digestate-treated soils was 92.80 µg N2O m−2 at site A and 1.46 µg N2O m−2 at site B. The mean cumulative flux from the hydrochar-treated soils was −5.99 µg N2O m−2 from site A and there was no flux detected from site B. The mean cumulative N2O flux from urea-treated soils was −1716 µg N2O m−2 at site A and −4009 µg N2O m−2 at site B. The average cumulative N2O fluxes across all four blocks in each treatment were: control (1802.59 µg m−2), digestate (47.11 µg m−2), hydrochar (−2.99 µg m−2), and urea (−2862.68 µg m−2).
4. Discussion
This is the first field study to date that compares soil GHG fluxes and biomass yield of miscanthus in response to synthetic N fertilizer, hydrochar, and digestate soil amendments. The findings from this study suggest that the application of the three different fertilizer treatments compared to a control treatment did not significantly influence biomass yield in miscanthus. Soil CO2 fluxes were lower in the hydrochar treatment than all other treatments, with 34% lower soil CO2 emissions than the control at site A, suggesting this soil amendment may suppress soil respiration. Soil CO2 fluxes were correlated with soil temperature (p < 0.05) in urea and hydrochar treatments, while CH4 fluxes were significantly correlated with soil moisture (p < 0.05) in the control and digestate plots, suggesting that soil conditions moderate the effects of nutrient amendments on soil GHG emissions.
Lower soil CO2 emissions associated with hydrochar treatments could offer a substantial benefit for biofuel cropping systems that are adopted as alternatives to fossil fuels with the intent of offsetting GHG emissions in the energy sector. In the case of the miscanthus crop studied here, there was no significant effect of fertilizers on plant biomass or plant C. In other crops, there may be an effect of the alternative fertilizers studied here on growth rates, and the difference in plant C should be included in system level assessments of agricultural GHG emissions. Likewise, it will be important to consider the baseline C emissions associated with “business-as-usual” management of the organic material used to make a soil amendment.
Although beyond the scope of this study, the benefits of a hydrochar soil amendment for GHG emissions reduction must ultimately be evaluated relative to other processing pathways that can be used to treat organic waste. Excess digestate from commercial biogas facilities is sometimes stored in large holding ponds, where decomposition would lead to GHG emissions. There are also several alternative nutrient recovery technologies (e.g., chemical crystallization, gas stripping and absorption, membrane separation, and ammonia absorption) that have been developed to produce end products from digestate to substitute chemical synthetic fertilizers [43]. Hydrochar itself has a wide range of applications besides soil amendments. Reza et al. [3] reports that materials from hydrochar function as super capacitors and as anode and cathode materials for Na+ or Li+ ion batteries and fuel cells. Furthermore, Fang et al. [44] reports that the biochemical properties of hydrochar yield pellets with higher heating value (HHV) comparable to lignite coal. In our study, the HTC process was used to treat digestate recovered from a pilot-scale biogas production facility [45], where the digestate would otherwise be added to maturing compost.
4.1. Biomass Yield
The yields measured in all the treatments in this study were within the range reported for other studies of miscanthus in the US [22,23,46,47]. Reports in the literature are not conclusive as to the net effects of N fertilizer application on biomass yields of miscanthus, suggesting an undetermined secondary control on the conversion of N inputs to aboveground biomass. Although some studies suggest that N fertilization could help arrest the long-term yield decline in miscanthus stands [22,23], results of this study indicate that there was no effect of fertilization when applied in the 6th growing season (an age when yield declines are sometimes observed). Biomass yields reviewed from prior literature generally varied depending on different factors such as geographical location, soil type, and management practices, but they all ranged from 10 to 30 Mg ha−1 y−1. The range for yield in this study, 16.7–25.4 Mg ha−1 y−1, is similar to prior literature.
The mean biomass yields in the urea-treated and control plots were very similar (21 Mg ha−1), suggesting that the fertilization treatment did not affect biomass yield as reported by others [7,17,24]. The digestate treatment produced the lowest biomass yield (20.2 Mg ha−1). Previous studies suggest that there might be a delay in plant response to organic fertilizers (e.g., digestate) due to the slow release of organically bound nutrients [48]. Gutser et al. [48] argued that plants can take up 50–80% of mineral fertilizer, but the slow release of organically-bound N and the medium- and long-term N immobilization in soils causes a relatively small effect in the first year after application. Thus, multi-year comparative studies of fertilizer treatments could yield different results than those reported here.
Field studies with the application of hydrochar to crops are scarce [3]. Results from a one-year field trial with hydrochar made from sugar beet pulp and brewers dregs (spent grain) applied at a dosage of 7.5 Mg ha−1 increased the yield of winter wheat slightly, but decreased the yield at an application rate of 10 Mg ha−1 [49]. This yield reduction was attributed to an immobilization of N caused by mineralization of the labile fraction in the hydrochar [49]. The hydrochar-treated plots in this study had the greatest biomass yield (23.5 Mg ha−1), though not significantly different from the other treatments.
4.2. Soil CO2 Fluxes
Our hypothesis that urea fertilizer produces the highest CO2 fluxes among all treatments was not supported, as CO2 fluxes in the urea fertilizer treatment plots were only greater than those of the hydrochar treatment plots. Digestate treatment plots produced greater CO2 fluxes than the hydrochar treatment plots, although the difference was not statistically significant. Hydrochar treatments trended toward reducing CO2 fluxes compared to the other treatments.
The hydrochar treatment produced the lowest net cumulative CO2 fluxes with 34% lower CO2 flux than the control in site A. This result is contrary to other studies [36,50,51] that found a higher production of CO2 with hydrochar application. This difference could be due to differences in the biodegradation rates of the feedstocks used in making the hydrochar [50]. Secondly, Gajic et al. [49] notes that differences in processing temperature and time of hydrochar could lead to differences in the amount of C mineralized in soil. In the field, moisture variability could influence the rate at which microbial organisms degrade the C in the hydrochar, resulting in less C emission when soil moisture is low. Digestate, control, and urea treatments had similar mean weekly CO2 fluxes. Compared to other studies where different rates of N fertilizers were applied to miscanthus, soil CO2 fluxes measured in this study were similar in magnitude [27]. Samples for this study were collected over a period of five months, thus the cumulative fluxes were lower than others reported in the literature that evaluated year round soil flux [26,27,28].
Mean cumulative CO2 fluxes in Behnke et al. [28] ranged from 8.62 Mg C ha−1 in control plots to 9.11 Mg C ha−1 in plots treated with 60 kg N ha−1 and 8.62 Mg C ha−1 in plots treated with 120 kg N ha−1. They also reported that fertilizer treatment did not significantly affect mean cumulative CO2 fluxes from 4-year-old miscanthus stands. The mean of CO2 emissions in the study by Gauder et al. [26] was 50 mg C m−2 h−1 for N-fertilized plots and 47 mg C m−2 h−1 for unfertilized plots. In this study, miscanthus plots fertilized with N had a mean CO2 emission of 0.340 mg C m−2 h−1 while unfertilized miscanthus plots had a mean CO2 flux of 0.374 mg C m−2 h−1. Cadoux et al. [27] reported mean CO2 fluxes of 0.23 mg C m−2 h−1 for miscanthus which is similar to this study’s reported mean instantaneous CO2 fluxes in all treatments ranging from 0.246 to 0.374 mg C m−2 h−1. Overall, this study resolved mean instantaneous CO2 emissions as 0.374 mg C m−2 h−1, 0.342 mg C m−2 h−1, 0.340 mg C m−2 h−1, 0.246 mg C m−2 h−1 in the control, digestate, urea and hydrochar treated plots, respectively, which were lower than mean CO2 fluxes in Roth et al. [26] but similar to those in Cadoux et al. [27]. It can thus be inferred that applying these four fertilizer types to achieve the same added-N content will not result in significant differences in CO2 fluxes but there might be an advantage to applying hydrochar.
Soil temperature and soil moisture are important factors for explaining differences in trace gas emissions from soils [52]. An increase in soil temperature leads to greater emissions and to higher soil respiration rates due to increased microbial metabolism [52]. Results from this current study show significant cumulative increase in CO2 fluxes in week 7 of sampling (Figure 2 and Figure 3). This increase could be explained by the higher temperatures that characterize the last week of July.
CO2 fluxes were positively and significantly related to soil temperature in the urea plots (r = 0.21, p < 0.05) and hydrochar treatment plots (r = 0.24, p < 0.05) in this study. CO2 fluxes in the digestate and control plots were not significantly correlated to soil temperature, possibly because of the stability of the organic C in those two treatments. In addition, soil moisture in the control and digestate plots was below 0.15 cm3/cm−3 on average which may have influenced the sensitivity of soil respiration (which usually increase with soil moisture) [53]. Regardless of the temperature, soil CO2 fluxes depend largely on the ability of soil microorganisms to access and degrade the highly stable C.
4.3. Soil CH4 Fluxes
Although soil CH4 fluxes were highest in digestate-treated plots, this flux was only significantly greater than the hydrochar treatment (p < 0.05). With no other significant differences in soil CH4 fluxes, our hypothesis that urea would produce the highest CH4 fluxes was not supported. As expected, CH4 fluxes were generally very low compared to fluxes of CO2 throughout the season, except in late July to early August when most soil microorganisms were likely very active due to high temperatures coupled with high soil moisture. CH4 emissions in hydrochar treatments were similar and not significantly different from control treatments. Both the control and hydrochar treatment acted as sinks for CH4 fluxes. This finding is similar to Hou et al. [37] where hydrochar additions to soil were effective at lowering CH4 emissions, but the GHG emissions produced were similar to control treatments and were neither affected by hydrochar type or application. Zhou et al. [54] also observed lower CH4 fluxes at lower application rates of the hydrochar (0.5%) and advised that the amount of hydrochar used should be carefully considered before applying to soil.
A few occasional positive CH4 fluxes were observed in the digestate treatment plots on 3 July (0.15 µg m−2 h−1) and 9 August (0.09 µg m−2 h−1), both at site B. All treatments were CH4 sinks at site A. Site B digestate treatment plots were a net source of CH4 fluxes, while all other treatment plots were a net CH4 sink. The trend of most treatment plots acting as CH4 sinks at site A could be explained by the differences in soil properties at site A and B. Firstly, site B had higher average soil moisture (28% VWC) than site A (15% VWC), and CH4 production requires anaerobic conditions that are more prevalent in high-moisture soils. Secondly, soils usually act as sinks under aerobic conditions [52], explaining why all treatments at site A with a lower moisture level acted as CH4 sinks. Finally, baseline soil C analysis indicates site B had a soil C content of 3.18% while site A had 2.66% C. The larger soil C content at site B may explain why more C in site B was converted into CH4 resulting in a CH4 source.
According to Aronson and Helliker [55], soil exchange of CH4 with the atmosphere is regulated by two groups of microorganisms: methanogens, which are very active in anaerobic conditions, and methanotrophic bacteria, which are active in aerobic conditions. Methanogens mainly produce CH4 as a byproduct of metabolism and are the main biological source of CH4 across systems, while methanotrophic bacteria metabolism is based on the oxidation of CH4 [55]. The moisture content of the soil, which is generally correlated with precipitation level for most of the growing season, was low at both sites throughout our study period. Both sites A and B are non-wetland soils, suggesting that methanotrophic bacteria could be responsible for the higher uptake of CH4. This trend cannot, however, be assumed for the digestate-treated plots, which had relatively high soil moisture (0.46 m3 m−3).
Liu and Greaver [56] reviewed the literature on the effects of N enrichment on CH4, CO2, and N2O fluxes, and the results suggested that N additions caused a general stimulation of CH4 emissions and a suppression of CH4 uptake across multiple types of ecosystems. Results from our study contradict this pattern that would have predicted that the methanotrophic population would oxidize less CH4 into the atmosphere after a soil N addition. Instead, this study supports the claim made by Aronson and Helliker [55], that many factors (i.e., ecosystem, biome, temperature, precipitation, amount of N added, latitude, duration of N addition, and previous land use) influence the interaction of N inputs and soil CH4 fluxes. Generally speaking, the longer the duration of N fertilization, the greater the decrease in soil CH4 uptake [55]. Our two sites were previously unmanaged for more than 20 years prior to the establishment of the miscanthus plots, and baseline soil measurements taken in 2013 indicated higher C in soils at site B than site A, but a similar N content in the 0–10 cm soil depth at both sites. Site A had a soil N content of 0.28% while site B had a soil N content of 0.26% when C and N analysis were performed on the soils in 2013. Low levels of legacy N in the soil, coupled with the fact that this was the first time N was added to the soil, may explain the small effect of N fertilization on CH4 fluxes relative to other studies.
4.4. Soil N2O Fluxes
Our hypothesis that plots treated with urea fertilizer would have the highest N2O fluxes was not supported by our results. Instead, there was no significant difference in N2O fluxes, even while the urea fertilizer and hydrochar treatment plots had lower mean N2O emissions. Noticeably, there were no N2O fluxes recorded for about 80% of the sampling weeks, and only occasional effluxes in the control and urea treatment plots. Baseline soil flux measurements before applying treatments were made on 14 June and there was no N2O flux detected in any of the treatments. After the treatment application, the urea treatment plots produced the highest N2O fluxes (0.25 µg m−2 h−1) at site A on the first sampling week and 2.14 µg m−2 h−1 at site B. These fluxes were clearly a result of the application of the fertilizer as no fluxes were detected in the control treatments that week.
Out of the 17 weeks of sampling, fluxes of N2O in the hydrochar treatment plots were detected on only five sampling weeks at site A, and these all showed the soils acted as a small sink on average. There was no N2O flux recorded at site B for hydrochar-treated soils. Generally, studies investigating the effects of hydrochar on N2O emissions report a reduction in N2O emissions [36,37,50,54]. Kammann et al. [36] however observed a subsequent increase in N2O emissions of 302%. Hydrothermal carbonization usually results in an increase in the C of the material that was pretreated resulting in an increase in C content of soil when used as an amendment [3]. Higher C:N ratios (17:1 in the case of hydrochar used in this study) are correlated with higher immobilization of organic N in soil, which reduces mineralization and nitrification. This likely led to the suppression of denitrification in hydrochar-treated soils.
N2O fluxes in the digestate treatment at site A occurred on only two sampling weeks one month apart and resulted in the site acting as a weak net source of N2O. The release of N2O on these two sampling weeks could be caused by an accumulation of organic C in the soil from the digestate [33] which Möller and Müller [57] claim stimulates N2O production from soil through denitrification. After applying digestate at a rate of 170 kg N ha−1 to soil, Czubaszek [32] reported a release of N2O fluxes for several days after application. They explain that this initial increase resulted from denitrification induced by the reduction in oxygen concentrations caused by microbial respiration. This study used a lower N application rate (100 kg N ha−1) which may explain why N2O was only released on two occasions. Similarly, Buchen-Tschiskale [58] observed that digestate released significantly greater N2O fluxes compared to N fertilizer but the release was rather short term. Their study used application rates ranging from 202 to 254 kg N ha−1 [58] which is more than twice the application rate used in this current study which implies N2O fluxes are dependent on the N application rate.
Site B had four weeks of N2O fluxes that resulted in the site acting as a weak net source of N2O fluxes, although mean cumulative fluxes were not significantly different from zero. One sampling time point stood out as showing a very high flux of N2O in the control treatment at site A (i.e., 103.22 µg m−2 h−1). No explanation could be given for such a detection of this flux on a day when the temperature was low and there was no precipitation; hence, this was most likely the result of an anomalous event in the soil on that sampling day (e.g., animal defecation or soil disturbance). Similarly, N2O fluxes in the control treatment plots were also recorded on four different weeks at site B, indicating the control plots were a net source of N2O fluxes over the sampling period of this experiment.
Gao et al. [59] contends that low N2O emissions even after urea application may be due to the suppression of microbial activity with low soil moisture. In this study, a large amount of the N2O fluxes occurred at site A, which had relatively lower soil moisture (15% VWC) compared to site B (46% VWC). Generally, there was no significant difference between N2O fluxes in the four treatments.
Biochar and hydrochar are similar-C rich substances produced from biomass that can be used as a soil amendment. Whereas biochar is produced by pyrolysis, hydrochar is produced through hydrothermal carbonization. Biochar has been known to reduce N2O fluxes when applied to soils and this is largely corroborated across several studies [36,60,61,62,63]. In this study, raw digestate treatments produced a weak source of N2O emissions, which corroborates what Dicke et al. [62] found after comparing N2O emissions from soils fertilized with chars and digestate. Dicke et al. [62] argued that the N present in digestate is more easily available for microorganisms than the N present in chars.
5. Conclusions
This study resolved the effect of using three different types of fertilizers (i.e., hydrochar, digestate, and urea) in miscanthus crops for increasing biomass yield and reducing soil GHG fluxes. The differences in biomass yield between the three treatments and control plots were not statistically significant, but slight positive differences were observed in the site with greater soil moisture. These results correspond to one growing season of treatment in a mature miscanthus crop, and further study of long-term effects is needed. Organic fertilizers like digestate and hydrochar likely have a slower release of N, which takes time to become available to plant roots, and thus may have a delayed effect on both biomass yield and GHG fluxes. Future studies that evaluate nitrogen mineralization in the soil would help to resolve responses over time. CO2 fluxes were 34% lower in hydrochar-treated soils than in the control treatment at site A, although not significantly different from the other two treatments. Applying digestate as a soil amendment resulted in a net CH4 source while urea and hydrochar fertilizers increased the net CH4 uptake. Overall, soil conditions (i.e., texture, temperature, moisture) appear to have a greater effect on GHG fluxes than the soil amendments.
Author Contributions
Conceptualization, T.A. and S.C.D.; methodology, T.A., K.E.M., A.M.R., S.C.D.; validation, S.C.D.; formal analysis, T.A.; investigation, T.A.; resources, S.C.D. and M.T.M.R.; data curation, T.A., A.M.R., K.E.M. and S.C.D.; writing—original draft preparation, T.A.; writing—review and editing, T.A., K.E.M., S.C.D., and M.T.M.R.; visualization, T.A.; supervision, S.C.D.; project administration, S.C.D.; funding acquisition, S.C.D. All authors have read and agreed to the published version of the manuscript.
Funding
This research was supported by the Environmental Studies program in the Voinovich School of Leadership and Public Affairs, with partial financial support from an Ohio University 1804 Fund and the AEP Foundation.
Acknowledgments
This research was supported by the Environmental Studies program in the Voinovich School of Leadership and Public Affairs, with partial financial support from an 1804 Fund and the AEP Foundation. Special thanks to Akbar Saba and Nepu Saha for processing of the hydrochar. Thank you to Andrew Fox, Tess Herman, Nick Momenee, Dillman Delgado, Jon Grennell, Dimas Philipinanto, Alexander Jones, Tanner Filyaw, and Taylor Snelick for their help during harvesting of the miscanthus.
Conflicts of Interest
The authors declare no conflict of interest.
References
- Davis, S.C.; Boddey, R.M.; Alves, B.J.; Cowie, A.L.; George, B.H.; Ogle, S.M.; Smith, P.; van Noordwijk, M.; van Wijk, M.T. Management swing potential for bioenergy crops. GCB Bioenergy 2013, 5, 623–638. Available online: http://onlinelibrary.wiley.com/doi/10.1111/gcbb.12042/full (accessed on 19 August 2017). [CrossRef]
- Barbosa, D.B.P.; Nabel, M.; Jablonowski, N.D. Biogas-digestate as nutrient source for biomass production of Sida hermaphrodita, Zea mays L. and Medicago sativa L. Energy Procedia 2014, 59, 120–126. [Google Scholar] [CrossRef]
- Reza, M.T.; Andert, J.; Wirth, B.; Busch, D.; Pielert, J.; Lynam, J.G.; Mumme, J. Hydrothermal Carbonization of Biomass for Energy and Crop Production. Appl. Bioenergy 2014, 1, 11–29. [Google Scholar] [CrossRef]
- Aso, S.N. Digestate: The Coproduct of Biofuel Production in a Circular Economy, and New Results for Cassava Peeling Residue Digestate. In Renewable Energy; IntechOpen: London, UK, 2020. [Google Scholar]
- Nkoa, R. Agricultural benefits and environmental risks of soil fertilization with anaerobic digestates: A review. Agron. Sustain. Dev. 2014, 34, 473–492. [Google Scholar] [CrossRef]
- Berge, N.D.; Ro, K.S.; Mao, J.; Flora, J.R.; Chappell, M.A.; Bae, S. Hydrothermal carbonization of municipal waste streams. Environ. Sci. Technol. 2011, 45, 5696–5703. [Google Scholar] [CrossRef]
- Teat, A.L.; Neufeld, H.S.; Gehl, R.J.; Gonzales, E. Growth and Yield of Miscanthus × giganteus Grown in Fertilized and Biochar-Amended Soils in the Western North Carolina Mountains. Castanea 2015, 80, 45–58. [Google Scholar] [CrossRef]
- Sartori, F.; Lal, R.; Ebinger, M.H.; Parrish, D.J. Potential Soil Carbon Sequestration and CO2 Offset by Dedicated Energy Crops in the USA. Crit. Rev. Plant Sci. 2006, 25, 441–472. [Google Scholar] [CrossRef]
- Adler, P.R.; Grosso, S.J.D.; Parton, W.J. Life-cycle assessment of net greenhouse-gas flux for bioenergy cropping systems. Ecol. Appl. 2007, 17, 675–691. Available online: http://onlinelibrary.wiley.com/doi/10.1890/05-2018/full (accessed on 2 September 2017). [CrossRef]
- Davis, S.C.; Parton, W.J.; Grosso, S.J.D.; Keough, C.; Marx, E.; Adler, P.R.; DeLucia, E.H. Impact of second-generation biofuel agriculture on greenhouse-gas emissions in the corn-growing regions of the US. Front. Ecol. Environ. 2012, 10, 69–74. Available online: http://onlinelibrary.wiley.com/doi/10.1890/110003/full (accessed on 10 September 2017). [CrossRef]
- Hudiburg, T.W.; Davis, S.C.; Parton, W.; Delucia, E.H. Bioenergy crop greenhouse gas mitigation potential under a range of management practices. GCB Bioenergy 2015, 7, 366–374. [Google Scholar] [CrossRef]
- Lewandowski, I.; Clifton-Brown, J.C.; Scurlock, J.M.O.; Huisman, W. Miscanthus: European experience with a novel energy crop. Biomass Bioenergy 2000, 19, 209–227. [Google Scholar] [CrossRef]
- Clifton-brown, J.C.; Stampfl, P.F.; Jones, M.B. Miscanthus biomass production for energy in Europe and its potential contribution to decreasing fossil fuel carbon emissions. Glob. Chang. Biol. 2004, 10, 509–518. [Google Scholar] [CrossRef]
- Heaton, E.A.; Dohleman, F.G.; Long, S.P. Meeting US biofuel goals with less land: The potential of Miscanthus. Glob. Chang. Biol. 2008, 14, 2000–2014. [Google Scholar] [CrossRef]
- Heaton, E.A.; Dohleman, F.G.; Long, S.P. Seasonal nitrogen dynamics of Miscanthus×giganteus and Panicum virgatum. GCB Bioenergy 2009, 1, 297–307. [Google Scholar] [CrossRef]
- Voigt, T.B. Are the environmental benefits of Miscanthus × giganteus suggested by early studies of this crop supported by the broader and longer-term contemporary studies? GCB Bioenergy 2015, 7, 567–569. [Google Scholar] [CrossRef][Green Version]
- Davis, M.P.; David, M.B.; Voigt, T.B.; Mitchell, C.A. Effect of nitrogen addition on Miscanthus × giganteus yield, nitrogen losses, and soil organic matter across five sites. GCB Bioenergy 2015, 7, 1222–1231. [Google Scholar] [CrossRef]
- Felten, D.; Fröba, N.; Fries, J.; Emmerling, C. Energy balances and greenhouse gas-mitigation potentials of bioenergy cropping systems (Miscanthus, rapeseed, and maize) based on farming conditions in Western Germany. Renew. Energy 2013, 55 (Suppl. C), 160–174. [Google Scholar] [CrossRef]
- Shield, I.F.; Barraclough, T.J.P.; Riche, A.B.; Yates, N.E. The yield and quality response of the energy grass Miscanthus × giganteus to fertiliser applications of nitrogen, potassium and sulphur. Biomass Bioenergy 2014, 68 (Suppl. C), 185–194. [Google Scholar] [CrossRef]
- Clifton-Brown, J.C.; Breuer, J.; Jones, M.B. Carbon mitigation by the energy crop, Miscanthus. Glob. Chang. Biol. 2007, 13, 2296–2307. [Google Scholar] [CrossRef]
- Christian, D.G.; Riche, A.B.; Yates, N.E. Growth, yield and mineral content of Miscanthus×giganteus grown as a biofuel for 14 successive harvests. Ind. Crops Prod. 2008, 28, 320–327. [Google Scholar] [CrossRef]
- Arundale, R.A.; Dohleman, F.G.; Voigt, T.B.; Long, S.P. Nitrogen Fertilization Does Significantly Increase Yields of Stands of Miscanthus × giganteus and Panicum virgatum in Multiyear Trials in Illinois. BioEnergy Res. 2014, 7, 408–416. [Google Scholar] [CrossRef]
- Lee, M.-S.; Wycislo, A.; Guo, J.; Lee, D.K.; Voigt, T. Nitrogen Fertilization Effects on Biomass Production and Yield Components of Miscanthus ×giganteus. Front. Plant Sci. 2017, 8, 544. [Google Scholar] [CrossRef] [PubMed]
- Danalatos, N.G.; Archontoulis, S.V.; Mitsios, I. Potential growth and biomass productivity of Miscanthus×giganteus as affected by plant density and N-fertilization in central Greece. Biomass Bioenergy 2007, 31, 145–152. [Google Scholar] [CrossRef]
- Finnan, J.; Burke, B. Nitrogen fertilization of Miscanthus × giganteus: Effects on nitrogen uptake, growth, yield and emissions from biomass combustion. Nutr. Cycl. Agroecosystems 2016, 106, 249–256. Available online: https://www.cabdirect.org/cabdirect/abstract/20163384719 (accessed on 22 February 2018). [CrossRef]
- Gauder, M.; Butterbach-Bahl, K.; Graeff-Hönninger, S.; Claupein, W.; Wiegel, R. Soil-derived trace gas fluxes from different energy crops–results from a field experiment in Southwest Germany. GCB Bioenergy 2012, 4, 289–301. [Google Scholar] [CrossRef]
- Drewer, J.; Finch, J.W.; Lloyd, C.R.; Baggs, E.M.; Skiba, U. How do soil emissions of N2O, CH4 and CO2 from perennial bioenergy crops differ from arable annual crops? GCB Bioenergy 2012, 4, 408–419. [Google Scholar] [CrossRef]
- Behnke, G.D.; David, M.B.; Voigt, T.B. Greenhouse Gas Emissions, Nitrate Leaching, and Biomass Yields from Production of Miscanthus × giganteus in Illinois, USA. Bioenergy Res. 2012, 5, 801–813. [Google Scholar] [CrossRef]
- Roth, B.; Finnan, J.M.; Jones, M.B.; Burke, J.I.; Williams, M.L. Are the benefits of yield responses to nitrogen fertilizer application in the bioenergy crop Miscanthus × giganteus offset by increased soil emissions of nitrous oxide? GCB Bioenergy 2015, 7, 145–152. [Google Scholar] [CrossRef]
- Cadoux, S.; Riche, A.B.; Yates, N.E.; Machet, J.-M. Nutrient requirements of Miscanthus x giganteus: Conclusions from a review of published studies. Biomass Bioenergy 2012, 38 (Suppl. C), 14–22. [Google Scholar] [CrossRef]
- Koszel, M.; Lorencowicz, E. Agricultural use of biogas digestate as a replacement fertilizers. Agric. Agric. Sci. Procedia 2015, 7, 119–124. [Google Scholar] [CrossRef]
- Czubaszek, R.; Wysocka-Czubaszek, A.; Roj-Rojewski, S.; Banaszuk, P. Greenhouse gas fluxes from soils fertilised with anaerobically digested biomass from wetlands. Mires Peat 2019, 25, 1–11. [Google Scholar]
- Verdi, L.; Kuikman, P.J.; Orlandini, S.; Mancini, M.; Napoli, M.; Marta, A.D. Does the use of digestate to replace mineral fertilizers have less emissions of N2O and NH3? Agric. For. Meteorol. 2019, 269–270, 112–118. [Google Scholar] [CrossRef]
- Bai, M.; Wilske, B.; Buegger, F.; Esperschütz, J.; Kammann, C.I.; Eckhardt, C.; Koestler, M.; Kraft, P.; Bach, M.; Frede, H.G.; et al. Degradation kinetics of biochar from pyrolysis and hydrothermal carbonization in temperate soils. Plant Soil 2013, 372, 375–387. [Google Scholar] [CrossRef]
- Galic, M.; Mesic, M.; Zgorelec, Z. Influence of Organic and Mineral Fertilization on Soil Greenhouse Gas Emissions. A Review. Agric. Conspec. Sci. 2020, 85, 1–8. [Google Scholar]
- Kammann, C.; Ratering, S.; Eckhard, C.; Müller, C. Biochar and hydrochar effects on greenhouse gas (carbon dioxide, nitrous oxide, and methane) fluxes from soils. J. Environ. Qual. 2012, 41, 1052–1066. [Google Scholar] [CrossRef] [PubMed]
- Hou, P.; Feng, Y.; Wang, N.; Petropoulos, E.; Li, D.; Yu, S.; Xue, L.; Yang, L. Win-win: Application of sawdust-derived hydrochar in low fertility soil improves rice yield and reduces greenhouse gas emissions from agricultural ecosystems. Sci. Total Environ. 2020, 748, 142457. [Google Scholar] [CrossRef]
- Chu, Q.; Xue, L.; Cheng, Y.; Liu, Y.; Feng, Y.; Yu, S.; Meng, L.; Pan, G.; Hou, P.; Duan, J.; et al. Microalgae-derived hydrochar application on rice paddy soil: Higher rice yield but increased gaseous nitrogen loss. Sci. Total Environ. 2020, 717, 137127. [Google Scholar] [CrossRef]
- Davis, S.C.; Kauneckis, D.; Kruse, N.A.; Miller, K.E.; Zimmer, M.; Dabelko, G.D. Closing the loop: Integrative systems management of waste in food, energy, and water systems. J. Environ. Stud. Sci. 2016, 6, 11–24. [Google Scholar] [CrossRef]
- Miller, K.; Herman, T.; Philipinanto, D.; Davis, S. Anaerobic digestion of food waste, brewery waste, and agricultural residues in an off-grid continuous reactor. in review. 2020. [Google Scholar]
- Collier, S.M.; Ruark, M.D.; Oates, L.G.; Jokela, W.E.; Dell, C.J. Measurement of Greenhouse Gas Flux from Agricultural Soils Using Static Chambers. J. Vis. Exp. JoVE 2014, 90, e52110. [Google Scholar] [CrossRef]
- Bates, D.; Mächler, M.; Bolker, B.; Walker, S. Fitting linear mixed-effects models using lme4. arXiv Prepr. 2014, arXiv:14065823. [Google Scholar]
- Vaneeckhaute, C.; Lebuf, V.; Michels, E.; Belia, E.; Vanrolleghem, P.A.; Tack, F.M.; Meers, E. Nutrient recovery from digestate: Systematic technology review and product classification. Waste Biomass Valorization 2017, 8, 21–40. [Google Scholar] [CrossRef]
- Fang, J.; Zhan, L.; Ok, Y.S.; Gao, B. Minireview of potential applications of hydrochar derived from hydrothermal carbonization of biomass. J. Ind. Eng. Chem. 2018, 57, 15–21. [Google Scholar] [CrossRef]
- Miller, K.E.; Grossman, E.; Stuart, B.J.; Davis, S.C. Pilot-scale biogas production in a temperate climate using variable food waste. Biomass Bioenergy 2020, 138, 105568. [Google Scholar] [CrossRef]
- Heaton, E.A.; Boersma, N.; Caveny, J.D.; Voigt, T.B.; Dohleman, F.G. Miscanthus (Miscanthus x giganteus) for biofuel production. Ext. Am. Res. Learn. Netw. SUA 2014. [Google Scholar]
- Yost, M.A.; Randall, B.K.; Kitchen, N.R.; Heaton, E.A.; Myers, R.L. Yield Potential and Nitrogen Requirements of Miscanthus × giganteus on Eroded Soil. Agron. J. 2017, 109, 684–695. [Google Scholar] [CrossRef]
- Gutser, R.; Ebertseder, T.; Weber, A.; Schraml, M.; Schmidhalter, U. Short-term and residual availability of nitrogen after long-term application of organic fertilizers on arable land. J. Plant Nutr. Soil Sci. 2005, 168, 439–446. [Google Scholar] [CrossRef]
- Gajić, A.; Ramke, H.-G.; Hendricks, A.; Koch, H.-J. Microcosm study on the decomposability of hydrochars in a Cambisol. Biomass Bioenergy 2012, 47, 250–259. [Google Scholar] [CrossRef]
- Dicke, C.; Lanza, G.; Mumme, J.; Ellerbrock, R.; Kern, J. Effect of hydrothermally carbonized char application on trace gas emissions from two sandy soil horizons. J. Environ. Qual. 2014, 43, 1790–1798. [Google Scholar] [CrossRef]
- Malghani, S.; Jüschke, E.; Baumert, J.; Thuille, A.; Antonietti, M.; Trumbore, S.; Gleixner, G. Carbon sequestration potential of hydrothermal carbonization char (hydrochar) in two contrasting soils; results of a 1-year field study. Biol. Fertil. Soils 2015, 51, 123–134. [Google Scholar] [CrossRef]
- Oertel, C.; Matschullat, J.; Zurba, K.; Zimmermann, F.; Erasmi, S. Greenhouse gas emissions from soils—A review. Chem. Erde-Geochem. 2016, 76, 327–352. [Google Scholar] [CrossRef]
- Yiqi, L.; Zhou, X. Soil Respiration and the Environment; Elsevier: Amsterdam, The Netherlands, 2010. [Google Scholar]
- Zhou, B.; Feng, Y.; Wang, Y.; Yang, L.; Xue, L.; Xing, B. Impact of hydrochar on rice paddy CH4 and N2O emissions: A comparative study with pyrochar. Chemosphere 2018, 204, 474–482. [Google Scholar] [CrossRef] [PubMed]
- Aronson, E.L.; Helliker, B.R. Methane flux in non-wetland soils in response to nitrogen addition: A meta-analysis. Ecology 2010, 91, 3242–3251. [Google Scholar] [CrossRef] [PubMed]
- Liu, L.; Greaver, T.L. A review of nitrogen enrichment effects on three biogenic GHGs: The CO2 sink may be largely offset by stimulated N2O and CH4 emission. Ecol. Lett. 2009, 12, 1103–1117. [Google Scholar] [CrossRef]
- Möller, K.; Müller, T. Effects of anaerobic digestion on digestate nutrient availability and crop growth: A review. Eng. Life Sci. 2012, 12, 242–257. [Google Scholar] [CrossRef]
- Buchen-Tschiskale, C.; Hagemann, U.; Augustin, J. Soil incubation study showed biogas digestate to cause higher and more variable short-term N2O and N2 fluxes than mineral-N. J. Plant Nutr. Soil Sci. 2020, 183, 208–219. [Google Scholar] [CrossRef]
- Gao, B.; Ju, X.; Su, F.; Meng, Q.; Oenema, O.; Christie, P.; Chen, X.; Zhang, F. Nitrous oxide and methane emissions from optimized and alternative cereal cropping systems on the North China Plain: A two-year field study. Sci. Total Environ. 2014, 472, 112–124. [Google Scholar] [CrossRef]
- Cayuela, M.L.; Sánchez-Monedero, M.A.; Roig, A.; Hanley, K.; Enders, A.; Lehmann, J. Biochar and denitrification in soils: When, how much and why does biochar reduce N2O emissions? Sci. Rep. 2013, 3, 1732. [Google Scholar] [CrossRef]
- Case, S.D.C.; McNamara, N.P.; Reay, D.S.; Whitaker, J. Can biochar reduce soil greenhouse gas emissions from a Miscanthus bioenergy crop? GCB Bioenergy 2014, 6, 76–89. [Google Scholar] [CrossRef]
- Dicke, C.; Andert, J.; Ammon, C.; Kern, J.; Meyer-Aurich, A.; Kaupenjohann, M. Effects of different biochars and digestate on N2O fluxes under field conditions. Sci. Total Environ. 2015, 524–525, 310–318. [Google Scholar] [CrossRef]
- Fidel, R.B.; Laird, D.A.; Parkin, T.B. Effect of Biochar on Soil Greenhouse Gas Emissions at the Laboratory and Field Scales. Soil Syst. 2019, 3, 8. [Google Scholar] [CrossRef]
Publisher’s Note: MDPI stays neutral with regard to jurisdictional claims in published maps and institutional affiliations. |
© 2020 by the authors. Licensee MDPI, Basel, Switzerland. This article is an open access article distributed under the terms and conditions of the Creative Commons Attribution (CC BY) license (http://creativecommons.org/licenses/by/4.0/).