1. Introduction
Dynamic light scattering (DLS) is widely used for the study of nanoparticles, colloidal particles, for the study of proteins, as well as for the field of nanoparticle suspensions, such as nanoparticle inks [
1,
2]. The technique is widely used in research, and still generally associated to the need of dilution to low concentrations, and lengthy tests for obtaining results that can be reliably compared. Considerable advances were made by the introduction and development of modulated 3D-cross correlation dynamic light scattering (3D-ccDLS), which allows to perform DLS experiments even in turbid samples [
3], as well as in the development of algorithms for the analysis of hydrodynamic radii from the optical data that are recorded in DLS measurements also in the case of polydisperse particle distributions, e.g., [
4,
5,
6]. These technical advances on the experimental and on the analysis side provide thus timely tools, to address the investigation of nanoparticle interactions with complex fluids, such as biofluids even at high concentration.
At the examples of gold nanoparticles, nanorods, model proteins and mouse serum, this review article gives an overview of recent advances to study their motion and interaction by the use of 3D-ccDLS and reviews major considerations for DLS data analysis which illustrate that modulated 3D cross-correlation dynamic light scattering can be successfully used for the analysis of complex biofluids and for monitoring nanoparticle-protein interactions.
3. Monodispersed Nanorods: Bimodal Distributions due to Translation and Rotation
This section reviews the analysis methods of DLS data in case of monodispersed nanorods. First the basic analysis of the autocorrelation function of particle suspensions is summarized, leading to an average diffusion coefficient, hydrodynamic radius and a poyldispersity index according to the Cumulants method.
Second, analysis methods for the decay function in case of polydispersed samples thus involving several diffusion coefficients are summarized.
Third, the analysis of rotational and translational contributions to the diffusion of particles of non-spherical shape, such as nanorods, is summarized and discussed at the examples of DLS measurements of gold nanorods. These methods are also applicable to other non-spherical particles such as proteins.
3.1. Basic Analysis of Particle Suspensions: Hydrodynamic Radius and Poyldispersity Index
For monodispersed spherical particles, the autocorrelation function decays exponentially. The decay parameter is proportional to the translational diffusion coefficient D
t. The Stokes-Einstein equation describes the (translational) diffusion coefficient D
t in relation to the hydrodynamic particle radius R
Ht, expressed by:
where T is the absolute temperature, k the Boltzmann constant, and η the dynamic viscosity of the liquid. If k, T, and η are known, the hydrodynamic particle radius can thus be determined from Equation (1) [
7].
Inversely, if R
Ht is known, it becomes possible to determine the viscosity of the liquid from DLS experiments using well defined monodispersed spherical tracer particles [
13,
14]. Such viscosity measurements of BSA protein suspensions have recently been demonstrated using modulated 3D cross-correlation DLS [
14]. Their analysis based on microviscosity measurements using DLS agrees well with results of macroviscosity measurements and shows that viscosity measurements can be performed with small amounts of liquid.
The diffusion coefficient, Dt, is extracted from the autocorrelation function of the detected scattered light intensity as measured by DLS. In case of spherical particles, analysis is based on an exponential fit of the autocorrelation function, and generally referred to as a Cumulants analysis, and defined in ISO 13321 and ISO 22412. This analysis also gives information on the polydispersity index PDI, which reflects the width of the size distribution.
Although widely used as standard, Cumulants analysis has significant disadvantages in case of multi-dispersed particle distributions. This becomes evident, e.g., when considering a suspension with a bimodal distribution of monodispersed spherical particle sizes, which obviously are physically governed by two different diffusion coefficients as smaller particles diffuse faster than larger ones. Therefore, further methods are used to determine diffusion coefficients, and thus hydrodynamic radii, from the measured autocorrelation function of an DLS experiment in the case of multi-dispersed samples.
3.2. DLS Measurement of Multi-Dispersed Particle Suspensions and Analysis of the Autocorrelation Function
For multi-dispersed particle suspensions, such as mixtures of nanoparticles of several sizes or e.g., mixtures of nanoparticles and proteins, particles have different velocity leading to different time scales of the correlation decay. As a consequence, the resulting decay of the autocorrelation function cannot any longer be modeled by a single exponential. If a suspension contains fast and slow moving particles, the experimental autocorrelation function of the scattered intensity, g
(2)(q,t), can e.g., be modeled by two exponential decay functions as expressed by Equation (2):
where Г
f and Г
s are the decay rates related to the fast and slow moving particles, and A
f and A
s the corresponding amplitudes [
15].
Therefore, further algorithms exist to take into account a composition of several decay time scales in the analysis of the autocorrelation function [
16]. The CONTIN algorithm is a widely used example [
4]. A comparative study of several algorithms has recently been performed showing the non-equivalence between methods as well as the robustness of the Cumulants method [
16]. For polydisperse particle distributions, the CONTIN algorithm is performant and widely used, however, it has also limitations, as it is e.g., known to be sensitive to signal noise at large lag times, and can in some cases also lead to phantom peaks. Methods have thus been developed to improve its performance [
5]. A very recent algorithm, which is based on a machine learning approach in order to circumvent those drawbacks of the CONTIN algorithm, is provided by the CORENN method, which has been developed and implemented by LS Instruments [
6]. The acronym CORENN stands for COstrain weighted, Regularized Non-linNear, least-squares fit with free baseline for the integral inversion. According to the developer LS Instruments, Fribourg, FR, Switzerland, this algorithm uses a similar approach as the CONTIN algorithm and uses for the solution of the non-linear inverse integral a novel robust and fast theoretical estimate of the correlation function noise to remove noisy data. In particular, the standard deviation of the noise of the cross-correlation function is estimated from the experiment and used in the algorithm to weight data points depending on their reliability as assessed by the noise estimation itself [
6]. Recently, we have used the CORENN method to analyse the motion of gold nanoparticles and gold nanorods, as well as the one of model proteins (BSA) and their interaction with nanoparticles [
9].
3.3. DLS Measurement of Rotational and Translational Contributions in Particle Motions: Nanorods
For non-spherical particles translational and rotational motion takes place, both affect the observed decay of the autocorrelation function. For monodispersed nanorods, the autocorrelation function is thus governed by two exponential decay parameters, one is proportional to the translational diffusion coefficient D
t, the other one to the rotational diffusion coefficient D
r. One distinguishes in this case a hydrodynamic radius related to translational motion, R
Ht, which is calculated according to Equation (1), and a hydrodynamic radius related to rotational motion, D
Hr, which is expressed by Equation (3) [
17]:
3.4. DLS Measurement of Rotational and Translational Contributions in Particle Motions: Nanorods
The analysis of nanorods in DLS leads to two relaxation modes in the intensity correlation function, as observed and discussed by Rodríguez-Fernández et al. [
18]. From angular dependent DLS experiments on gold nanorods, recorded in different polarization geometries (vertical-vertical vs vertical-horizontal), they have shown that it is possible to determine translational and rotational diffusion coefficients of nanorods from the decay of the intensity correlation function, and attributed this to anisotropy of the polarizability caused by the shape of the particles [
18]. Methods for the analysis of non-spherical nanoparticles based electrical birefringence methods are discussed in [
19].
Using 3D-ccDLS measurements and the CONTIN and CORENN methods, has allowed us, to determine the rotational and translational diffusion coefficients for gold nanoparticles (spheres and rods, aspect ratios varying from 1 to 5.6), and to calculate the corresponding hydrodynamic radii [
10]. A comparison of Cumulants, which are stable in the range of investigated concentrations from 5 to 16 μg/mL [
9], with the CORENN analysis has recently been performed by analyzing the modes of the CORENN size distributions. The values obtained from Cumulants and CORENN analysis were compared by an extrapolation to zero concentration limit by linear regression. We could show that the CORENN method provides precise values of the hydrodynamic radius for rotational and translational motion of the nanorods [
9]. The obtained values for the rotational motion (as listed in
Table 2) are smaller than the ones earlier obtained using the CONTIN analysis which led to R
H values around 2 nm for the rotational motion and around 19 nm for the translational motion [
10].
For example, for the gold nanospheres a hydrodynamic radius of (24.2 ± 0.7) nm was found from the analysis of the mode by the CORENN method, compared to an average of 27.6 nm by the CONTIN algorithm [
10] and (28.50 ± 0.16) from Cumulants [
9].
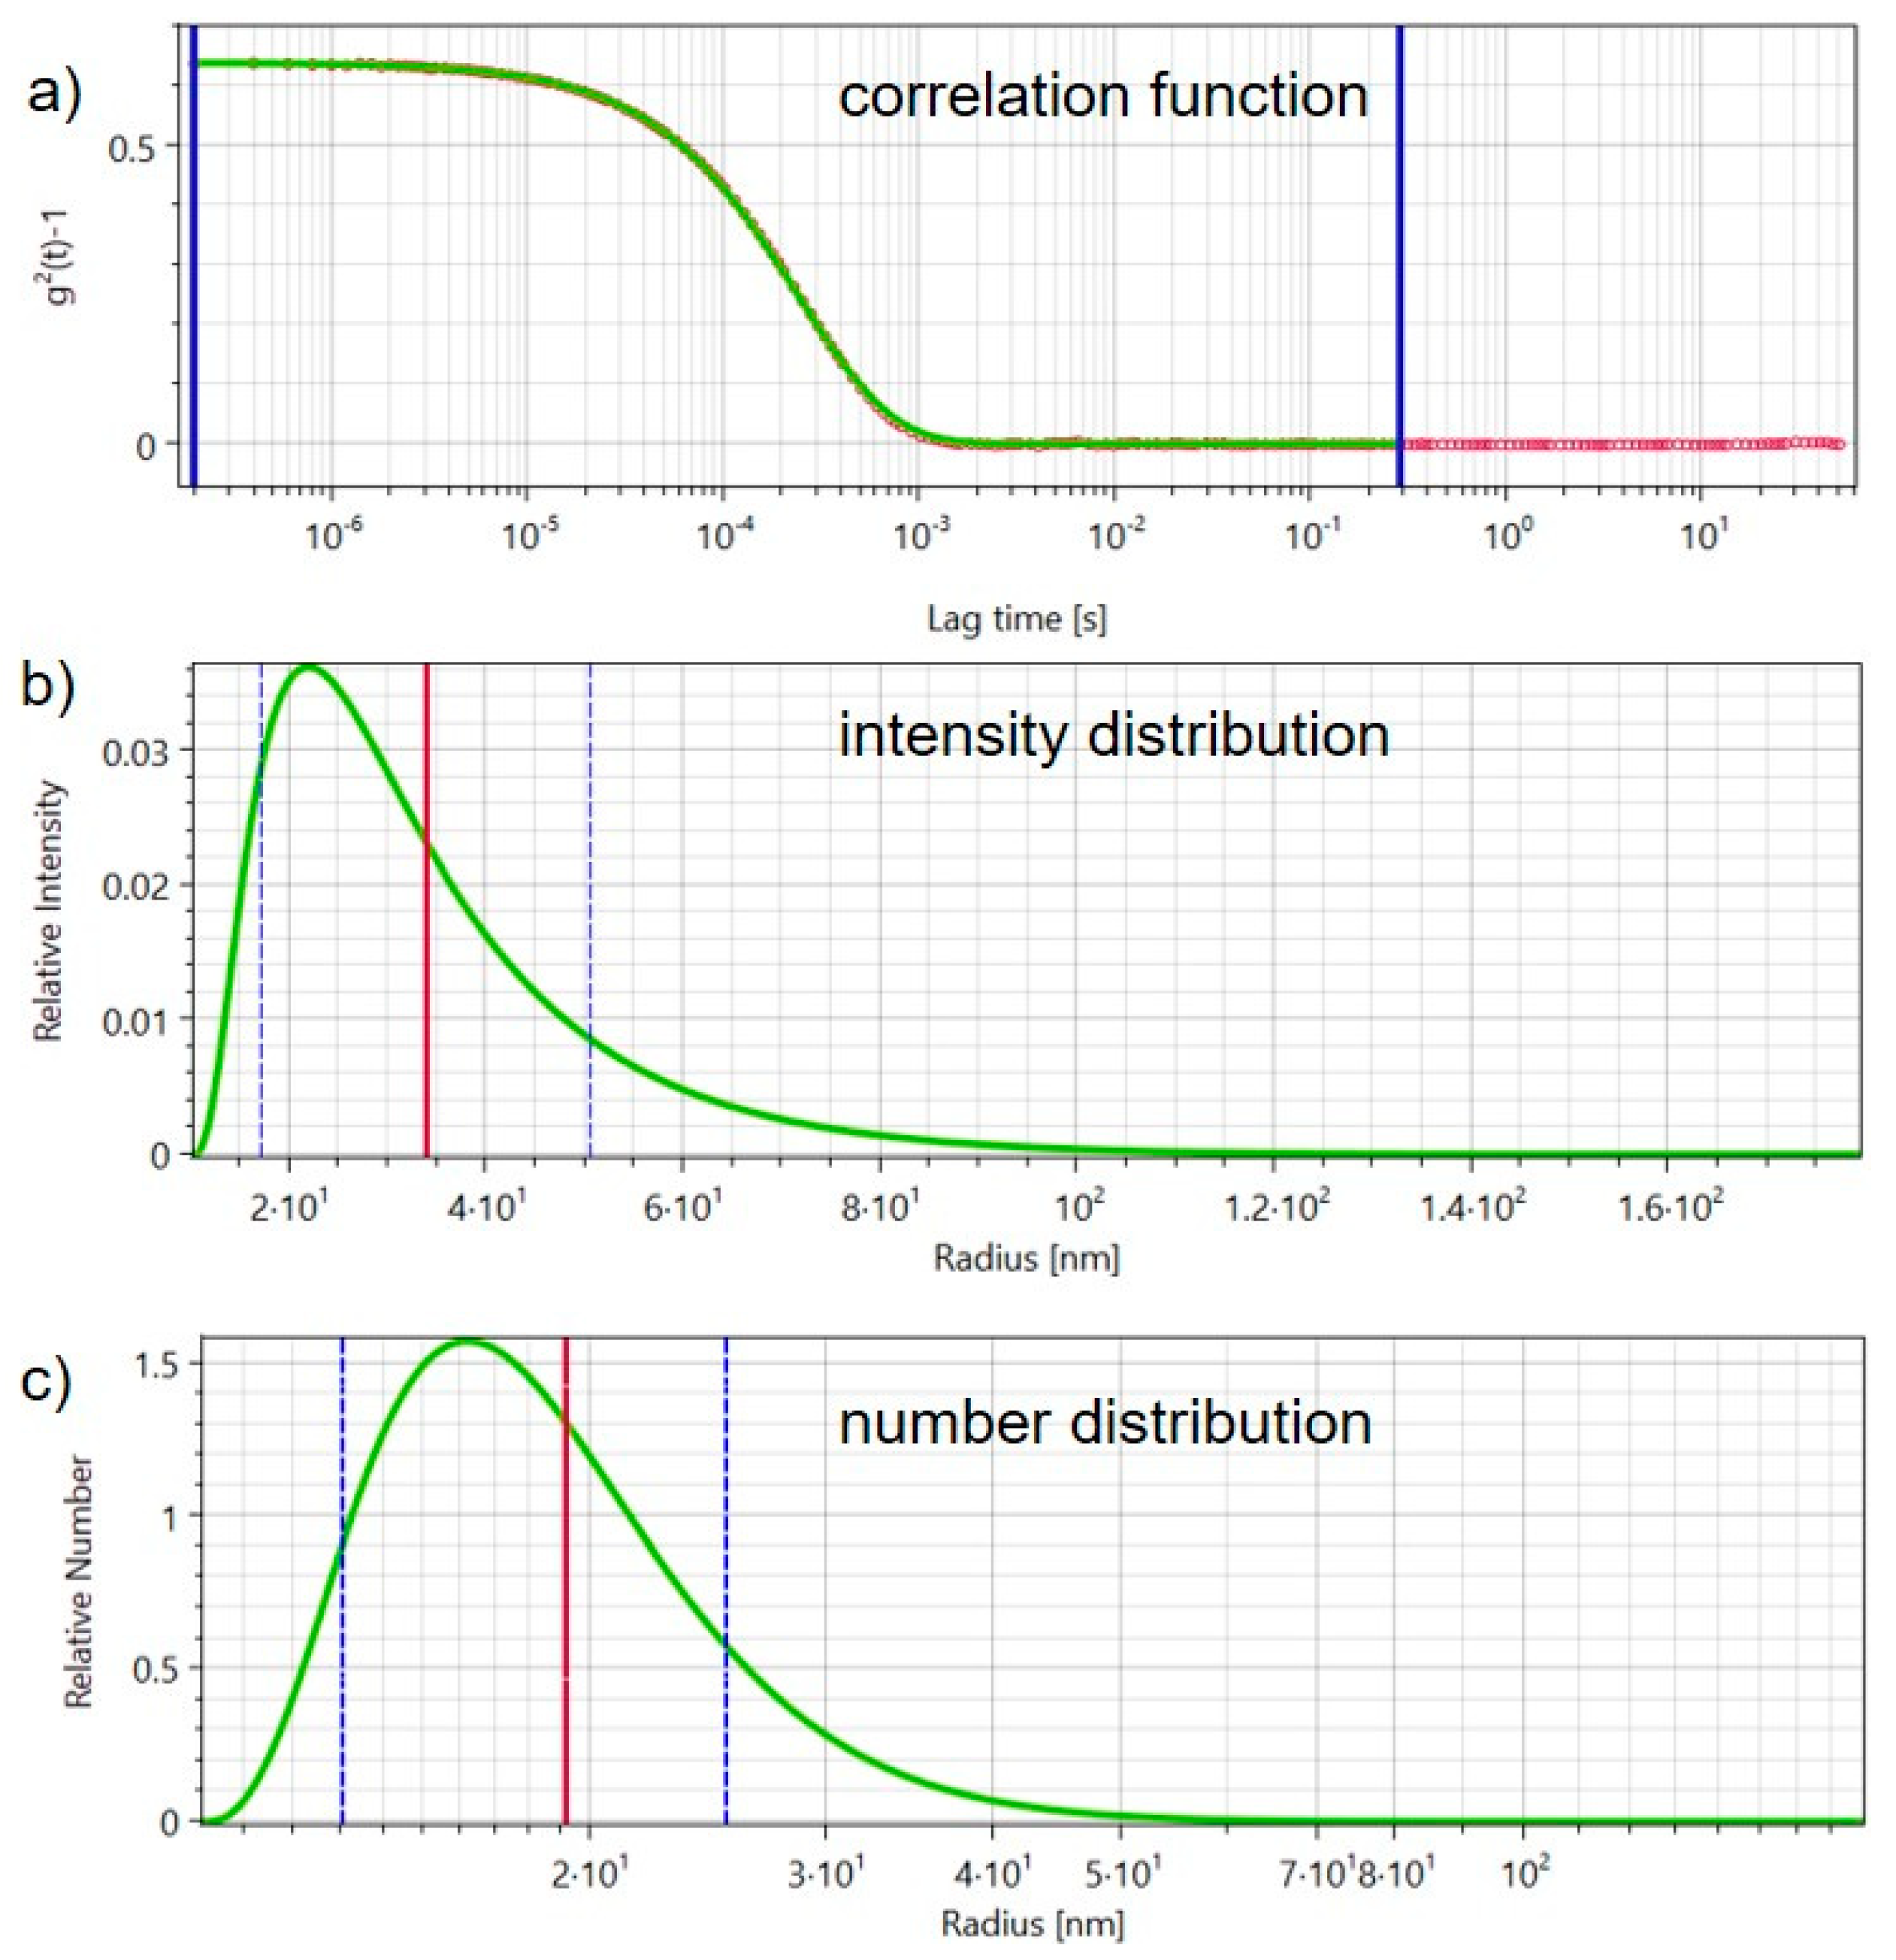
The fact that the hydrodynamic radius obtained for nanospheres in DLS experiments exceeds the nominal particle radius of 20 nm (40 nm diameter) as indicated by the supplier based on TEM analysis, is observed in all three cases and could potentially be explained by interaction of the particle with molecules from the liquid [
20]. We note, that the above listed values correspond to the hydrodynamic radii as obtained from the analysis of intensity size-distributions. For the nanospheres, by analyzing the number-size distributions, we obtain values around 19 nm, which is in good agreement with the nominal particle radius. An example of an intensity correlation function as measured for the Au NPs at a concentration of 0.0016 mg/mL, as well as the intensity and number distributions obtained from CORENN analysis are shown in
Figure 1.
In summary, we find that the hydrodynamic radius obtained from the CORENN method is the closest to the nominal particle radius when analyzing the mode of the intensity distributions. The average hydrodynamic radius as obtained from the number distributions (about 19 nm), which can reasonably be analyzed for monodispersed spherical particles, corresponds well to the nominal particle radius of 20 nm (40 nm diameter).
Methods to relate the hydrodynamic radii of translation and rotation of nanorods and rod-like macromolecules to the particle dimensions have been proposed and demonstrated in [
17,
21].
3.5. Time-Dependent Monitoring of Protein-Nanoparticle Interactions
Time dependent monitoring of protein-nanoparticle interactions by DLS is of interest for the investigation of the initial phases of interaction and the study of corona formation, which dominates the further interaction with other biological fluids, see e.g., [
12] and references therein.
Recently we have used 3D-ccDLS and the CORENN method, for the study of interaction and corona formation between gold nanoparticles (spheres and rods as listed in
Table 1) and the model protein bovine serum albumin (BSA). By comparing the scattering intensities of rotational and translational modes from CORENN analysis over time, we could show that BSA preferentially interacts at the cylindrical side of the gold nanorods. 3D-ccDLS combined with the CORENN method provides thus a powerful tool for monitoring of protein-nanoparticle interactions [
9].
Time dependent investigations of the influence of other parameters, such as the influence of the size, capping layer, or zeta potential [
22], could be further studied in order to gain a deeper understanding of the corona formation on nanoparticle with proteins and in biological fluids.
4. Analysis of Mouse Serum and Interaction with Nanoparticles
This section presents an application example of 3D-ccDLS and CORENN method to study the interaction of nanoparticles with a more complex biofluid. Recently we have shown that CONTIN method can be used to distinguish translational and rotational motion of the components of mouse-serum and to investigate changes of their hydrodynamic radii upon interaction with gold nanoparticles of different shape [
10] at a mouse serum-concentration of 33%. As a further application example for particle monitoring with 3D-ccDLS and CORENN method, we present here recent results from a study of the interaction of gold nanospheres and a low concentration of mouse serum.
The chosen mouse serum is the same product of sterile, pre-filtered mouse serum (BioWest, Nuaillé, France) as used in [
10]. We filtered the purchased serum through a 1.2 μm micropore membrane in order to remove large agglomerates and thus to improve the signal stability for DLS measurements [
10].
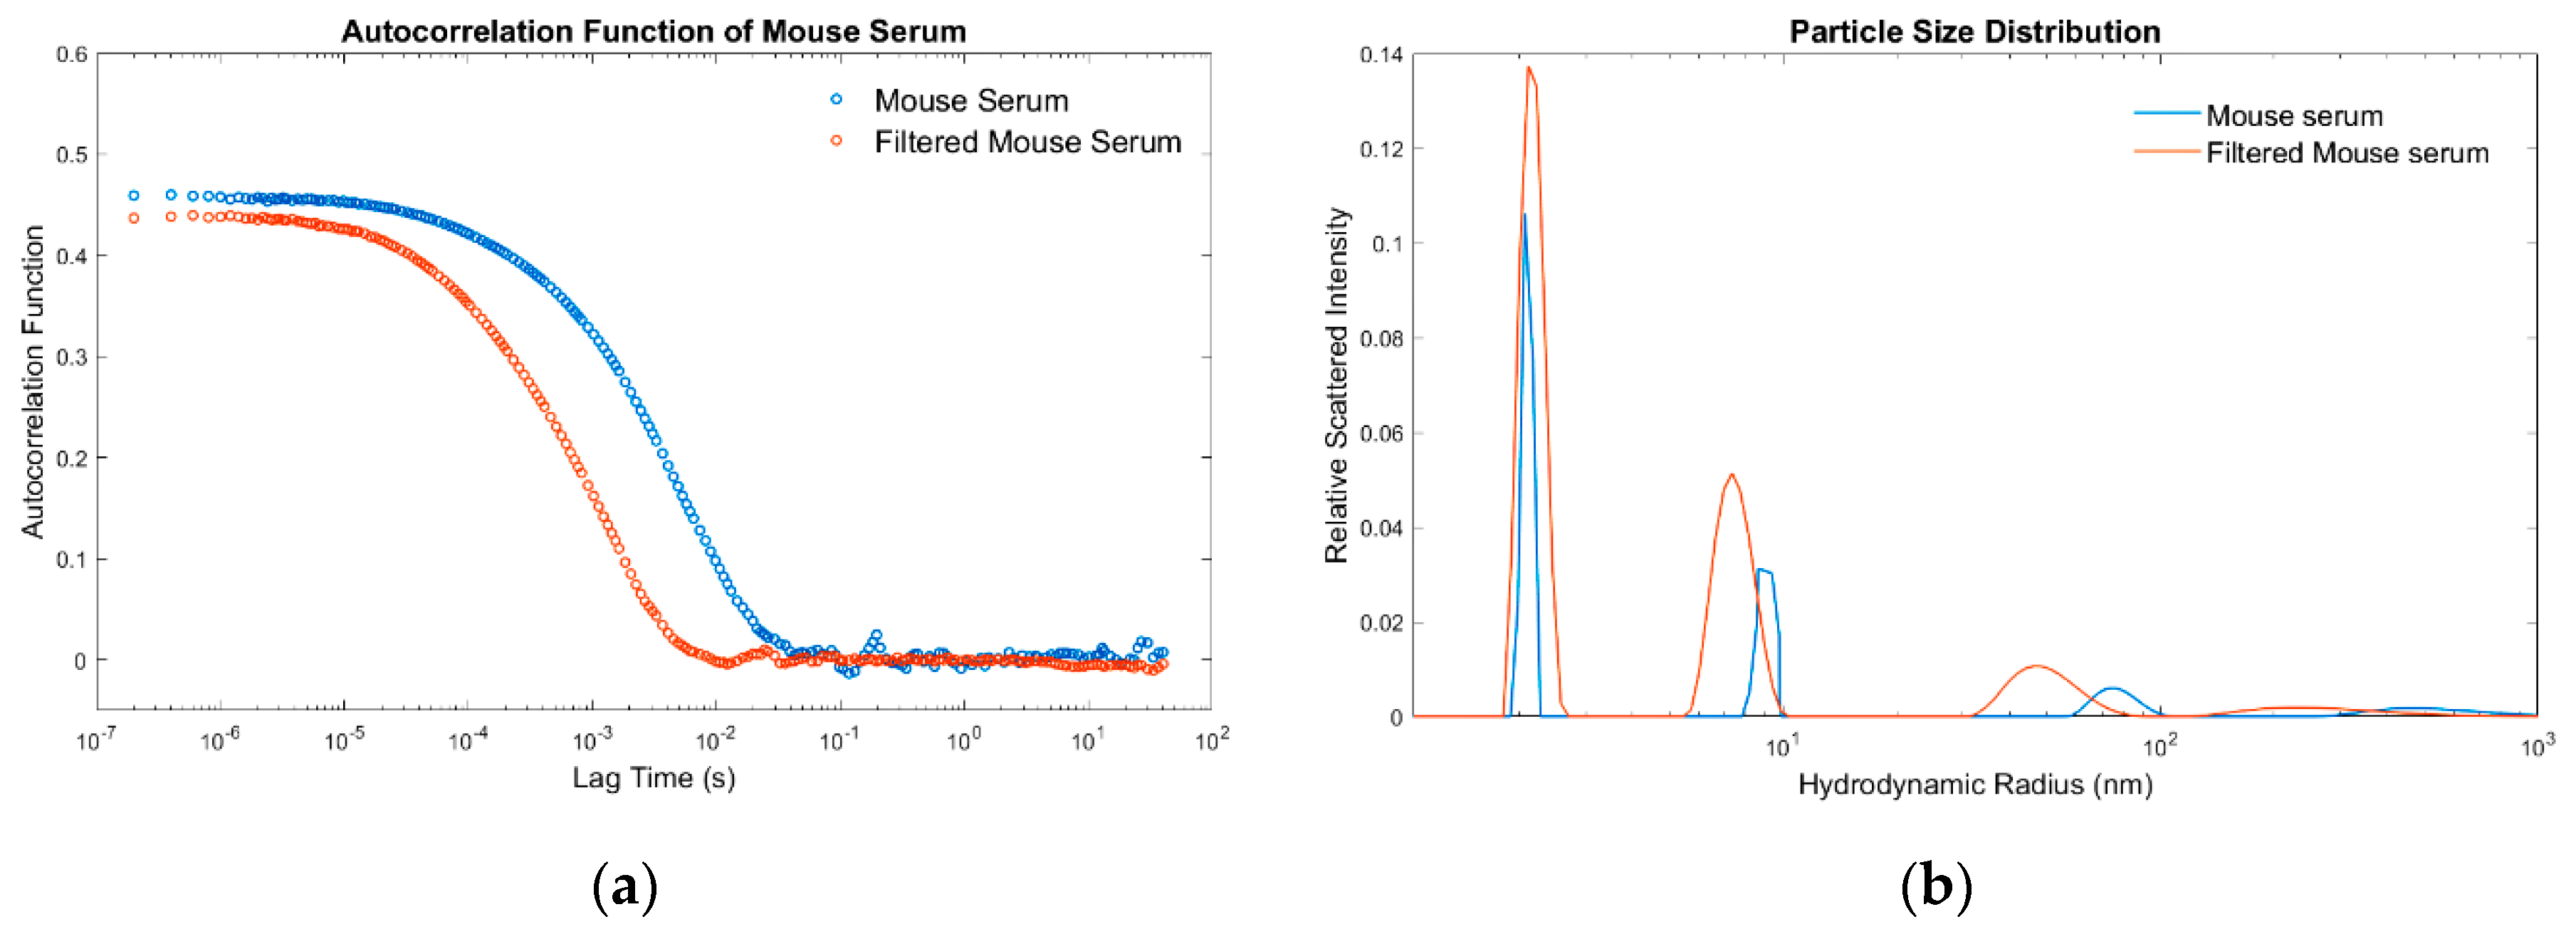
Figure 2 shows the result of the additional filtering.
Upon filtering the correlation function decays faster, and shows less noise at large lag times, which is consistent with the removal of larger particles. The analyzed PDI decreased from 2.72 to 1.61.
Figure 2b furthermore illustrates an example that the presence of large agglomerates before filtering might affect calculated results of hydrodynamic radii also for smaller particles. Here, an example is shown based on CONTIN analysis. The observation of a shift towards smaller apparent hydrodynamic radii may indicate a change in particle-particle interactions or a possible change of the effective viscosity upon removal of bigger agglomerates, however, it also illustrates the high sensitivity of the CONTIN algorithm to noise at large lag time, when the autocorrelation function approaches zero.
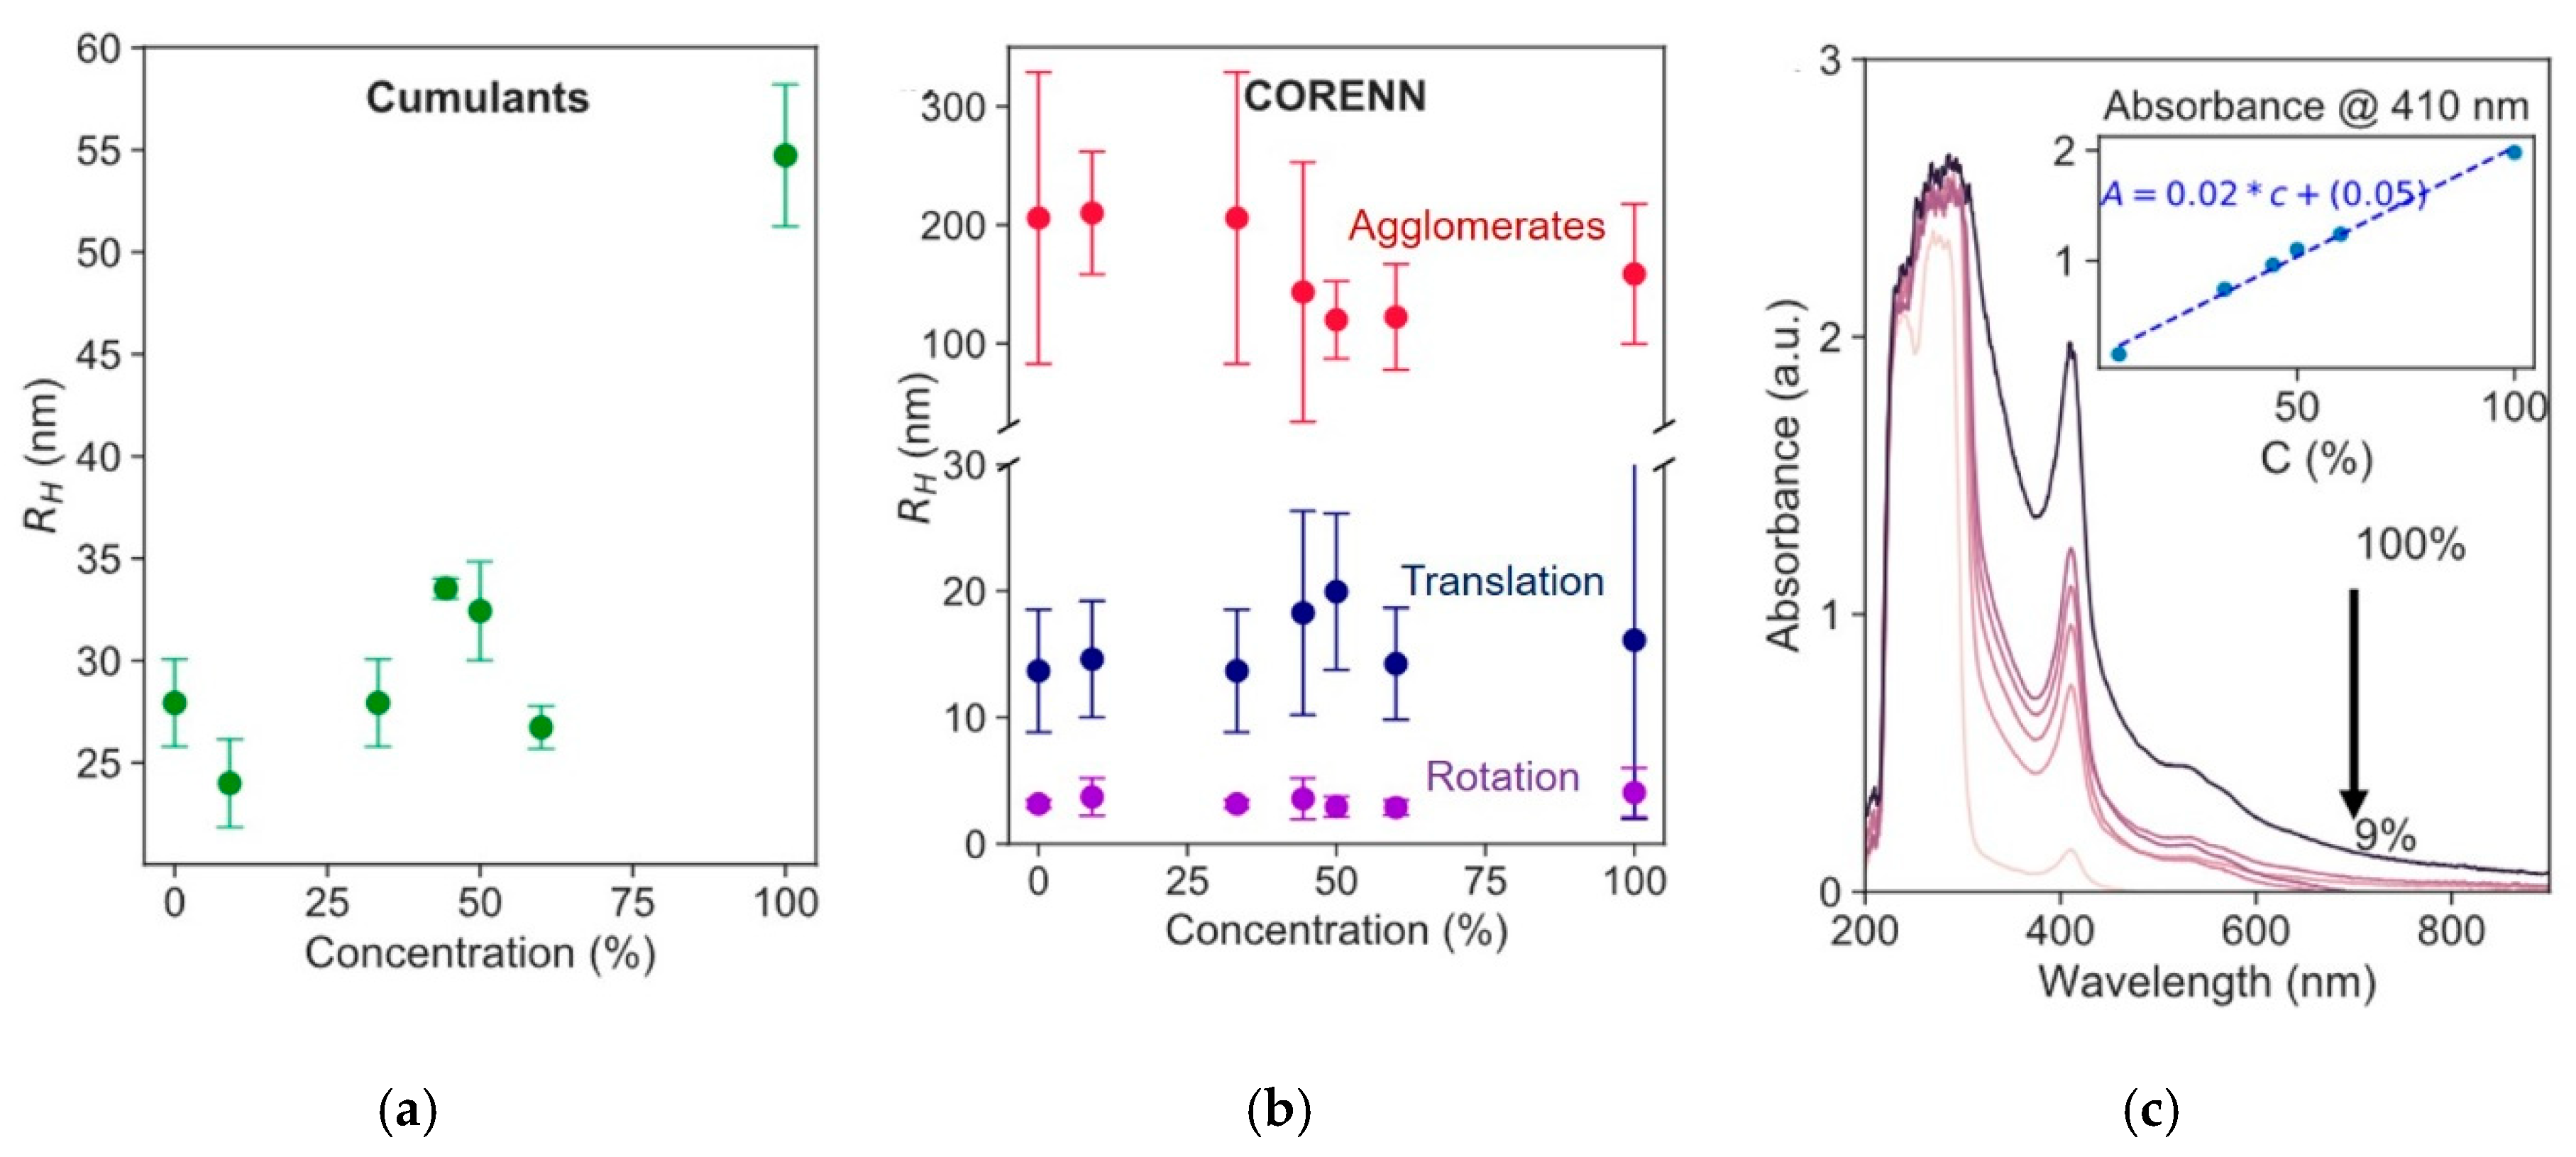
Using the CORENN method, we have performed further analysis of our 3D-ccDLS data recorded at various volume concentration between 9% and 100% (with respect to the filtered mouse serum), using DNAse-free distilled water for dilution.
Figure 3 shows the Cumulant and CORENN analysis, as well as optical absorbance of the filtered mouse serum at various concentration.
The optical UV-vis-NIR absorbance spectra of mouse serum (
Figure 3c), show absorbance in the ultraviolet range, which is characteristic for proteins. In agreement with the Beer-Lambert law, the absorption peak intensity at 410 nm, which can be indicative for enzymatic reactions or other components of the mouse serum, is proportional to the serum concentration (
Figure 3c) [
10]. As main components we consider proteins in the mouse serum.
Mouse serum was recently studied by CONTIN analysis [
10]. Rotational and translational motion were distinguished as well as the presence of agglomerates [
10].
Figure 3b shows results from CORENN analysis of mouse-serum DLS data, samples were prepared and data recorded as described in [
10]. The analysis using the CORENN method shows consistency with the CONTIN analysis presented in [
10]. It clearly distinguishes the rotational and translation motion of proteins in the mouse-serum, as well as the formation of agglomerates.
The analyzed mode of the rotational peak, with a hydrodynamic radius between 2 and 5 nm, stays stable over the full range of concentration (
Figure 2b), and can be related to the particles lengths [
23].
The mode with a hydrodynamic radius around 14 nm (
Figure 3b) is related to translation; its obtained positions show similar values over the entire range of concentrations within the error (
Figure 3b). The value obtained at a low concentration of only 9% of the mouse serum, as analyzed using the CORENN algorithm is well in agreement with the one obtained at higher concentration, e.g., 33% (
Figure 3b).
Larger hydrodynamic radii of around 200 nm are associated to agglomerates (
Figure 3b) as discussed in [
10], the hydrodynamic radius is stable for concentrations of 33% and below (9%). The result stays in agreement with the CONTIN analysis within the errors [
10]. As a tendency the CONTIN analysis [
10] shows for agglomerates values between 100 and 140 nm which are also obtained by CORENN analysis at concentrations above 33% (
Figure 3b); further investigations would thus be needed in order to best quantify the hydrodynamic radii of large particle agglomerates.
Essentially, we find that the CORENN analysis is able to provide conclusive results for concentration down to 9% mouse serum concentration (
Figure 3b) and which are in agreement with the values obtained at 33%, we note that the CONTIN algorithm used for the data analysis in [
10] did not allow for a stable analysis of the DLS data at the very low concentration of 9%.
5. Detection and Monitoring of Nanoparticles Interaction in Mouse-Serum
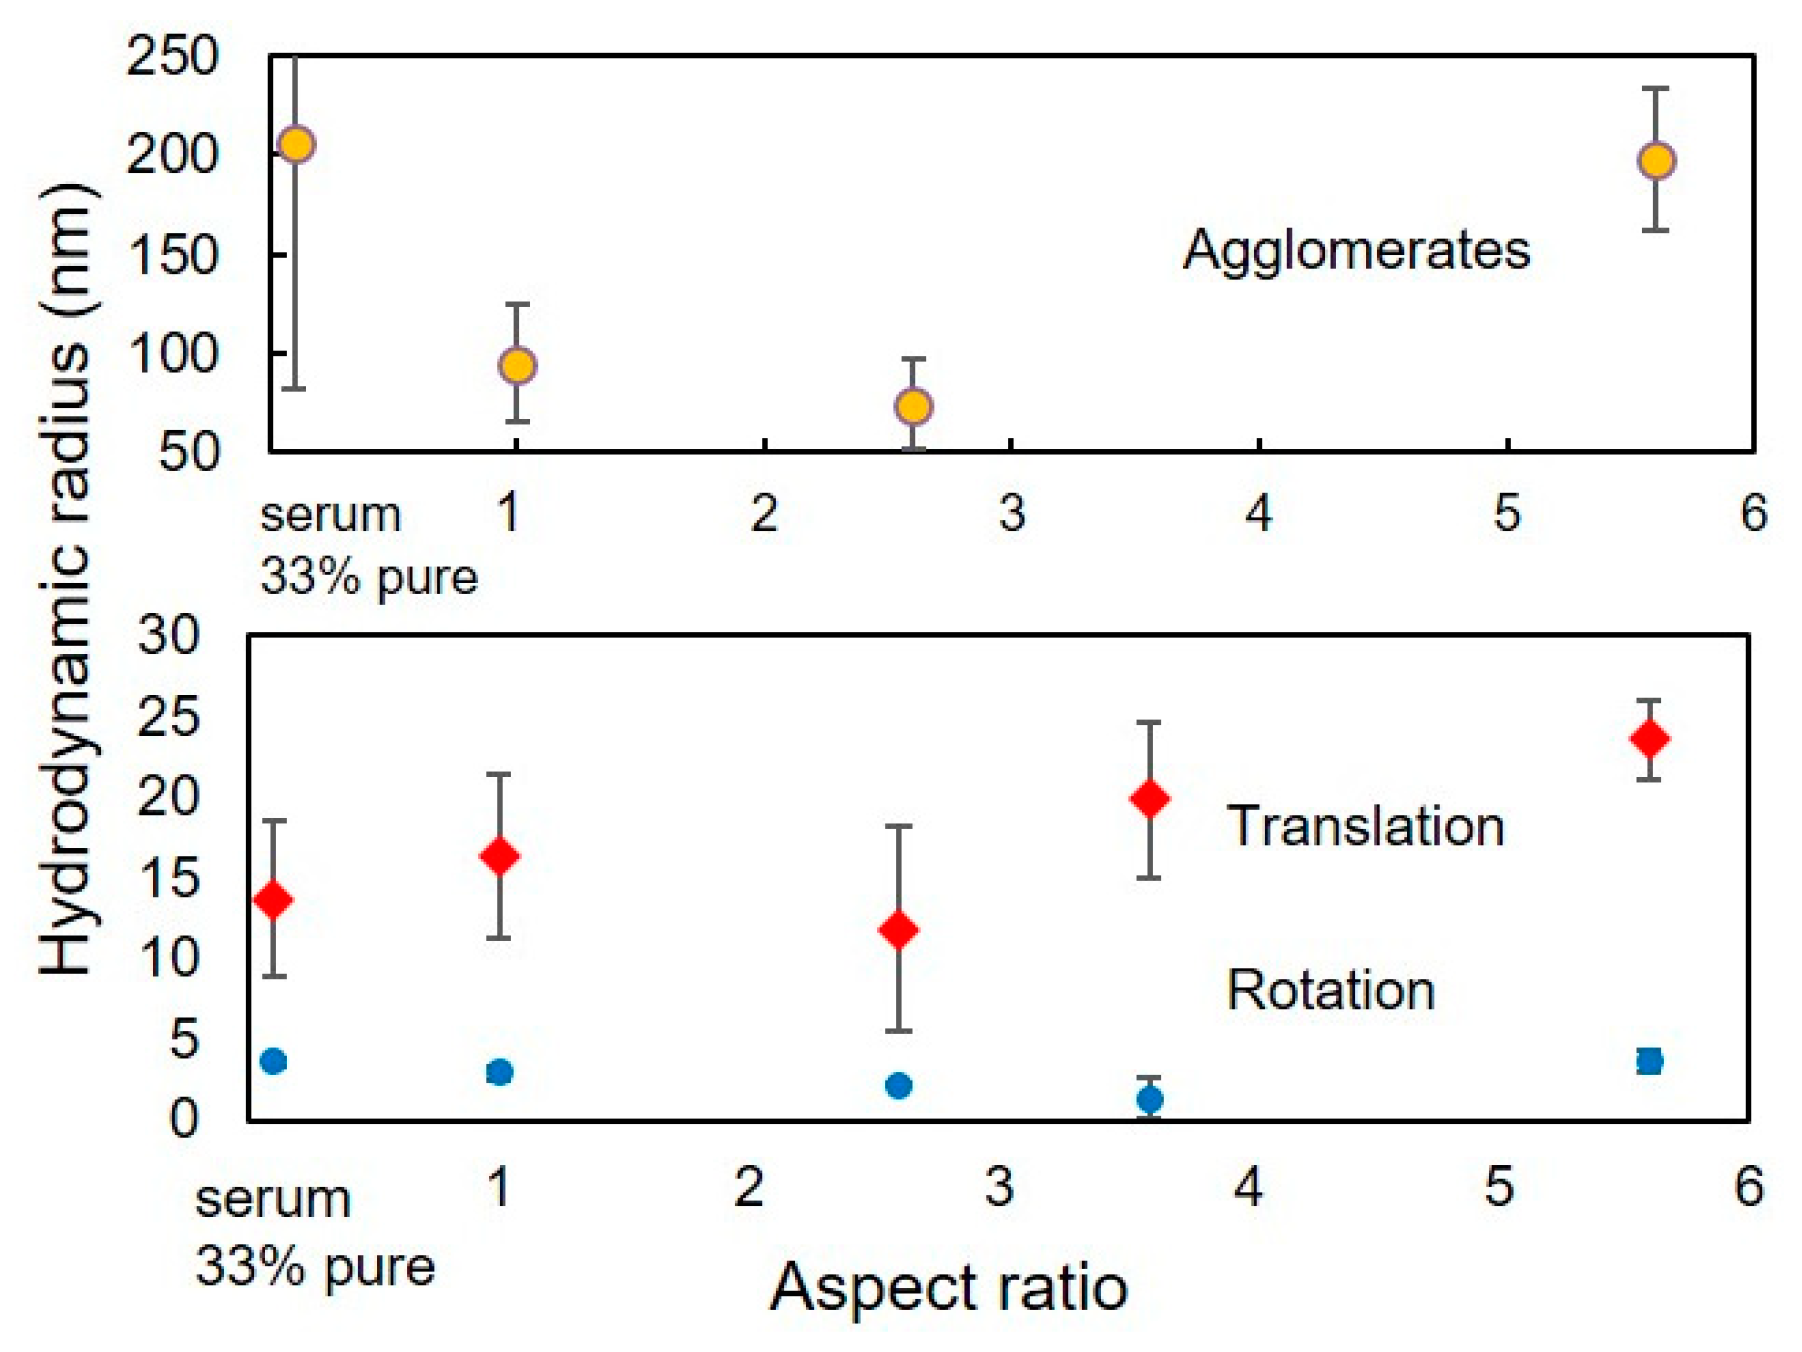
The detection of nanoparticles in complex biological fluids is of relevance to study nanoparticle-protein interactions in a biologically representative environment. We have recently shown that the interaction of gold nanospheres and nanorods can be successfully detected in mouse-serum and have compared their interaction for different aspect ratios of the nanoparticles using the CONTIN algorithm [
10].
Figure 4 shows the results based on the analysis using the CORENN algorithm.
While for nanospheres (aspect ratio 1.0) and for nanorods with an aspect ratio of 2.6 DLS results show only small changes of the hydrodynamic radii of the mouse serum (within the error bars), nanorods with aspect ratios of 3.6 and 5.6 lead to an increase of the hydrodynamic radius related to translational motion. These observations are indicative of interaction between the nanoparticles and the serum. The CORENN analysis confirms the observations based on CONTIN analysis [
10].
In order to investigate whether proteins of the mouse serum interact however with the nanospheres, we monitor citrate stabilized gold nanospheres, nominal diameter of 40 nm, (NanoComposix, San Diego, CA, USA, 0.05 mg/mL dispersed in water) together with a low concentration of the mouse serum over time. For incubation experiments, the mixture of the gold nanoparticle suspension and the mouse serum was prepared from the already diluted mouse serum of 33% concentration, which we used at a concentration of 7% leading to a mouse serum concentration of 2.3% for incubation.
We monitor the hydrodynamic radii.
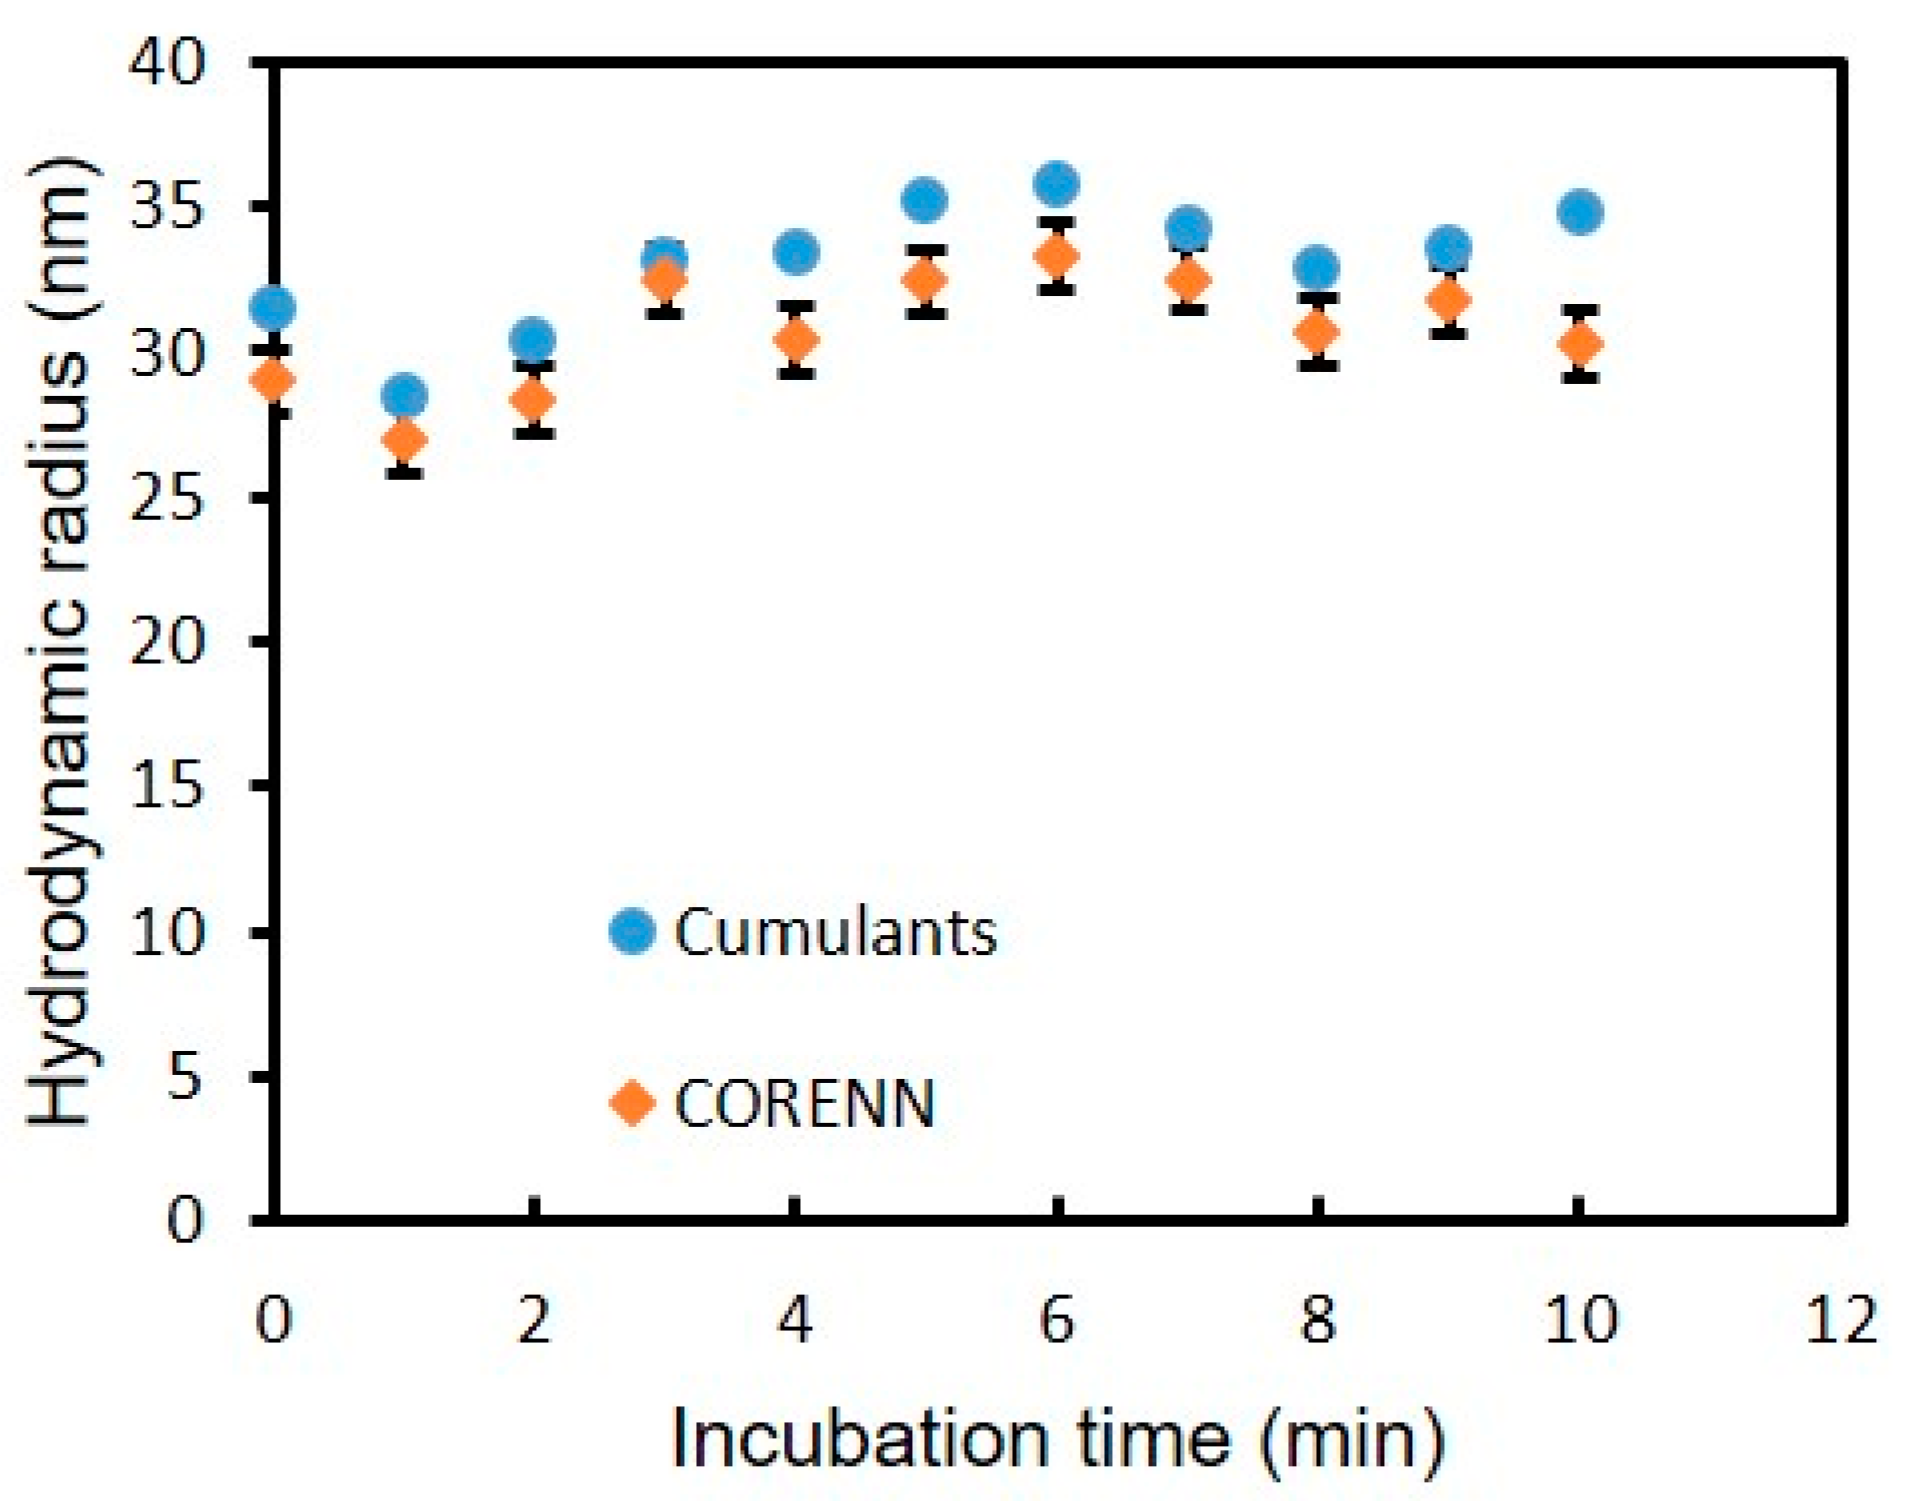
Figure 5 shows results from cumulants and CORENN analysis of the gold nanospheres together with mouse serum over time. At these low mouse serum concentrations and high nanoparticle concentration, the translational peaks of the nanospheres are clearly identified. The hydrodynamic radius of the nanospheres initially decreases, which might be due to an increase in viscosity and/or signal contributions from translations of the mouse-serum.
On a timescale over the first minutes we then observe that the hydrodynamic radius of the nanospheres slightly increases. Cumulants and CORENN results show essentially similar behavior over time, with cumulants values superior to the CORENN values of the hydrodynamic radius (
Figure 5). The difference between the hydrodynamic radii obtained from cumulants and CORENN analysis can be attributed to the polydispersity of the sample.
In summary, at low serum concentrations the motion of nanoparticles can be reliably detected, despite the complexity of the composition of the added biofluid, while at high concentration the characteristics of the mouse-serum, including a distinction of rotation, translation and agglomeration are detected, in the presence of nanoparticles [
10]. In both cases, the CORENN analysis of 3D-DLS data shows to be powerful for the DLS data analysis.


