Earthquake Shake Detecting by Data Mining from Social Network Platforms

Department of Information Technology, Ling Tung University, Taichung 408, Taiwan
Appl. Sci. 2020, 10(3), 812; https://doi.org/10.3390/app10030812
Submission received: 27 December 2019
/
Revised: 21 January 2020
/
Accepted: 22 January 2020
/
Published: 23 January 2020
(This article belongs to the Special Issue Intelligent System Innovation)
Abstract
:This study used social media posts of the related effect of earthquakes to derive seismic shake scale distributions in regions of Taiwan and compared it with the regional seismic scale reported by the Central Weather Bureau (CWB) of Taiwan. This study conducted a context searching to scrawl the relationship phrase on the social media network platform, PTT bulletin board system (BBS), to detect the earthquake shake scale using the keywords of the context. In this investigation a decision tree model for analyzing the semantic words from the context of the target event to detect the earthquake shake scale was devised. The results indicate that we can pick out the keywords to use to detect the earthquake shake scale at about 85%. Furthermore, the results of the derived shake scale show that the four studied cases are in a good agreement with the presented news from the CWB of Taiwan. In this study, the author attempted to develop a quick earthquake shake scale detection model by semantic analysis of the collected earthquake disaster information reported on the social media network platform.
1. Introduction
With the increasing development of network and wireless communication, the social media network has become a platform for people to vent their emotion and feelings in real time and stores a large amount of information. In general, people usually use a specific word to express their feelings. Today, the social media network is increasingly becoming important for people because the platform offers many kinds of applications in the world, such as for marketing, political, soul, and disastrous events except for the abreaction. In recent years many studies have reported and demonstrated the feasibility of tweet-leveled stress and depression detection, since depressed and stressful individuals see social media network as a channel for emotional release and interaction [1,2]. The social media network allows users to send shorter messages or multimedia to express their feelings such as positive, neutral, negative, happy, angry, fear, sad, surprised, and disgusted [3,4]. Many investigations of the social media networks have attracted much attention in recent years [5,6,7,8,9,10]. Shen et al. [11], reported that the data of the social media network increases daily, and the data can be offered for studying, training, and testing on different issues by using the data mining method. They collected some posts as examples from the bulletin board system in Taiwan, PTT, to develop a real- time depression detection system to identify potential depression candidates based on their writing. The register of the PTT system can write a message and other users can read this message and follow it. Therefore, many bloggers post their descriptions for events or emotion. Social media can broadcast to many people quickly and it brings them to discuss events with each other instantly. Therefore, a huge amount of information held in the social media network can be used for studying. That is, “Big Data” has become a key component in natural hazard research recently [12]. Yu et al. [13] also mentioned that the age of big data has opened a new option for natural disaster management, because it provides visualization, analysis, and prediction in natural disasters. Big Data and information technology provide meaningful and effective solutions in natural disaster management. Kaur et al. [14] reported that because a large amount of data is recorded at the platform, data could be collected from the social media network and analyzed. Moreover, Pirnau [15] studied the effect and disaster of earthquakes by using the real-time information on Twitter to offer information for supporting information for rescue activities. Avvenuti et al. [16] suggested that messages posted on the social media from disasters are useful to estimate the condition of the disaster for human beings and buildings. Meanwhile, Avvenuti also made a prediction for the seismic scale by using the data collected from the social media network Twitter [16]. Middleton et al. [17] used the Twitter real-rime tweet flood reports and geo-parsing to generate real-time crisis mapping of natural disasters. Nguyen and Jung [18] showed real time analytics based on social media data to detect and monitor behaviors. Imran et al. [19] developed a system to filter and classify social media messages related to emergencies, disasters, and humanitarian crises to tag up in a world map. Chae et al. [20] analyzed social media data to develop a system to provide analysts with an interactive visual spatiotemporal analysis and spatial decision support environment that assist in evacuation planning and disaster management. Furthermore, Sahaki et al. [21] determined the epicenter by using the real-time messages on Twitter. They took the user on Twitter into a sensor, and applied the particle filter method to estimate the location of the epicenter and send a warning message by e-mail to registers on Twitter in Japan. Haubrock et al. [22] tried to establish a concept for a community-based map creation process based on “human sensors” to estimate the earthquake intensity. In China, Xu et al. [23] proposed a semi-real time disaster information collection method by using the geographic information system (GIS) to analyze the Global System for Mobile Communications (GSM) messages.
Today, there are many social media network platforms, such as Facebook, Twitter, Plurk, Tumblr, Emote.in, Squeelr, Jaiku, identi.ca, and PTT. In this study, we analyze the data collected from the discussion posts on PTT. The PTT system allows real-time interaction that makes it a popular social media bulletin board system (BBS) in Taiwan. PTT was established in 1995 with the aim to provide a public, free, and liberty of speech platform based on academic research and noncommercial conduct. PTT has many discussion boards on specific topics, and the user can join the discussion in the related discussion board according to his/her interest. For example, the content of the Gossiping board, the most popular board, includes news, social affairs, politics, and disastrous events for discussion. This discussion board can be used for asking, revealing, and reposting issues by discussing and sharing with others. In addition, PTT has many discussion boards that enable the user to post issues and comments. Therefore, the platform records a large number of data daily, which can be collected and analyzed for investigations. Furthermore, analyzers should abide by the data protection regulations, even PTT registers use an alias to post the tweet. It is necessary to think of abiding by the analysis of dos and don’ts as insurance against charges of incompetence or sloppiness.
In this study, the author analyzes the content of the earthquake recorded on the PTT Gossiping board from 2013–2016. The author attempted to derive a possible seismic intensity scale by using the data mining method in posts comprising traditional Chinese semantic words. For example, Figure 1 shows that the short message talks about body-feelings or concrete damage during the earthquake, such as “Chungli, felt” (tags 1–2), “PingJiang, felt shaking and like the car impacted to the house”(tags 3–5), “TaoYuan, felt shaking” (tags 6–7), or “The chair was shaking” (tag 13). In the past, posts concerning an earthquake were always considered meaningless messages and did not receive attention. However, in this study, the author used the data collected from the social media network PTT to derive the seismic shaking scale in different regions in Taiwan. Furthermore, the study identifies the semantic word and seismic intensity scale by using the data mining method and the decision tree model, respectively. The derived intensity scale distribution is compared with the report of seismic intensity scale from the Central Weather Bureau (CWB) in Taiwan.
2. Methodology
In this investigation, the author selected the earthquake events with seismic magnitude greater than or equal to 5.0 from 2013–2016 because the data posted for events with magnitude less than 5.0 were very few. To obtain posts on the earthquake event, we apply the semantic analysis of a blog post. The author captures the useful posts by using the key semantic words and requirements that include the following:
- Term 1: The author identifies the keyword of the location in the posts to group them into the same region because there is no location information for users in the PTT BBS. This step will classify the message into different regions using the location provided in the posts. The data will not be adopted without location information.
- Term 2: To derive the seismic shaking scale, the author applies the semantic analysis of a post to identify the keyword of the disaster information, such as the shaking of the body, feeling or descriptions of damage during the earthquake.
In this study, the author refers to the description of seismic intensity levels and the corresponding feeling of the earthquake as reported by the CWB (Table 1) to be the keywords for semantic analysis. Then, the author adds some keywords that do not include the present scale table into the seismic scale table of feeling to improve the classification of seismic intensity. The earthquake intensity table is categorized into eight levels from 0–7, and the classification is made according to the greatest velocity on the surface calculated from the seismometer record around Taiwan. The CWB depends on this value for describing the corresponding emotional state and damaged scale.
The first step is to check posts from the social media network that satisfy the keywords of the two terms simultaneously. For instance, in tags 8 and 13 in Figure 1, it is hard to recognize the location and tags 11–12 only tag the location and without text for sentiment. These data should be excluded. The second step is to arrange the collected posts into different regions by the keywords of the regions and then derive the possible seismic intensity by using the decision tree model based on the semantic analysis. The decision tree is a machine-learning algorithm used for classification and prediction in the form of a tree structure. Quinlan [24] proposed the ID3 algorithm to use the information gain method to construct a decision tree by the smallest subsets. It is a top-down, greedy search through the space of possible branches with no backtracking algorithm. The method assumes that there are N training samples and calculates the information gain for each attribute and the largest value, which corresponds to the best predictor, is the root node. Then the samples are separated into several subsets (or leaf nodes) and the most effective attribute separating into several sets from the subsets is selected by the information gain [25]. The process continues until all samples are classified.
In this study, the author derived the seismic intensity by analyzing data collected from the social media tweets in the decision tree ID3 model. Thus, this study defined the following set of variable places, , and the set contains categories of earthquake intensity. In this investigation, it was concluded that the semantic word of emotion or the disaster information from posts can be categorized into four classifications: body-feeling, sleep-affecting, furniture-toppling, and the damage situation of the house. According to these four classifications, the structure of the decision tree model is constructed by using the entropy value (S) and the information gain (Equations (1) and (2)).
In this formula, s corresponds to the number of total regions in Taiwan, m corresponds to the data with positive classification, and n corresponds to the data with negative classification.
Information gain measures the reduction in entropy that results from partitioning the data on attribute A, which is another way of saying that it represents how effective an attribute is for classifying the data.
The first term denotes the entropy of the data before the split, whereas the second term corresponds to the entropy afterwards. It is desired that the information gain is as high as possible and the entropies of the partitioned data as low as possible, which splits the training data into relatively heterogeneous groups. Figure 2 shows the pseudo code for constructing the decision tree model. In terms of the method, it can calculate the information gain of each attribute and the result is shown in Table 2.
The result shows that shaking feeling and sleep-affecting have the same value of 0.1339 for the information gain and are greater than other attributes. Furthermore, the attribute of shaking feeling is the most mentioned one in posts by the semantic analysis. The decision tree model is developed in this investigation as shown in Figure 3. Then, we perform the semantic analysis from PTT messages according to the keywords of the seismic intensity scale table from the CWB.
3. Results and Discussions
After an earthquake occurrence, there are many data or messages posted to discuss the shaking feeling and disaster information. This study examines the investigation by using the developed decision tree model with other earthquakes and collected data from the PTT BBS. Figure 4 shows the earthquake intensity scale distribution at different places in Taiwan, which is reported by the CWB for the earthquake occurring at 03:57 LT on 6 February 2016 with the seismic magnitude of . The result shows the largest intensity scale level 7 was derived from Tainan City, which is close to the epicenter, and the intensity scale level 5 was derived from a place near the downtown of Tainan City. The intensity scale reduced away from the epicenter. The intensity scale level 6 was derived at the mountain area of Yunlin County. The result shows that the distribution of the intensity scale follows the depression theorem. Figure 5 shows the same case with the result estimated by the examined model. In this case, there are 1234 BBS posts on PPT and 312 useful messages collected through the two requirements for analysis. There are many posts for analysis and many results are obtained for a local area. In this investigation, we selected the largest shaking scale level as the scale level of the local area. The result shows the largest intensity scale level 6 to be observed in Tainan City, intensity scale level 5 in Kaohsiung City, and scale level 4 in Miaoli, Changhua, Yunlin, Chiayi, and Pingtung counties. The eastern part of Taiwan represents the scale level 2 and 3 at Yilan and Hualien cities, respectively. The place shows up without a scale value at Taitung County, which means that we cannot collect any posts or identify the post to describe this place. The result of Figure 5 shows good agreement with Figure 4, except for the largest scale, which is less than 1 in Tainan City. The difference in the largest intensity scale in Tainan City is associated with many factors, but the possible reasons could be the emotional state and the building structure state. However, the result indicates the true emotional reaction and the observed condition of the damage, which is a case of good agreement that is officially reported for analysis by using the proposed method.
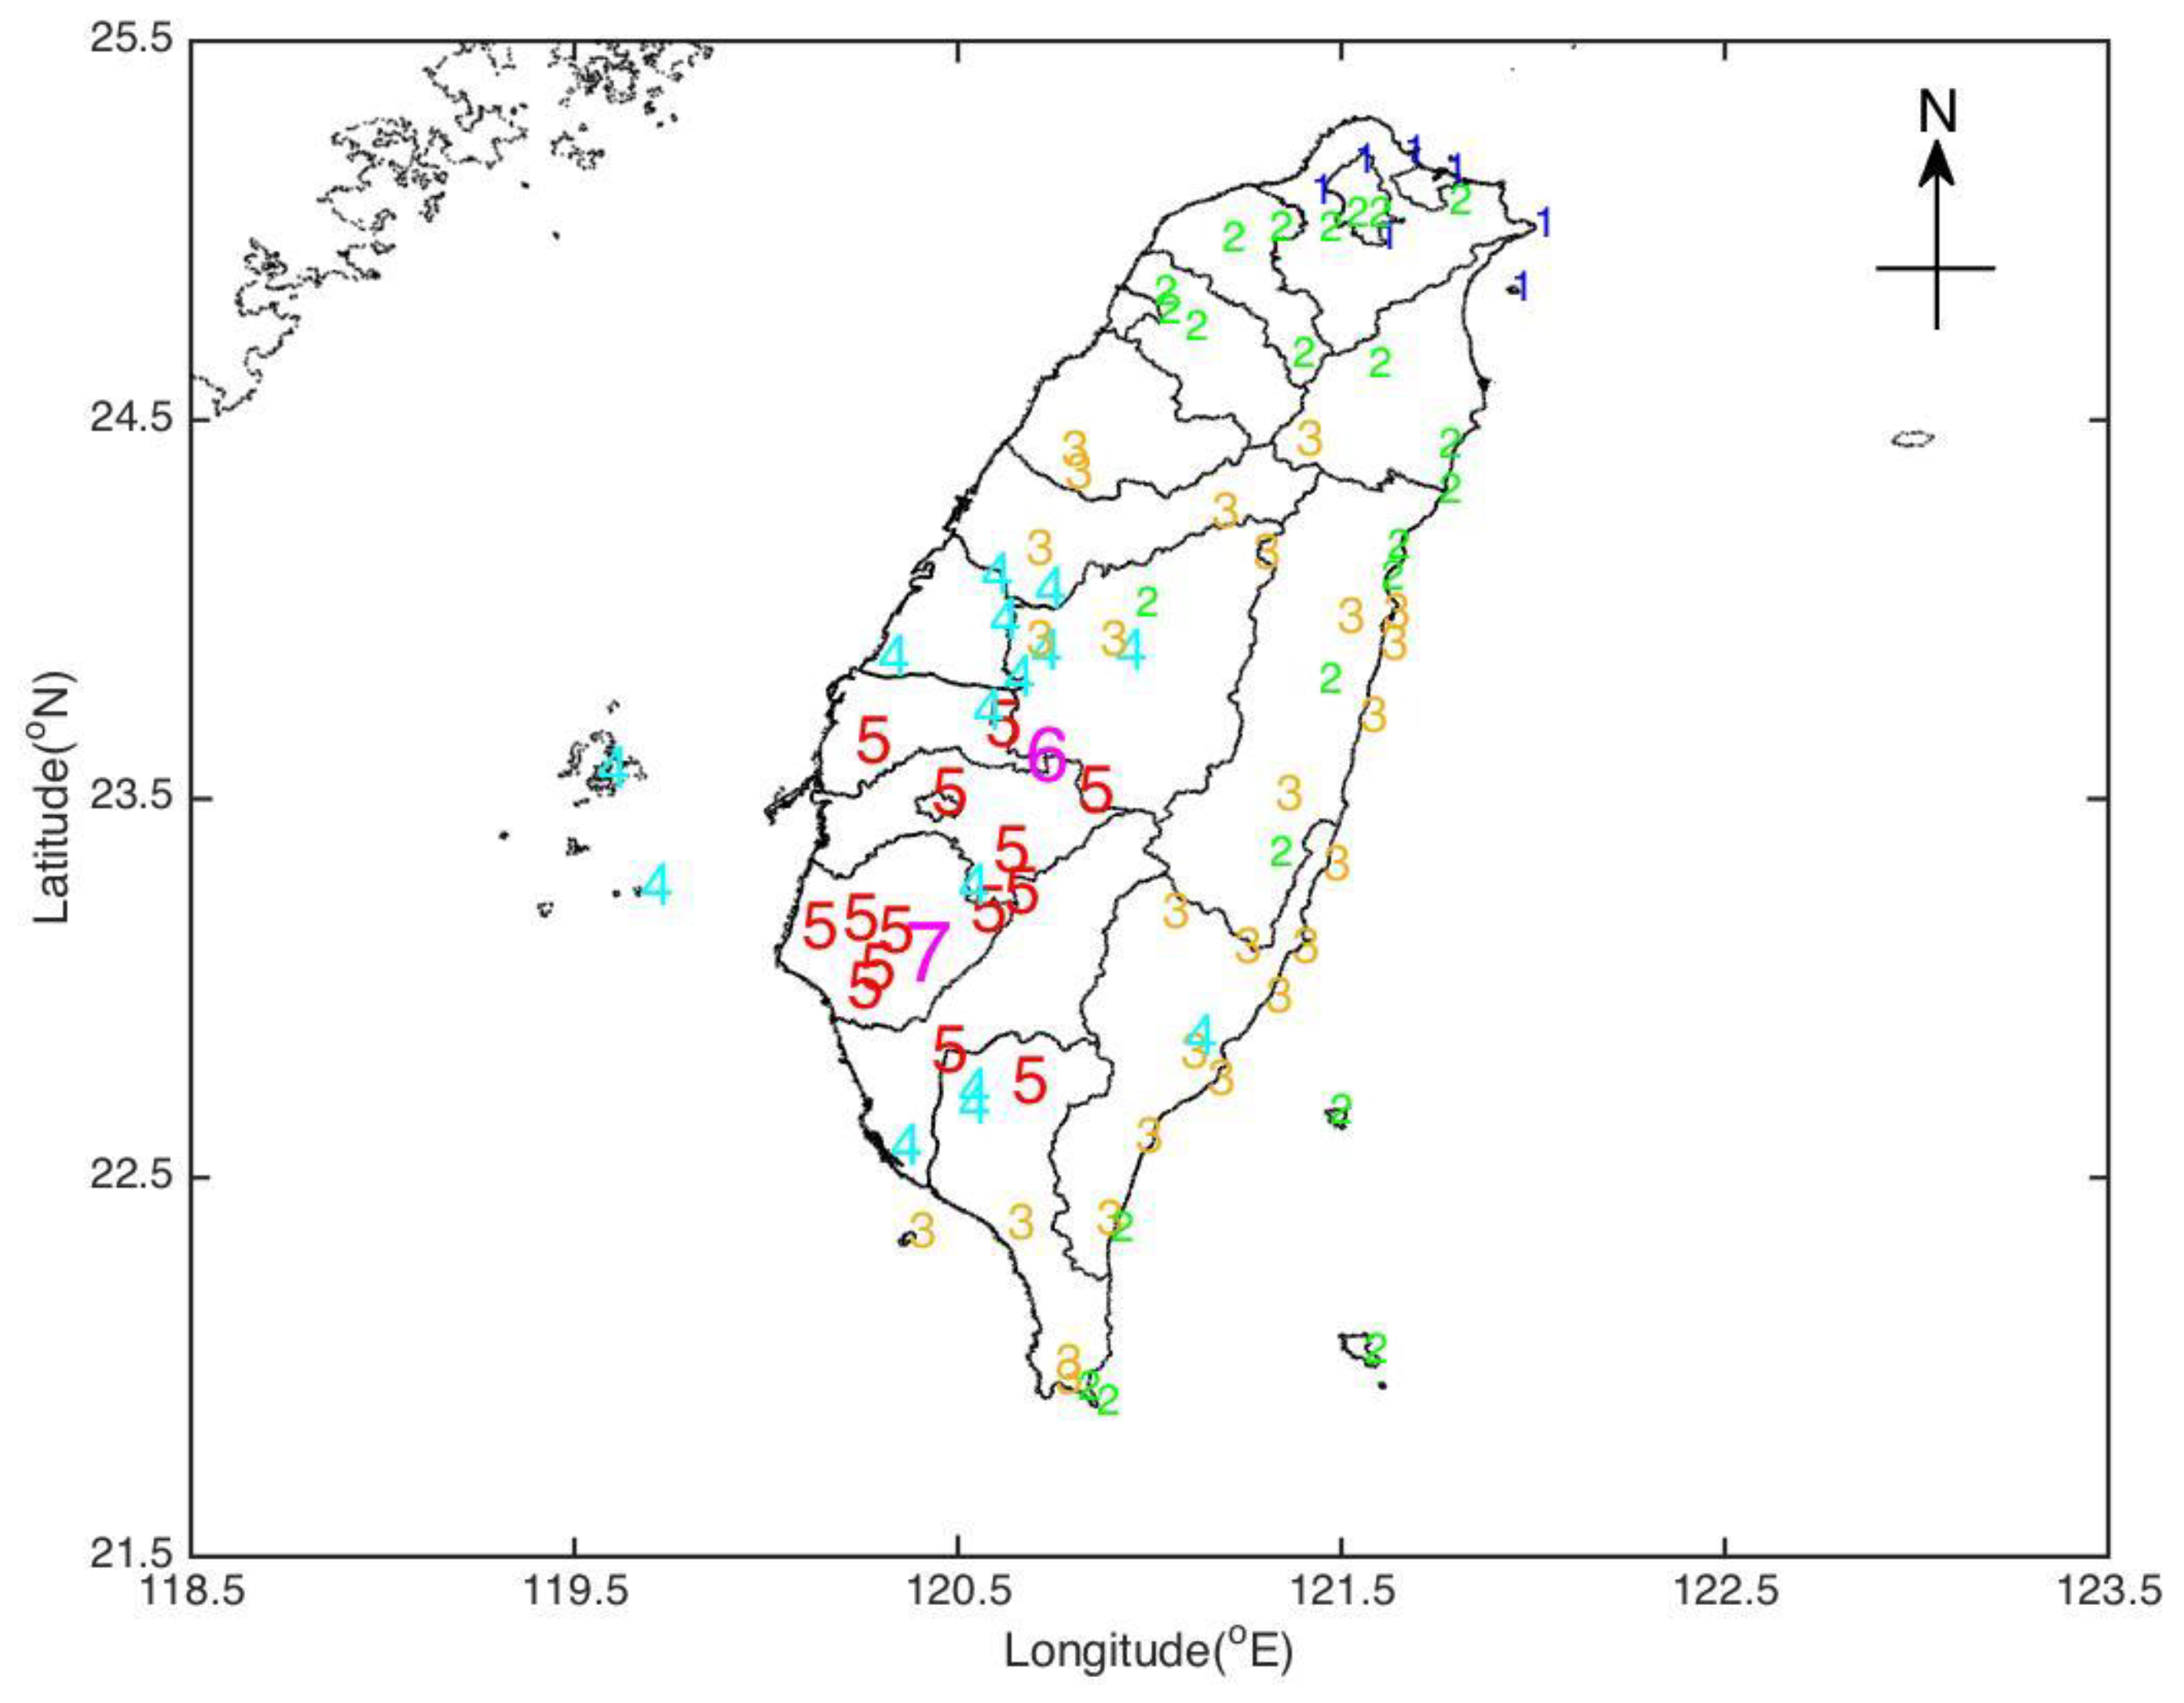
Figure 6 shows the same result as Figure 4 but for another earthquake event that occurred in Nantou County on 27 March 2013 with a seismic magnitude of . The result indicates that the largest intensity scale level 6 occurred in Nantou County and the next scale level 5 also occurred mainly in Nantou County with few occurrences in Taichung City and Miaoli County. The intensity scale level 4 occurs in Taichung City, Changhua, and Yunlin counties. The intensity scale levels 3 and 2 occurred in the eastern part of Taiwan. Figure 7 shows the result derived by using the proposed method. In this event, there were 775 posts and 163 messages collected to satisfy the two requirements to be used for analysis. The result shows that the largest intensity scale level 5 is observed at Taichung City, and the intensity scale level 3 is observed at Nantou County (central Taiwan). Furthermore, the intensity scale level 3 was observed in the northern part of Taiwan and Tainan City. The intensity scale level 3 was observed in the southern and eastern parts of Taiwan. Comparing Figure 6 with Figure 7, the result shows a fair agreement with that of the official report (Figure 6), except for the place of the largest intensity scale. The under-estimated error could be due to the lower population at the mountain area in Nantou County and a smaller seismic shaking affect at the downtown area. Therefore, the estimated value is smaller than that of the official report. The other possible reason could be the severe damage caused by the earthquake to the network, which hindered users from posting messages. Furthermore, Nantou County is a farming region and a tourism destination for people. Hence, a small number of people use PPT BBS. Meanwhile, most citizens are older in the region and make less posts, and therefore useful messages are considerably less. Therefore, from the useful message of the disaster information content, only the “feeling of the earthquake shaking and little shocking” type of disaster information was reported. Except for the underestimated location near the epicenter, the intensity scale at other places follows the official report by the CWB.
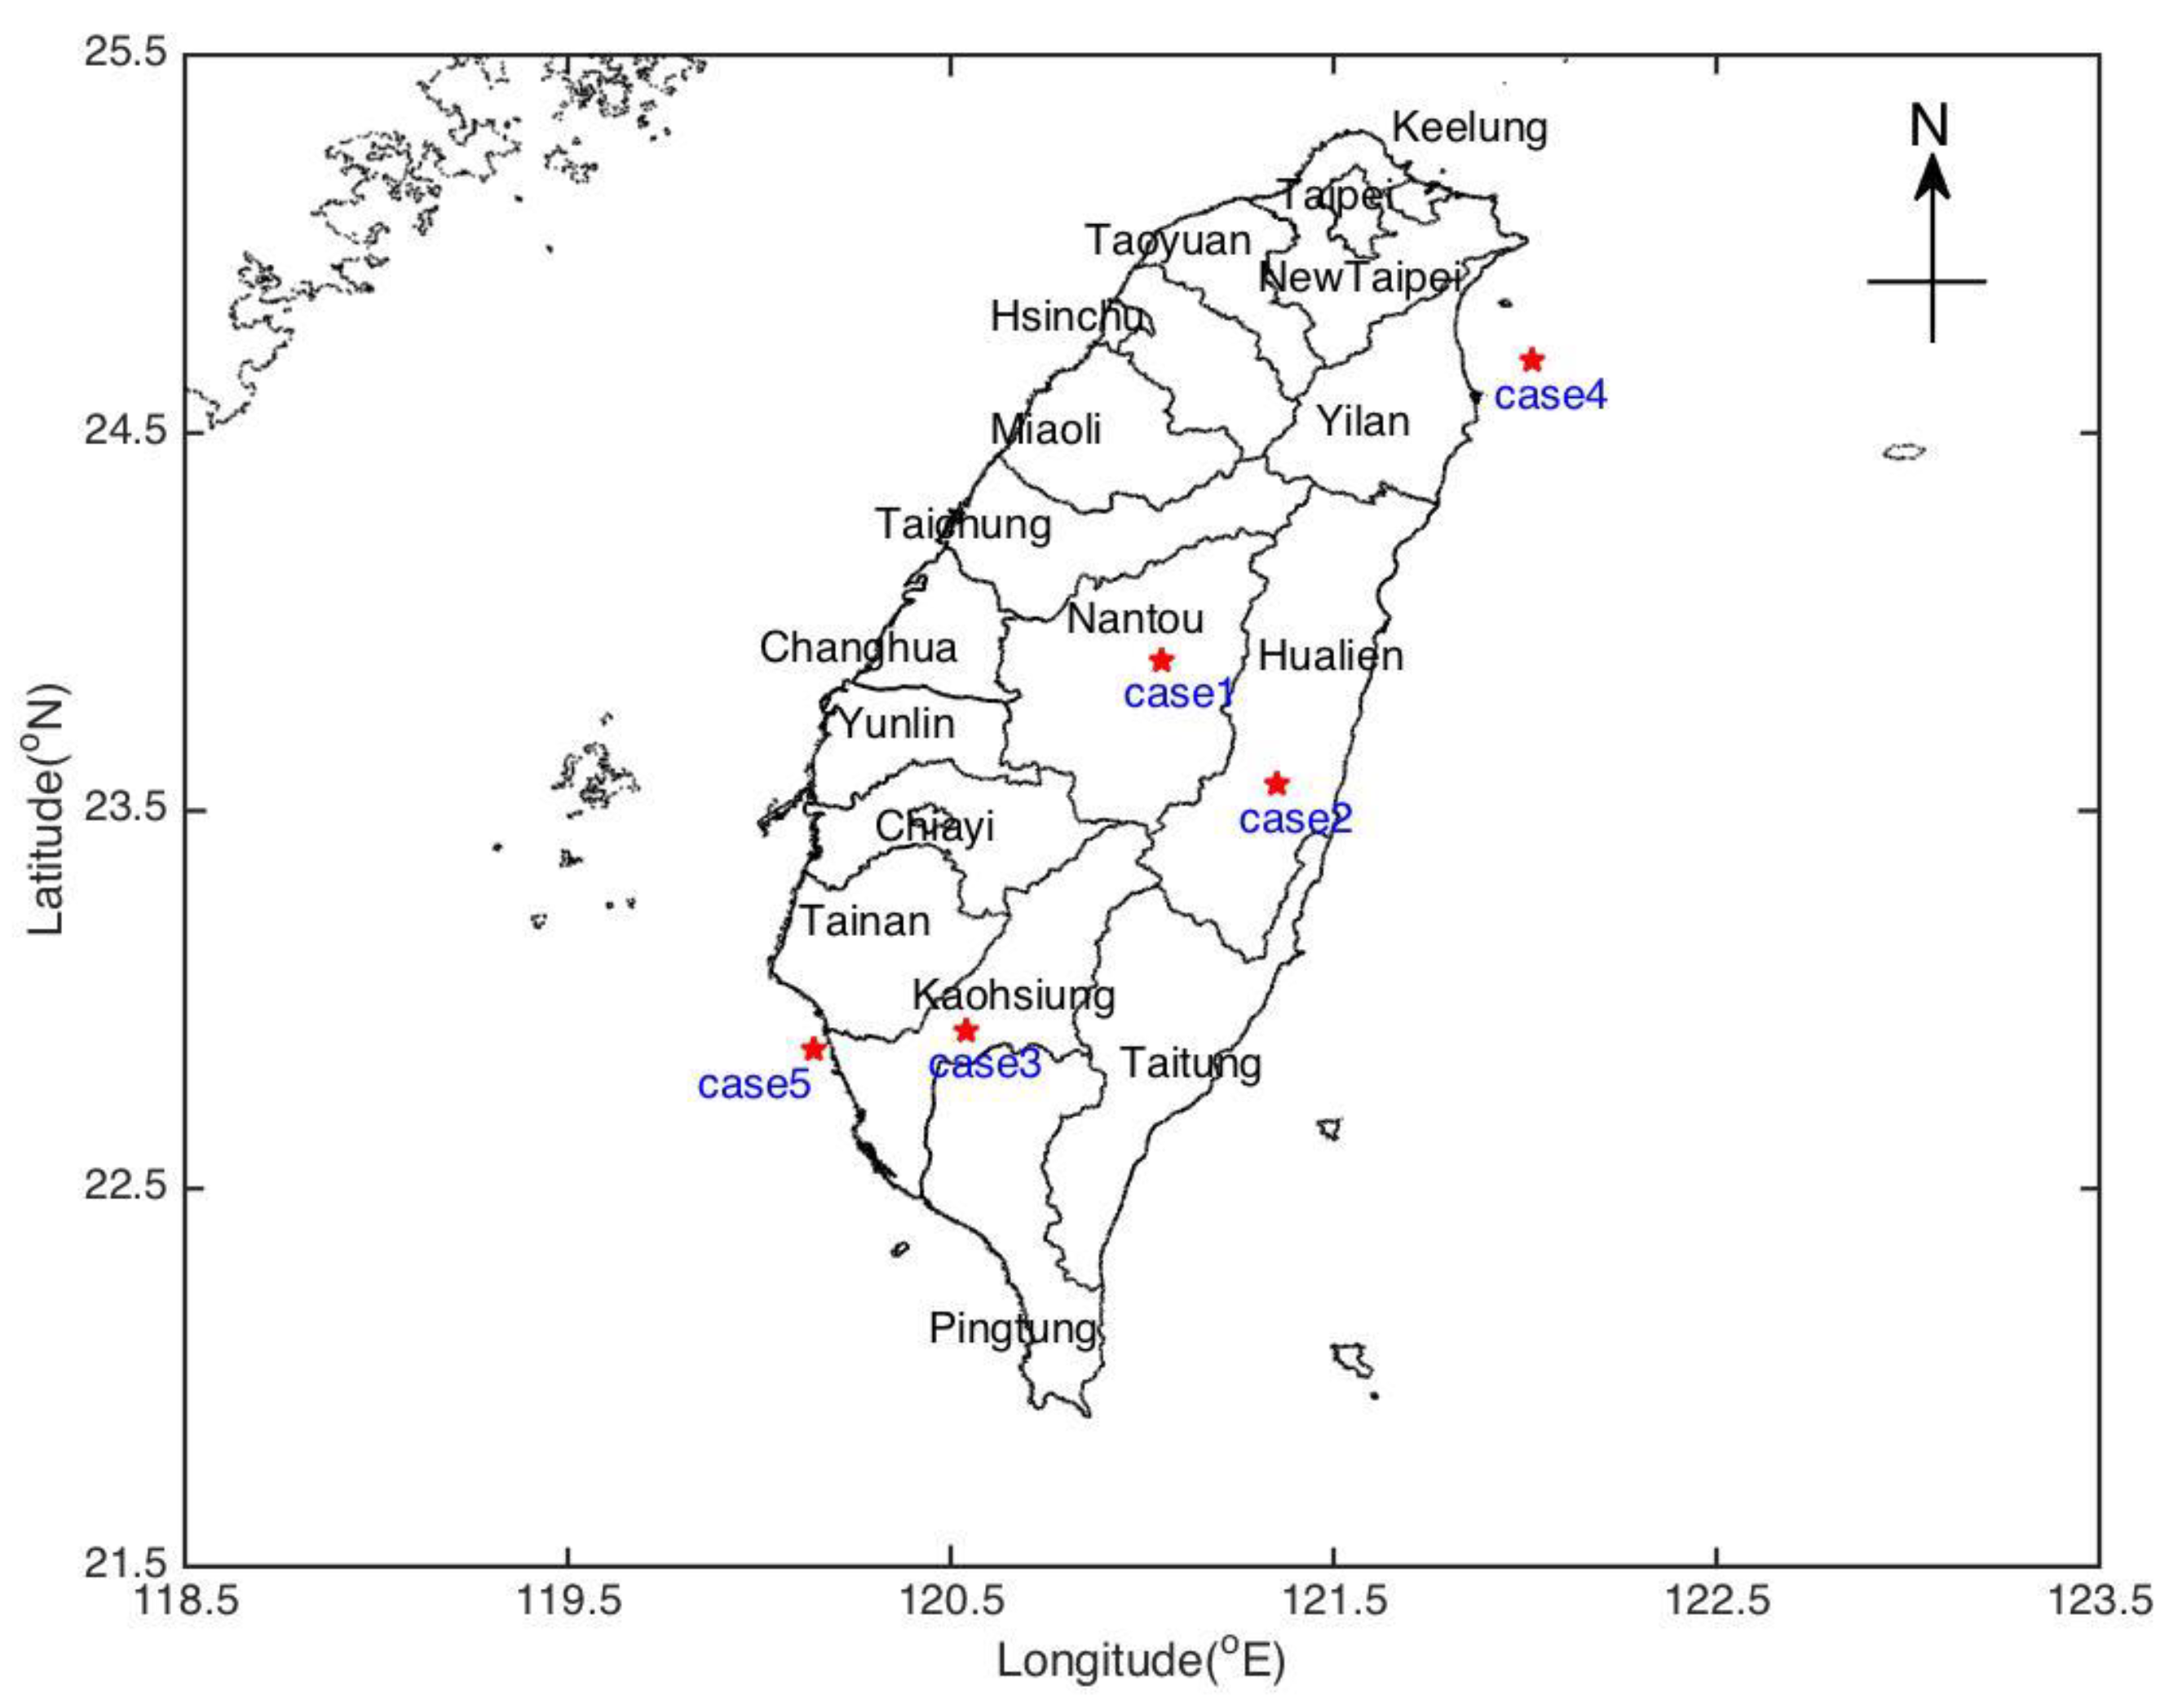
In this study, the author used two events to show results; however, the author in total selected five earthquakes to examine for this investigation. A total of 5167 posts were collected and the analysis of the disaster information was made using the proposed model to estimate the intensity scale level in the region. Figure 8 illustrates the locations of the epicenters of all five earthquakes (red pentagram).
Table 3 provides the characteristics of the origin time, epicenter, and the magnitude of the five earthquakes. The five events are all inland or close-by coast earthquakes because the seismic effect is more evident and is discussed by more people. To understand the proposed model, the estimated intensity scale level and the official reported scale level for all investigated earthquakes are summarized in Table 4. The result shows the estimated intensity scale level in different regions for the five events and is compared with the CWB official report. The result indicates that the proposed model agrees well with the CWB official report. The highlighted cell represents the difference in the derived value in contrast to the regular cell. The percentage of the successful estimation by the proposed model was 60%–83%. If the author removes the region without data, the percentage of successful estimation is between 79% and 87.5%.
Case 1 shows the percentage of those successful estimated to be 65% and increases up to 73.3% after removing two regions without effective posted messages. In the case where the earthquake occurred at the mountain area in Nantou County, the disaster contrasts slightly with the downtown area. Meanwhile, the most semantic analysis of the disaster information message shows that only the “the feeling of the shaking at somewhere” was reported. However, the shaking feeling will vary between people and buildings and cause slight discrepancy between the estimated value and the CWB report. Case 2 shows a successful rate of 76.5%. The inconsistent region in the seismic shaking scale is underestimated except for Taipei and Taichung cities. The overestimate could be attributed to the higher buildings or the geological conditions at Taipei and Taichung cities. However, the result shows that the disaster information could be more serious than the physical measurement (peak ground velocity). It indicates that the disaster management is very important during the earthquake event. Cases 4 and 5 show the results of off-land earthquakes and the percentage of success to be 71%. The result shows a situation where there is no data or useful data in the region of Pingtung, Taitung, and Hualien counties that could be attributed to less disaster occurring in the area. These results indicate that this study can derive the intensity scale level from the social media network messages and represent accurate conditions for disaster information.
4. Conclusions
In the past, posts and messages about earthquakes were considered to be of meaningless content. This study proposed an approach that can be used to estimate the earthquake intensity scale and confirms the possibility of the damage caused by the earthquake via factual analysis of users’ messages from the social media network. The messages by users from the social media network provide accurate conditions of earthquakes for analysis and could be different from seismographs. We are currently in the Internet era where many people post short messages on the social media network when an earthquake occurs to report their emotional states and the damage states of ornaments or cupboards. Some studies have also estimated the earthquake intensity scale by surveying social media network, which are mostly based on Twitter [21]. To extract disaster information effective for scale classification from the useful reported messages, the decision tree model was designed. This is the first study to estimate the earthquake intensity scale by the Chinese semantic from the social media network PTT. The PTT system does not have the location information of users, which increases the difficulty of the analysis in this study. Therefore, the data of the messages should be composed of two classifications of location and disaster information. This study analyzed the posted messages from the PTT website about earthquakes by using the data mining method to derive the earthquake intensity scale over Taiwan and compared it with the official report by the CWB. The results showed good agreement with the report of CWB for most cases in this study. However, this aspect is mainly concerned with severe seismic events because light seismic events do not pose a serious threat to the social media network. In this study, the results showed an overestimation of certain intensity scale levels compared to that of the CWB official report. This result is attributed to the shaking feeling, building structure, and the local geological conditions. However, we attempted to respond to the accurate disaster information of the region. The author hopes that this study provides some useful information, and thatthe results are shared with society to help emergency stakeholders and disaster management.
Funding
This study was supported by the Grants of the Ministry of Science and Technology MOST107-2111-M-275-001.
Acknowledgments
The author greatly thanks the PTT for providing data online. Meanwhile, the author thanks the anonymous reviewers for their insightful comments, which significantly improved the paper. Moreover, the author would like to thank C.F.H. for help in analyzing data. Furthermore, this study was supported by the Grants of the Ministry of Science and Technology MOST107-2111-M-275-001.
Conflicts of Interest
The author declares no conflict of interest.
References
- Park, M.; McDonald, D.; Cha, M. Perception differences between the depressed and non-depressed users in twitter. In Proceedings of the International Conference on Weblogs and Social Media, Cambridge, MA, USA, 8–11 July 2013; pp. 476–485. [Google Scholar]
- Xue, Y.; Li, Q.; Jin, L.; Feng, L.; Clifton, D.; Clifford, G. Detecting adolescent psychological pressures from micro-blog. In Proceedings of the International Conference on Health Information Science, Shenzhen, China, 22–23 April 2014; pp. 83–94. [Google Scholar]
- Java, A.; Song, X.; Finin, T.; Tseng, B. Why we twitter: Understanding microblogging usage and communities. In Proceedings of the Joint 9th WEBKDD and 1st SNA-KDD 2007 Workshop on Web Mining and Social Network Analysis, San Jose, CA, USA, 12–15 August 2007. [Google Scholar]
- Ekman, P.; Friesen, W.V.; Sullivan, M.; Chan, A.; Diacoyanni-Tarlatzis, I.; Heider, K.; Krause, R.; LeCompte, W.A.; Pitcairn, T.; Ricci-Bitti, P.E. Universals and cultural differences in the judgments of facial expressions of emotion. J. Personal. Soc. Psychol. 1987, 53, 712. [Google Scholar] [CrossRef]
- Mishne, G. Experiments with mood classification in blog posts. In Proceedings of the ACM SIGIR 2005 Workshop on Stylistic Analysis of Text for Information Access, Bahia, Brazil, 13–19 August 2005; Volume 19. [Google Scholar]
- Hancock, J.T.; Landrigan, C.; Siliver, C. Expressing emotion in text-based communication. In Proceedings of the International Conference on CHI, San Jose, CA, USA, 27 April–3 May 2007; pp. 929–932. [Google Scholar]
- Tokuhisa, R.; Inui, K.; Matsumoto, Y. Emotion classification using massive examples extracted from the web. In Proceedings of the 22nd International Conference on Computational Linguistics, Manchester, UK, 18–22 August 2008; Association for Computational Linguistics: Stroudsburg, PA, USA, 2008; pp. 881–888. [Google Scholar]
- Quan, C.; Ren, F. A blog emotion corpus for emotional expression analysis in Chinese. Comput. Speech Lang. 2010, 56, 726–749. [Google Scholar] [CrossRef]
- Pak, A.; Paroubek, P. Twitter as a corpus for sentiment analysis and opinion mining. In Proceedings of the 7th International Conference on Language Resources and Evaluation (LREC), Valletta, Matla, 19–21 May 2010; Volume 10, pp. 1320–1326. [Google Scholar]
- Baldoni, M.; Baroglio, C.; Patti, V.; Rena, P. From tags to emotions: Ontology-driven sentiment analysis in the social semantic web. Intell. Artif. 2012, 6, 41–54. [Google Scholar] [CrossRef] [Green Version]
- Shen, Y.C.; Kuo, T.T.; Yeh, I.N.; Chen, T.T.; Lin, S.D. Exploiting Temporal Information in a Two-Stage Classification Framework for Content-Based Depression Detection. In Proceedings of the Advances in Knowledge Discovery and Data Mining: 17th Pacific-Asia Conference, PAKDD, Gold Coast, Australia, 14–17 April 2013; pp. 276–288. [Google Scholar]
- Tapete, D. Key Topics and Future Perspectives in Natural Hazards Research. Geosciences 2020, 10, 22. [Google Scholar] [CrossRef] [Green Version]
- Yu, M.; Yang, C.; Li, Y. Big Data in Natural Disaster Management: A Review. Geosciences 2018, 8, 165. [Google Scholar] [CrossRef] [Green Version]
- Kaur, N.; Singh, M.; Singh, V.P. Design and Develop A Framework for Social Networking Analysis. In Proceedings of the 2016 International Conference on Inventive Computation Technologies (ICICT), Coimbatore, India, 26–27 August 2016. [Google Scholar] [CrossRef]
- Pirnau, M. Analysis of the use of social networks in acquiring information on disastrous events. In Proceedings of the 2016 15th RoEduNet Conference: Networking in Education and Research, Bucharest, Romania, 7–9 September 2016. [Google Scholar] [CrossRef]
- Cresci, S.; Avvenuti, M.; La Polla, M.; Meletti, C.; Tesconti, M. Nowcasting of Earthquake Consequences using Big Social Data. IEEE Internet Comput. 2016, 99. [Google Scholar] [CrossRef]
- Middleton, S.E.; Middleton, L.; Modafferi, S. Real-time crisis mapping of natural disasters using social media. IEEE Intell. Syst. 2014, 29, 9–17. [Google Scholar] [CrossRef] [Green Version]
- Nguyen, D.T.; Jung, J.E. Real-time event detection for online behavioral analysis of big social data. Future Gener. Comput. Syst. 2017, 66, 137–145. [Google Scholar] [CrossRef]
- Imran, M.; Castillo, C.; Lucas, J.; Meier, P.; Vieweg, S. AIDR: Artificial intelligence for disaster response. In Proceedings of the 23rd International Conference on World Wide Web, Seoul, Korea, 7–11 April 2014; ACM: New York, NY, USA, 2014; pp. 159–162. [Google Scholar]
- Chae, J.; Thom, D.; Jang, Y.; Kim, S.; Ertl, T.; Ebert, D.S. Public behavior response analysis in disaster events utilizing visual analytics of microblog data. Comput. Graph. 2014, 38, 51–60. [Google Scholar] [CrossRef]
- Sakaki, T.; Okazaki, M.; Matsuo, Y. Earthquake Shakes Twitter Users: Real-time Event Detection by Social Sensors. In Proceedings of the 19th International Conference on World Wide Web, Raleigh, NC, USA, 26–30 April 2010; pp. 851–860. [Google Scholar] [CrossRef]
- Haubrock, S.; Wittkopf, T.; Grunthal, G.; Dransch, D. Community-made earthquake intensity maps using Google’s API. In Proceedings of the 10th AGILE International Conference on Geographis Information Science, Aalborg, Denmark, 8–11 May 2007. [Google Scholar]
- Xu, J.H.; Nie, G.Z.; Xu, X. A digital social network for rapid collection of earthquake disaster information. Nat. Hazards Earth Syst. Sci. 2013, 13, 385–394. [Google Scholar] [CrossRef]
- Quinlan, J.R. Induction of decision trees. In Machine Learning 1; Kluwer Academic Publishers: Hingham, MA, USA, 1986; pp. 81–106. [Google Scholar] [CrossRef] [Green Version]
- Hosseini, S.A.; Afrakoti, I.E.P. Energy spectra unfolding of fast neutron sources using the group method of data handling and decision tree algorithms. Nucl. Intruments Methods Phys. Res. A 2017, 851, 5–9. [Google Scholar] [CrossRef]
Figure 1.
A real tweet example on the PTT Gossiping board.

Figure 2.
The pseudo code of the classification.

Figure 3.
The decision tree model structure.

Figure 4.
The intensity scale distribution reported by the CWB for the earthquake occurring on 6 February 2016.
Figure 4.
The intensity scale distribution reported by the CWB for the earthquake occurring on 6 February 2016.

Figure 5.
The intensity distribution analyzed by our approach for the earthquake occurring on 6 February 2016.
Figure 5.
The intensity distribution analyzed by our approach for the earthquake occurring on 6 February 2016.

Figure 6.
The intensity scale distribution reported by the CWB for the earthquake occurring on 27 March 2013.
Figure 6.
The intensity scale distribution reported by the CWB for the earthquake occurring on 27 March 2013.

Figure 7.
The intensity distribution analyzed by our approach for the earthquake occurring on 27 March 2013.
Figure 7.
The intensity distribution analyzed by our approach for the earthquake occurring on 27 March 2013.

Figure 8.
The red pentagram symbol denotes the locations of the five earthquakes in the Taiwan area.
Figure 8.
The red pentagram symbol denotes the locations of the five earthquakes in the Taiwan area.


Table 1.
Seismic scale level table from the Central Weather Bureau.
| Level | Feelings for Earthquake | Inside of House for Earthquake |
|---|---|---|
| 0 | No feelings. | |
| 1 | A slight tremor can be felt. | |
| 2 | The most people can feel quake. | The pendants tremor slightly. |
| 3 | Someone has feeling of fear. | The house and pendants are shaking. |
| 4 | Startled and woke up at midnight. | The house is shaking violently and the heavy furniture moved. |
| 5 | Most people feel scared. | The wall has a crack and heavy furniture may overturn. |
| 6 | Shaking violently and standing with difficulty. | Some buildings have damage, the door and windows maybe deformed. |
| 7 | Shaking violently cannot move. | Some building suffered great damage and collapsed, almost all furniture was overturned. |
Table 2.
The value of entropy and information gain of every attributes.
| Attributes | Entropy(S) | Gain(S,Ai) |
|---|---|---|
| Body-feeling | 0.7401 | 0.1339 |
| Sleep-affecting | 0.7401 | 0.1339 |
| Furniture-toppling | 0.7971 | 0.0769 |
| Damage situation of house | 0.8433 | 0.0307 |
Table 3.
Catalog of the earthquakes used in this study.
| Case | Year | Month | Day | Hour | Min | Latitude | Longitude | Depth | Magnitude |
|---|---|---|---|---|---|---|---|---|---|
| 1 | 2013 | 3 | 27 | 10 | 03 | 121.05 | 23.90 | 19.4 | 6.2 |
| 2 | 2013 | 10 | 31 | 20 | 02 | 121.35 | 23.57 | 15.0 | 6.4 |
| 3 | 2016 | 2 | 6 | 03 | 57 | 120.54 | 22.92 | 14.6 | 6.6 |
| 4 | 2016 | 5 | 12 | 12 | 29 | 122.02 | 24.69 | 12.0 | 5.7 |
| 5 | 2017 | 2 | 11 | 01 | 12 | 120.14 | 22.87 | 16.2 | 5.7 |
Table 4.
Summarization of the scale level for the model estimated and the CWB official reporting.
| Events | Case 1 M6.2 | Case 2 M6.4 | Case 3 M6.6 | Case 4 M5.7 | Case 5 M5.7 | |
|---|---|---|---|---|---|---|
| Regions | ||||||
| Keelung | 2–3 (2) | 2 (2) | 1 (1) | 3–4 (3) | 0 (0) | |
| Yilan | 2–3 (2) | 3–5 (2) | 1–2 (2) | 3–6 (3) | 1 (X) | |
| Taipei | 2–3 (3) | 3 (4) | 1–2 (2) | 3 (3) | 0 (1) | |
| New Taipei | 1–2 (3) | 2–4 (2) | 1–2 (3) | 2–4 (3) | 0 (1) | |
| Taoyuan | 2 (2) | 3–4 (3) | 2 (2) | 3–4 (3) | 0 (0) | |
| Hsinchu | 3 (2) | 3 (3) | 2 (2) | 3–4 (2) | 1 (1) | |
| Miaoli | 3–5 (3) | 3 (2) | 2–3 (3) | 2–3 (3) | 1 (1) | |
| Taichung | 4–5 (5) | 3 (4) | 3 (3) | 1–2 (2) | 1–2 (2) | |
| Changhua | 4–5 (4) | 2–3 (3) | 3–4 (4) | 1–2 (2) | 2 (2) | |
| Nantou | 4–6 (3) | 2–5 (2) | 2–3 (3) | 1–2 (X) | 1–2 (1) | |
| Yunlin | 4 (X) | 3 (3) | 4 (3) | 2 (1) | 2–3 (2) | |
| Chiayi | 3–4 (2) | 3 (3) | 5 (4) | 1–2 (1) | 3 (3) | |
| Tainan | 2–4 (3) | 2–3 (3) | 5–7 (7) | 1 (1) | 2–6 (5) | |
| Kaohsiung | 2 (2) | 2 (2) | 5 (5) | 1 (1) | 2–4 (4) | |
| Pingtung | 1–2 (2) | 2–3 (2) | 3 (3) | 1 (X) | 1–3 (2) | |
| Taitung | 1–2 (X) | 1–3 (2) | 3 (X) | 1 (X) | 1–2 (X) | |
| Hualien | 2–3 (2) | 3–6 (5) | 2–3 (2) | 1–4 (1) | 1 (X) | |
© 2020 by the author. Licensee MDPI, Basel, Switzerland. This article is an open access article distributed under the terms and conditions of the Creative Commons Attribution (CC BY) license (http://creativecommons.org/licenses/by/4.0/).
Share and Cite
MDPI and ACS Style
Chuo, Y.-J. Earthquake Shake Detecting by Data Mining from Social Network Platforms. Appl. Sci. 2020, 10, 812. https://doi.org/10.3390/app10030812
AMA Style
Chuo Y-J. Earthquake Shake Detecting by Data Mining from Social Network Platforms. Applied Sciences. 2020; 10(3):812. https://doi.org/10.3390/app10030812
Chicago/Turabian StyleChuo, Yu-Jung. 2020. "Earthquake Shake Detecting by Data Mining from Social Network Platforms" Applied Sciences 10, no. 3: 812. https://doi.org/10.3390/app10030812
Note that from the first issue of 2016, this journal uses article numbers instead of page numbers. See further details here.