Optimization of Texture Density Distribution of Carbide Alloy Micro-Textured Ball-End Milling Cutter Based on Stress Field


Key Laboratory of Advanced Manufacturing and Intelligent Technology, Ministry of Education, Harbin University of Science and Technology, Harbin 150080, China
*
Author to whom correspondence should be addressed.
Appl. Sci. 2020, 10(3), 818; https://doi.org/10.3390/app10030818
Submission received: 6 December 2019
/
Revised: 18 January 2020
/
Accepted: 20 January 2020
/
Published: 23 January 2020
Abstract
:The insertion of micro-textures plays a role in reducing friction and increasing wear resistance of the cutters, which also has a certain impact on the stress field of the cutter during milling. Therefore, in order to study the mechanisms of friction reduction and wear resistance of micro-textured cutters in high speed cutting of titanium alloys, the dynamic characteristics of the instantaneous stress field during the machining of titanium alloys with micro-textured cutters were studied by changing the distribution density of the micro-textures on the cutter. First, the micro-texture insertion area of the ball-end milling cutter was theoretically analyzed. Then, variable density micro-textured ball-end milling cutters and non-texture cutters were used to cut titanium alloy, and the mathematical model of milling force and cutter-chip contact area was established. Then, the stress density functions of different micro-texture density cutters and non-texture cutters were established to simulate the stress fields of variable density micro-textured ball-end milling cutters and non-texture cutters. Finally, the genetic algorithm was used to optimize the variable density distribution of micro-textured cutters in which the instantaneous stress field of the cutters was taken as the optimization objective. The optimal solution for the variable density distribution of the micro-textured cutter in the cutter-chip tight contact area was obtained as follows: the texture distribution densities in the first, second, and third areas are second, and third areas are 0.0905, 0.0712, and 0.0493, respectively.
1. Introduction
In recent years, titanium alloy materials have been widely used in aerospace, shipbuilding, metallurgy, light industry, chemical industry, biomedical and other industries due to their excellent physical and chemical properties. However, the low thermal conductivity and high chemical activity of titanium alloys lead to severe tool wear and low cutting efficiency, which are the main factors limiting the development of titanium alloys. In the field of tribology, uneven surfaces have the function of reducing friction, and have received unprecedented attention. Therefore, the basic concept of surface texture is proposed. Preparing regularly arranged micro pits or grooves on smooth and susceptible surfaces can greatly reduce the friction and surface abrasion [1,2,3]. Micro-textures also play an active role in the field of modern cutting tools.
Milling titanium alloys is intermittent, and cutting process of the cutter is very complicated. The cutting force on the cutter is unevenly distributed during the milling process, and its size and direction change with time. The distribution of the milling force directly affects the stress distribution inside the milling insert. Therefore, it is necessary to study the stress field of the cutter during the cutting process in order to obtain the worst conditions of the cutter. Cheng and Li studied the stress density function and stress field of the corrugated edge milling cutter and concluded that, during the cutting process of the corrugated edge milling cutters, the stress on the cutter is mainly distributed on the main cutting edge near the tip, and the stress is concentrated near the tip [4,5]. Fan et al. studied the cutting stress field of ceramic tools with a gradient function by finite element analysis and obtained the optimal gradient distribution index by modeling the cutting stress field under the same cutting load [6,7]. Li et al. carried out milling force prediction experiments on the titanium alloy TC21. The results show that, in the process of high-speed milling TC21 titanium alloy, the cutting depth and feed per tooth have a greater impact on the cutting force, while the cutting speed and radial cutting depth have no significant effect on the cutting force [8,9]. Kim and Ehmann simulated the static and dynamic milling force in the face milling process. Based on the machine tool structure and fixture design, a mathematical model of the scattered force components of the face milling cutter was established. Consistent results were obtained from cutting experiments on different milling cutters and workpiece materials [10]. Wertheim et al. studied the performance of spiral and serrated edge milling inserts in the cutting process. They believed that curved-edge milling inserts can improve the stability of machining, reduce milling forces and improve chip flow [11]. Guo et al. numerically modeled and experimentally studied the micro-milling force of titanium alloy based on tool runout. The micro-milling force model was validated by analyzing the width of the steps on the edge of the groove [12,13]. Zhang simulated the stress field of a flat-faced milling cutter and a 3D complex groove milling cutter using the density function of the milling force as a boundary condition. It was found that a milling cutter with a rake angle and an edge inclination can fundamentally change the stress at the tool tip [14,15]. Sun et al. fabricated micro-grooves and micro-pits on the rake face of WC/Co tools, and then studied the cutting performance of the tools. The results show that the composite texture with micro-pits and micro-slots can be used as a micro-reservoir to continuously supplement lubricating oil, thus improving the cutting performance of the mixed micro-textured cutter [16,17,18]. Wei et al. conducted tribological and cutting experiments on aluminum alloy workpieces by sandblasting micro-materials and machining micro-geometric features of the rake face of the sapphire tools. The results show that, compared with traditional tools, the micro-textured tool edge has the lowest interfacial friction and the cutting force is significantly reduced. Machining micro-textures on the rake face of the cutter can reduce the adhesion of the workpiece material [19]. Pang et al. prepared symmetric conical micro-grooves and parallel micro-grooves on carbide cutters, and then studied the friction performance of the cutters [20]. Lin et al. modeled the cutting force of the vertical milling cutter under the conditions of oblique cutting and proposed a mechanical model for predicting the cutting force of the vertical milling cutters [21]. Li et al. used a multi-level fuzzy comprehensive evaluation method based on multi-objective decision theory to evaluate the cutting performance of micro-textured cutters in titanium alloy processing [22]. Darshan studied the improvement of tribology and thermal environment of inconel-718 alloy by textured tools. The results reveal that the textured tools perform better, ensuring lower tool wear (VB), reduced cutting forces (Fc), lower surface roughness (Ra) and acceptable chip form [23,24].
In summary, placing micro-textures on the surface of a tool to improve the friction reduction and wear resistance of the tool has become a hot topic. However, in the process of milling titanium alloys, there is still a lack of theoretical research and experimental basis for in-depth study of the anti-wear and friction reduction mechanism of micro-textured cutters. Problems such as “secondary cutting” still exist during the cutting process of micro-textured cutters. Reasonable micro-texture arrangement can make the cutters have good anti-wear and anti-friction performance, and it can also solve the secondary wear problem of the micro-textured cutters, thereby improving the processing efficiency. Therefore, in this paper, by changing the single density distribution of the micro-texture in the cutter-chip close contact area, the change of the tool stress field during cutting titanium alloys with the variable density micro-textured cutter was studied. Based on the stress field, the texture variable density distribution of the micro-textured ball-end milling cutters was optimized.
2. Experiment of Milling Titanium Alloy with the Variable Density Micro-Textured Ball-End Milling Cutter
2.1. Design and Fabrication of Variable Density Micro-Textures
Previous studies of micro-textured cutters used a uniform distribution method to prepare micro-textures in the areas where the cutter-chips are in close contact [25,26]. However, from the tool wear diagram of the micro-textured cutters after cutting titanium alloy, it can be seen that the wear of the tool along the contact length and width of the cutter-chip in the compact contact area of the rake face is irregular. The wear near the cutting edge is more severe, and, as the distance from the cutting edge gets longer, the wear on the tool becomes less and less [27]. There is also some wear in the direction of chip outflow. This is because, during the outflow of chips, the cutting speed of the ball-end milling cutter along the cutting edge is different, which leads to the transverse curl of the chip. As the cutting depth increases, the flow rate at the bottom of the chip is different from flow rate at the top, and the chip curls upward. Therefore, in the process of chip deformation, “secondary cutting” occurs at the edges of the micro-texture, as shown in Figure 1. This phenomenon will cause secondary wear of micro-textured cutters.
In order to solve the “secondary cutting” phenomenon of the micro-textured cutter, the region where the cutter-chip is in compact contact is divided into three regions according to the wear condition of the cutter, namely the first area X1, the second area X2, and the third area X3, as shown in Figure 2. Studies have shown that pit texture can effectively reduce friction and wear [28,29]. Therefore, by changing the density of micro-texture in each region, the dynamic evolution of secondary cutting between micro-textured cutter and the chip was studied. Experiments have shown that a texture distribution density (the ratio of the total area of the pit texture to the total area of the micro-texture preparation is defined as the texture distribution density) between 0.05 and 0.1 can play a better role in reducing friction and wear. Therefore, the micro-texture densities in the cutter-chip contact area of the cemented carbide tool designed in this paper are 0.05, 0.07 and 0.09, respectively. By arranging and combining the three texture densities in the cutter-chip compact contact area, three uniformly distributed micro-textures and six variable density micro-textures were obtained. The distribution combination of the texture density is shown in Table 1.
According to previous studies, when the diameter, depth and distance from the cutting edge of the micro-texture are 50 μm, 35 μm and 120 μm, respectively, the micro-textured cutter can achieve better friction reduction and wear resistance [30]. Therefore, the diameter, depth and distance from the cutting edge of the micro-texture designed in this paper are 50 μm, 35 μm and 120 μm, respectively. According to the three densities of 0.05, 0.07 and 0.09, the center spacing between the micro-textures are 190 μm, 170 μm and 150 μm, respectively. The micro-textures were then prepared in three areas of the cutter-chip compact contact by using a fiber laser. After processing, the melt around the micro-texture was cleaned by sandpaper and an ultrasonic cleaner.
2.2. Design of Test Scheme and Test Equipment
2.2.1. Design of Test Scheme
In this paper, an orthogonal experiment was used to design the experiment of milling titanium alloy with a micro-textured ball-end milling cutter. By changing cutting parameters, the change of milling force with time and the change of tool-chip contact length and width with the feed and cutting depth were studied. The orthogonal test was designed to include three factors (cutting speed, cutting depth and feed rate), which contained four levels, as shown in Table 2. L16 (45) was selected in the orthogonal table for the milling test.
According to the arrangement and distribution of textures with different densities, nine combinations were obtained, corresponding to nine micro-texture cutters, and then a non-texture cutter was used for comparative analysis. Milling titanium alloy test was carried out for each cutter according to Table 2. Each cutter was tested in 16 groups, and one layer was milled on the workpiece for each set of cutting parameters. Six points were averaged along the length of the workpiece, and a set of cutting force values were measured at each point location. Then, by averaging six sets of data in each layer, the cutting force values in the X, Y, and Z directions for each set of cutting parameters were calculated. This is the basic data for the next calculation of the cutting force test formula. At the same time, the position of the center point was taken to measure the value of the milling force varying with time.
2.2.2. Test Equipment
In this experiment, a VDL-1000E four-axis CNC milling machine (Dalian Machine Tool, Dalian, China) was used for milling titanium alloy test. The test material was titanium alloy TC4, and the cutter was a micro-textured ball-end milling cutter. Sinusoidal tongs were used to clamp the workpiece at an inclined angle of 15 degrees. In the case of planar milling, the tool bit always participates in cutting, and the linear speed is always zero. This will accelerate the wear of the tool bit, reduce the service life of the tool, and affect the quality of the machined surface of the workpiece. Some scholars have found that when the processing angle of the workpiece is 15 degrees, the ball end milling cutter can achieve the best cutting performance [31,32]. The processing method adopted in this paper was climb milling, and the established milling test platform is shown in Figure 3. The measurement of milling force was based on a Kistler 9257B dynamometer (Kistler, Winterthur, Switzerland) with a response frequency of 5000 Hz. The data acquisition system was the DH5922_1394 signal test and analysis system of Donghua testing company (Jingjiang, China).
2.3. Analysis of Milling Force Test Results
In the process of cutting titanium alloy by an orthogonal test, a dynamometer was used to measure the change of cutting force of nine kinds of variable density micro-textured cutters and non-texture cutters with time. One of the micro-textured cutters with a texture density combination of 0.09–0.09–0.09 is selected as an example. The cutting parameters are: n = 2729 r/min, ap = 0.7 mm, fz = 0.08 mm/z, and the changes of the milling forces in the X, Y and Z directions of a milling cycle were collected, as shown in Table 3.
A three-direction milling force data fitting program was written with MATLAB software, and the equations of the three-direction milling force change over time were fitted. The calculation results are
2.4. Analysis of Test Results of Cutter-Chip Contact Area
Theoretically, the calculation of the contact area between the cutter and the chip is very complicated for the micro-textured ball-end milling cutter. Therefore, in the milling process, the contact diagram method was used to fit the contact area between the ball-end milling cutter and the chip. After the milling, the titanium alloy, nine texture density combinations and non-texture cutters were observed through an ultra-depth microscopy, and the cutter-chip contact area on the front of the cutter was measured. The contact length and width of the cutter-chip contact were approximated by the contact diagram method. Taking a micro-textured cutter with a texture density combination of 0.09–0.09–0.09 as an example, the experimental data of the tool-chip contact length and width obtained by measuring and fitting are shown in Table 4.
3. Force Density Function of Variable Density Micro-Texture Ball-End Milling Cutter
3.1. Milling Force Model of Micro-Textured Ball-End Milling Cutter
The high-speed milling of titanium alloy by micro-textured ball-end milling cutter is intermittent cutting. With the change of the micro-textured cutter from cutting in to cutting out the workpiece, the magnitude and direction of the instantaneous milling force also change, which affects the stress field distribution on the front of the cutter. Therefore, it is necessary to solve the milling cycle T, the angle of cutting into workpiece ψin, the time of cutting into the workpiece ti and the cutting time t0 of the micro-textured ball-end milling cutter, respectively. The solution process is as follows:
where n is the spindle speed (r/min), z is the number of teeth on the tool edge, and R is the tool edge radius.
The main factors of cutting parameters affecting milling force are the cutting depth and feed per tooth. Therefore, an empirical formula model of milling force was established by using multiple linear regression method. The empirical formula model of the milling force is as follows:
Taking the logarithm of both sides is
Let f = lgFj, a0 = lgC, a1 = lgap, a2 = lgaf, the linearization of Equation (7) is
The calculation and fitting were performed using MATLAB software, and the milling force test data collected from the X, Y and Z directions of nine variable density combination cutters and non-textured cutters were substituted into the calculation. Taking a micro-textured cutter with a texture density combination of 0.09–0.09–0.09 as an example, the milling forces in the X, Y and Z directions measured by orthogonal tests are shown in Table 5. The experimental data in the table were substituted into MATLAB for calculation and solution, and the coefficients and exponentials of the empirical formula for milling forces were obtained. The empirical formulae for the milling forces in three directions obtained by fitting are
3.2. Test Formula for Cutter-Chip Contact Area
In the process of cutting titanium alloy with a micro-textured ball-end milling cutter, the milling force is distributed unevenly along the length and width of the cutter-chip contact, and the cutter-chip contact area directly affects the stress density function of the cutter surface. With the change of cutting parameters and texture density in the cutter-chip compact contact area, the cutter-chip contact area also changes. Therefore, it is necessary to solve the experimental formula of the cutter-chip contact area to determine the force density function of the variable density micro-textured ball-end milling cutter when milling titanium alloy. The experimental data of tool-chip contact length lf and width lw were fitted and calculated by using MATLAB software. The relationships between lf and feed per tooth fz, as well as lw and cutting depth ap were linear functions. Taking a micro-textured cutter with a texture density of 0.09–0.09–0.09 as an example, the obtained linear functions are
Substituting Equation (10) into Equation (9), the milling forces for milling a titanium alloy using a micro-textured ball-end milling cutter with a texture density of 0.09–0.09–0.09 are
3.3. Establishment of Force Density Function for Variable Density Micro-Textured Cutter
When micro-textured ball-end milling cutter cuts titanium alloy, the instantaneous milling forces in the three directions vary with time in the cutter-chip contact area, and the distributions along the cutter-chip contact length and width are uneven. Therefore, the second-order mixed partial derivative of the instantaneous milling force model was used to solve the force density function of the micro-textured ball-end milling cutter, and the instantaneous cutting force variation at a point on the cutter can be obtained by solving the force density function. By calculating the second-order mixed partial derivative of Equation (11), the force density functions of a micro-textured cutter with a texture density combination of 0.09–0.09–0.09 in the coordinate system of the machine tool can be obtained as follows:
where , and .
The force density functions above of the micro-textured ball-end milling cutter are solved in the coordinate system of the machine tool. However, the magnitude and direction of the instantaneous cutting force of the micro-textured ball-end milling cutter change with the rotation of the cutter from cutting in to cutting out the workpiece. The schematic diagram of the cutter from cutting in to cutting out the workpiece is shown in Figure 4. Setting XYZ as the workpiece coordinate system and XcYcZc as the tool coordinate system, Figure 4a shows the process from cutting in to cutting out of the micro-textured ball-end milling cutter, and Figure 4b shows the relationship between the coordinate systems of the tool and the machine tool during the cutting process of the micro-textured cutter. It can be seen from the Figure 4 that the coordinate system of the micro-textured cutter changes with time during the process of cutting from point A to point B. Therefore, it is necessary to transform the milling force in the coordinate system of the machine tool to solve the force density function in the coordinate system of the tool. According to the transformation relationship, its transformation matrix is
According to the coordinate transformation of Equation (13), the force density function of the micro-textured cutter in the coordinate system of the cutter can be obtained as follows:
where .
Similarly, the force density functions of the other eight texture density combination cutters and non-texture cutters were solved, and the force density functions are obtained as follows.
The force density functions of a micro-textured cutter with a texture density combination of 0.09–0.07–0.05 are
The force density functions of a micro-textured cutter with a texture density combination of 0.09–0.05–0.07 are
The force density functions of a micro-textured cutter with a texture density combination of 0.07–0.07–0.07 are
The force density functions of a micro-textured cutter with a texture density combination of 0.07–0.09–0.05 are
The force density functions of a micro-textured cutter with a texture density combination of 0.07–0.05–0.09 are
The force density functions of a micro-textured cutter with a texture density combination of 0.05–0.05–0.05 are
The force density functions of a micro-textured cutter with a texture density combination of 0.05–0.09–0.07 are
The force density functions of a micro-textured cutter with a texture density combination of 0.05–0.07–0.09 are
The force density functions of the non-textured cutters are
4. Stress Field Simulation of Variable Density Micro-Textured Ball-End Milling Cutter
4.1. Establishing the Tool Model
Due to the limitation of conditions, it is impossible to measure the instantaneous stress field of the cutter in real time by an experimental method. Therefore, in this paper, the finite element simulation method was used to study the distribution of the stress field of the cutter during the titanium alloy cutting process. The instantaneous change of the stress field at any point on the cutting tool was obtained by finite element simulation, which provided basic data for further optimizing the parameter design of the micro-textures. First, the cutter was modeled by SolidWorks, a micro-textured cutter with a texture density combination of 0.09–0.09–0.09 was taken as an example, and the model of the cutter is shown in Figure 5. The tool diameter is 20 mm and the micro-texture is placed in the cutter-chip compact contact area. The shape of the micro-texture is micro-pits with a diameter of 50 μm and a depth of 35 μm, and the distance from the cutting edge is 120 μm. The micro-textures are uniformly distributed, and the center distance between adjacent textures is 150 μm. The material parameters of the cutter are shown in Table 6.
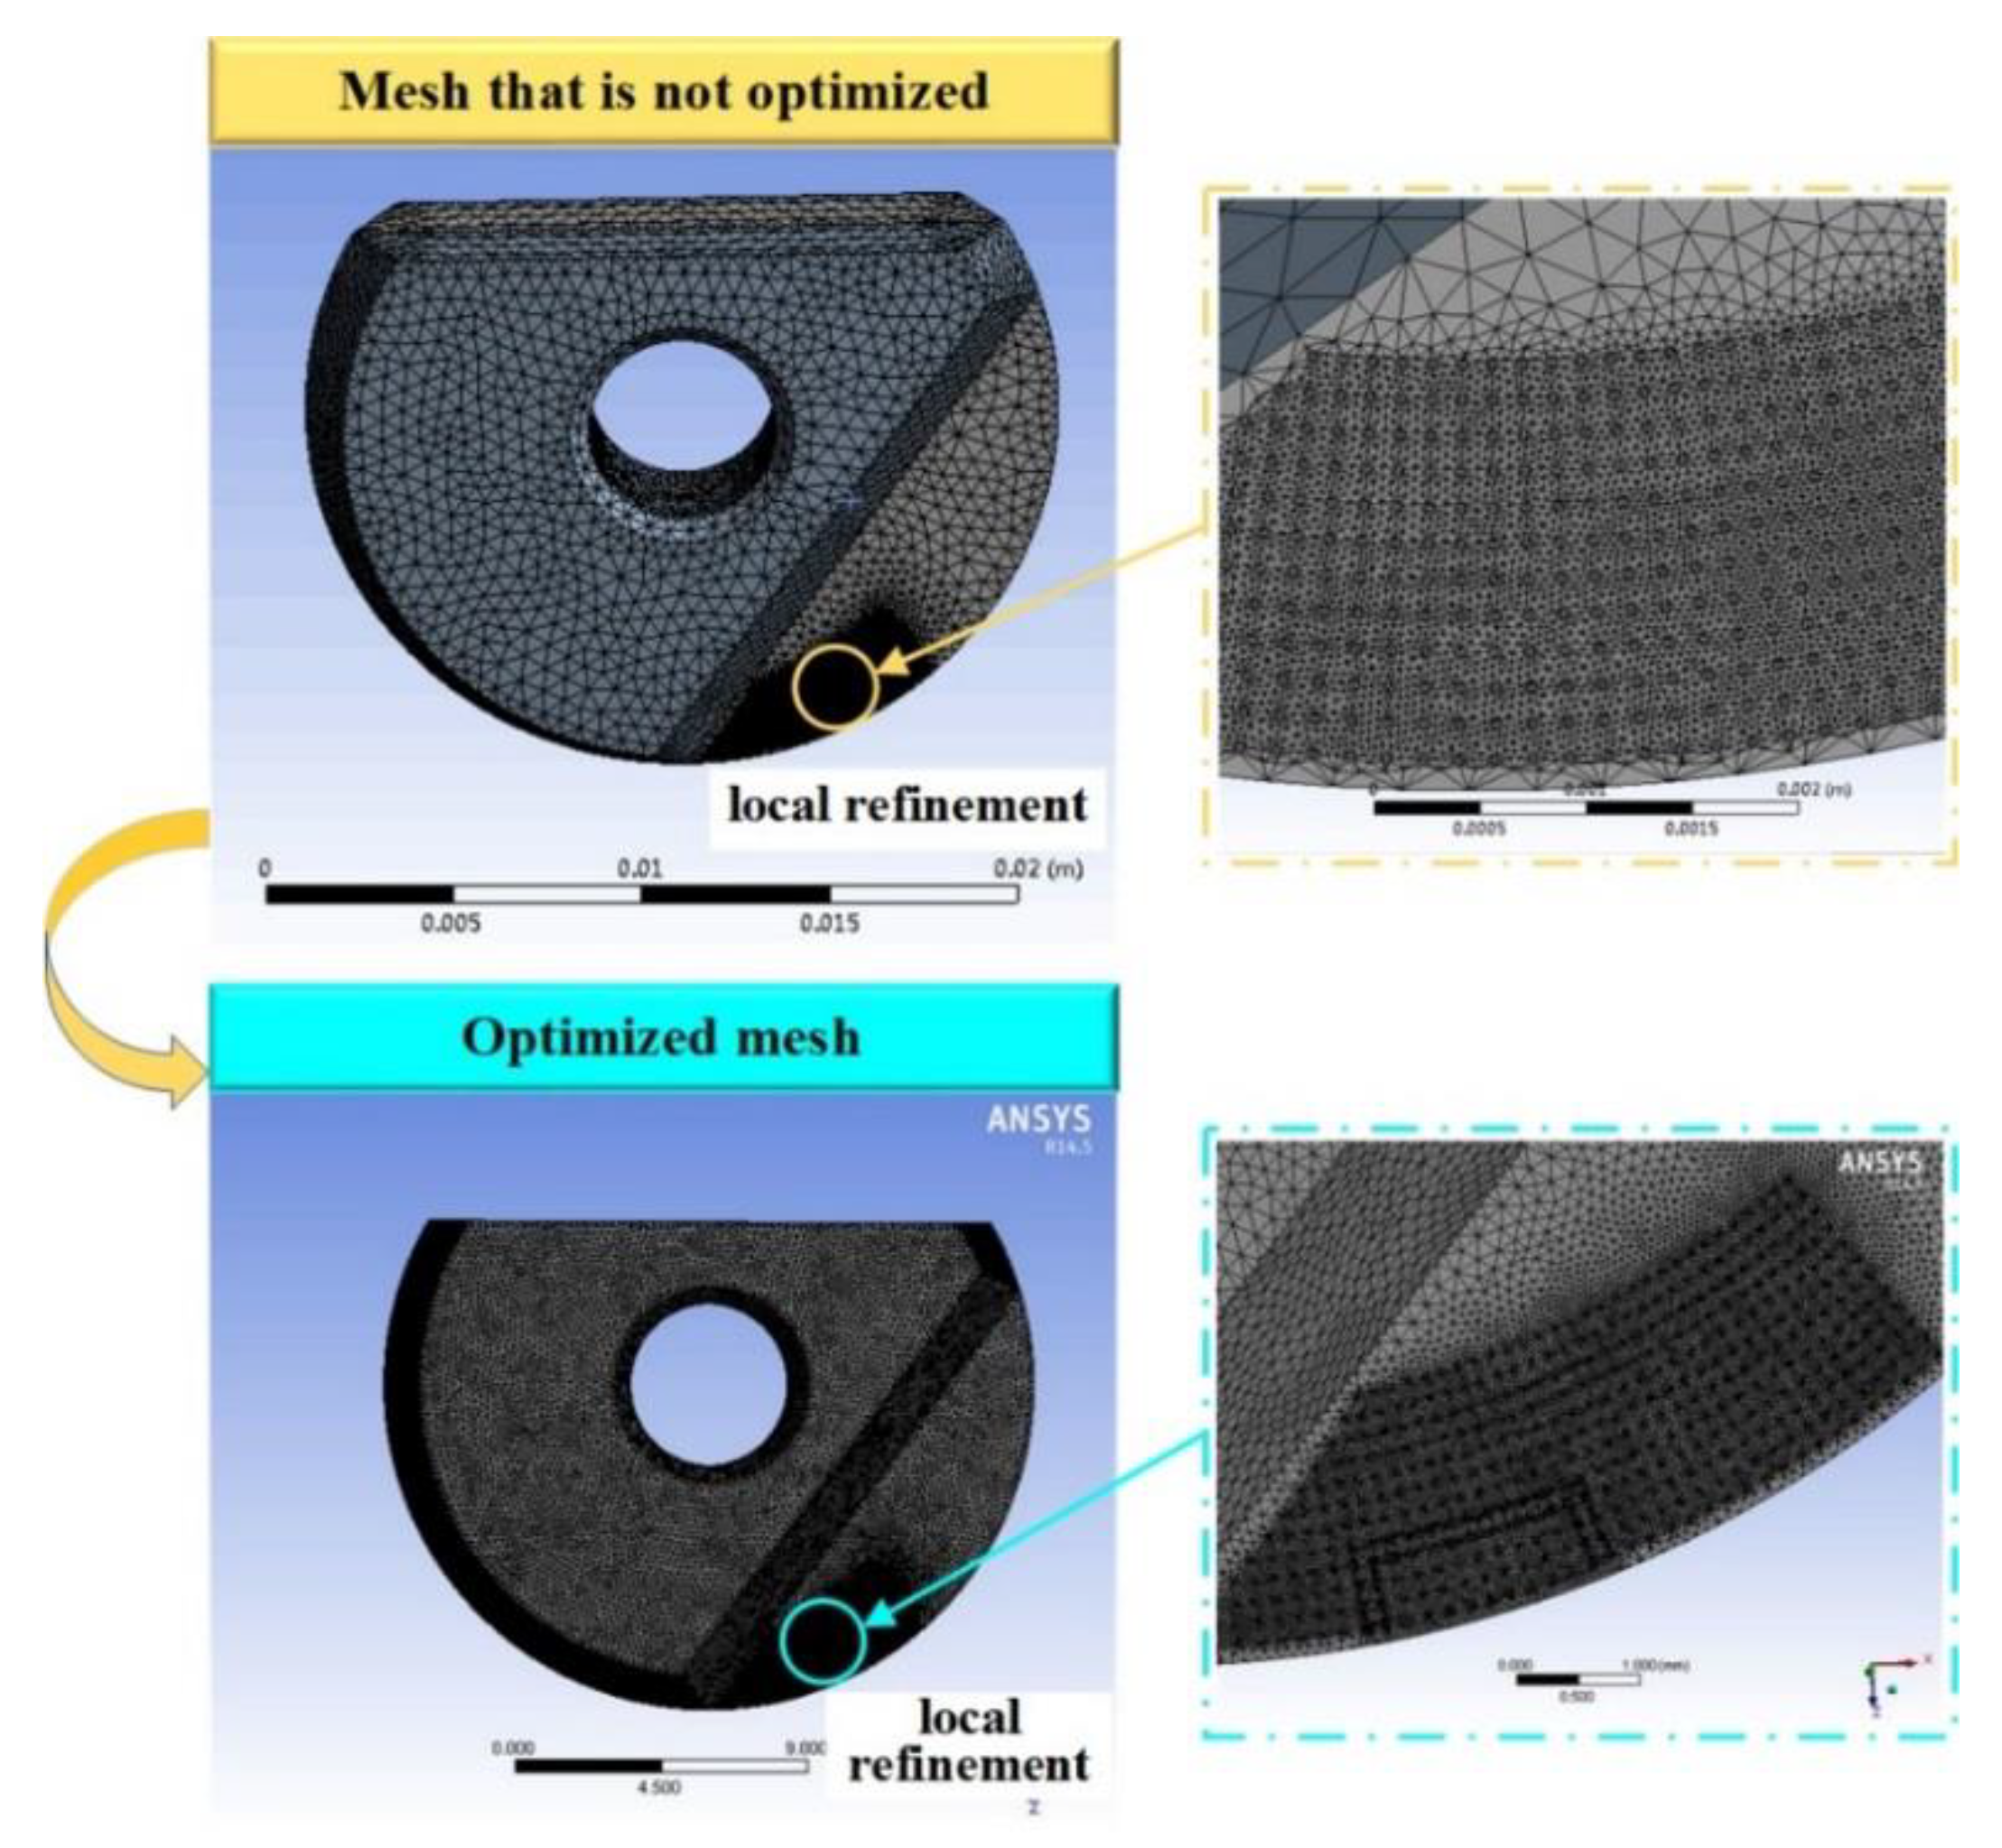
ANSYS Workbench 16.0 software (ANSYS company, Canonsburg, PA, USA) was used to simulate and analyze the instantaneous stress field of the cutter. A force distribution simulation of the micro-textured ball-end milling cutter was carried out, following the steps of inputting model, defining material attributes, partitioning meshes, defining boundary conditions, solving the problem, and analyzing images. Meshing is very important, and the quality of meshing directly determines the accuracy of simulation results. Therefore, it is necessary to refine the grids of the cutter-chip contact area. Mesh optimization was performed using the ICEM CFD module in the ANSYS Workbench. Tetrahedral mesh is suitable for fast and efficient meshing of complex models, which is realized through automatic mesh generation. Therefore, tetrahedral mesh was used in the mesh model. There are 931,230 nodes in total and the minimum edge length is 2.5 × 10⁻⁸ m. The meshing of the cutting tool is shown in Figure 6. The fewer the optimized mesh nodes, the accurate and faster the calculation. It turns out that the force distribution for the simulated micro-textured ball-end milling cutter is very close to the force distribution in actual machining.
4.2. Setting Boundary Conditions
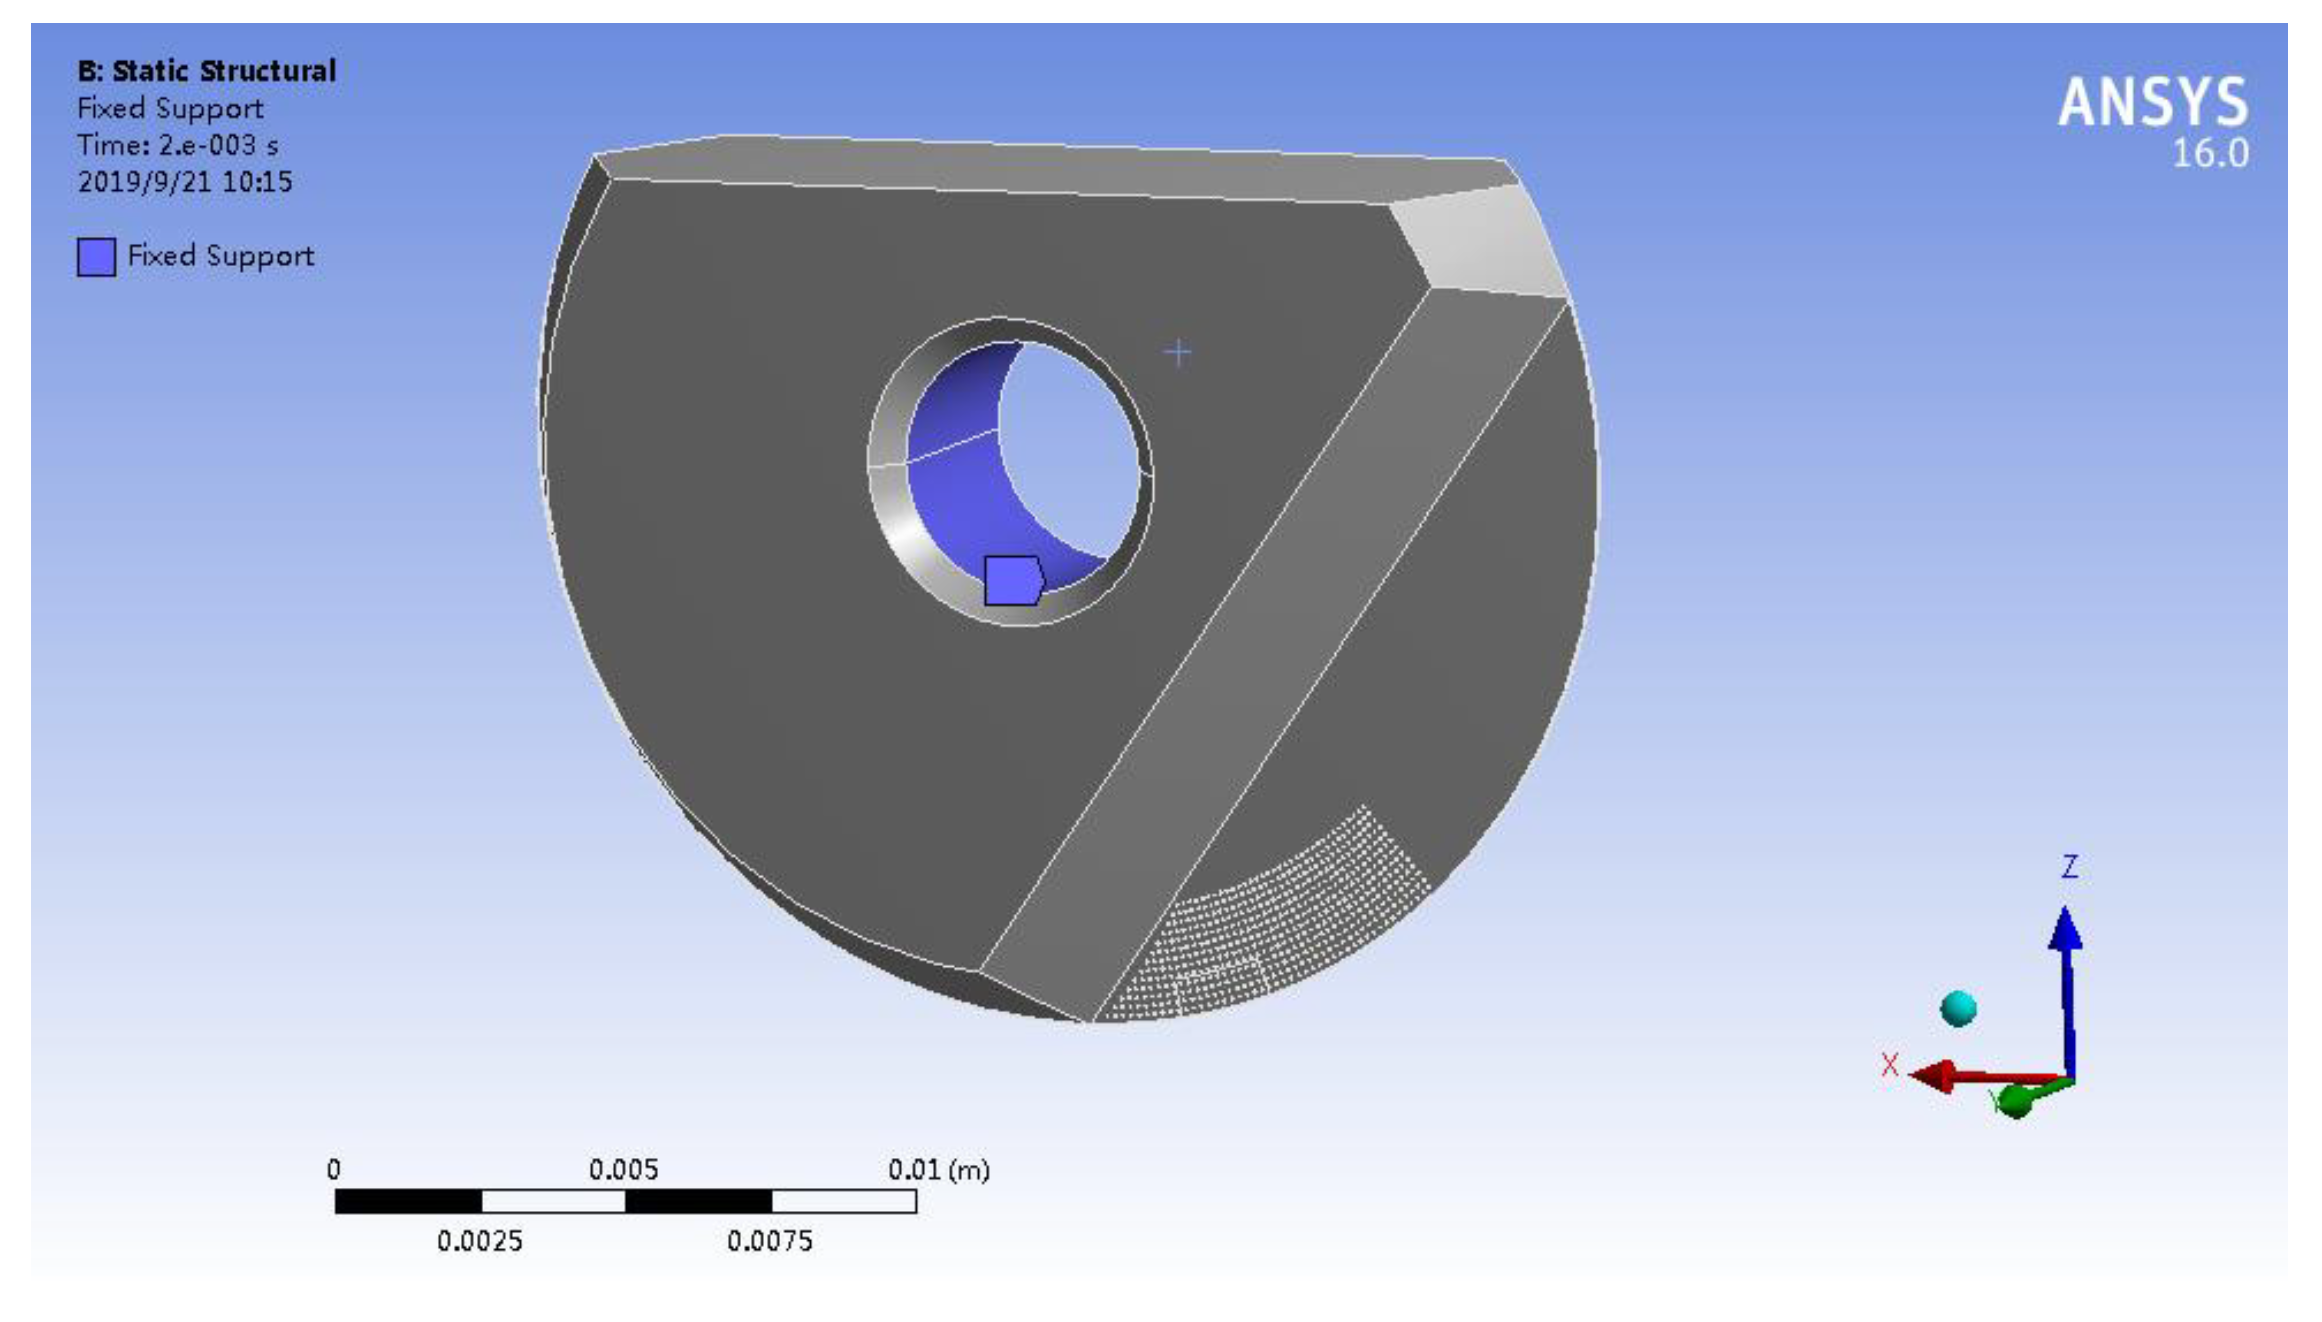
Boundary conditions and loads should be set on the model of the cutter before performing a finite element simulation. In the actual machining process, the cutter was fixed to the cutter arbor by screw, which limited the axial and radial translation of the cutter, and then the cutter arbor rotated with the spindle. Therefore, in the finite element model, the screw hole of the cutter was set to a fixed constraints to restrict the translational movement of the cutter in the axial and radial directions, as shown in Figure 7. During the cutting process, the cutting force on the cutter is mainly caused by the squeeze between the cutter and the workpiece and the friction between the front face of the cutter and the chip, and the cutting force is equivalent to a surface load on the cutter-chip contact area of the rake face of the cutter. However, the distributions of milling forces along the length and width of the cutter-chip contact area are uneven, which is a function of time. Therefore, the force density function of the cutter calculated in the previous section was applied as a load to the cutter-chip contact area of the cutter.
4.3. Analysis of the Simulation Results
After setting the boundary conditions and loads, the stress field of the micro-textured ball-end milling cutter was simulated by finite element method. When the micro-textured ball-end milling cutter just cut into the workpiece as the initial time, the time to cut out the workpiece was 0.0036 s. Through simulation analysis, it can be concluded that the stress field of the micro-textured ball-end milling cutter reached the maximum value when the workpiece was in 0.002 s. The simulation results are shown in Table 7. From the simulation plots of the equivalent stress and equivalent displacement, it can be seen that a stress concentration occurred in the contact area between the cutter and the chip on the rake face of the non-textured cutter during the finishing process of titanium alloy. The reason is that, during the finishing process of titanium alloy, the plastic deformation of the workpiece causes the extrusion of the cutter and the workpiece in the cutter-chip contact area, thereby changing the metallographic structure of the cutter-chip contact area and leading to the occurrence of stress concentration. During the titanium alloy cutting process, the force and deformation of the micro-textured cutter are more uniform than those of the non-textured cutter, and the stress concentration is less. The maximum deformation zone and the maximum stress value of the micro-textured cutter are smaller than those of the non-textured cutting cutter. The simulation results fully show that the micro-textures play a role in reducing friction and wear on the rake face of the cutter.
As shown in Figure 8, during the process of cutting titanium alloy, Origin software 2017 (Originlab, Northampton, MA, USA) was used to plot and analyze the relationship between the equivalent stress and the equivalent displacement of the variable density micro-textured cutters and the non-texture cutter. It can be seen from Figure 8 that, when the workpiece is cut in 0.002 s, the equivalent stress and the equivalent displacement of the variable density micro-textured cutters and the non-textured cutter reach the maximum value. The instantaneous stress and deformation in the non-textured cutter during the process of cutting titanium alloy are greater than those in the variable density micro-textured cutter. Due to the change of the texture density in the cutter-chip close contact area, the “secondary cutting” phenomenon of the micro-textured cutter during the process of cutting titanium alloys is effectively reduced. It can be seen from the simulation results that the micro-textured cutter can not only reduce friction and wear, but also improve the stress distribution of the cutter. By changing the distribution density of the texture on the cutter, the “secondary cutting” phenomenon during the process of micro-textured cutter milling titanium alloy can be effectively reduced.
5. Optimization of Variable Density Distribution of Micro-Textured Cutter
Through the simulation of the stress field in milling titanium alloy with variable density micro-textured ball-end milling cutter, it is concluded that the instantaneous stress field and the maximum stress value of the cutter are directly affected by the different texture distribution densities on the rake face of the cutter. Therefore, it is necessary to establish the relationship between the different distribution densities of the micro-textures and the instantaneous stress field of the cutter, so as to optimize the texture density in the cutter-chip compact contact area and to obtain the best combination of texture distribution density, which provides a new concept for the design of micro-textured cutter.
In this paper, a genetic algorithm was used to optimize the variable density distribution of micro-textured cutter. The instantaneous stress field of the cutter was taken as the optimization objective and the texture density X1 in the first area, X2 in the second area, and X3 in the third area of the cutter-chip compact contact area were taken as the optimization variables. When the genetic algorithm was adopted for optimization, the objective function should be established first. In this paper, the instantaneous stress field of a micro-textured cutter with a variable density was taken as the optimization objective, so a prediction model of the instantaneous stress field of the cutter was established as the objective function of the optimization model. The mathematical model was used to establish the instantaneous stress model of the variable density micro-textured cutter with respect to the variables X1, X2 and X3:
where C denotes the correlation coefficient of the prediction model and α1, α2, and α3 denote the undetermined indices of the related independent variables.
The logarithm of the two sides of the Equation (25) is
If y = lgσ, α0 = lgC, x1 = lgX1, x2 = lgX2, x3 = lgX3, Equation (26) is transformed into a linear equation as follows:
According to Equation (27) and the stress field simulation data of the variable density micro-textured ball-end milling cutter, a multiple linear regression equation was established by the least-square method:
where εi denotes a random error.
The stress field simulation data of the variable density micro-textured ball-end milling cutter was substituted into Equation (28). Then, MATLAB R2017b software was used to regress the experimental data through multiple linear regression, and the prediction model of the instantaneous stress field of the variable density micro-textured ball-end milling cutter was obtained as follows:
During the process of finishing titanium alloy with the micro-textured ball-end milling cutter, the instantaneous stress field of the micro-textured cutter is affected by the texture density distribution in the first, second and third regions where the cutter and chip are in close contact under the same cutting parameters. Therefore, in order to optimize the variable density distribution of the micro-textured cutters based on the stress field, the constraints are that the texture density of all three regions where the cutter and chip are in close contact as 0.01 < Xi < 0.1 (i = 1, 2, 3).
Taking the instantaneous stress field of the micro-textured cutter as the evaluation standard and the above constraints as the boundary conditions, the genetic algorithm was used to optimize the variable density distribution of the micro-textured cutters. In order to ensure the accuracy of the optimization results, when the variable density distribution of the micro-textured cutters is optimized by the genetic algorithm, optimization parameters should be set in the genetic algorithm toolbox. The population size set in this paper is 300, the crossover probability is 0.95, and the mutation probability is 0.01. Finally, the genetic algorithm toolbox was used to solve the optimization model. The optimization results of the genetic algorithm are shown in Figure 9. The optimal solution of the variable density distribution of the micro-textured cutter in the cutter-chip compact contact area was obtained through the optimization solution. The texture distribution density X1 in the first region, X2 in the second region, and X3 in the third region are 0.0905, 0.0712, and 0.0493, respectively.
6. Conclusions
Aiming at the problem of “secondary cutting” during the process of finishing titanium alloy by the micro-textured ball-end milling cutter, in this article, the mechanism of friction reduction and wear resistance of micro-textured cutters were studied in detail. By changing the distribution density of the micro-texture on the cutter, the dynamic characteristics of the instantaneous stress field during the process of milling titanium alloy by the micro-textured cutter were studied, and the following conclusions were drawn:
(1) Through milling titanium alloy experiments, the milling force models and the cutter-chip contact area mathematical models of cutters with different micro-textured densities and non-texture were established. By solving the milling force model and the experimental formula of cutter-chip contact area, the force density functions of the cutters with the different micro-texture densities and non-texture were obtained. It provides a theoretical basis for studying the stress field of the variable density micro-textured cutters.
(2) The instantaneous stress fields of different density textured cutters and non-textured cutters during the process of milling titanium alloy were simulated. The simulation results show that, during the process of milling titanium alloy, stress concentration will occur in the cutter-chip contact area of the rake face of the non-textured cutters. The force and deformation of the micro-textured cutters are more uniform than those of the non-textured cutters, and there is less stress concentration, and the maximum deformation area and maximum stress value of the micro-textured cutters are smaller than those of the non-textured cutters.
(3) Taking the instantaneous stress field as the objective function, the genetic algorithm was used to optimize the variable density distribution of the micro-textured cutters, and the optimal solution of the variable density distribution of the micro-textured cutters in the cutter-chip compact contact area was obtained. The texture distribution density X1 in the first region, X2 in the second region, and X3 in the third region are 0.0905, 0.0712 and 0.0493, respectively.
Author Contributions
M.Z. and S.Y. conceived and designed the experiments. M.Z. and S.Y. analyzed the data and carried out finite element simulation analysis. C.H. performed the experiments and wrote the paper. All authors have read and agreed to the published version of the manuscript.
Funding
This research was funded by [The National Natural Science Foundation of China] grant number [51875144]. And the APC was funded by [The National Natural Science Foundation of China and Construction of scientific research collaborative innovation platform-Advanced manufacturing intelligent technology].
Conflicts of Interest
The authors declare no conflict of interest.
References
- Arulkirubakaran, D.; Senthilkumar, V. Performance of TiN and TiAlN coated micro-grooved tools during machining of Ti-6Al-4V alloy. Int. J. Refract. Met. Hard Mater. 2016, 62, 47–57. [Google Scholar] [CrossRef]
- Durairaj, S.; Guo, J.; Aramcharoen, A.; Castagne, S. An experimental study into the effect of micro-textures on the performance of cutting tool. Int. J. Adv. Manuf. Technol. 2018, 98, 1011–1030. [Google Scholar] [CrossRef]
- Pratap, A.; Patra, K. Effects of electric discharge dressing parameters on polycrystalline diamond micro-tool surface topography and their micro-grinding performances. Int. J. Refract. Met. Hard Mater. 2019, 82, 297–309. [Google Scholar] [CrossRef]
- Cheng, Y.; Li, Z. Physics fields analysis of milling insert with 3D complex groove based on density functions. Tool Technol. 2008, 42, 48–52. [Google Scholar]
- Li, Z.J.; Cheng, Y.N.; Tan, G.Y.; Wang, Y.B.; Rong, Y.M. Study on the adhering disrepair and groove optimization of cutting tools for difficult-to-machine materials. Key Eng. Mater. 2006, 315–316, 715–719. [Google Scholar] [CrossRef]
- Fan, N. Analysis of cutting stress-fields of functionally gradient ceramic tools by FEM. Tool Technol. 1999, 4, 4. [Google Scholar]
- Xu, W.; Yuan, J.; Yin, Z.; Chen, M.; Wang, Z. Effect of metal phases on microstructure and mechanical properties of Si3N4-based ceramic tool materials by microwave sintering. Ceram. Int. 2018, 44, 19872–19878. [Google Scholar] [CrossRef]
- Li, Y.; Li, H. Finite element analysis of cutting stress field of functionally gradient ceramic tool. Equip. Manuf. Technol. 2018, 288, 69–72. [Google Scholar]
- Zhang, H.; Zhao, J.; Wang, F.; Zhao, J.; Li, A. Cutting forces and tool failure in high-speed milling of titanium alloy TC21 with coated carbide tools. Proc. Inst. Mech. Eng. Part B J. Eng. Manuf. 2015, 229, 20–27. [Google Scholar] [CrossRef]
- Kim, H.S.; Ehmann, K.F. A cutting force model for face milling operations. Int. J. Mach. Tool Manuf. 1993, 33, 651–673. [Google Scholar] [CrossRef]
- Wertheim, R.; Satran, A.; Ber, A. Modifications of the cutting edge geometry and chip formation in milling. CIRP Ann. Manuf. Technol. 1994, 43, 63–68. [Google Scholar] [CrossRef]
- Li, G.; Qu, D.; Feng, W.W.; Wang, B.; Li, N. Modeling and experimental study on the force of micro-milling titanium alloy based on tool runout. Int. J. Adv. Manuf. Technol. 2016, 87, 1193–1202. [Google Scholar] [CrossRef]
- Oliaei SN, B.; Karpat, Y. Built-up edge effects on process outputs of titanium alloy micro milling. Precis. Eng. J. Int. Soc. Precis. Eng. Nanotechnol. 2017, 49, 305–315. [Google Scholar] [CrossRef] [Green Version]
- Zhang, R. Study on Force Density Function and Stress Field for Milling Insert with 3D Complex Groove; Harbin University of Science and Technology: Harbin, China, 2004. [Google Scholar]
- Zhang, R.; Zheng, M.; Li, Z. Study on the force density function of the flat front face milling insert. J. Harbin Univ. Sci. Technol. 2004, 9, 7–10. [Google Scholar]
- Sun, J.; Zhou, Y.; Deng, J.; Zhao, J. Effect of hybrid texture combining micro-pits and micro-grooves on cutting performance of WC/Co-based tools. Int. J. Adv. Manuf. Technol. 2016, 86, 3383–3394. [Google Scholar] [CrossRef]
- Orra, K.; Choudhury, S.K. Tribological aspects of various geometrically shaped micro-textures on cutting insert to improve tool life in hard turning process. J. Manuf. Process. 2018, 31, 502–513. [Google Scholar] [CrossRef]
- Wu, Z.; Deng, J.; Su, C.; Luo, C.; Xia, D. Performance of the micro-texture self-lubricating and pulsating heat pipe self-cooling tools in dry cutting process. Int. J. Refract. Met. Hard Mater. 2014, 45, 238–248. [Google Scholar] [CrossRef]
- Wei, Y.; Kim, M.-R.; Lee, D.W.; Park, C.; Park, S.S. Effects of micro textured sapphire tool regarding cutting forces in turning operations. Int. J. Precis. Eng. Manuf. Green Technol. 2017, 4, 141–147. [Google Scholar] [CrossRef]
- Pang, M.; Nie, Y.; Ma, L. Effect of symmetrical conical micro-grooved texture on tool–chip friction property of WC-TiC/Co cemented carbide tools. Int. J. Adv. Manuf. Technol. 2018, 99, 737–746. [Google Scholar] [CrossRef]
- Lin, B.; Wang, L.; Guo, Y.; Yao, J. Modeling of cutting forces in end milling based on oblique cutting analysis. Int. J. Adv. Manuf. Technol. 2016, 84, 727–736. [Google Scholar] [CrossRef]
- Li, Q.; Yang, S.; Zhang, Y.; Zhou, Y.; Cui, J. Evaluation of the machinability of titanium alloy using a micro-textured ball end milling cutter. Int. J. Adv. Manuf. Technol. 2018, 98, 2083–2092. [Google Scholar] [CrossRef]
- Darshan, C.; Jain, S.; Dogra, M.; Gupta, M.K.; Mia, M. Machinability improvement in Inconel-718 by enhanced tribological and thermal environment using textured tool. J. Therm. Anal. Calorim. 2019, 138, 273–285. [Google Scholar] [CrossRef]
- Darshan, C.; Jain, S.; Dogra, M.; Gupta, M.K.; Mia, M.; Haque, R. Influence of dry and solid lubricant-assisted MQL cooling conditions on the machinability of Inconel 718 alloy with textured tool. Int. J. Adv. Manuf. Technol. 2019, 105, 1835–1849. [Google Scholar] [CrossRef]
- Yang, S.; He, C.; Zheng, M.; Wan, Q.; Zhang, Y. Study on the influence of meso-geometrical features on milling force in precision machining of titanium alloy. Mach. Sci. Technol. 2018, 22, 742–765. [Google Scholar] [CrossRef]
- Singh, R.; Dureja, J.S.; Dogra, M.; Gupta, M.K.; Mia, M. Influence of graphene-enriched nanofluids and textured tool on machining behavior of Ti-6Al-4V alloy. Int. J. Adv. Manuf. Technol. 2019, 105, 1685–1697. [Google Scholar] [CrossRef]
- Sugihara, T.; Enomoto, T. Development of a cutting tool with a nano/micro-textured surface—Improvement of anti-adhesive effect by considering the texture patterns. Precis. Eng. J. Int. Soc. Precis. Eng. Nanotechnol. 2009, 33, 425–429. [Google Scholar] [CrossRef]
- Yang, S.; Wang, Z.; Zhang, Y.; Wan, Q.; Cui, X.; Xie, Y. Finite element simulation for machining titanium alloy with micro-texture ball-end milling cutter. J. Shenyang Univ. Technol. 2015, 37, 530–535. [Google Scholar]
- Zhang, Z.; Lu, W.; He, Y.; Zhou, G. Research on optimal laser texture parameters about antifriction characteristics of cemented carbide surface. Int. J. Refract. Met. Hard Mater. 2019, 82, 287–296. [Google Scholar] [CrossRef]
- Tong, X.; Yang, S.; Liu, X. Friction, wear, and fatigue analysis for micro-textured cemented carbide. Proc. Inst. Mech. Eng. Part C J. Mech. Eng. Sci. 2019, 223, 5989–6004. [Google Scholar] [CrossRef]
- Yang, S.; He, C.; Zheng, M. A prediction model for titanium alloy surface roughness when milling with micro-textured ball-end cutters at different workpiece inclination angles. Int. J. Adv. Manuf. Technol. 2018, 23, 688–711. [Google Scholar]
- Wei, Z.C.; Guo, M.L.; Wang, M.J.; Li, S.Q.; Wang, J. Prediction of cutting force for ball end mill in sculptured surface based on analytic model of CWE and ICCE. Mach. Sci. Technol. 2019, 23, 688–711. [Google Scholar] [CrossRef]
- Du, J.; Yue, C.; Liu, X.; Liang, S.Y.; Wang, L.; Gao, H.; Li, H. Transient temperature field model of wear land on the flank of end mills: A focus on time-varying heat intensity and time-varying heat distribution ratio. Appl. Sci. 2019, 9, 1698. [Google Scholar] [CrossRef] [Green Version]
Figure 1.
Diagram of “secondary cutting” for the micro-textured cutter.

Figure 2.
Region segmentation of cutter-chip compact contact area of micro-textured cutter.

Figure 3.
Test platform for milling titanium alloy with micro-textured cutter.

Figure 4.
The schematic diagram of rotation period and coordinate system conversion diagram of micro-textured cutter. (a) the process from cutting in to cutting out of the micro-textured ball-end milling cutter; (b) the relationship between the coordinate systems of the cutter and coordinate system of the machine tool.

Figure 5.
The blade model.

Figure 6.
Mesh partition of the cutter.

Figure 7.
Boundary conditions of the simulation model.

Figure 8.
The curve of stress field and deformation of variable density micro-textured cutter with respect to time. (a) equivalent stress changes with time; (b) equivalent displacement varies with time.
Figure 8.
The curve of stress field and deformation of variable density micro-textured cutter with respect to time. (a) equivalent stress changes with time; (b) equivalent displacement varies with time.

Figure 9.
Optimization results of the genetic algorithm.


Table 1.
Distribution and combination of different density textures.
| Distribution of Micro-Texture | Arrangement and Combination of Micro-Texture |
|---|---|
| Uniform distribution | 0.05-0.05-0.05, 0.07-0.07-0.07, 0.09–0.09–0.09 |
| Variable density distribution | 0.05-0.07-0.09, 0.05-0.09-0.07, 0.07-0.05-0.09, 0.07-0.09-0.05, 0.09-0.07-0.05, 0.09-0.07-0.05. |
Table 2.
Cutting parameters for cutting titanium alloys.
| Factor | Cutting Speed vc (m/min) | Cutting Depth ap (mm) | Feed per Tooth fz (mm/z) | |
|---|---|---|---|---|
| Level | ||||
| 1 | 120 | 0.3 | 0.04 | |
| 2 | 140 | 0.5 | 0.06 | |
| 3 | 160 | 0.7 | 0.08 | |
| 4 | 180 | 0.9 | 0.10 | |
Table 3.
Variation of milling force with time for micro-textured cutter.
| Milling Force in the Three Directions | A Milling Cycle (s) | ||||||||
|---|---|---|---|---|---|---|---|---|---|
| 0.0004 | 0.0008 | 0.0012 | 0.0016 | 0.002 | 0.0024 | 0.0028 | 0.0032 | 0.0036 | |
| X(N) | 3.15 | 50.46 | 122.33 | 235.85 | 305.37 | 226.94 | 78.26 | 9.34 | 0 |
| Y(N) | −14.92 | −77.98 | −156.15 | −220.8 | −284.28 | −229.1 | −156.22 | −12.44 | 0 |
| Z(N) | 17.87 | 65.51 | 103.94 | 136.53 | 147.88 | 126.03 | 79.28 | 10.63 | 0 |
Table 4.
0.09–0.09–0.09 contact length and width of micro-textured cutter.
| Cutting Parameters | Cutting Depth ap (mm) | Feed per Tooth fz (mm) | Cutter-Chip Contact Width lw (mm) | Cutter-Chip Contact Length lf (mm) | |
|---|---|---|---|---|---|
| Number | |||||
| 1 | 0.3 | 0.04 | 0.768 | 0.5302 | |
| 2 | 0.3 | 0.06 | 0.775 | 0.5613 | |
| 3 | 0.3 | 0.08 | 0.784 | 0.5888 | |
| 4 | 0.3 | 0.1 | 0.788 | 0.6031 | |
| 5 | 0.5 | 0.06 | 1.017 | 0.5691 | |
| 6 | 0.5 | 0.04 | 1.008 | 0.5405 | |
| 7 | 0.5 | 0.1 | 1.029 | 0.6124 | |
| 8 | 0.5 | 0.08 | 1.021 | 0.5911 | |
| 9 | 0.7 | 0.08 | 1.318 | 0.5928 | |
| 10 | 0.7 | 0.1 | 1.327 | 0.6103 | |
| 11 | 0.7 | 0.04 | 1.326 | 0.5445 | |
| 12 | 0.7 | 0.06 | 1.315 | 0.5968 | |
| 13 | 0.9 | 0.1 | 1.658 | 0.6179 | |
| 14 | 0.9 | 0.08 | 1.651 | 0.5946 | |
| 15 | 0.9 | 0.06 | 1.636 | 0.5675 | |
| 16 | 0.9 | 0.04 | 1.628 | 0.5494 | |
Table 5.
Test data and calculation results of milling force of micro-textured cutter.
| Number | ap (mm) | fz (mm/z) | Fx (N) | Fy (N) | Fz (N) | Lg(Fx) | lg(Fy) | lg(Fz) | lg(ap) | lg(fz) |
|---|---|---|---|---|---|---|---|---|---|---|
| 1 | 0.3 | 0.04 | 146.61 | 121.23 | 73.22 | 2.17 | 2.08 | 1.86 | −0.52 | −1.4 |
| 2 | 0.3 | 0.06 | 208.35 | 134.99 | 96.28 | 2.32 | 2.13 | 1.98 | −0.52 | −1.22 |
| 3 | 0.3 | 0.08 | 205.80 | 143.05 | 80.48 | 2.31 | 2.16 | 1.91 | −0.52 | −1.1 |
| 4 | 0.3 | 0.1 | 226.13 | 177.86 | 88.71 | 2.35 | 2.25 | 1.95 | −0.52 | −1 |
| 5 | 0.5 | 0.06 | 214.47 | 197.65 | 102.15 | 2.33 | 2.30 | 2.01 | −0.3 | −1.22 |
| 6 | 0.5 | 0.04 | 230.43 | 227.16 | 139.25 | 2.36 | 2.36 | 2.14 | −0.3 | −1.4 |
| 7 | 0.5 | 0.1 | 416.26 | 389.46 | 135.73 | 2.62 | 2.59 | 2.13 | −0.3 | −1 |
| 8 | 0.5 | 0.08 | 222.35 | 216.19 | 99.25 | 2.35 | 2.33 | 2.00 | −0.3 | −1.1 |
| 9 | 0.7 | 0.08 | 305.37 | 284.28 | 147.88 | 2.48 | 2.45 | 2.17 | −0.15 | −1.1 |
| 10 | 0.7 | 0.1 | 408.36 | 296.41 | 162.39 | 2.61 | 2.47 | 2.21 | −0.15 | −1 |
| 11 | 0.7 | 0.04 | 238.45 | 208.29 | 110.56 | 2.38 | 2.32 | 2.04 | −0.15 | −1.4 |
| 12 | 0.7 | 0.06 | 348.95 | 315.82 | 164.58 | 2.54 | 2.50 | 2.22 | −0.15 | −1.22 |
| 13 | 0.9 | 0.1 | 355.73 | 333.41 | 196.27 | 2.55 | 2.52 | 2.29 | −0.05 | −1 |
| 14 | 0.9 | 0.08 | 328.63 | 304.18 | 200.08 | 2.52 | 2.48 | 2.30 | −0.05 | −1.1 |
| 15 | 0.9 | 0.06 | 293.05 | 302.13 | 178.88 | 2.47 | 2.48 | 2.25 | −0.05 | −1.22 |
| 16 | 0.9 | 0.04 | 280.62 | 293.06 | 152.83 | 2.45 | 2.47 | 2.18 | −0.05 | −1.4 |
Table 6.
Constitutive parameters of the tool materials [33].
Table 6.
Constitutive parameters of the tool materials [33].
| Density kg/m3 | Thermal Conductivity (W/(m·C)) | Coefficient of Thermal Expansion α (×10−6 C−1) | Modulus of Elasticity E (Gpa) | Poisson Ratio | Specific Heat Capacity C (J/(kg·C)) | Melting Point (°C) | Boiling Point (°C) |
|---|---|---|---|---|---|---|---|
| 14,700 | 75.4 | 4.5 | 540 | 0.3 | 470 | 2780 | 6000 |
Table 7.
Simulation results of stress field.
| Combination of Texture Density | Equivalent Stress | Equivalent Displacement |
|---|---|---|
| 0.05-0.05-0.05 | Maximum value: 3.9444 × 10⁹ | Maximum value: 4.1231 × 10⁻⁶ |
 |  | |
| 0.05-0.07-0.09 | Maximum value: 2.6527 × 10⁹ | Maximum value: 3.887 × 10⁻⁶ |
 |  | |
| 0.05-0.09-0.07 | Maximum value: 3.6813 × 10⁹ | Maximum value: 4.0945 × 10⁻⁶ |
 |  | |
| 0.07-0.07-0.07 | Maximum value: 2.849 × 10⁹ | Maximum value: 3.5375 × 10⁻⁶ |
 |  | |
| 0.07-0.05-0.09 | Maximum value: 2.7749 × 10⁹ | Maximum value: 3.9043 × 10⁻⁶ |
 |  | |
| 0.07-0.09-0.05 | Maximum value: 2.6155 × 10⁹ | Maximum value: 3.7479 × 10⁻⁶ |
 |  | |
| 0.09–0.09–0.09 | Maximum value: 2.1418 × 10⁹ | Maximum value: 2.891 × 10⁻⁶ |
 |  | |
| 0.09-0.05-0.07 | Maximum value: 2.0607 × 10⁹ | Maximum value: 3.0588 × 10⁻⁶ |
 |  | |
| 0.09-0.07-0.05 | Maximum value: 1.7714 × 10⁹ | Maximum value: 2.7058 × 10⁻⁶ |
 |  | |
| Non-textured cutter | Maximum value: 6.14 × 10⁹ | Maximum value: 4.2764 × 10⁻⁶ |
 |  |
© 2020 by the authors. Licensee MDPI, Basel, Switzerland. This article is an open access article distributed under the terms and conditions of the Creative Commons Attribution (CC BY) license (http://creativecommons.org/licenses/by/4.0/).
Share and Cite
MDPI and ACS Style
Zheng, M.; He, C.; Yang, S. Optimization of Texture Density Distribution of Carbide Alloy Micro-Textured Ball-End Milling Cutter Based on Stress Field. Appl. Sci. 2020, 10, 818. https://doi.org/10.3390/app10030818
AMA Style
Zheng M, He C, Yang S. Optimization of Texture Density Distribution of Carbide Alloy Micro-Textured Ball-End Milling Cutter Based on Stress Field. Applied Sciences. 2020; 10(3):818. https://doi.org/10.3390/app10030818
Chicago/Turabian StyleZheng, Minli, Chunsheng He, and Shucai Yang. 2020. "Optimization of Texture Density Distribution of Carbide Alloy Micro-Textured Ball-End Milling Cutter Based on Stress Field" Applied Sciences 10, no. 3: 818. https://doi.org/10.3390/app10030818
Note that from the first issue of 2016, this journal uses article numbers instead of page numbers. See further details here.