1. Introduction
The world leaders of 193 countries committed to end poverty, and fight against climate change and injustice in the world at the UN summit in New York in September 2015. As part of the Agenda 2030 [
1], 17 Sustainable Development Goals (SDGs) were adopted, which represent the new standard for the development of all people in the world. To achieve the defined objectives, it is necessary to deal with the issue of the reduction of natural disasters which have a negative impact on people’s lives. Apart from these impacts on human health and life, natural disasters also have additional consequences such as physical damage to the property of citizens, economic loss [
2,
3] and significant damage to the environment [
4]. In December 1999 was created The United Nations Office for Disaster Risk Reduction (UNDRR) and it supports the implementation of the Sendai Framework for Disaster Risk Reduction 2015–2030 [
5]. Attention should also be paid to the correct assessment of the level of risk, especially in urban and industrial zones with the attention of possibilities cascading events triggered by natural disasters [
6] and also take account of the effects of spatial planning [
7,
8].
According to the United Nations International Strategy for Disaster Reduction (UNISDR) report, over the last 20 years [
9] almost 90% of natural disasters were caused by floods, storms, and other weather-related disasters. Weather-related disasters, particularly floods and storms (hurricanes, cyclones, tornadoes), show an increasing trend. In the United States, the economic losses caused by floods are estimated at billions of dollars in 2016 [
10]. In the period 2000–2012, flood damage and costs associated with floods (flood prevention and rescue work) reached the amount of €961,000,000 [
11].
According to data in the Emergency Events Database (EM-DAT database) [
12], the occurrence of natural disasters in Europe also shows an increasing trend. The occurrence of 1744 natural disasters was registered in Europe between 1902, and 1980, and a similar number again from 1980 to date.
Regarding the occurrence of natural disasters, floods can be included among the most frequently occurring phenomena. According to report UNDRR and the Centre for Research on the Epidemiology of disasters between 1995 and 2015 the most frequently occurring natural disaster was flooded (43%) [
9]. They are a cyclically recurring problem in many cases. Climate change is often considered to be one of the reasons for the increased occurrence of floods in Europe in recent decades, and in the foreseeable future as well [
13,
14,
15,
16]. The cause of floods is a complicated process and a complex of several factors, including both natural and human activities [
17]. One of the main causes of locally flooding are also immediately or intensively rainfall. As a rapid source of runoff can be served too by small ungauged watersheds and therefore is need to be know their characteristic [
18].
Overview of Spatial Data Quality Aspects
To assess the probability of floods and the subsequent solution of the situation in the decision-making process, it is necessary to have data, especially spatial data which meet the imposed requirements with their quality [
19]. Many studies are focused on the methodology for processing raw data [
20], quality control and new data sources (LiDAR, Airborne SAR, ENVISAT ASAT) [
21,
22,
23]. Modern measuring techniques and processing procedures in the field of 3D spatial information have been used by many authors as effective tools to accurately define and location more accurately objects with spatial aspects [
24,
25]. Moreover, three-dimensional spatial models of the flood are widely used in flood risk mapping [
26]. Spatial data are immediate bearers of descriptive and geographical information, thus creating an inseparable part of all the procedures concerning protection of the environment and human lives against the impact of floods.
Knowledge of the input data quality is a necessary element assessing the accuracy and reliability obtained from flood event modeling [
27,
28]. The quality of spatial data in water management practice can be evaluated using the following parameters:
position accuracy, attribute and logical correctness, completeness, and
traceability of spatial data, which are linked on spatial accuracy in general [
29].
Docan [
30] focuses on the aspects of spatial data quality entering the GIS (Geographical Information Systems) in accordance with ISO (International Organization for Standardization) [
31]. With regard to the tasks it performs, the Environmental Agency of the Republic of Slovenia [
32] has developed its own spatial data quality control system in accordance with the terms of valid standards. In Henriksson and Kauppinen [
33], different perspectives on spatial data quality assessment are defined.
In their study, Schmidt and Mičietová [
34] focus on the methodology for assessing the quality of digital elevation models (DEM) in accordance with the Infrastructure for Spatial Information in the European Community (INSPIRE).
One basis for assessing the quality level of spatial data is ISO 19157:2013, as presented in several scientific contributions. These standards define the basic concepts and their sub-elements (
Figure 1).
The subject of crisis solution management in the field of flood risk management (or other natural disasters) remains a priority for local self-governing bodies, water management frameworks and some other relevant government bodies (e.g., ministries). The relevant government bodies emphasize the creation of quality map documents providing the spatial localization of flood risks within the current trend to localize flood endangered-regions [
35].
Water management practice in Slovakia applies hydrodynamic modeling for dealing with multiple tasks, for example, the production of territorial planning documentation, preparation of water management plans, enacting legislation and creating laws, executive regulations, and standards, to name a few of the most important. According to Gergeľová, et al. [
36], hydrodynamic modeling becomes a tool for gaining information (spatial and descriptive) concerning water performance in flood management of watercourses and adjacent areas.
As Sayers, et al. [
37] reported in their work, special attention must be given to the spatial interactivity of river systems, which can also be presented through the creation of system models. This proposal is also linked to the notion of the need to know the geometry and ways of obtaining spatial data for flood modeling. Without input data (spatial or non-spatial), the implementation of calculations and other analyses in the field of flood modeling would be limited [
38].
At the national level in the conditions of the Slovak Republic the Spatial Data Registry (
https://rpi.gov.sk/en), operates, which contains the created Database of Spatial Data on Topography, also available through the map services of the National Geoportal (
http://geoportal.gov.sk/sk/map) Last but not least the Database on Flood Situation is available through the Slovak Water Management Company (
https://mpompr.svp.sk/) portal.
Bearing in mind the complexity of the flood scenario modeling solution at the national level, there is a persistent lack of data with high resolution. This situation threatens the entire modeling process [
39].
Flood modeling involving the collection of topographic data with high resolution currently depends on LiDAR technology [
40,
41].
Currently a comprehensive database of LiDAR data is not available for the territory of Slovakia. The main providers of LiDAR data include national authorities such as the National Forest Centre (
http://www.nlcsk.org/) and the Geodetic and Cartographic Institute (
http://www.gku.sk/gku/) and also several commercial companies. For this reason, other available technological solutions are also applied for data collection (e.g., ground survey).
Even though several innovative approaches to collecting topographical and hydrological data are available, some confusion and uncertainties exist which, according to José-Luis Molina, et al. [
38] have an influence on the quality of hydraulic/hydrodynamic analyses, and according to Cook [
40] and Merwade [
42] also on hydrodynamic modeling, as well as on modeling the extent of flood inundation [
43,
44]. The qualitative level of topographical parameters derived from Digital Terrain Model (DTM)/DEM and subsequently entered into hydrodynamic models results in the associated uncertainties of these models (DEM), as confirmed in the work of S. P. Wechsler [
45] and M. Podhorányi [
46]. In connection with the examining of uncertainties in topographic data and their impact on the modeling of flood scenarios in built-up areas, is in work Willis et al. [
47] an important aspect of model selection and its parameters specific to the problem and input data.
The current opportunities for water management practice available in spatial data collection for flood modeling are applied in our study for data collection using the Global Navigation Satellite System (GNSS) technology [
48]. Cook [
40] further claims that the geometric description has a direct effect on the hydraulic model (cross-sections and the topography in the model through elevations).
The current opportunities for water management practice available in spatial data collection for flood modeling are applied in our study for data collection using the GNSS technology.
The above overview of information related to the flood scenario modeling process could not be fully implemented without the application of GIS. Wechsler [
45] shows that GIS significantly supports hydrodynamic modeling by presenting topographic features of the observed phenomenon. GIS is not only a flexible system for flood modeling, collecting different types of spatial and structured data, but also a supporting tool in various decision-making processes [
49,
50]. This support is also evident in the observation of spatio-temporal changes in flood events [
51].
The contribution by Dottori, et al. [
52] points out the possibility of creating false confidence from the results obtained from the modeling process as a result of the use of high-resolution data, especially among the non-expert public. They therefore recommend paying particular attention to explaining the problems and uncertainties to the public.
2. Materials and Methods
This study contains the assessment of selected qualitative sub-elements and their parameters entering the process of hydrodynamic modeling of flood scenarios. HEC–RAS (U.S. Army Corps of Engineers (USACE
https://www.hec.usace.army.mil/software/hec-ras/default.aspx) and ArcGIS Desktop (ESRI
https://www.esri.com/en-us/arcgis/products/arcgis-desktop/overview) with HEC-GeoRAS extension were chosen for processing. ArcMap with using the HEC-GeoRAS toolbar processed the input data and prepared layers for importing into HEC–RAS to creating a hydrodynamic model [
36]. The processed results will provide a general overview of the impact of topography, geometry on hydrodynamic modeling the flood scenario modeling process. In this study, we focus on the qualitative evaluation of spatial data entering the hydrodynamic modeling process based on selected sub-elements.
Modeling is an efficient and effective tool for creating possible flood scenarios. The modeling process itself is influenced by the input data, both in terms of accuracy and reliability. The Jung and Merwade [
53] study deals with the uncertainties of the input data of the HEC–RAS model.
2.1. Study Area
The river Torysa flowing through the residential area of the city of Prešov is part of the Hornád river basin (
Figure 2).
The area of the Hornád river sub-basin covers 4414 km
2 and is in the territory of three self-governing regions (Košice, Prešov, and Banská Bystrica regions). The Torysa river flows through the second-largest city in the basin-Prešov with a population of 91,782 (last population census as of 31 May 2011). The population density in the city of Prešov is 1303.06 inhabitants.km
−2 (Development Program of the City of Prešov 2015–2020 with a view to 2025
https://www.presov.sk/download_file_f.php?id=734266).
The area is in the flat or slightly rugged country of the Torysa flood plain, at an altitude of 231–275 m above sea level, composed of Quaternary, Neogene, and Paleogene sediments. The Quaternary is represented by fluvial sediments in the entire area of interest. It is dominated by gravel sediments, with the nature of alluvial sands and grits with a covering of clays and sandy loams. The Quaternary has a thickness of 5.0–8.0 m, in the valley part and 2.0–4.7 m at the terraced level [
54]. The chosen location lies within the moderately warm climate zone T–1, which is characterized by long, warm, and dry summers, very short transition periods with warm to moderately warm springs and autumns, and moderately cold and dry to very dry winters with a short period of snow cover (50–80 d). The number of frost days per year is 120–130 [
55]. The average annual air temperature is in the range of 8–9 °C (Climate atlas of Slovakia). The hydrological balance of the Hornád river basin (the territory of Slovakia) differs little from the values in the Danube administrative area. The average runoff in the sub-basin (period 1961–2000) is 210 mm and the average rainfall reached 701 mm (Management plan for the Hornád river sub-basin
http://www.vuvh.sk/rsv2/default.aspx?pn=PMPV2Hornad).
In July 2004, the eastern part of Slovakia was affected by extensive floods, which also affected the partial catchment of the Hornád river, which includes the Torysa river. The flood had a limited area and short time duration and by its manifestation, it ranked among extraordinary statistical significance. The total rainfall at the Prešov climatic station was 195.6 mm in this period (26 July 2004–1 August 2004) and reached N = 1.087% compared to normal. In the catchment areas of Torysa and Sekčov, peaks corresponding to a 2–10-year flow were achieved. At the Prešov (Torysa) water meter station on 30 July 2004, the peak reached 407 cm, Q = 140·m
3·s
−1, which represents a 10-year flow rate (SHMI, Floods in Eastern Slovakia in July 2004
http://www.shmu.sk/File/HIPS/Povodnova%20%20situacia%20na%20vychode%20v%20juli%20%202004.pdf).
The area affected by flooding due to extreme long-lasting rainfall hitting large areas of Slovakia was examined in 2010.
The share of the Hornád river sub-basin in the declared levels of flood activity in 2010 was 17.51%, ranking it second behind the Bodrog river sub-basin with 28.09%.
In Slovakia, the first half of the hydrological year 2010 was very humid. The precipitation abnormal autumn and winter months of 2009, during which more significant precipitation conditions occurred in several regions of Slovakia, followed by the normal precipitation in March 2010, followed by the above-normal April and the extraordinary above-normal May 2010. Monthly total precipitation in May 2010 was extremely abnormal in most Slovakia.
Intensive all-over rainfall, which occurred in the territory of Slovakia in the first decade of May was caused by a large cyclonic failure, originally a frontal wave associated with a significant frontal system that advanced across the territory of Slovakia from southwest to northeast. In May 2010, Slovakia experienced historical extreme precipitation, which is also confirmed by the fact that almost 400 rainfall measuring stations exceeded the existing records of monthly precipitation totals in May. The floods that occurred in Slovakia in May and June 2010 were from a hydrological point of view, exceptional for their temporal and spatial distribution. In early June 2010, extreme rainfall hit the water-saturated Basin of Torysa and caused floods with 50–100-year significance.
Levels and flows of watercourses are monitored by hydrometric monitoring stations. Only one station is in the selected area. Its basic characteristics are described in
Table 1.
2.2. Main Channel and Surrounding Topography Data
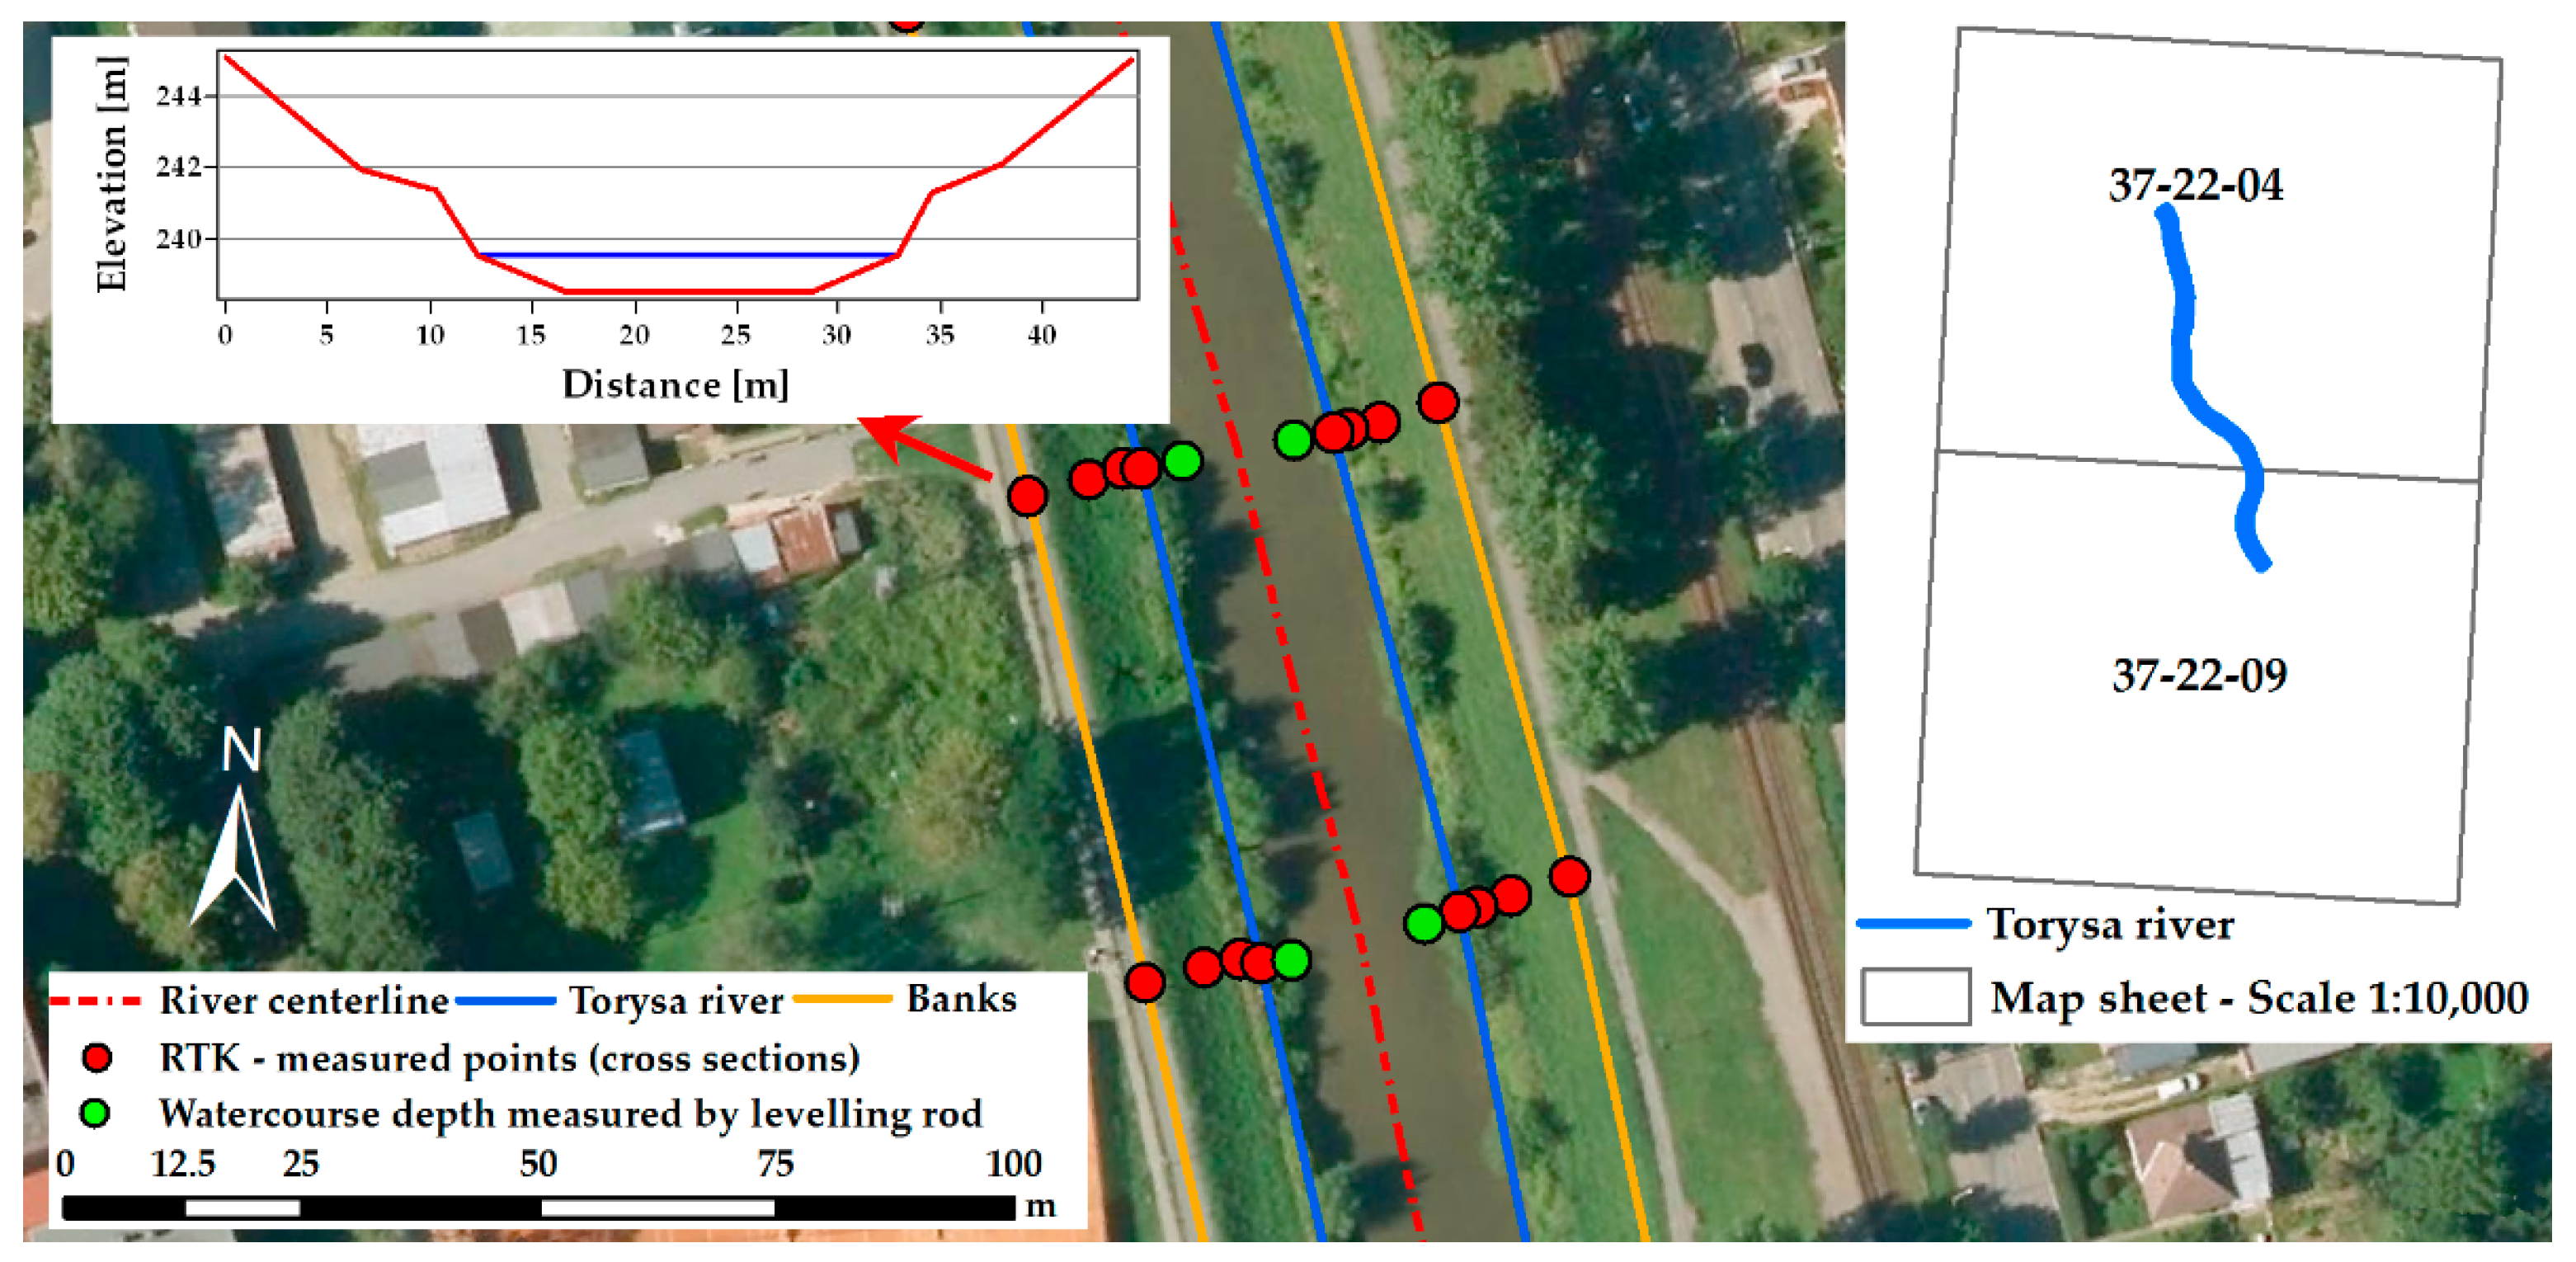
The broken terrain of the assessed area and geometry of objects required the application of multiple processing procedures and methods in the process of data quality assessment. Determination of the degree of detail of the assessed area was specified with an adequate number of measured detail survey points. The density of their arrangement was adapted to the nature and morphometric characteristics of the terrain. For visible terrain changes, a procedure with denser arrangement of the measured detail survey points was chosen. A Leica GPS900CS rover was configured in the field following the Slovak real-time positioning service (SRTPS) service provider’s recommendations (max Position Dilution of Precision (PDOP) = 3, elevation mask 15°, horizontal accuracy < 0.02 m, height accuracy < 0.4 m, one fixed position). The assessed area located within a residential area of the city of Prešov extended between river km points 57 and 61 (
Figure 2). The quality of processing of the geodetic survey and passportization depends on the accuracy of the spatial information obtained, and the choice of surveying procedures and methods. Surveying data is in the national coordinate system: Datum of Uniform Trigonometric Cadastral Network (D-UTCN) and in the national elevation system: Baltic Vertical Datum—After Adjustment. Subsequently, the resulting set of spatial information was used for the preparation of comprehensive documentation relating to the processing of cross-sections and longitudinal profiles. In the monitored area, 516 terrain points were observed. Of consideration the large-scale of the study area at least (3500 m × 50 m), the overview of real-time kinematic (RTK) points on the case study show following
Figure 3.
By using the selected category of software tools, it was possible to present the obtained results through a selected graphical interface (Computer-aided design CAD system). In terms of quality assessment of the spatial information, it is necessary to consider the method used for determining the position of each point in space and the character of the point’s category. This regards points with important common integrity for the needs of using this file in the process of hydrodynamic modeling. The whole survey was carried out using the GNSS technology with the support of the SRTPS guaranteed by the state, using the kinematic method of measurement in real time (RTK). For RTK measurements in SRTPS (a network of permanent stations in the Slovak Republic), the operator of this service guarantees point accuracy of 2–4 cm. For the needs of further assessment, an illustrative list of coordinates of measured points is given in
Table 2.
According to the standard of quality assessment of the accuracy achieved in the file of information obtained, it was necessary also to consider the spatial error of point determination in 3D, which results directly from GNSS measurements (with respect to the use of that method). Based on the following (1), the expected and the real spatial error of determination of a point’s position in space was compared.
where:
m3D—spatial accuracy of determination of the point’s position,
mx, my—accuracy of determination of the point’s position in the direction of x and y axes,
mh—accuracy of determination of the point’s height.
The examined statistical set consists of 516 detailed points (
Figure 4), in which 3D coordinates were measured by the RTK kinematic method and their standard deviation m
3D was determined by the relation (1). The m
3D at any observed point did not exceed value 4 cm, which is guaranteed in Slovakia by the SRTPS. Nevertheless, the file was examined for outliers. The null hypothesis “All data values come from the same normal population”, against the alternative hypothesis that “The largest data value is an outlier” was examined by the Grubb’s test. The test result showed that there is no outlier at the 5% level of significance.
As is obvious from
Figure 5 and also from the cumulative distribution (
Figure 6), there is a certain degree of asymmetry of the m
3D file.
From the Anderson-Darling Normality Test (
Figure 7) at the significance level
α = 5% arise that the data do not follow a normal distribution. The m
3D values deviate considerably from the red line representing the normal distribution. This conclusion is confirmed by the fact that the
p-Value (0.005) is less than
α.
2.3. Digital Relief Model Specification
The Geodesy, Cartography, and Cadastre Authority of the Slovak Republic currently provides the digital relief model 3.5 (DMR 3.5). Unlike the DTM, which represents the course of the terrain, without objects on it, and works with all types of GeoElements such as points, lines, and polygons, the DMR is a digital representation of terrain relief, composed of data and an interpolation algorithm which allows altitudes to be derived at arbitrary points located within the modeled area. DMR 3.5 was developed from DMR 3, which was created by vectorizing topographic maps with a scale of 1:10,000 and in some small areas from maps with a scale of 1:25,000. Subsequently, a grid with technical parameters of 10 × 10 m was generated. As it turned out later, DMR 3 showed significant errors in some places, mainly in flat areas, some valleys and basins, but above all, it was not harmonized with the shape of watercourses and water areas. DMR 3.5 is based on the original DMR 3.0 model, where various types of adjustments were made, such as correction of gross errors, remodeling of areas from photogrammetrically evaluated data, or their replacement with DMR 4.0 data in selected locations. DMR 4.0 started being created by means of the photogrammetric method in 2004, but due to time-consuming and slow workflow, this task was stopped in early 2009. Various tests have shown that the differences from actual values are up to 15 m in rugged high-altitude areas, such as some parts of the High Tatras [
57]. A qualitative enhancement of flood modeling will be provided by the digital relief model DVRM 5.0 (Airborne laser scanning and DMR 5.0
https://www.geoportal.sk/sk/udaje/lls-dmr/), based on aerial laser scanning with the required density of at least five last reflection points per square meter. The required absolute accuracy of point cloud height must not exceed the mean height error of 0.15 m, and the required DMR 5.0 height accuracy in the ellipsoidal coordinate system ETRS89 must not exceed the mean height error of 0.20 m [
58]. The completion of the DMR 5.0 project is scheduled for 2022.
The process of decision-making and planning in river basin management is based on the qualitative aspect of the digital relief model. The qualitative aspect of DMR creation is specified by the degree of purpose for which the DMR is processed. The practical assessment of the DMR quality on the selected segment reach of the river Torysa, flowing through a residential area of the city of Prešov, relied on theoretical recommendations for quality assessment provided for the given type of file source with spatial information. The qualitative aspect is directly connected to the actual level of processing. The propagation of random errors and errors caused by human factor represents the first stage of assessment. This regards inaccuracies stemming from the method of obtaining spatial data selected for the creation of the DMR. The second category of inaccuracies arises from the method of representation and subsequent approximation of details (especially density of points and grid cell size). The third level of inaccuracies, which lowers the output quality of the DMR, is the method of choice (selection) of mathematical algorithms for final processing of the expected result. Applying the recommended theoretical basis of data quality assessment, as specified in the theoretical concept and background (
Figure 1), it was possible to present the following facts related to the final quality of the DMR in the process of hydrodynamic modeling, up to a detailed level. DMR quality assessment for the needs of hydrodynamic modeling is based on the following:
Integrity—comparison of the set of surveyed points (the result of the local survey) with the third-generation digital model—DMR 3.5 with a resolution 10 m. Requirements for maintaining the representation of objects have been met. The legislation is not specified.
Logical continuity/consistency—creation of the descriptive database, in which the connection between the geometry and descriptive component of each geo-object was maintained. The legislation is not specified.
Positional accuracy—is considered one of the most important indicators of spatial data quality.
The ISO 19157:2013 standard defines the absolute and relative accuracy of spatial data. Absolute positional accuracy is the mean value of positional uncertainty defined as the distance between a measured position and what is considered to be the corresponding true position [
59]. This may be assessed in terms of each dimension individually or also in combinations. It represents the evaluated absolute horizontal/vertical error in spatial data. For the process of quality evaluation of DMR, the absolute vertical error is one of the most important characteristics.
The evaluation of the vertical component of position error is performed according to the following formula for mean absolute error (MAE) Equation (2), standard deviation (SD) Equation (3), and mean error (ME): Equation (4). Through application of the referred procedure, the vertical component of position error was calculated for a certainty interval of 90%: Equation (5).
where:
dz—mean absolute error [m],
ZDMRi—value of height of the point in DMR,
ZSi—value of height in the point control measurement,
n—number of terrain points
where:
—standard deviation [m]
where:
The calculation of the relative vertical errors is not in this study applicate.
- 4.
Temporal accuracy—the temporal aspect reflects the realization of the local survey regarding the creation and updating the Fundamental Base of Geographic Data. The territory concerned lies within the area where data collection was implemented in 2008–2010, as the last stage of the local survey of the whole territory of Slovakia. The older the creation of the database, the greater should be the importance of its update. In terms of the actual time information, this condition was satisfied.
- 5.
Thematic accuracy—objects were not completely cataloged according to the catalog of object classes in the Fundamental Base of Geographic Data and catalog of the landscape, the ecological basis for integrated land management.
The next level of assessment was based on the results from the needs of DMR quality and classic surveying (GNSS-RTK) assessment supplemented with other additional quality assessments of spatial information (legislative aspects, recommendations of water management practice), which regulate the qualitative aspect of parameters of hydrodynamic modeling. More detailed of assessment approach of suitability for use geomatics methods for hydraulic analysis is introduced in Zazo, et al. [
60].
2.4. HEC–RAS Model Description
Hydrodynamic model was created in the program HEC–RAS, which is freeware. Inter alia, it allows modeling of 1D steady flow, and 1D and 2D unsteady flow calculations. It contains tools for creating own flow, bank edges, dikes, obstacles, bridges, etc. It works with the terrain model and allows for the calculation of the roughness coefficient.
HEC–RAS contains four 1D river analyses:
Steady Flow Water Surface Profiles.
Unsteady Flow Simulation.
Sediment Transport/Movable *Boundary Computation.
Water Quality Analysis.
Z3—Upstream invert elevation of the culvert
Y3—The depth of water above the upstream culvert inlet
V3—The average velocity upstream of the culvert
a3—The velocity weighting coefficient upstream of the culvert
g—The acceleration of gravity
Z2—Downstream invert elevation of the culvert
Y2—The depth of water above the downstream culvert inlet
V2—The average velocity downstream of the culvert
a2—The velocity weighting coefficient downstream of the culvert
HL—Total energy loss through the culvert
It also includes methods of calculation of flow mode, bridge hydraulics, and evaluation of profiles at the confluence of rivers.
3. Hydrodynamic/Hydraulic Modeling
To assess the quality of 3D spatial data, the 1-D hydrodynamic model HEC–RAS was directly selected. Hydrodynamic model was created with using software product HEC–RAS (version HEC–RAS 5.0.7). The hydrodynamic model was established from a set of files presenting the topographic data of the watercourse, the berm, and the zones behind the shore line, raster data presenting DMR and hydrological data presenting hydrological conditions in the given area, which were prepared in the program ArcGIS (HEC-GeoRAS extension). The process of hydrodynamic modeling demonstrates the sensitivity to input data. The entire group of spatial data entering this process affects the expected result through the standard of its qualitative level.
Interpretation of the hydraulic results is based on a geodetic survey and passportization of the watercourse, DMR, and other parameters such as surface roughness values and boundary conditions. The roughness values (Manning’s roughness) were determined according to the applicable roughness coefficients based on valid methodologies Chow [
61] and Raplík [
62]. Roughness values determined according to the characteristic parameters of the given flow: material, surface, cross-section, obstacles, vegetation, meanders were received separately for each trough profile. 1D hydrodynamic models of the steady and unsteady flow use these values to calculate the hydraulic characteristics of individual profiles [
63].
Given the fact that in the period under review (year 2010) were not directly mapped roughness, we proceeded to the modeling of constant determination of Manning’s roughness values for the trough of the watercourse, berm, and the zone behind the shore line. The roughness values for the trough were in the range (
n min = 0.03,
n normal = 0.04,
n max = 0.05), and based on the recommendations of water managers, the roughness value for the trough
n = 0.04 entered the hydrodynamic calculation. The berm and the zones behind the shore line had a roughness value of
n = 0.05 (
Figure 8). The constant selection of the roughness coefficient for all profiles also reflected the fact that the watercourse channel was under-maintained in the monitored time. The model was calibrated by adjusting the Manning Roughness coefficient based on available records of previous floods. We achieved a match of modeled and critical flow from the course of flood activity in the given territory in 2010. The model was validated based on the extent of the flood in 2010 and the extent of the inundation area according to the flood hazard maps.
The values of observed flows Q10, Q20, Q50, Q100 were determined as the result of long-term observation of the state of the stream-gauging station located within the area of interest. The values of the observed N-year levels of flows have a variable character in the modeling process. These were measured values. This data is exclusively provided by SHMI, which also guarantees their accuracy. It should be stressed that the determination of N-year flow rates in individual profiles can in many cases be a problematic aspect, mainly due to the long-term observation of these flow rates.
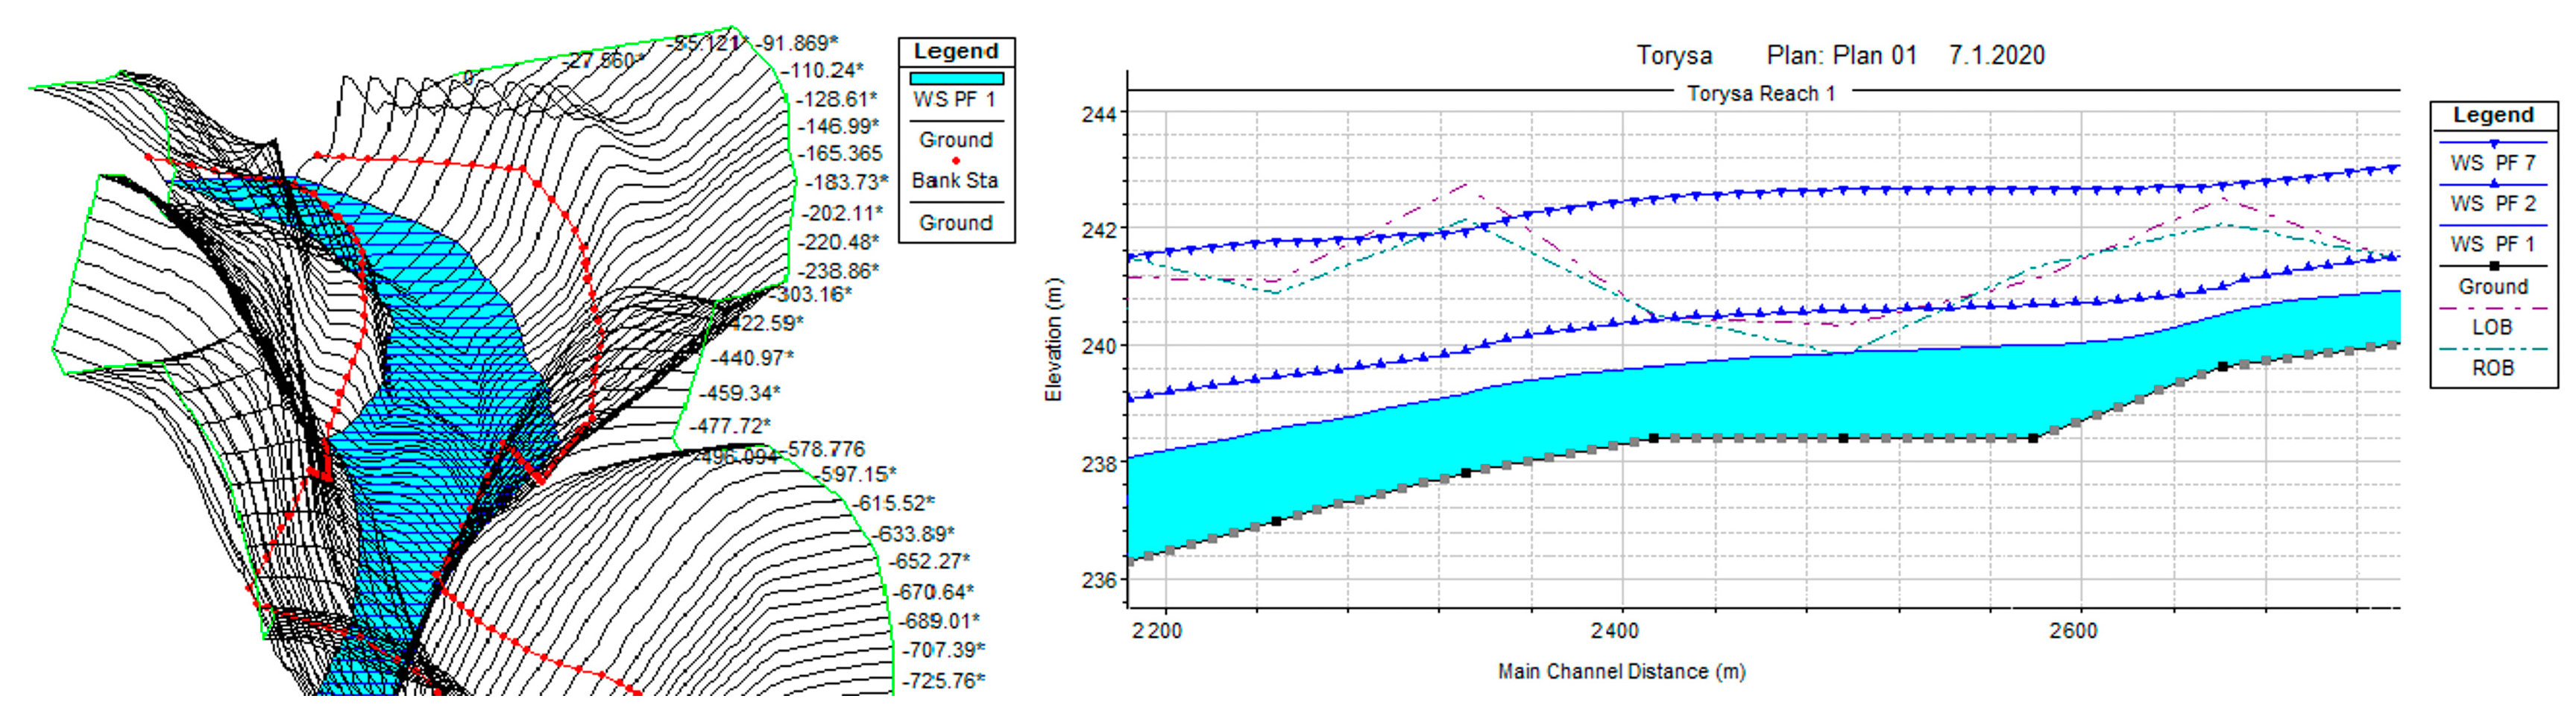
Boundary conditions describe the interaction between the simulated system and its surroundings. For our simulation steady flow data was necessary to enter conditions on the upper edge of the river network. We chose the condition normal Depht 4 × 10
−4. The process of schematization of the steady flow simulation of the Torysa river is presented in
Figure 9.
Modeled situation also required entered flow data at the upstream, on the first measured water flow profile of Torysa river (Q
1 = 54 m
3·s
−1, Q
2 = 84 m
3·s
−1, Q
3 = 129 m
3·s
−1, Q
10 = 165 m
3·s
−1, Q
20 = 195 m
3·s
−1, Q
50 = 253 m
3·s
−1, Q
100 = 300 m
3·s
−1). Next
Figure 10 shows the output from the HEC–RAS model (modeled Torysa), presented in in Ras Mapper.
By simulating the hydrodynamic model, the results were obtained, which subsequently defined the ranges of inundation areas with the respective depths (depth grids) presented in
Figure 11.
Significant elements of the hydrodynamic model have also determined maximally hydraulic depths of the water level (including bed and banks) for the individual flow rates (hQ20 = 4.883 m, hQ50 = 5.712 m, hQ100 = 6.230 m).
4. Results and Discussion
A strategic framework for integrated river basin management applies decision support tools in the form of hydrodynamic modeling, to ensure flood prevention and reduction of flood risk. The qualitative aspect of the input data shows the sensitivity of a given model to changes in the data quality condition. As a Member State of the European Union Slovakia implements directives [
64,
65] in its national legislation Act on flood protection [
66] (The Act No. 7/2010 on flood protection was updated on 1 January 2018).
The adopted legislative framework generates some flexibility for defining the parameters of spatial data quality evaluation. Spatial data providing the basis for modeling of flood incidents are most commonly obtained because of systematic collection based on recommended surveying procedures and methods. The standard of their qualitative level for water management is partly governed by the legislation. The acquisition and portrayal of geodetic data in the Datum of Uniform Trigonometric Cadastral Network and Baltic Vertical Datum—After Adjustment coordinate systems is a mandatory requirement.
The purpose and level of detail of the set of spatial information are dependent on the degree of terrain ruggedness. In this study, the detailed surveys for the needs of hydrodynamic modeling were related to the survey of all important objects along the river and in its close surroundings. All information obtained was directly connected to the appropriate river km (r. km), given in the water management map. The achieved quality of geodetic survey and passportization of all important water management objects appertaining to the watercourse and its surroundings is satisfactory for the given purpose of processing.
The presented qualitative analysis of the chosen method of data acquisition, in fact, confirmed the expected result. The presented group of deviations in the real spatial error incurred in determination of each point’s position (close to the limit value) relates to the group of points for which the sky was partly obscured during measurement, for example by surrounding vegetation (
Figure 4). The average spatial error of determination of each point’s position was calculated as 0.017 m.
The result of statistic processing (
Figure 5,
Figure 6 and
Figure 7) confirmed the expectation that the RTK measurement of the detailed points is not homogeneous in terms of accuracy. The accuracy of determining the spatial position of a point varies over time depending on the satellite distribution. This is quantified by the Position (3D) Dilution of Precision (PDOP), a satellite configuration with a smaller PDOP (2 or 3) results in a more accurate determination of the point spatial position. Accuracy in the position determination may be further reduced by shielding the signal from satellites at points near trees, buildings, or other obstacles that ultimately have a non-random character.
The results confirm that regarding the qualitative aspect, it is sufficient to carry out data acquisition of spatial information using GNSS technology using the RTK method for the needs of water management practice. For water management purposes in the Slovak Republic, the satisfactory positional and vertical accuracy of determination of each point’s position in space is guaranteed by the SRTPS service.
The usability of DMR as a basis for hydrodynamic modeling is indisputable in the next stage of assessment. DMR is an important basis for the entire modeling process. The level of its quality (accuracy of the model) is the key requirement for achieving relevant results comparable with reality. The assessment of the qualitative aspect was based on a set of recommendations arising from the technical standards for assessment of the quality of spatial information. Data integrity, logical continuity, positional, temporal, and thematic accuracy were among the assessed quality indicators.
To assess the quality of DMR 3.5 we entered 516 points from a detailed planimetric and hypsometric survey. Subsequently 23 exclusion points were identified, which characterized the bridge structures in the locality. The calculation was carried out using a set of 493 points, of which 129 points represented slope edge, 241 points characterized slope foot and 123 water.
The set of geodetic measurements included control measurements, and a set of points was created within the DMR 3.5 product with data regarding the factor of height. The basis of assessment consisted of evaluation of height differences between both products ().
Vertical accuracy of the model may be checked at every single instance of the measured set points (
Table 3). The declared accuracy of DMR 3.5 is assumed to be ±2.50 m, which demonstrates a certainty interval of 90%. The results obtained comply with the standards of accuracy set out by the Geodesy, Cartography, and Cadastre Authority of Slovak Republic, but for the process of hydrodynamic modeling DMR 3.5 is inappropriate with respect to its accuracy and also for its grid size, which does not permit detailed terrain presentation. This conclusion is also confirmed by the control measurement of points using the RTK method. The problematic aspect of DMR 3.5 is its process of generation based on background contour lines at scales of M 1:10,000 and M 1:25,000.
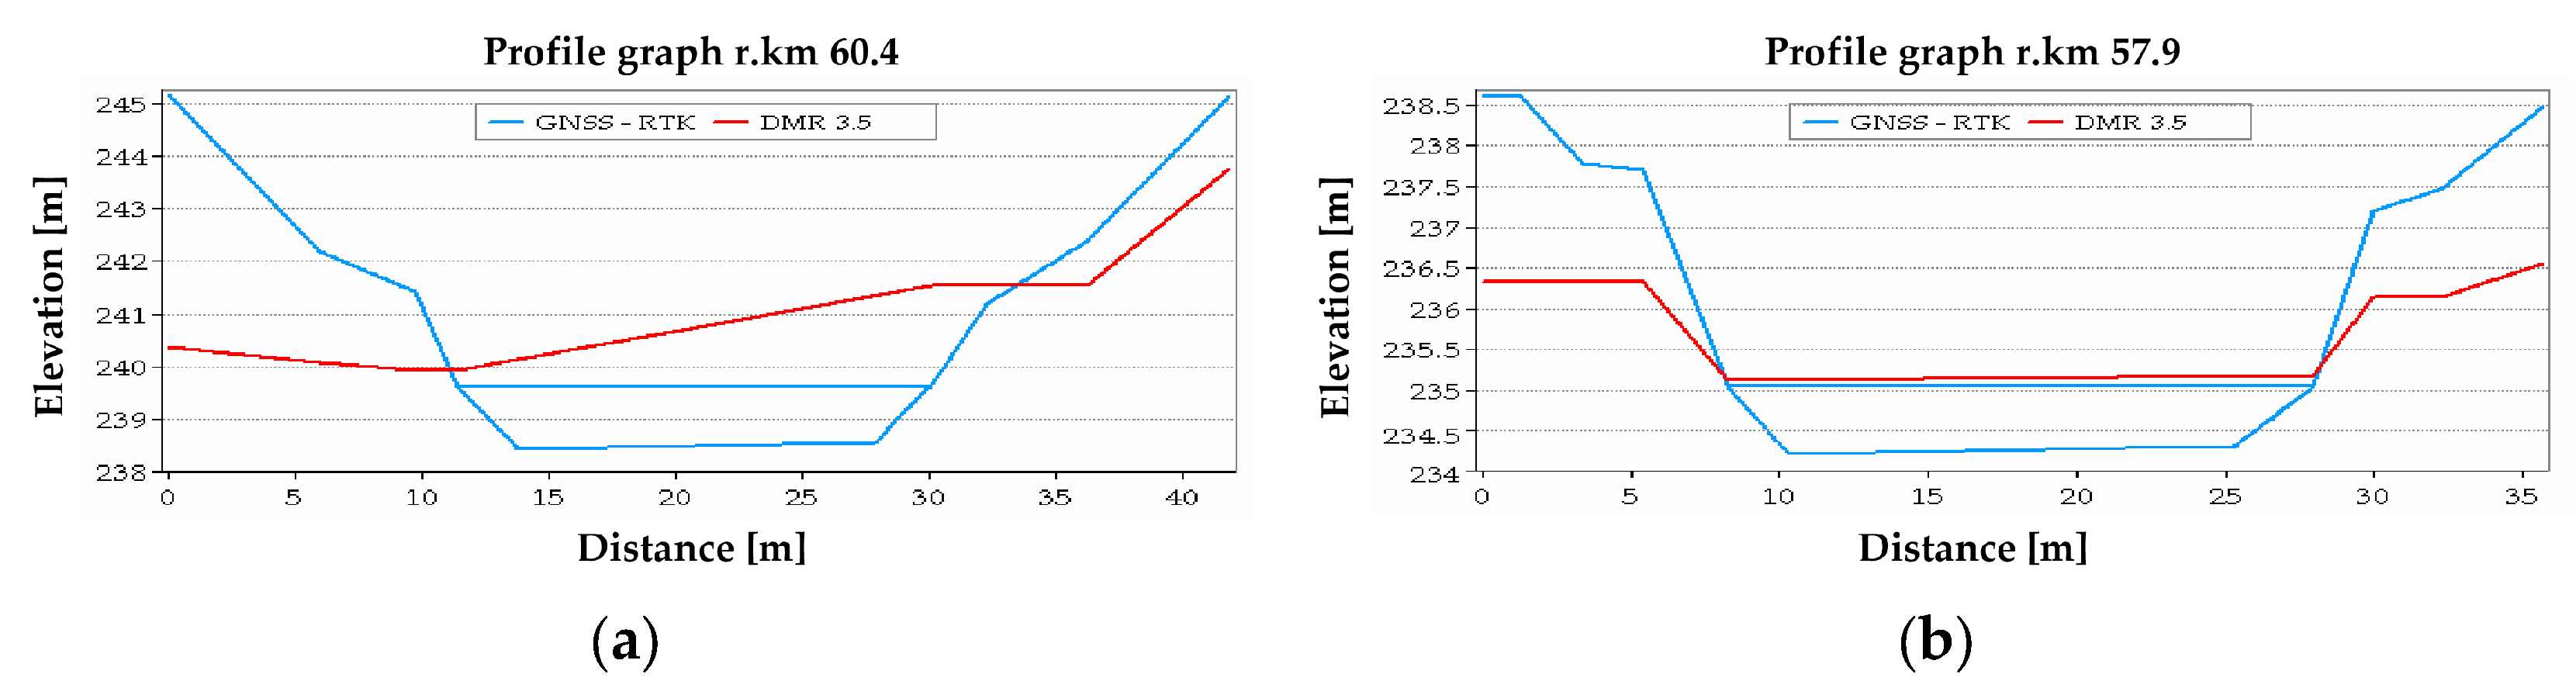
A major disadvantage is that DMR 3.5 does not define the shape of the bottom of the watercourse. The shape of the bottom and the size of the cross-section of the water environment is a necessary input to the hydrodynamic model. Its absence in hydrodynamic modeling results in incorrect interpretation of the extent of the inundation area and the depth of the modeled flood.
Comparison of DMR 3.5 and RTK measurements: maximum levels of high difference values arise surprisingly almost at the slope edge (+2.3 m), minimum levels of height difference values are predominantly on the watercourse (−0.1 m). Like [
67], we agree that a combination of several types of spatial data is needed to define the topography of a watercourse.
This is not always the case since there are significant differences in height in the watercourse (between DMR 3.5 and terrain from RTK measurement) (
Figure 12). This (DMR 3.5) is therefore not suitable for hydrodynamic modeling of flood scenarios. These lacks in terrain models are confirmed by the work of Caletka [
50].
Next
Table 4 presents an evaluation of the individual quality components of spatial data produced by means of DMR available for the territory of the Slovak Republic, supplemented with local geodetic measurements The assessment also takes into account the production of DMR 5.0, already covering a substantial part of the Slovak Republic (not included east part of Slovakia) and with the expectation of creating the final version by 2022.
The following results were arrived at by means of the evaluation of these parameters (
Table 4). The majority of DMR quality parameters could be assessed only based on practical experience in the area concerned. The legislation in the Slovak Republic does not specify them in detail.
For the assessment of the qualitative aspect of input data in the hydrodynamic model is in many scientific studies suggested the importance given to the hydrological and hydraulic part [
68]. We noticed that the authors such as [
69,
70] present a consensus view that the input parameters and their uncertainties affect modeling results mainly in the extent of inundation area and water depth.
As in scientific work [
68], our study uses a 1D-hydraulic model to monitor and map the extent of inundation areas. The diversity of land-use patterns in inundation areas means that the roughness in the hydrodynamic modeling process is one of the important parameters that have a significant impact on the outcome [
67]. Among the basic types of uncertainty, the work [
70] mentions the shape, width, and roughness of the canal and the watercourse.
Given the overall assessment of the situation, we can state that the roughness coefficients recommended in [
61,
62] are underestimated for the current state of watercourses in Slovakia. This is confirmed by the results of professional work [
71] and the practical experience of water managers.
The data used as N annual flow rates create a high degree of uncertainty in hydrodynamic models. N-year flow rates used by us belong to the 4th class of reliability of hydrodynamic data by the STN 75 1400: 2008 (
https://www.sutn.sk/eshop/public/standard_detail.aspx?id=104840). As mentioned in [
72], flow parameters of higher reliability are inevitable for hydrodynamic modeling. It is necessary to draw conclusions more carefully from the results of hydrodynamic modeling.
5. Conclusions
The variety of natural conditions and character of the landscape determine the approach to flood protection in every aspect. The application of modeling processes is recommended to ensure flood prevention and to create the synergy of sustainability in the environment. Their success depends on the examination method of a specific phenomenon (of floods in this case), the quantity and quality of input data (topographical characteristics of the relief, vertical conditions, hydrological–hydrogeological data presented in various formats), but also on the knowledge of the impacts of changes in properties of the surrounding environment on the pattern of water outflow in the examined river basin (or its parts). The procedures and methods presented in this article regarding the chosen processing methodology were focused on the assessment of the qualitative aspect of the input data for the hydrodynamic modeling process. The examination of this parameter is a necessary element in achieving the qualitative aim, i.e., as minimally biased results as possible with respect to the real progress of a natural phenomenon. In terms of a comprehensive approach at the level of theoretical knowledge and practical experience in the area of hydrodynamic modeling, certain shortcomings are evident in the quality of spatial data. Their specificity has conditioned the creation and design of standards on how to work with such data.
The results of our experimental part may be a recommendation for better impact evaluation of the qualitative parameters entering the hydrodynamic modeling process. The presented results of this study are a relevant basis for the creation of flood risk maps and flood hazard maps for the given inundation area. Furthermore, the use of results is closely related to land-use planning and the elimination of potential flood damage (number of inhabitants at risk of floods, amount of potential flood damage), mitigation, or reduction of potential flood damage, or elimination of floods in the study area.
The results of this article should contribute to the development of more detailed information for use in flood prediction scenarios and another interested group of producers of such a group of spatial data, which is also the Slovak Water Management Enterprise. Furthermore, it can be stated that studies of similar significance and character need to be carried out mainly in urbanized urban areas, due to the persistent dangerous and extreme weather events, such as repeated floods in the eastern part of Slovakia.
The benefits of the study results can be applied in the part of public administration of the Slovak Republic responsible for environmental protection, and at the same time at the level of tertiary educational institutions. Decision makers should in particular pay attention to improving the quality of DMR and the quality of hydrological data (accuracy of flow data and boundary conditions).

 ,
, 


