1. Introduction
The luminescent solar concentrator photovoltaic collector (LSC PV) shown in
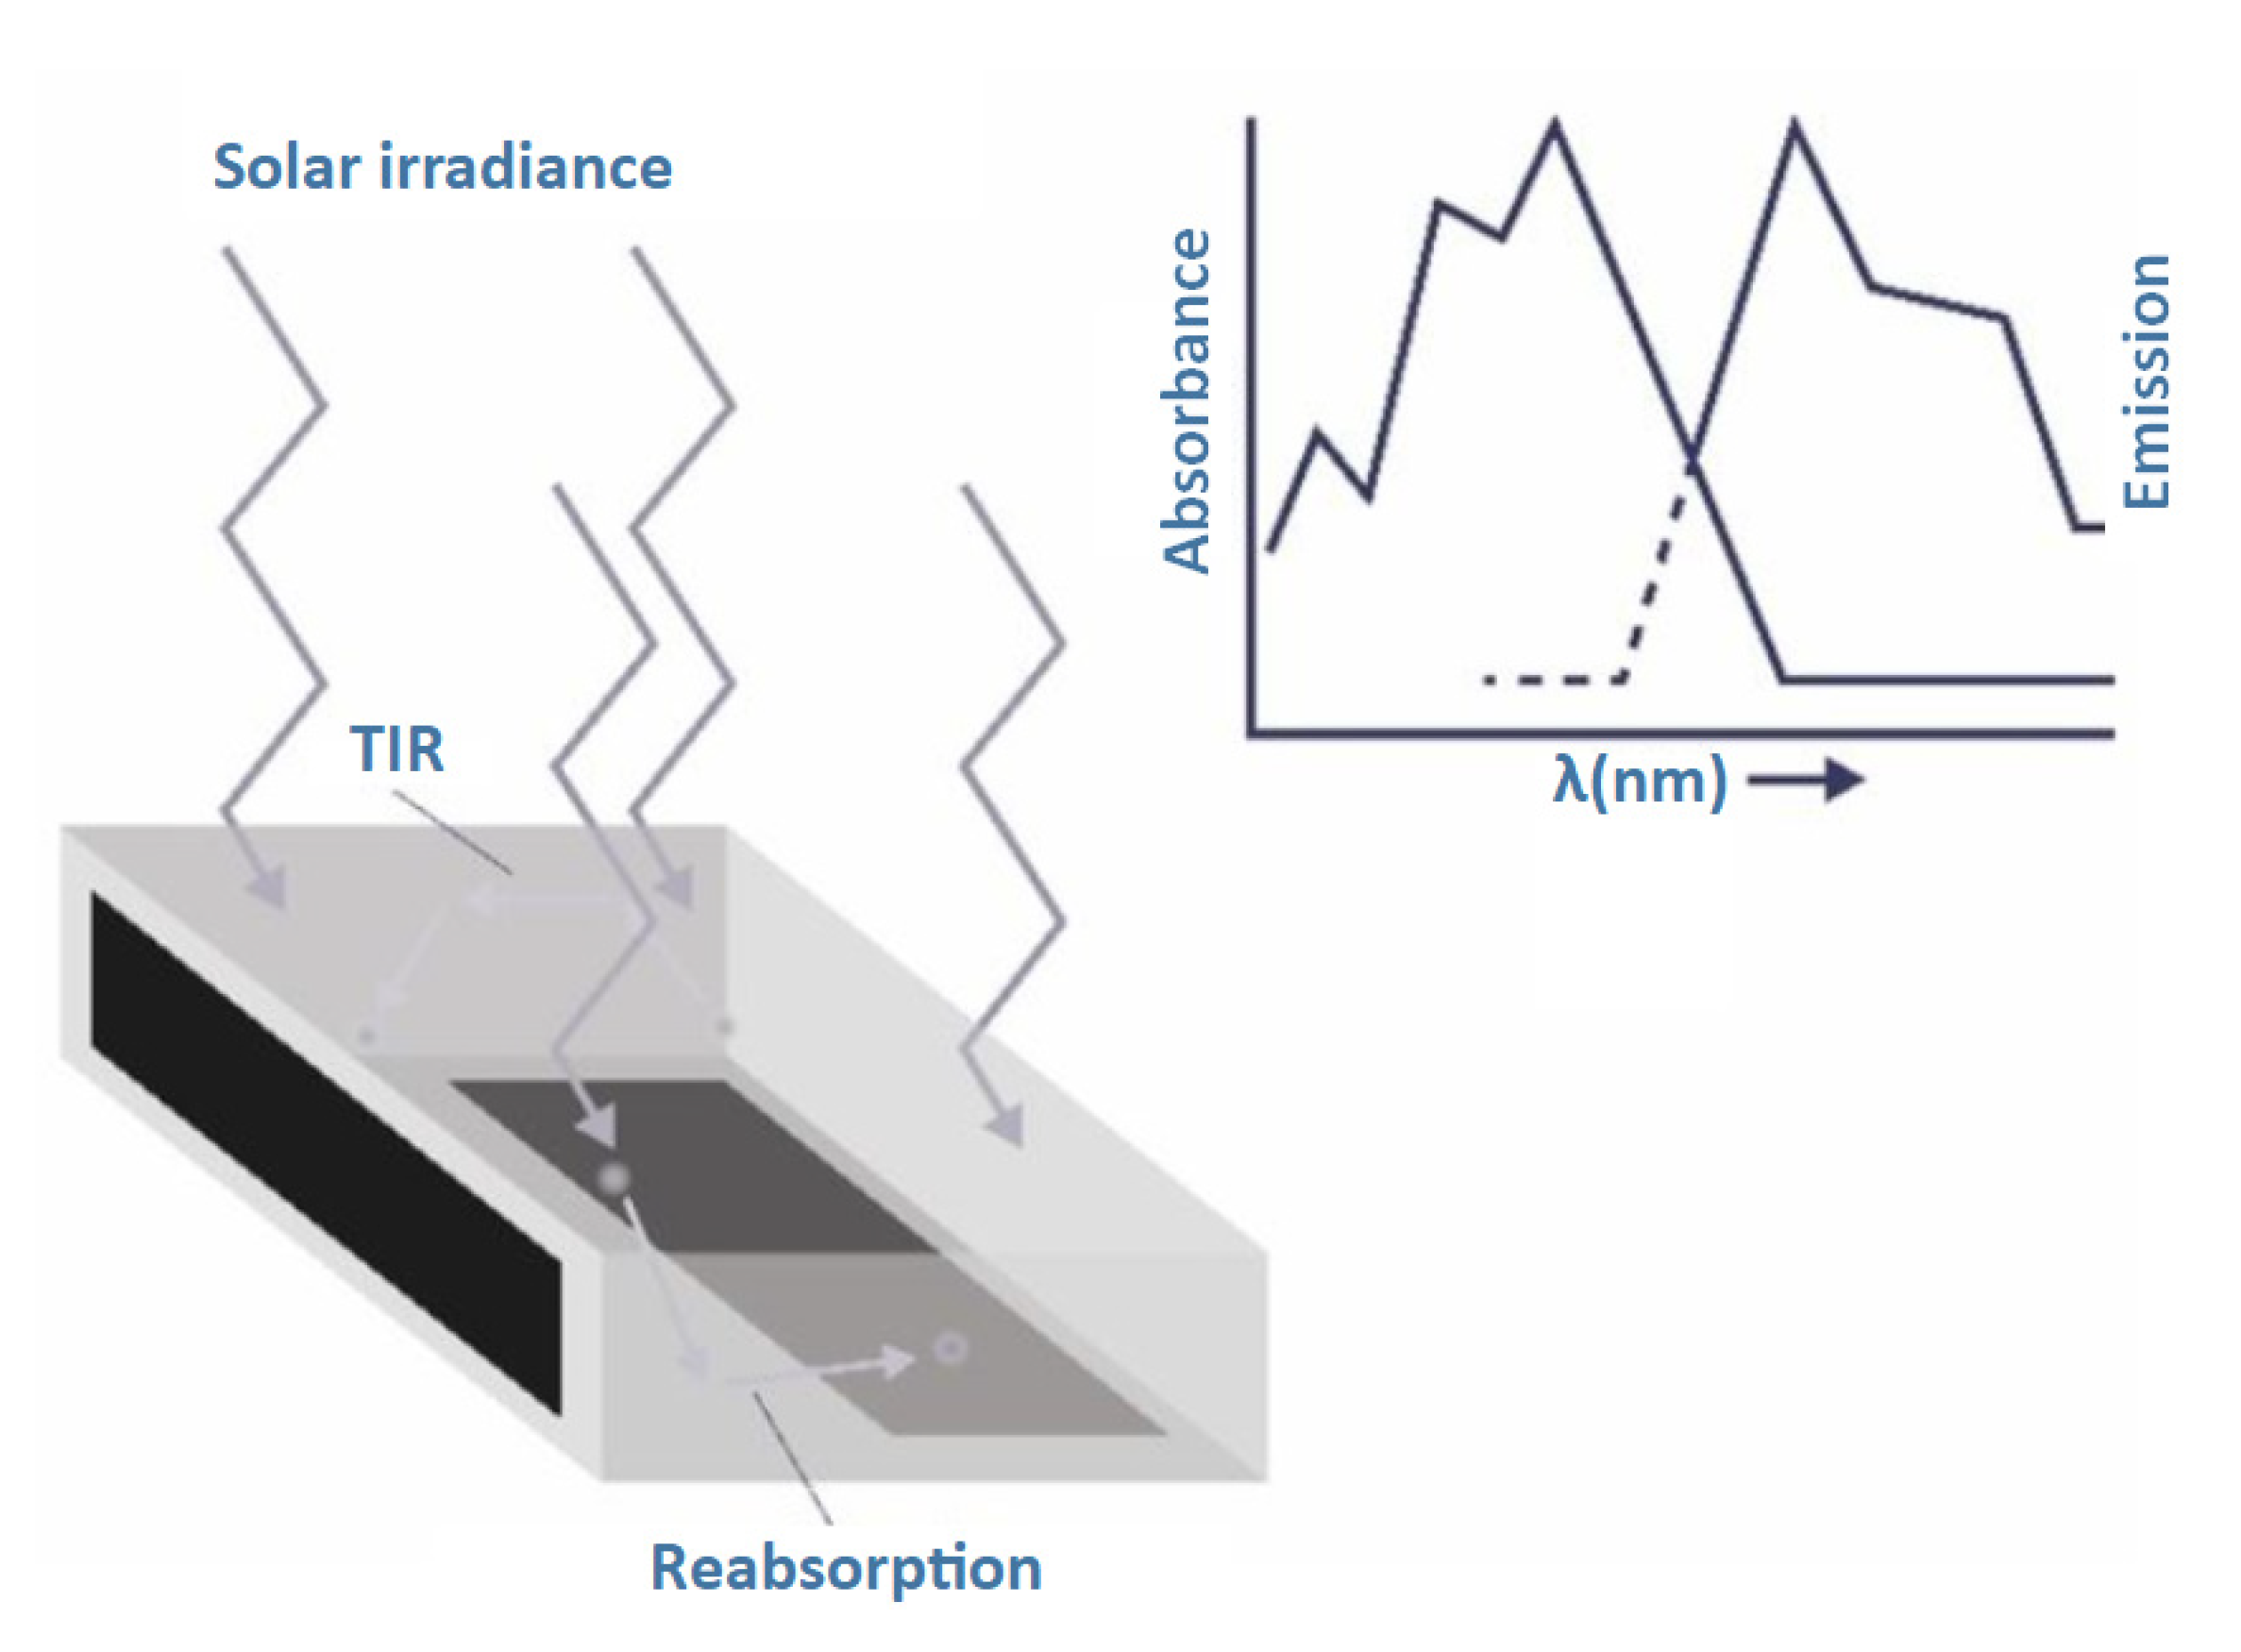
Figure 1 holds several attractive features over existing conventional PV modules that are usually dark in color and are of a fixed thin, flat and rectangular shape, and so cannot meet the design requirements for the proper integration of photovoltaic technologies in products and buildings—so-called building integrated PV (BIPV). On the other hand, LSCs support colorful surfaces, transparency and provide form freedom, offering many design opportunities to enhance the overall functionality and experience of PV power generation within consumer products, the built environment and transportation [
1,
2].
The LSC is a technology [
3,
4] for harvesting solar energy that is comprised of a transparent element which serves to guide light to PV solar cells. These cells act as the receivers for the solar irradiance and generate electrical power—a typical configuration of this is shown in
Figure 1. The LSC lightguide, which is usually made of polymer, glass or another transparent material, has a refractive index that is higher than air and contains luminescent pigments or luminophores, often molecular dyes. Sunlight, either direct or diffuse, is absorbed by dye molecules and, upon re-radiation, is guided by total internal reflection (TIR) to the photovoltaic solar cells at the periphery of the solar cell. Combining the concentration of irradiance and the transformation of the incoming spectrum in one solar device offers the potential for an efficient energy conversion process. Typically, an ideal LSC PV consists of a host material with a higher transparency, and a low scattering and attenuation coefficient, that is compatible with the dispersal of luminescent dyes [
5,
6]. Moreover, the emission spectra of the luminophores should be matched with the spectral response of the solar cells [
7].
In the past, however, LSC PV technologies have only shown moderate power conversion efficiencies (PCE), in the range of 2%–7% [
1]. To date, these technologies have not been considered a serious alternative to conventional PV technologies. However, they do have the potential for an improved performance, while providing a design freedom that is difficult to achieve with conventional photovoltaic modules. The aim of this work, therefore, is to further develop the LSC PV elements for the enhancement of the product applications of PV, leading to higher efficiencies beyond the 10% threshold for LSC PV technologies that is often claimed in the literature [
8]. Hitherto, various monofacial solar cells have been studied for their attachment to LSCs [
9]. However, bifacial solar cells absorb the direct and diffuse irradiance impinging on the front and rear side, which increases the output power when compared to monofacial solar cells. This increase in power can exceed that of a monofacial cell by 35% and 70% under sunny and cloudy conditions, respectively [
10,
11]. This is because the output power of the bifacial cells depends on the albedo of its surroundings and, in particular, on the albedo of the surface underneath the backside of such a solar cell [
12].
At the beginning of 2019, a summer school was organized on the topic of “Exciton Solar + Design”, with the aim of cross-fertilizing scientific research on the control of molecular excitons with the design potential of LSC PV applications. This summer school was composed of scientists, students and design professionals and involved formal lectures, design exercises and practical outdoor field testing of LSC PV devices. Several conceptual designs from the 15 participants were developed and presented during this summer school. They were partially evaluated by the ray tracing simulations in order to explore their optical performance.
Figure 2 shows one of the results that emerged from this exercise, depicting a new design for an LSC PV device that contains bifacial solar cells. In this paper, we evaluate the optical performance and expected theoretical power conversion efficiency for this novel, design-driven solar collector. The details of the simulation that was conducted is presented in
Section 2 and the results are discussed in
Section 3 and
Section 4, which present the main findings of our study, with recommendations for further research.
2. Materials and Methods
The ray tracing simulations were conducted to evaluate the performance of the novel design configuration for the LSC PV, using mono-crystalline silicon bifacial solar cells (mono c-Si) and several rectangular cuboid lightguides made of poly (methyl methacrylate) (PMMA). This approach follows prior studies that were based on Monte Carlo ray tracing methods which evaluated the geometrical effects and other features of LSC PV devices [
13,
14,
15,
16]. Here, a PMMA matrix acted as a lightguide and host for the organic dyes, namely Lumogen red 305 and orange 240. The LightTools software was used to perform the ray tracing simulations, in order to determine the irradiance received on the solar cell surface, as well as to analyze the optical performance and power conversion efficiency of these LSC PV devices.
2.1. Design Configurations
In this research, five different LSC PV devices were defined and simulated. The devices had different configurations in terms of their size, number of solar cells and their position on the lightguide, as shown in
Table 1.
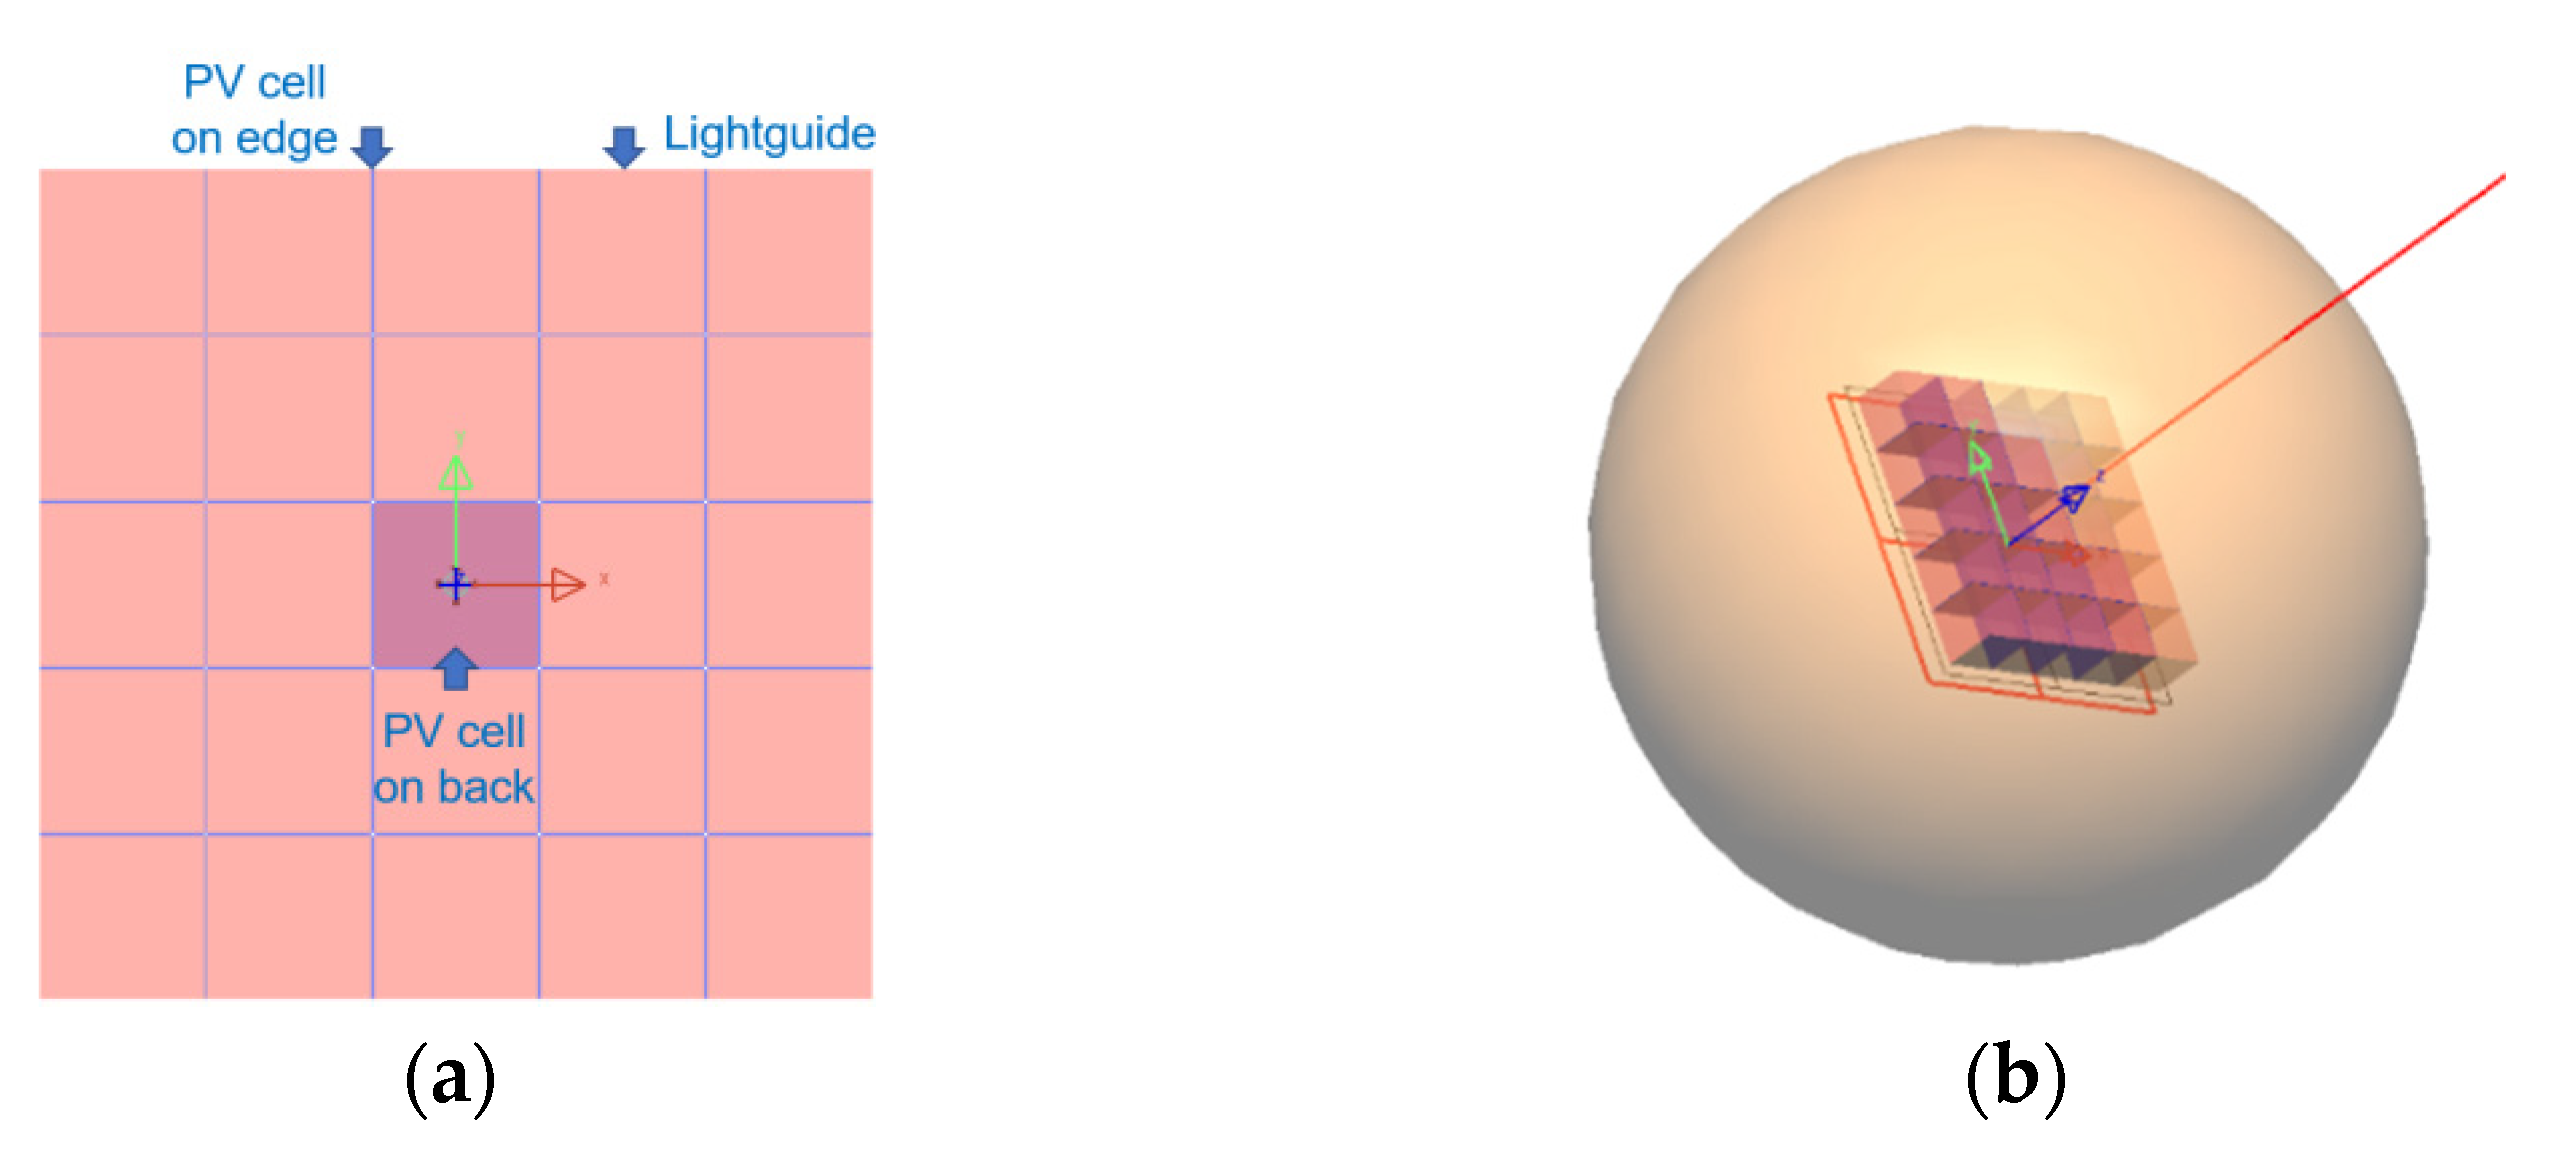
Figure 3 depicts the geometry set up for one of the LSC PV devices, to show the modeling concepts that were applied to other devices as well. Of the many different combinations of dimensions, we restricted the analysis to only two larger dimensions with a different number of rectangular cuboid and bifacial cells, due to the similarity of the cases in terms of their configuration.
The devices were modeled in two ways, namely (1) where the LSCs had the solar cells attached between the neighboring lightguides, and (2) with the solar cells both attached between neighboring the lightguides and at the back of the LSC PV device. This concept can be extended to arrays with n x m units of LSC PV devices. The simulations do not cover scenarios with PV cells attached to the outer edge of the full LSC PV array of n × m units, because these outer-edge cells would form a barrier to the incoming irradiance.
2.2. Simulation Setup
In this research, the LSC PV devices were simulated in the ray tracing software LightTools. The mathematical technique that is implemented to trace light paths in an optical system is called “ray tracing”. This method traces the light paths based on a number of factors related to the physical interaction of the photons with their surroundings, such as absorption, refraction, reflection, total internal reflection (TIR), emission and transmission. In an LSC PV device, the photons go through events that are both stochastic and probabilistic by nature. As such, Monte Carlo ray tracing has proven to be a very useful method to predict the performance of LSC PV devices and to calculate their optical efficiency (OE) [
17]. In this study, the incident photons were traced from their entry into the LSC PV device, until they were absorbed, re-emitted and escaped from the devices, or were collected by the solar cells attached [
18].
There are different types of software that can be used to conduct the ray tracing simulation of an LSC PV device. However, the software LightTools was chosen in this study due to its ability to handle complex geometries and to simulate the LSC PV devices under standard test conditions (STC: 1000 W/m2, AM 1.5 spectrum and 25 °C). Furthermore, LightTools provides many robust design features and visualization tools to create a 3D model of the LSC PV device and to accurately evaluate its performance.
As mentioned before, the rectangular lightguides consisted of PMMA (as the host material) which was mixed with two luminescent dyes, namely Lumogen red 305 and Lumogen orange 240. These organic dyes have a high photoluminescence quantum yield (PLQY). Moreover, these organic dyes are inexpensive and have a simple mixing procedure with PMMA, in comparison with other luminescent materials. Lumogen red 305 and orange 240 are highly matched to the band gap of the silicon solar cells when compared to other dyes.
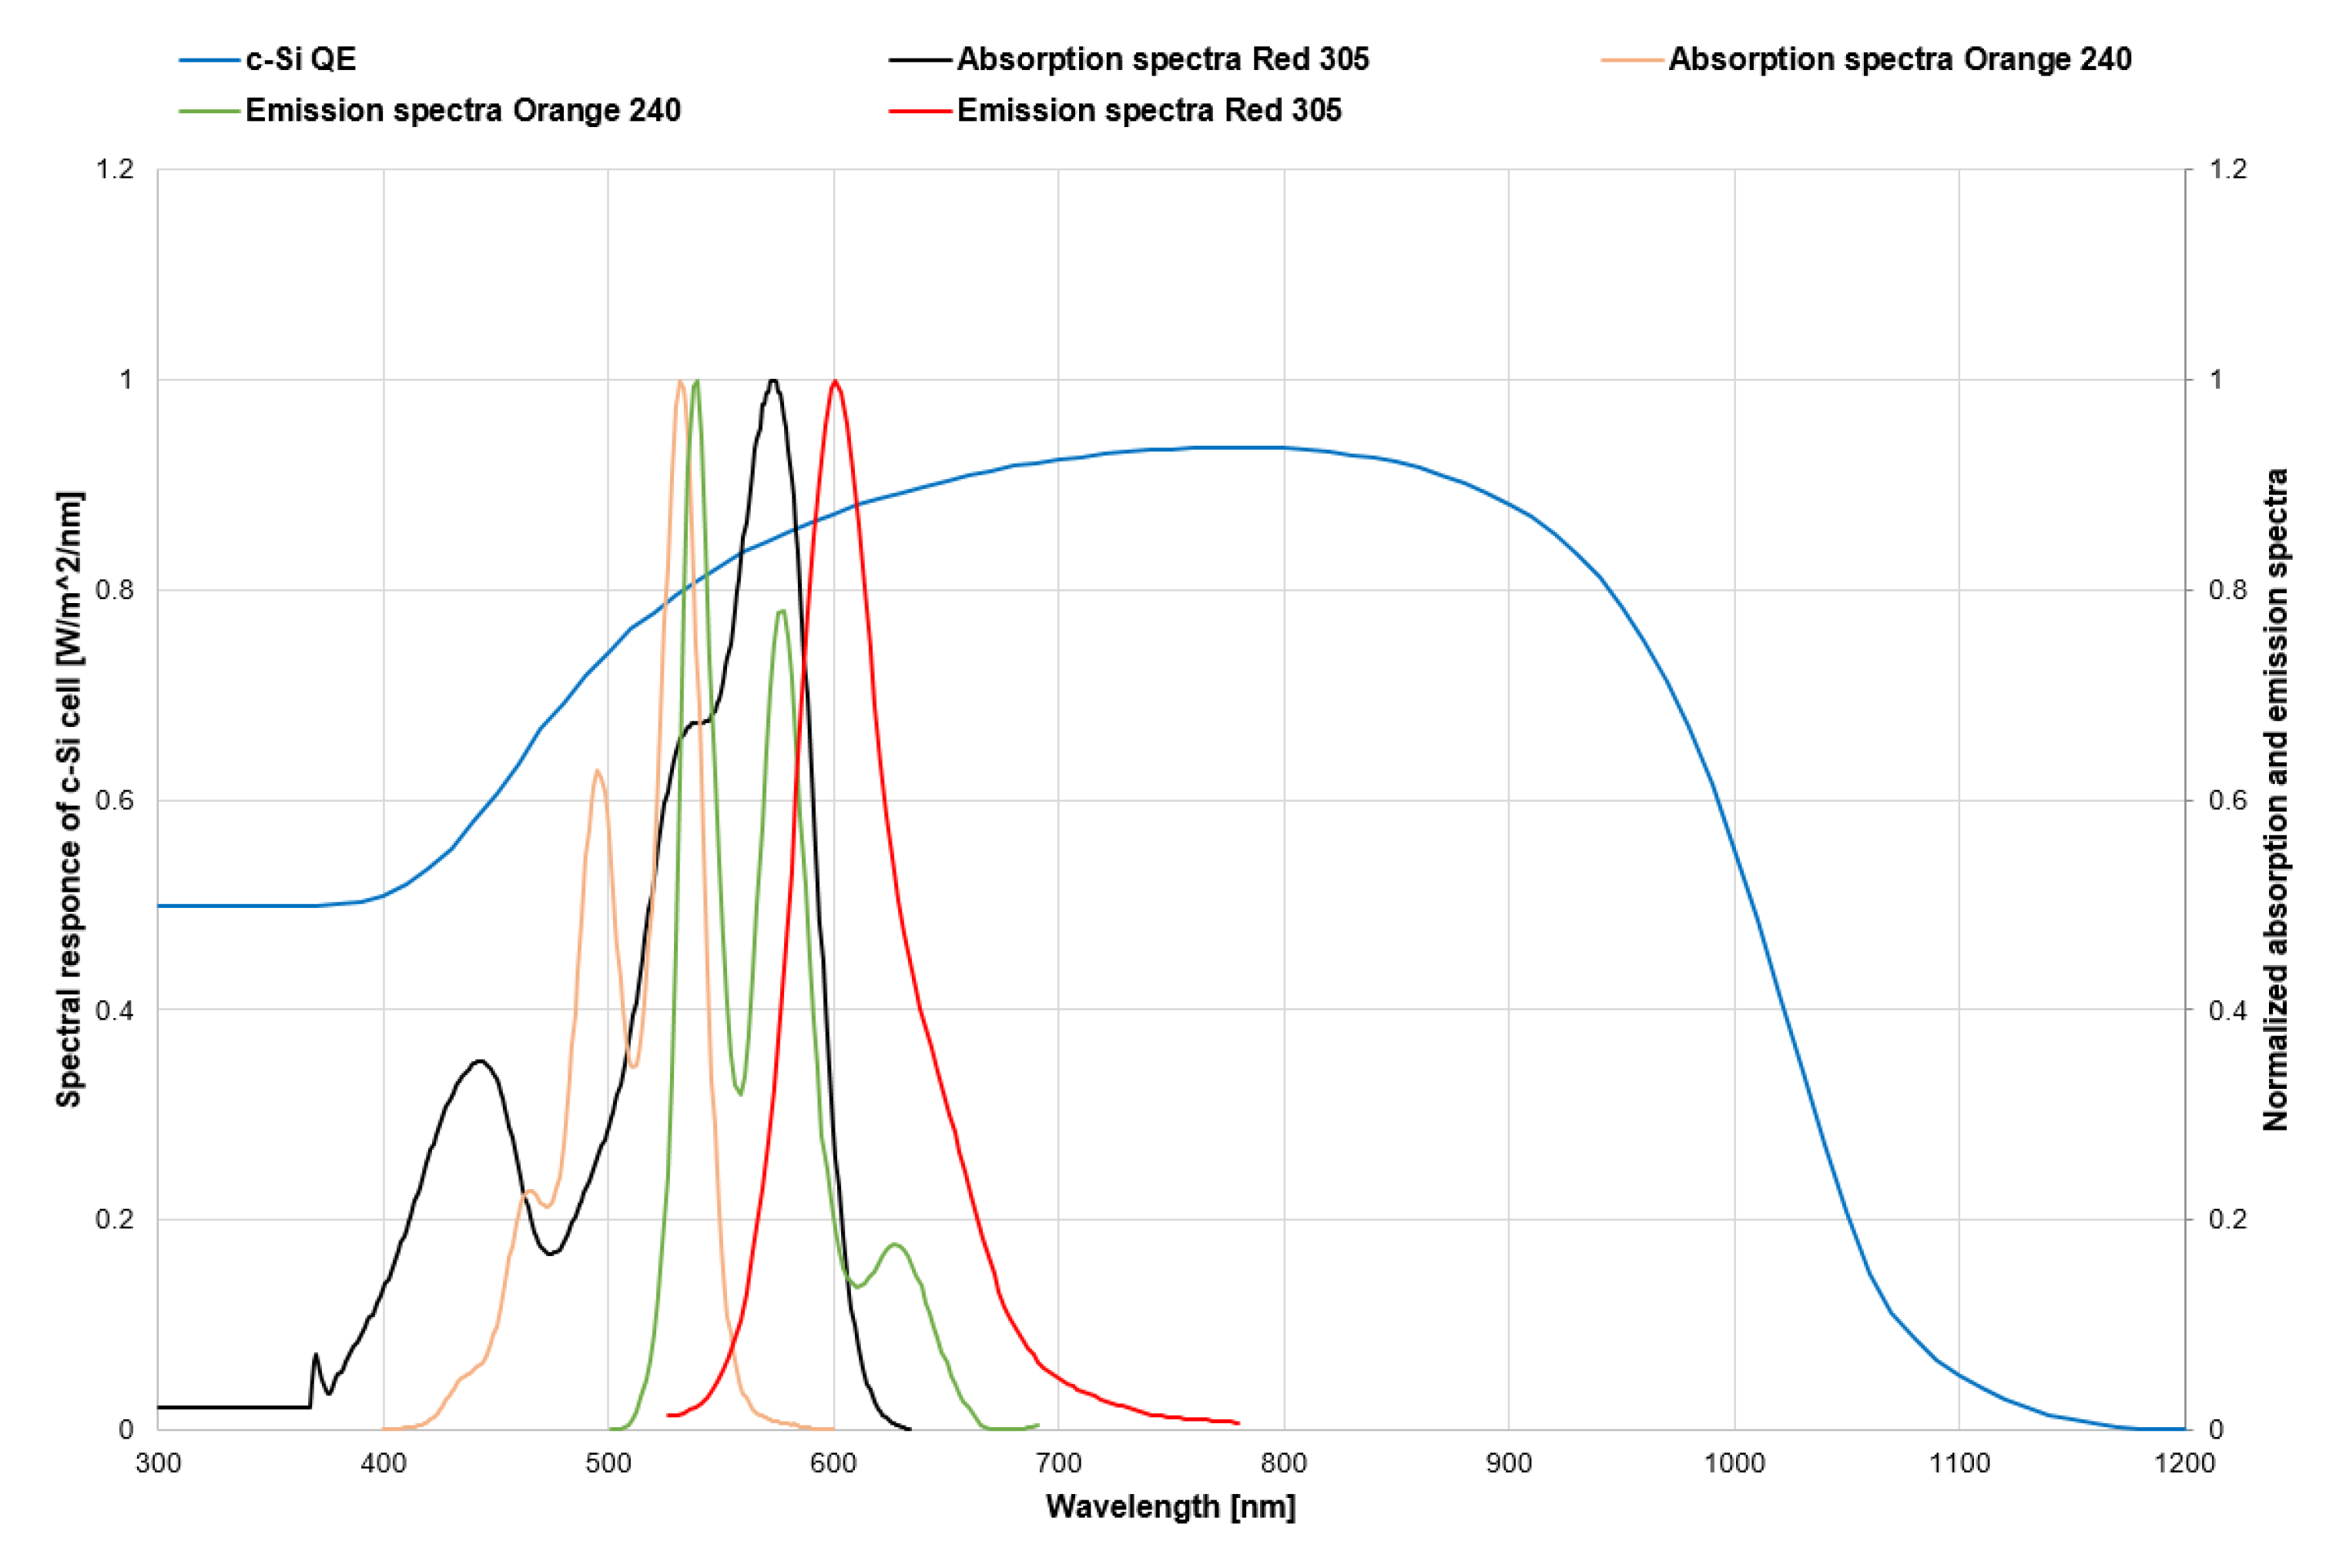
Figure 4 depicts the absorption and emission spectra of Lumogen red 305, orange 240 dyes, versus the quantum efficiency curve of a silicon solar cell.
For each device, a 3D model was created of all of the physical components, which was imported into LightTools for the 3D ray tracing simulations—see
Figure 5. In this 3D model, the material properties were defined as follows. PMMA was a standard material in LightTools, with a refractive index of 1.49 at 589 nm. The dyes had absorption and emission curves, as shown in
Figure 4. The silicon solar cells were modeled as receiver planes with a refraction index of 3.4 at 550 nm.
In
Figure 4, the red dye had two absorption peaks at 444 and 574 nm and also had a single emission peak at 601 nm. The orange dye had two absorption peaks at 497 and 532 nm and also two emission peaks at 539 and at 581 nm. The Stokes shift of the red and the orange dye was equal to 27 and 7 nm, respectively. Therefore, the red dye showed a larger absorption band and a higher Stokes shift than the orange dye, which means that an LSC PV device with a red luminescent dye might be slightly more efficient. The STC efficiency of the mono c-Si bifacial solar cells, which were attached to the sides and the back of the lightguides, was set at 20%. The ray tracing simulations were carried out under STC with 70% direct and 30% diffuse irradiance, respectively. The direct irradiance source was oriented as perpendicular toward each device in a long distance, while the diffuse irradiance source was positioned surrounding the whole device. The number of rays varied between 1 million and 5 million, which is sufficient for precise analysis. The dye concentration was increased from 5 to 110 ppm where the device reached saturation point, meaning that a further increase in the dye concentration would have led to a decrease in the light passing through the device. The formula that was related to tuning the concentration is presented in Equation (1) [
19]
where
is the concentration, PPM represents the particle per million and
indicates the molecular weight of the substance. PPM was calculated through Equation (2) [
19].
C was tuned to change the dye concentration for the Lumogen red 305 and orange 240. It has to be taken into account that the orange dye reached the saturation point at a lower concentration compared to the red dye because of two reasons, namely (1) molecular weight and (2) a different absorption coefficient. In addition, the molecular weight of the orange dye was lower than the red dye. This means that the orange dye had a higher concentration than the red dye at an equal ppm. Furthermore, the orange dye had double the absorption coefficient compared to the red dye. As a result, these effects caused an early saturation of the orange dye during the mixing procedure [
20]. The efficiency of LSC PV devices was calculated through Equation (3)
where
is the output power of the solar cells, G is the irradiance (1000 W/m
2) and A is the aperture area (cm
2) of the lightguide.
3. Results
3.1. Incident Irradiance on the Cells’ Surfaces
In the scenario with the highest share of direct irradiance (100%), all of the cells on the sides received almost the same irradiance. However, the cells attached to the back received a higher solar irradiance where PMMA was mixed with the orange dye when compared to the red dye (see
Figure 6). This is because the orange dye had a smaller absorption spectrum, and most parts of the solar spectrum passed through the lightguide with the orange dye rather than the red one. However, the orange dye, at a lower concentration, performed better compared to the red dye because the absorbance of the orange dye was higher. However, at higher concentrations, the red dye had a more effective performance, due to the orange dye absorbing and emitting the photons more at lower concentrations in comparison with the red dye. This effect led to a higher irradiance reception. In this scenario, the larger rectangular cuboids indicated a higher efficiency due to a better exposure of the PV cell at the backside of the LSC device to the irradiance.
Reducing the share of the direct irradiance caused a lower incident irradiance to be emitted on the solar cells which were placed at the edges of the devices. In this situation, the incident irradiance was increased with the increase in the dye concentration for the cells that faced the inner side of the lightguide. However, the presence of the diffuse light led to the incident irradiance being perpendicular to the surface of the cells at the edges. In such a situation, increasing the dye concentration decreases the irradiance that passes through the lightguide, hence the incident irradiance for the cells attached on the edges was almost similar to the cells placed on the back of the lightguide—see
Figure 7.
3.2. Power Conversion Efficiency
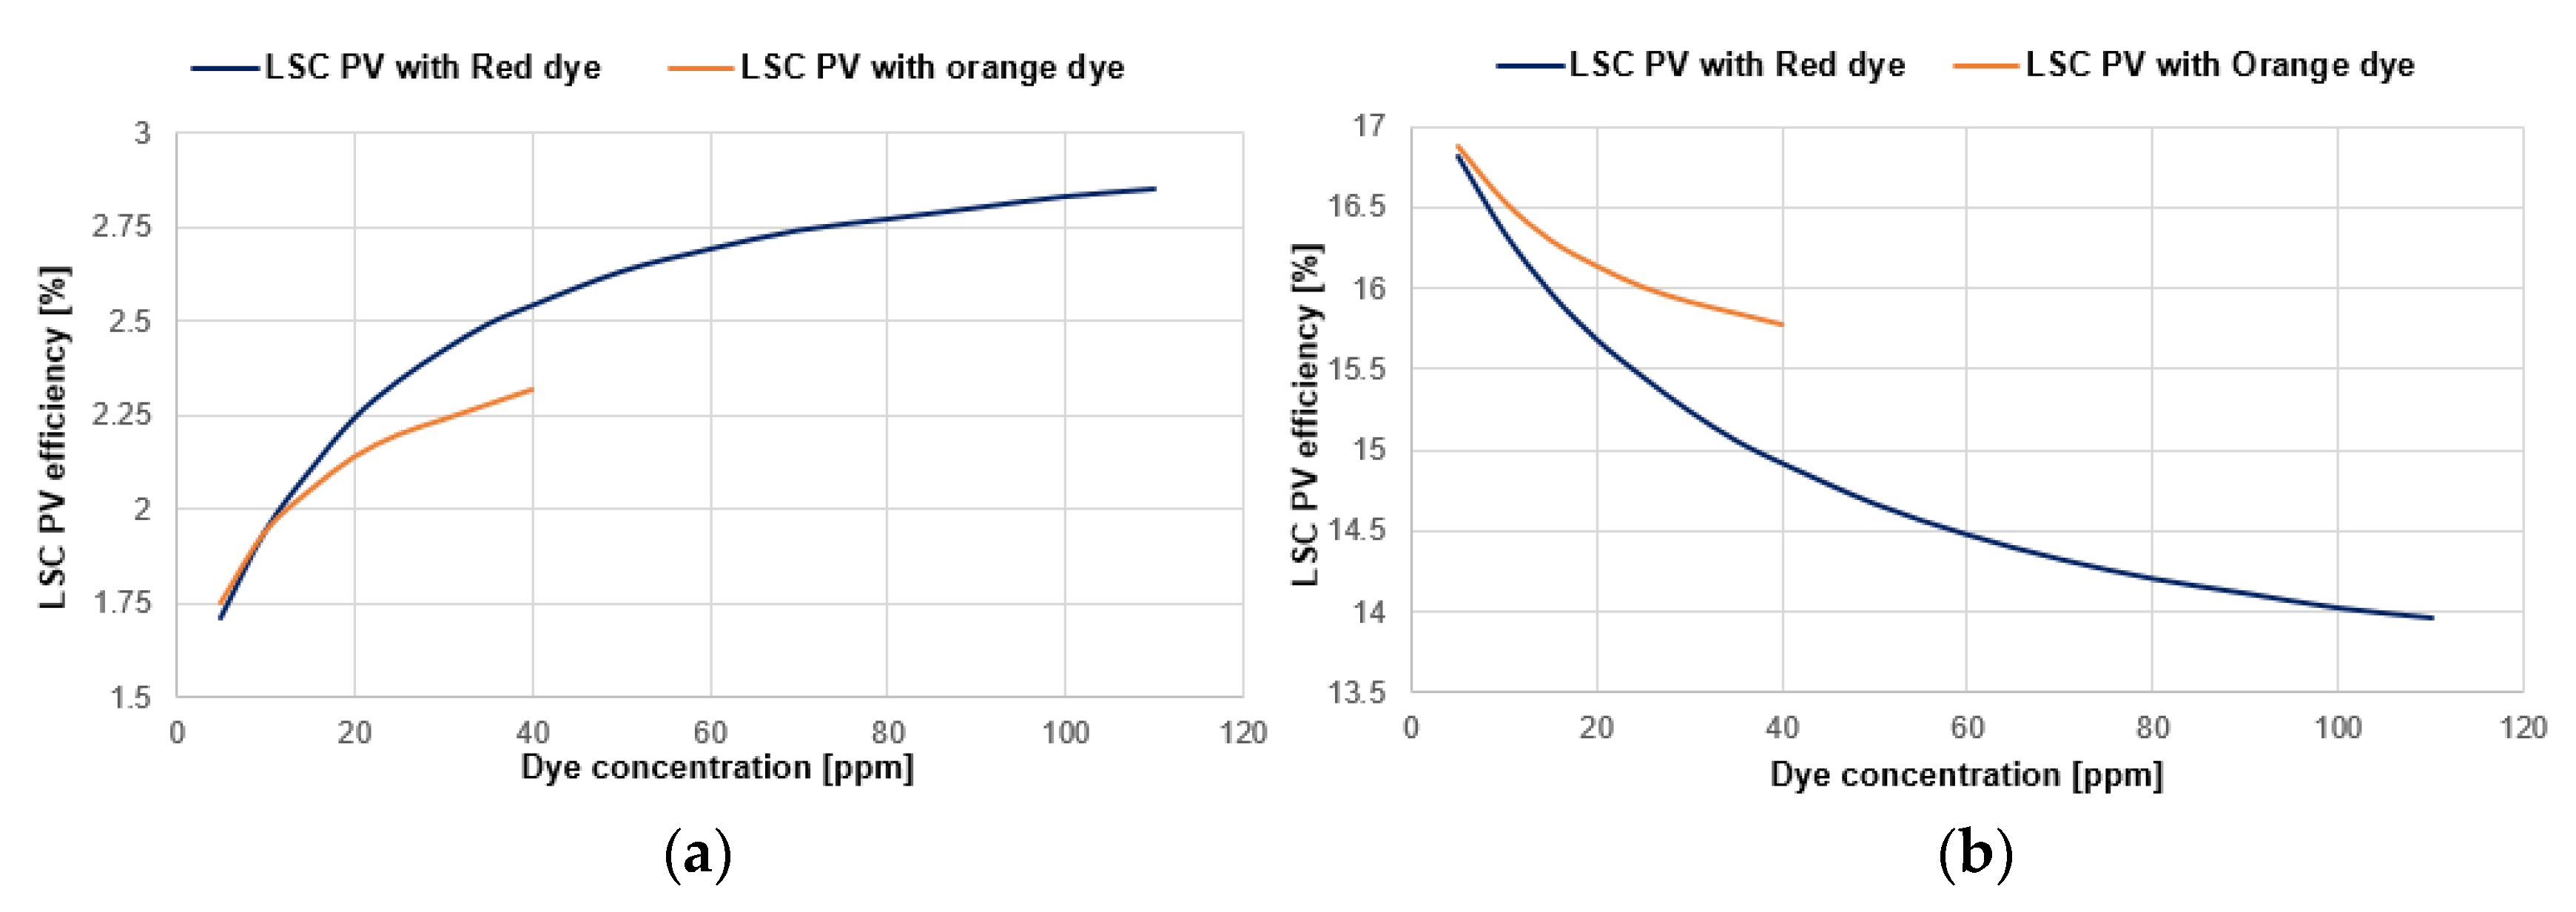
Figure 8 shows the efficiency of the LSC PV devices as a function of the dye concentration for the optimal cases with a higher performance. As illustrated in
Figure 8, the efficiency of the device without the bifacial cells on the back was increased, whereas the efficiency of the device with the bifacial cells on the edge and back was decreased. The increase in the dye concentration led to an increase in the incident irradiance for the solar cells attached on the sides, and also a decrease in the incident irradiance for the bifacial cells placed on the back.
Table 2 summarizes the efficiencies of the LSC PV devices with optimum configuration and performance. These results were obtained based on the minimum and maximum range of the dye concentration (i.e., Lumogen red 305 and orange 240) and also the position of the bifacial solar cells attached on the lightguide.
According to the results, the highest power conversion efficiency was 16.9% under STC, with 70% direct and 30% diffuse irradiance obtained for the LSC PV device with the bifacial cells on the back and sides with the three by three rectangular cuboids (5 × 5 × 1 cm3) at 5 ppm orange 240 dye concentration. The highest efficiency, considering only the bifacial cells on the side, was up to 2.9% under STC for the LSC PV device with the five by five unit cubes (1 × 1 × 1 cm3) and the red 305 dye at 110 ppm.
4. Conclusions
In the past, many efforts were devoted to developing different configurations of LSC PV to increase the OE and PCE. In all cases, the monofacial solar cells from various technologies were attached to the LSC devices in order to convert the light into electricity.
In the current study, a novel configuration for LSC PV was presented in various geometries and dye concentrations, with vertically placed bifacial PV solar cells made of mono c-Si. The main aim of this study was to theoretically determine the PCE of five differently configured LSC PV devices. For this purpose, the LSC PV devices with different geometries were modeled and simulated using a ray tracing software called LightTools. The lightguide was made of multiple rectangular cuboids which were mixed with organic dyes, namely Lumogen red 305 and orange 240. The emission spectra of these luminescent materials were matched to the spectral response and the quantum efficiency (QE) of the bifacial solar cells. In each device, the mono c-Si bifacial solar cells were placed in between the two neighboring lightguides. To maximize the LSC PV device efficiency, the bifacial cells were also attached at the back side of the lightguides.
This study has been able to demonstrate that an increase in dye concentration will lead to a lower efficiency in the devices with the bifacial cells on the back and the edges. This is because such increase in concentration results in a lower incident irradiance on the bifacial cells positioned on the back, and a higher incident irradiance on the bifacial cells placed on the sides. On the other hand, an increase in efficiency was shown when the bifacial cells were only on the edges of the collector.
The results of the ray tracing simulation have indicated that the maximum efficiency was equal to 16.9% (under STC) where the dimension of the LSC PV device was 15 × 15 cm2, consisting of nine rectangular cuboid 5 × 5 × 1 cm3 PMMA lightguides, with Lumogen orange 240 (at 5 ppm), with 12 vertically positioned 5 × 1 cm2 bifacial solar cells in between the lightguides and nine 5 × 5 cm2 PV cells attached to the back of the device. However, the maximum PCE of 2.9% under STC was obtained for an LSC PV device consisting of 25 cubical 1 × 1 × 1 cm3 PMMA lightguides, with 110 ppm red 305 dye and 40 vertically oriented bifacial PV cells of 1 × 1 cm2 in between the lightguides.
The results have demonstrated that such a concept shows promise in the commercial production of LSC PV devices with visual appeal for a built environment, for example, in facades, PV-powered vehicles, and so on. However, in reality, there are many challenges in creating such LSC PV devices based on these simulation results—for example, the electrical interconnection of the numerous bifacial solar cells is likely to be complicated.
Author Contributions
Validation, visualization, writing and editing—M.A.; Investigation, simulation and visualization—M.N.; Conceptualization, invention and editing—N.J.E.-D.; Conceptualization, invention, investigation, writing, editing and supervision—A.H.M.E.R. All authors have read and agreed to the published version of the manuscript.
Funding
We would like to acknowledge the Department of Mechanical Engineering of Eindhoven University of Technology for funding this research line on LSC PV devices and, also, AHMER acknowledges the financial support from the ARC Centre of Excellence for Exciton Science during her visit to the University of New South Wales (UNSW) for the Exciton Solar + Design summer school.
Conflicts of Interest
The authors declare no conflict of interest.
References
- Reinders, A.; Kishore, R.; Slooff, L.; Eggink, W. Luminescent solar concentrator photovoltaic designs. Jpn. J. Appl. Phys. 2018, 57, 08RD10. [Google Scholar] [CrossRef]
- Reinders, A.; Diehl, J.C.; Brezet, H. The Power of Design: Product Innovation in Sustainable Energy Technologies; Wiley: Hoboken, NJ, USA, 2012. [Google Scholar]
- Goetzberger, A. Fluorescent solar energy collectors: Operating conditions with diffuse light. Appl. Phys. 1978, 16, 399–404. [Google Scholar] [CrossRef]
- Yablonovitch, E. Thermodyamics of the fluorescent planar concentrator. J. Opt. Soc. Am. 1980, 70, 1362–1363. [Google Scholar] [CrossRef]
- El-Bashir, S.M. Enhanced fluorescence polarization of fluorescent polycarbonate/zirconia nanocomposites for second generation luminescent solar concentrators. Renew. Energy 2018, 115, 269–275. [Google Scholar] [CrossRef]
- Rowan, B.C.; Wilson, L.R.; Richards, B.S. Advanced material concepts for luminescent solar concentrators. IEEE J. Sel. Top. Quantum Electron. 2008, 14, 1312–1322. [Google Scholar] [CrossRef]
- Slooff, L.H.; Bende, E.E.; Burgers, A.R.; Budel, T.; Pravettoni, M.; Kenny, R.P.; Dunlop, E.D.; Büchtemann, A. A luminescent solar concentrator with 7.1% power conversion efficiency. Phys. Status Solidi Rapid Res. Lett. 2008, 2, 257–259. [Google Scholar] [CrossRef] [Green Version]
- Van Sark, W.G.J.H.M.; Krumer, Z.; De Mello Donegá, C.; Schropp, R.E.I. Luminescent solar concentrators: The route to 10% efficiency. In Proceedings of the 2014 IEEE 40th Photovoltaic Specialist Conference, Denver, CO, USA, 8–13 June 2014. [Google Scholar]
- Rafiee, M.; Chandra, S.; Ahmed, H.; McCormack, S.J. An overview of various configurations of luminescent solar concentrators for photovoltaic applications. Opt. Mater. 2019, 91, 212–227. [Google Scholar] [CrossRef]
- Liang, T.S.; Pravettoni, M.; Deline, C.; Stein, J.S.; Kopecek, R.; Singh, J.P.; Luo, W.; Wang, Y.; Aberle, A.G.; Khoo, Y.S. A review of crystalline silicon bifacial photovoltaic performance characterisation and simulation. Energy Environ. Sci. 2019, 12, 116–148. [Google Scholar] [CrossRef]
- Valdivia, C.E.; Li, C.T.; Russell, A.; Haysom, J.E.; Li, R.; Lekx, D.; Sepeher, M.M.; Henes, D.; Hinzer, K.; Schriemer, H.P. Bifacial photovoltaic module energy yield calculation and analysis. In Proceedings of the IEEE 44th Photovoltaic Specialist Conference, Washington, DC, USA, 25–30 June 2018. [Google Scholar]
- Soria, B.; Gerritsen, E.; Lefillastre, P.; Broquin, J.E. A study of the annual performance of bifacial photovoltaic modules in the case of vertical facade integration. Energy Sci. Eng. 2016, 4, 52–68. [Google Scholar] [CrossRef] [Green Version]
- Vishwanathan, B.; Reinders, A.H.M.E.; de Boer, D.K.G.; Desmet, L.; Ras, A.J.M.; Zahn, F.H.; Debije, M.G. A comparison of performance of flat and bent photovoltaic luminescent solar concentrators. Sol. Energy 2015, 112, 120–127. [Google Scholar] [CrossRef] [Green Version]
- Reinders, A.H.M.E.; De La Gree, G.D.; Papadopoulos, A.; Rosemann, A.; Debije, M.G.; Cox, M.; Krumer, Z. Leaf roof designing luminescent solar concentrating PV roof tiles. In Proceedings of the 2016 IEEE 43rd Photovoltaic Specialists Conference (PVSC), Portland, OR, USA, 5–10 June 2016; pp. 1–5. [Google Scholar]
- Klampaftis, E.; Ross, D.; Kocher-Oberlehner, G.; Richards, B.S. Integration of color and graphical design for photovoltaic modules using luminescent materials. IEEE J. Photovoltaics 2015, 5, 584–590. [Google Scholar] [CrossRef]
- Prönneke, L.; Gläser, G.C.; Rau, U. Simulations of geometry effects and loss mechanisms affecting the photon collection in photovoltaic fluorescent collectors. EPJ Photovoltaics 2012, 3, 30101. [Google Scholar] [CrossRef] [Green Version]
- Wilton, S.R. Monte-Carlo Ray Tracing Simulation for Optimizing Luminescent Solar Concentrators. Master’s Thesis, Pennsylvania State University, State College, PA, USA, 2012. [Google Scholar]
- Shu, J.; Zhang, X.; Wang, P.; Chen, R.; Zhang, H.; Li, D.; Zhang, P.; Xu, J. Monte-Carlo simulations of optical efficiency in luminescent solar concentrators based on all-inorganic perovskite quantum dots. Phys. B Condens. Matter 2018, 548, 53–57. [Google Scholar] [CrossRef]
- Bigg, P.H. The international system of units (SI units). Br. J. Appl. Phys. 1964, 15, 1243–1246. [Google Scholar] [CrossRef] [Green Version]
- Wilson, L.R.; Richards, B.S. Measurement method for photoluminescent quantum yields of fluorescent organic dyes in polymethyl methacrylate for luminescent solar concentrators. Appl. Opt. 2009, 48, 212–220. [Google Scholar] [CrossRef] [PubMed]
© 2020 by the authors. Licensee MDPI, Basel, Switzerland. This article is an open access article distributed under the terms and conditions of the Creative Commons Attribution (CC BY) license (http://creativecommons.org/licenses/by/4.0/).

 ,
, 


