Effect of Calcination Temperature on Photocatalytic Activity of Synthesized TiO2 Nanoparticles via Wet Ball Milling Sol-Gel Method

 ,
,
Abstract
:
1. Introduction
2. Materials and Methods
2.1. Preparation of TiO2 and Characterization of Synthesized TiO2 Material
2.2. Characterizations of TiO2
2.3. Photocatalytic Activity Reaction
3. Results and Discussion
4. Conclusions
Author Contributions
Funding
Conflicts of Interest
References
- Park, H.K.; Kim, D.K.; Kim, C.H. Effect of solvent on titania particle formation and morphology in thermal hydrolysis of TiCl4. J. Am. Ceram. Soc. 1997, 80, 743–749. [Google Scholar] [CrossRef]
- Boisvert, J.-P.; Persello, J.; Foissy, A.; Castaing, J.-C.; Cabane, B. Effect of surface charge on the adsorption mode of sodium poly (acrylate) on alumina-coated TiO2 used as coating pigment. Colloids Surf. A 2000, 168, 287–296. [Google Scholar] [CrossRef]
- Meléndez-Ceballos, A.; Fernández-Valverde, S.M.; Barrera-Díaz, C.; Albin, V.; Lair, V.; Ringuedé, A.; Cassir, M. TiO2 protective coating processed by atomic layer deposition for the improvement of MCFC cathode. Int. J. Hydrog. Energy 2013, 38, 13443–13452. [Google Scholar] [CrossRef]
- Jacobs, J.F.; van de Poel, I.; Osseweijer, P. Sunscreens with titanium dioxide (TiO(2)) nano-particles: A societal experiment. Nanoethics 2010, 4, 103–113. [Google Scholar] [CrossRef] [PubMed] [Green Version]
- Verdier, T.; Coutand, M.; Bertron, A.; Roques, C. Antibacterial activity of TiO2 photocatalyst alone or in coatings on E. coli: The influence of methodological aspects. Coatings 2014, 4, 670–686. [Google Scholar] [CrossRef]
- Siah, W.R.; Lintang, H.O.; Shamsuddin, M.; Yuliati, L. In High photocatalytic activity of mixed anatase-rutile phases on commercial TiO2 nanoparticles. IOP Conf. Ser. Mater. Sci. Eng. IOP Publ. 2016, 012005. [Google Scholar] [CrossRef]
- Li, L.; Yan, J.; Wang, T.; Zhao, Z.-J.; Zhang, J.; Gong, J.; Guan, N. Sub-10 nm rutile titanium dioxide nanoparticles for efficient visible-light-driven photocatalytic hydrogen production. Nat. Commun. 2015, 6, 5881. [Google Scholar] [CrossRef]
- Ohno, T.; Tokieda, K.; Higashida, S.; Matsumura, M. Synergism between rutile and anatase TiO2 particles in photocatalytic oxidation of naphthalene. Appl. Catal. A 2003, 244, 383–391. [Google Scholar] [CrossRef]
- El Gaidoumi, A.; Doña Rodríguez, J.M.; Pulido Melián, E.; González-Díaz, O.M.; Navío Santos, J.A.; El Bali, B.; Kherbeche, A. Synthesis of sol-gel pyrophyllite/TiO2 heterostructures: Effect of calcination temperature and methanol washing on photocatalytic activity. Surf. Interfaces 2019, 14, 19–25. [Google Scholar] [CrossRef]
- Arbuj, S.S.; Hawaldar, R.R.; Mulik, U.P.; Wani, B.N.; Amalnerkar, D.P.; Waghmode, S.B. Preparation, characterization and photocatalytic activity of TiO2 towards methylene blue degradation. Mater. Sci. Eng. B 2010, 168, 90–94. [Google Scholar] [CrossRef]
- Lv, K.; Yu, J.; Deng, K.; Li, X.; Li, M. Effect of phase structures on the formation rate of hydroxyl radicals on the surface of TiO2. J. Phys. Chem. Solids 2010, 71, 519–522. [Google Scholar] [CrossRef]
- Kandiel, T.A.; Robben, L.; Alkaim, A.; Bahnemann, D. Brookite versus anatase TiO2 photocatalysts: Phase transformations and photocatalytic activities. Photochem. Photobiol. Sci. 2013, 12, 602–609. [Google Scholar] [CrossRef] [PubMed] [Green Version]
- Tay, Q.; Liu, X.; Tang, Y.; Jiang, Z.; Sum, T.C.; Chen, Z. Enhanced photocatalytic hydrogen production with synergistic two-phase anatase/brookite TiO2 nanostructures. J. Phys. Chem. C 2013, 117, 14973–14982. [Google Scholar] [CrossRef]
- Cao, Y.; Li, X.; Bian, Z.; Fuhr, A.; Zhang, D.; Zhu, J. Highly photocatalytic activity of brookite/rutile TiO2 nanocrystals with semi-embedded structure. Appl. Catal. B Environ. 2016, 180, 551–558. [Google Scholar] [CrossRef]
- Štengl, V.; Králová, D. Photoactivity of brookite–rutile TiO2 nanocrystalline mixtures obtained by heat treatment of hydrothermally prepared brookite. Mater. Chem. Phys. 2011, 129, 794–801. [Google Scholar] [CrossRef]
- Di Paola, A.; Bellardita, M.; Ceccato, R.; Palmisano, L.; Parrino, F. Highly active photocatalytic TiO2 powders obtained by thermohydrolysis of TiCl4 in water. J. Phys. Chem. C 2009, 113, 15166–15174. [Google Scholar] [CrossRef]
- Liao, Y.; Que, W.; Jia, Q.; He, Y.; Zhang, J.; Zhong, P. Controllable synthesis of brookite/anatase/rutile TiO2 nanocomposites and single-crystalline rutile nanorods array. J. Mater. Chem. 2012, 22, 7937–7944. [Google Scholar] [CrossRef]
- Gomathi Thanga Keerthana, B.; Solaiyammal, T.; Muniyappan, S.; Murugakoothan, P. Hydrothermal synthesis and characterization of TiO2 nanostructures prepared using different solvents. Mater. Lett. 2018, 220, 20–23. [Google Scholar] [CrossRef]
- Falk, G.S.; Borlaf, M.; López-Muñoz, M.J.; Fariñas, J.C.; Rodrigues Neto, J.B.; Moreno, R. Microwave-assisted synthesis of TiO2 nanoparticles: Photocatalytic activity of powders and thin films. J. Nanopart. Res. 2018, 20, 23. [Google Scholar] [CrossRef]
- Da Silva, E.P.; Winkler, M.E.G.; Giufrida, W.M.; Cardozo-Filho, L.; Alonso, C.G.; Lopes, J.B.O.; Rubira, A.F.; Silva, R. Effect of phase composition on the photocatalytic activity of titanium dioxide obtained from supercritical antisolvent. J. Colloid Interface Sci. 2019, 535, 245–254. [Google Scholar] [CrossRef]
- Behnajady, M.A.; Eskandarloo, H. Preparation of TiO2 nanoparticles by the sol–gel method under different pH conditions and modeling of photocatalytic activity by artificial neural network. Res. Chem. Intermed. 2015, 41, 2001–2017. [Google Scholar] [CrossRef]
- Lopez, L.; Daoud, W.A.; Dutta, D. Preparation of large scale photocatalytic TiO2 films by the sol–gel process. Surf. Coat. Technol. 2010, 205, 251–257. [Google Scholar] [CrossRef]
- Jung, H.J.; Sohn, Y.; Sung, H.G.; Hyun, H.S.; Shin, W.G. Physicochemical properties of ball milled boron particles: Dry vs. wet ball milling process. Powder Technol. 2015, 269, 548–553. [Google Scholar] [CrossRef]
- Jung, H.J.; Nam, K.; Sung, H.-G.; Hyun, H.S.; Sohn, Y.; Shin, W.G. Preparation of TiO2-decorated boron particles by wet ball milling and their photoelectrochemical hydrogen and oxygen evolution reactions. Materials 2016, 9, 1012. [Google Scholar] [CrossRef] [PubMed] [Green Version]
- Behnajady, M.A.; Eskandarloo, H.; Modirshahla, N.; Shokri, M. Investigation of the effect of sol–gel synthesis variables on structural and photocatalytic properties of TiO2 nanoparticles. Desalination 2011, 278, 10–17. [Google Scholar] [CrossRef]
- Mutuma, B.K.; Shao, G.N.; Kim, W.D.; Kim, H.T. Sol–gel synthesis of mesoporous anatase–brookite and anatase–brookite–rutile TiO2 nanoparticles and their photocatalytic properties. J. Colloid Interface Sci. 2015, 442, 1–7. [Google Scholar] [CrossRef]
- Yu, J.-G.; Yu, H.-G.; Cheng, B.; Zhao, X.-J.; Yu, J.C.; Ho, W.-K. The effect of calcination temperature on the surface microstructure and photocatalytic activity of TiO2 thin films prepared by liquid phase deposition. J. Phys. Chem. B 2003, 107, 13871–13879. [Google Scholar] [CrossRef]
- Choi, H.; Kim, Y.J.; Varma, R.S.; Dionysiou, D.D. Thermally stable nanocrystalline TiO2 photocatalysts synthesized via sol−gel methods modified with ionic liquid and surfactant molecules. Chem. Mater. 2006, 18, 5377–5384. [Google Scholar] [CrossRef]
- Phromma, S.; Sapcharoenkun, C.; Wutikhun, T.; Kasamechonchung, P.; Eksangsri, T. Synthesis of TiO2 nanoparticles with high photocatalytic activity by wet ball milling sol-gel method. In Proceedings of the Innovative Chemical Engineering and Techhology toward a Sustainable Furture, Bangkok, Thailand, 18–20 October 2017; Volume 7, pp. 211–214. [Google Scholar]
- Bahadur, J.; Agrawal, S.; Panwar, V.; Parveen, A.; Pal, K. Antibacterial properties of silver doped TiO2 nanoparticles synthesized via sol-gel technique. Macromol. Res. 2016, 24, 488–493. [Google Scholar] [CrossRef]
- Rauf, A.; Shah, M.S.A.S.; Lee, J.Y.; Chung, C.-H.; Bae, J.W.; Yoo, P.J. Non-stoichiometric SnS microspheres with highly enhanced photoreduction efficiency for Cr (VI) ions. RSC Adv. 2017, 7, 30533–30541. [Google Scholar] [CrossRef] [Green Version]
- Hu, Y.; Tsai, H.L.; Huang, C.L. Effect of brookite phase on the anatase–rutile transition in titania nanoparticles. J. Eur. Ceram. Soc. 2003, 23, 691–696. [Google Scholar] [CrossRef]
- Bamne, J.; Taiwade, K.; Sharma, P.K.; Haque, F. Effect of calcination temperature on the growth of TiO2 nanoparticle prepared via sol-gel method using triton X-100 as surfactant. AIP Conf Proc. 2018, 2039, 0200761–0200765. [Google Scholar] [CrossRef]
- Saalinraj, S.; Ajithprasad, K.C. Effect of Calcination Temperature on Non-linear Absorption Co-efficient of Nano Sized Titanium Dioxide (TiO2) Synthesised by Sol-Gel Method. Mater. Today Proc. 2017, 4, 4372–4379. [Google Scholar] [CrossRef]
- Banjuraizah, J.; Ong, Y.; Ahmad, Z. Effect of Calcination Temperature on Titanium Dioxide Synthesized by Sol-Gel Method. Int. J. Cur. Res. Eng. Sci. Tech. 2018, 1, 68–74. [Google Scholar] [CrossRef]
- Calandra, P.; Lombardo, D.; Pistone, A.; Liveri, V.; Trusso, S. Structural and optical properties of novel surfactant-coated Yb@TiO2 nanoparticles. J. Nanopart. Res. 2011, 13, 5833–5839. [Google Scholar] [CrossRef]
- Calandra, P.; Ruggirello, A.; Pistone, A.; Liveri, V. Structural and Optical Properties of Novel Surfactant Coated TiO2–Ag Based Nanoparticles. J. Cluster Sci. 2010, 21, 767–778. [Google Scholar] [CrossRef]
- Baiju, K.V.; Shukla, S.; Sandhya, K.S.; James, J.; Warrier, K.G.K. Photocatalytic Activity of Sol−Gel-Derived Nanocrystalline Titania. J. Phys. Chem. C 2007, 111, 7612–7622. [Google Scholar] [CrossRef]
- Ozawa, T.; Iwasaki, M.; Tada, H.; Akita, T.; Tanaka, K.; Ito, S. Low-temperature synthesis of anatase–brookite composite nanocrystals: The junction effect on photocatalytic activity. J. Colloid Interface Sci. 2005, 281, 510–513. [Google Scholar] [CrossRef]
- Zhang, J.; Zhou, P.; Liu, J.; Yu, J. New understanding of the difference of photocatalytic activity among anatase, rutile and brookite TiO2. Phys. Chem. Chem. Phys. 2014, 16, 20382–20386. [Google Scholar] [CrossRef]
- Buckeridge, J.; Butler, K.T.; Catlow, C.R.A.; Logsdail, A.J.; Scanlon, D.O.; Shevlin, S.A.; Woodley, S.M.; Sokol, A.A.; Walsh, A. Polymorph Engineering of TiO2: Demonstrating How Absolute Reference Potentials Are Determined by Local Coordination. Chem. Mater. 2015, 27, 3844–3851. [Google Scholar] [CrossRef] [Green Version]
- Preethi, L.; Mathews, T.; Nand, M.; Jha, S.; Gopinath, C.S.; Dash, S. Band alignment and charge transfer pathway in three phase anatase-rutile-brookite TiO2 nanotubes: An efficient photocatalyst for water splitting. Appl. Catal. B 2017, 218, 9–19. [Google Scholar] [CrossRef]
- Hurum, D.C.; Agrios, A.G.; Gray, K.A.; Rajh, T.; Thurnauer, M.C. Explaining the enhanced photocatalytic activity of degussa P25 Mixed-phase TiO2 using EPR. J. Phys. Chem. B 2003, 107, 4545–4549. [Google Scholar] [CrossRef]
- Mi, Y.; Weng, Y. Band alignment and controllable electron migration between rutile and anatase TiO2. Sci. Rep. 2015, 5, 11482. [Google Scholar] [CrossRef] [Green Version]
- Zhao, H.; Liu, L.; Andino, J.M.; Li, Y. Bicrystalline TiO2 with controllable anatase–brookite phase content for enhanced CO2 photoreduction to fuels. J. Mater. Chem. A 2013, 1, 8209–8216. [Google Scholar] [CrossRef] [Green Version]
- Zhang, J.; Xu, Q.; Feng, Z.; Li, M.; Li, C. Importance of the relationship between surface phases and photocatalytic activity of TiO2. Angew. Chem. Int. Ed. 2008, 47, 1766–1769. [Google Scholar] [CrossRef]


| Sample | Crystallite Size (nm) | Energy Band Gap (eV) | ||
|---|---|---|---|---|
| Anatase | Rutile | Brookite | ||
| TiO2 before calcination | 6 | - | 3 | - |
| TiO2-300 | 7 | - | 4 | 3.10 ± 0.03 |
| TiO2-400 | 8 | - | 5 | 3.29 ± 0.04 |
| TiO2-500 | 12 | 4 | 5 | 3.28 ± 0.03 |
| TiO2-600 | 20 | 19 | 6 | 3.16 ± 0.02 |
| TiO2-650 | 23 | 25 | - | 3.08 ± 0.02 |
| TiO2-700 | 30 | 32 | - | 3.07 ± 0.02 |
| TiO2-800 | - | 52 | - | 3.05 ± 0.01 |
| P25 | 17 | 28 | - | - |
| Calcination Temperature | Comment | Reference |
|---|---|---|
| 25–800 °C | Calcination temperature below 600 °C found the mixture of anatase and brookite phases. The rutile phase was found above 600 °C and only the rutile phase was found at 800 °C. | [26] |
| 300–600 °C | Pure anatase phase was found between 300 °C and 400 °C. Rutile was found above 500 °C. | [33] |
| 200–800 °C | Pure anatase was found between 200 °C and 400 °C. The rutile phase was found above 500 °C. | [34] |
| 400–700 °C | Calcination temperature below 700 °C found only pure anatase and calcination temperature of 700 °C found the mixture of anatase and rutile phases. | [35] |
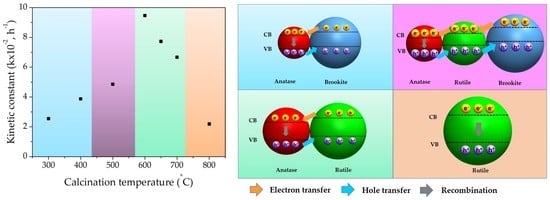
| Calcination Temperature (°C) | 300 | 400 | 500 | 600 | 650 | 700 | 800 | P25 |
| Kinetic constant (k × 10−2) (h−1) | 2.54 | 3.87 | 4.86 | 9.46 | 7.73 | 6.67 | 2.19 | 11.41 |
© 2020 by the authors. Licensee MDPI, Basel, Switzerland. This article is an open access article distributed under the terms and conditions of the Creative Commons Attribution (CC BY) license (http://creativecommons.org/licenses/by/4.0/).
Share and Cite
Phromma, S.; Wutikhun, T.; Kasamechonchung, P.; Eksangsri, T.; Sapcharoenkun, C. Effect of Calcination Temperature on Photocatalytic Activity of Synthesized TiO2 Nanoparticles via Wet Ball Milling Sol-Gel Method. Appl. Sci. 2020, 10, 993. https://doi.org/10.3390/app10030993
Phromma S, Wutikhun T, Kasamechonchung P, Eksangsri T, Sapcharoenkun C. Effect of Calcination Temperature on Photocatalytic Activity of Synthesized TiO2 Nanoparticles via Wet Ball Milling Sol-Gel Method. Applied Sciences. 2020; 10(3):993. https://doi.org/10.3390/app10030993
Chicago/Turabian StylePhromma, Siripond, Tuksadon Wutikhun, Panita Kasamechonchung, Tippabust Eksangsri, and Chaweewan Sapcharoenkun. 2020. "Effect of Calcination Temperature on Photocatalytic Activity of Synthesized TiO2 Nanoparticles via Wet Ball Milling Sol-Gel Method" Applied Sciences 10, no. 3: 993. https://doi.org/10.3390/app10030993