Investigation of Rain-On-Snow Floods under Climate Change


1
Faculty of Engineering, Ondokuz Mayis University, Samsun 55139, Turkey
2
Faculty of Civil and Geodetic Engineering, University of Ljubljana, Jamova 2, 1000 Ljubljana, Slovenia
3
Slovenian Environment Agency, Vojkova 1b, 1000 Ljubljana, Slovenia
*
Author to whom correspondence should be addressed.
Appl. Sci. 2020, 10(4), 1242; https://doi.org/10.3390/app10041242
Submission received: 15 January 2020
/
Revised: 7 February 2020
/
Accepted: 9 February 2020
/
Published: 12 February 2020
(This article belongs to the Special Issue Hydrologic and Water Resources Investigations and Modeling)
Abstract
:Rain-on-snow (ROS) floods can cause economic damage and endanger human lives due to the compound effect of rainfall and snowmelt, especially under climate change. In this study, possible future changes of seasonality, magnitude and frequency characteristics of ROS floods were investigated for the selected catchments in Slovenia, Europe. For this purpose, five global/regional climate models (GCM/RCM) combinations were applied using the RCP4.5 climate scenario for the period 1981–2100. To determine ROS floods’ characteristics in the future, a lumped conceptual hydrological model Génie Rural à 6 paramètres Journalier (GR6J) with snow module CemaNeige was applied. The results indicate that the number of ROS floods could increase in the future. Moreover, also the magnitudes of extreme ROS floods could increase, while a slight decrease in the median values of ROS flood magnitudes was observed. The strength of seasonality for a high-altitude catchment could decrease in the future. A slight shift in the average ROS floods’ timing could be expected. Furthermore, a catchment located in a temperate continental climate could have a different response to the climate change impact in comparison to a catchment located in a mountain climate with alpine characteristics. Additionally, differences among investigated climate models show a large variability.
1. Introduction
Floods that are caused by the so-called rain-on-snow (ROS) events can lead to major economic loss, can endanger human lives and require efficient water management. The combined effect of snowmelt and rainfall can lead to higher flood magnitudes compared to only snowmelt or rain-induced floods. More specifically, in case of a ROS event moderate rainfall amounts can lead to significant runoff because during a rainfall event latent heat input and long wave radiation can speed up snowmelt, or antecedent snowmelt can lead to saturation of large areas, which increases runoff [1]. This means that ROS events can be classified as compound events. Additionally, climate change is expected to impact various hydro-meteorological variables and processes such as air temperature or temporal and spatial rainfall distribution. These changes can also affect the runoff regime, flood characteristics, and water management policies. However, it is still not clear how will climate-change-induced alterations influence ROS events due to their compound nature.
It can be expected that the runoff regime will have a different dynamics that could lead to more frequent and extreme flood events due to climate change. Numerous studies have been carried out to assess the possible impact of climate change on the hydrological regime [2]. In [3], it was stated that global flood risk could rise by 187% due to the climate change impact compared to the situation without climate change. ROS floods’ frequency could increase in the future due to the ascending trend in air temperature and the changed rainfall regime. In this regard, flood risk changes have been examined by taking into consideration climate change scenarios in various parts of the world (e.g., [4,5,6,7]). Future shifts in extreme flow regimes in Alpine regions were investigated by [8], where the results show that changes in extreme high-flow regimes for rainfall-dominated regions are different than those in melt-dominated regions. They reported an increase in the maximum discharge in rainfall-dominated regions in the future, whereas in melt-dominated regions the situation could be opposite. The effects of climate change on climate variables such as precipitation, snowfall, and air temperature, and hazards such as floods and droughts were investigated by [5] in the Alps in Europe. They found that the increasing trend in air temperature could lead to significant decreases in the snow amount and, given the climate projections for the 21st century, an increase in the frequency of natural hazards such as floods. In [9], the ROS floods in the Sitter basin in Switzerland were examined. The results revealed that the number of ROS events could increase due to the increase in air temperature by about 2–4 °C. In this regard, they stated that ROS events could cause severe floods in the future. In the study by [10], the hydrological variables were simulated using regional climate models (RCMs) and the influence of bias correction on the future (2071–2100) projection of hydrological extreme events over Europe was investigated. The authors found that the flood occurrence interval in most European rivers would decrease, whereas it would increase in the northeast part because of the warmer winter and shorter snow period.
Because an increase in the number of extreme flood events has been observed over the last decades in Slovenia [11], while climate change projections predict an increase in the air temperature for all future periods in Slovenia [12], we could expect also changes in the occurrence of ROS events. Therefore, the main aim of this study was to investigate the climate change impact on the frequency, magnitude, and seasonality of ROS floods in the selected catchments located in various climate regions in Slovenia.
2. Materials and Methods
2.1. Selected Catchments and Data Used
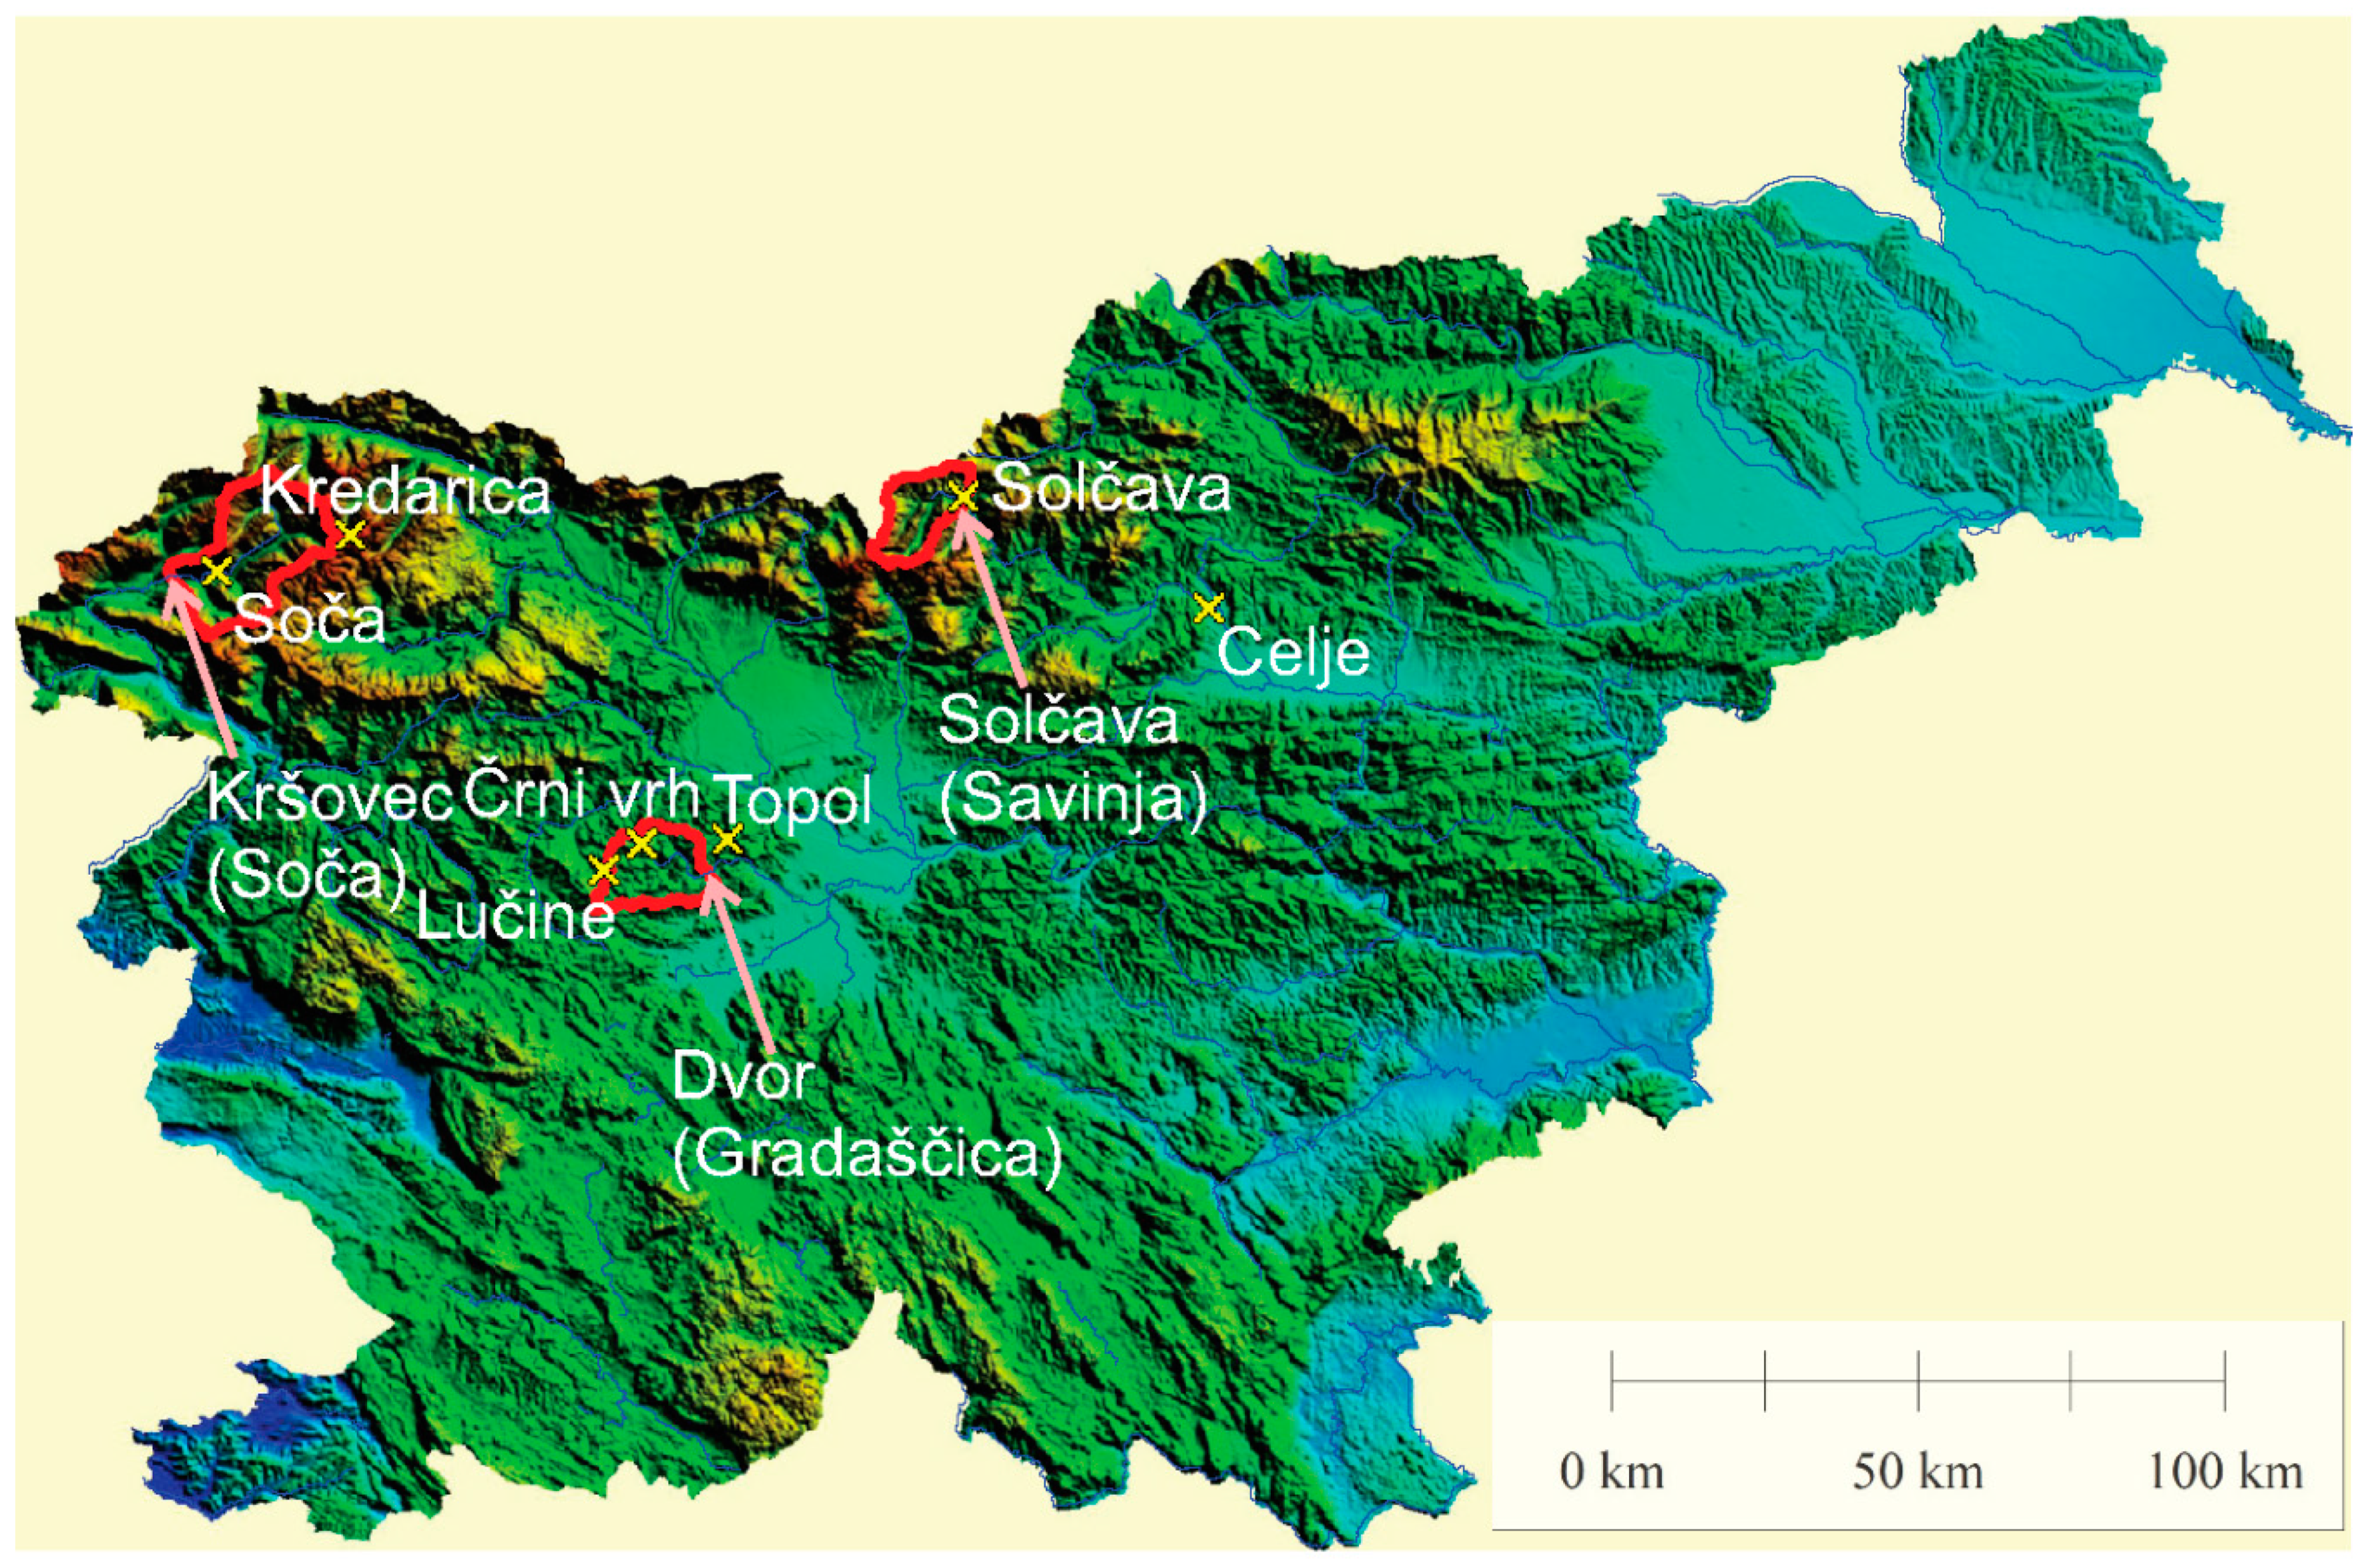
In order to investigate climate change impacts on ROS floods we selected three meso-scale catchments located in various climate regions in Slovenia (Figure 1). The basic characteristics of these catchments are shown in Table 1. A 20-m resolution digital elevation model was used to calculate mean and maximum catchment elevations. Two of the case studies, namely the Soča and the Savinja, are typical high-altitude alpine catchments where snow is present about 6–9 months per year. We also selected the Gradaščica River catchment where snow is generally present for a shorter period (i.e., 2–3 months per year) but still plays an important role in the runoff generation. The Gradaščica River catchment is located in temperate continental climate whereas the Soča River and Savinja River catchments are located in mountain climate (e.g., [13]).
Calibration and validation periods of the hydrological modelling are shown in Table 1 and were defined based on the availability of daily discharge, rainfall, and air temperature data. The goal of a data series division was to have 10 years for the validation period whereas the calibration period was defined based on the discharge data availability. Table 1 shows the basic descriptive statistics of daily discharge data used for the calibration and validation periods of all three considered catchments. One can notice that maximum and mean specific discharge values are the highest for the Soča River catchment mainly because this part of Slovenia has the highest annual rainfall amounts (i.e., more than 3000 mm). Other two catchments receive less rainfall than the Soča River catchment. For each considered catchment, the closest meteorological station with available rainfall (P) and air temperature (T) data was selected. For the Soča case study, Kredarica (altitude 2513 m; P and T available) and Soča (altitude 485 m; P available) stations were used. For the Savinja catchment, Solčava (altitude 658 m; P available) and Celje (altitude 242 m; T available) stations were used. For the Gradaščica case study, Črni vrh (altitude 827 m; P available), Lučine (altitude 639 m; P available), and Topol (altitude 662 m; T available) stations were used. To consider the impact of the difference between the meteorological station altitude and the mean catchment elevation we also considered the adiabatic lapse rate effect where a compensation of 7 °C/km was applied. We applied this procedure for the Soča River and Savinja River catchments whereas the Gradaščica River catchment has roughly the same elevation as that at the Topol meteorological station, therefore, the correction was not needed.
2.2. Hydrological Model
In this study we applied the lumped conceptual hydrological model named Génie Rural à 6 paramètres Journalier (GR6J) with snow module CemaNeige (e.g., [14,15,16,17,18]). The CemaNeige GR6J model version is implemented in airGR package [19,20] of R software [21], which was applied in this study. The GR6J model version without the snow module only requires rainfall and evapotranspiration data to calculate runoff using six parameters (e.g., [14]). The equation proposed by [22] was applied to calculate the potential evapotranspiration used as an input to the hydrological model in this study. In addition, the CemaNeige snow module requires also air temperature data and the catchment hypsometric curve and adds two more parameters to the GR6J model version (i.e., eight parameters in total). In [14,23], detailed descriptions of the GR4J and GR6J model versions with equations and model structures were provided. Based on the catchment hypsometric curve, the CemaNeige snow module divides a catchment into five elevation zones that have equal areas. The snow module only uses precipitation and air temperature data as an input [15,16]. Precipitation and air temperature data are extrapolated for each elevation zone and the differentiation between solid and liquid precipitation is carried out. Each elevation zone has one conceptual store that represents the snow cover, and only solid precipitation is used as an input to this store [15,16]. Furthermore, the transfer function is used that enables the model to calculate the melted water from the conceptual snow store. This water is added to the liquid part of the precipitation and then further for runoff calculations [15,16]. In [15,16], a detailed description of the CemaNeige snow module was provided, which was also used in this study together with the GR6J model version. The method proposed by [24], which is also implemented in the airGR package, was applied to calibrate the hydrological model [19,20]. In order to evaluate the calibration and validation performance of the hydrological model, the root mean square error (RMSE) and Nash–Sutcliffe efficiency (NSE) criteria [25] were used, which are, beside the visual inspection, the most widely used model performance criteria in hydrological applications [26].
2.3. Climate Change Scenarios
The pre-processing of climate change data used in this study was carried out in the scope of the project entitled The Estimation of the Average and Extreme Meteorological and Hydrological Conditions in Slovenia Over the 21st Century, by the Slovenian Environment Agency [12]. Under this project the bias-corrected regional climate model projections ensemble from the EURO-CORDEX database was analyzed [27]. The following combinations of the global/regional climate models (GCM/RCM) were used: CNRM-CM5-LR/CCLM4-8-17 (Case 1), MPI-ESM-LR/CCLM4-8-17 (Case 2), EC-EARTH/HIRHAM5 (Case 3), IPSL-CM5A-MR/WRF331F (Case 4), and MPI-ESM-LR/RCA4 (Case 5). The focus was only on the moderately optimistic scenario RCP4.5. High-resolution models were used in this study (i.e., resolution approx. 140 km2). Firstly, the observed historical data for the baseline period (i.e., 1981–2010) were interpolated to the same grid as that used by the RCM models. In the next step, bias-correction was applied to model data for each variable (i.e., precipitation and air temperature) separately. Quantile mapping was applied as a method for precipitation bias-correction using the methodology proposed by [28] and qmap package in combination with R software [21]. Additionally, to obtain trends in temperature series the quantile delta mapping (QDM) method was applied using the QDM function available in the MBC package [29]. The same data were also used for investigating the impact of climate change on low- and high-flow characteristics of the karst catchments in Slovenia [30].
The period from 1981 to 2100 was selected to investigate the potential future changes in ROS floods’ characteristics. The 1981–2010 period was defined as a baseline period and future projections were analyzed for three 30-year periods: 2011–2040, 2041–2070, and 2071–2100.
The projection results for the air temperature series in Slovenia predict an increase for all future periods (i.e., 2011–2100), where the increase is generally lower for the period 2011–2040 (i.e., up to 1 °C compared to the baseline period) compared to periods 2071–2100 and 2041–2070 (up to 2–3 °C compared to the baseline period) [12]. The spring and winter temperature increase could be more pronounced than the summer and autumn increase [12]. The projection results demonstrate a small difference in the projected temperature increase among the investigated catchments of this study.
Furthermore, projections indicate that precipitation could change from −5% to 5% for the 2011–2040 period compared to the baseline period. A potential increase for the precipitation amount for the 2041–2070 and 2071–2100 periods could be in the range between 5% and 20% compared to the baseline period [12]. Moreover, winter precipitation could increase in the future while, on the other hand, summer precipitation could decrease in the future, especially for the 2011–2040 and 2041–2070 periods [12].
2.4. Selection of the Rain-On-Snow Floods and Methods Used for the Analysis
ROS floods were identified using the discharge threshold that was determined depending on the information about actual flooding at the location of the selected discharge gauging stations. This information was provided by the Slovenian Environment Agency that is responsible for flood forecasting in Slovenia and uses these threshold values for issuing flood warnings. When the discharge at a particular location reaches the threshold value, the yellow warning is issued, which indicates that flooding can occur. We defined flood events based on the selected threshold values at individual discharge gauging stations. Because the range of discharge values using climate projections is not exactly the same as the range for the historical discharge data, we used the discharge-return period relationship using the historical data to define the corresponding return period (T) at which flooding occurs. This relationship was defined using the generalized extreme value (GEV) distribution and by applying the L-moments method for parameter estimation, which means that the flood-frequency analysis (FFA) procedure was performed. A more detailed description of the procedure can be found in, e.g., [30]. Furthermore, the FFA was also carried out using simulated discharge values by applying the climate projections. Based on the return period value (T) defined in the previous step (i.e., historical discharge data) we defined new corresponding discharge thresholds for all three case studies considered. In order to extract only ROS floods, the criteria for snow melting were defined, i.e., only flood events with melt values in any of the CemaNeige GR6J elevation zones larger than 0.1 mm/day were selected. Thus, ROS floods were defined based on the two criteria (i.e., snow melting and discharge above the threshold). Additionally, we checked if high discharge values were associated with rainfall events that might have taken place in the range of a few days before the high discharge value. In the case when ROS-flood duration was longer than one day, only the day with a maximum discharge was considered for further analysis.
The methodology proposed by [31] was applied in order to investigate seasonal characteristics of ROS floods. An example of the application of the selected methodology can be found in [32,33]. We calculated the mean direction of the flood date (MD) (i.e., day of the year) using all ROS floods in the selected period for each case study and four considered periods. Moreover, based on all ROS floods in a specific period, strength of seasonality r [0,1] was calculated.
3. Results and Discussion
3.1. Model Calibration and Validation
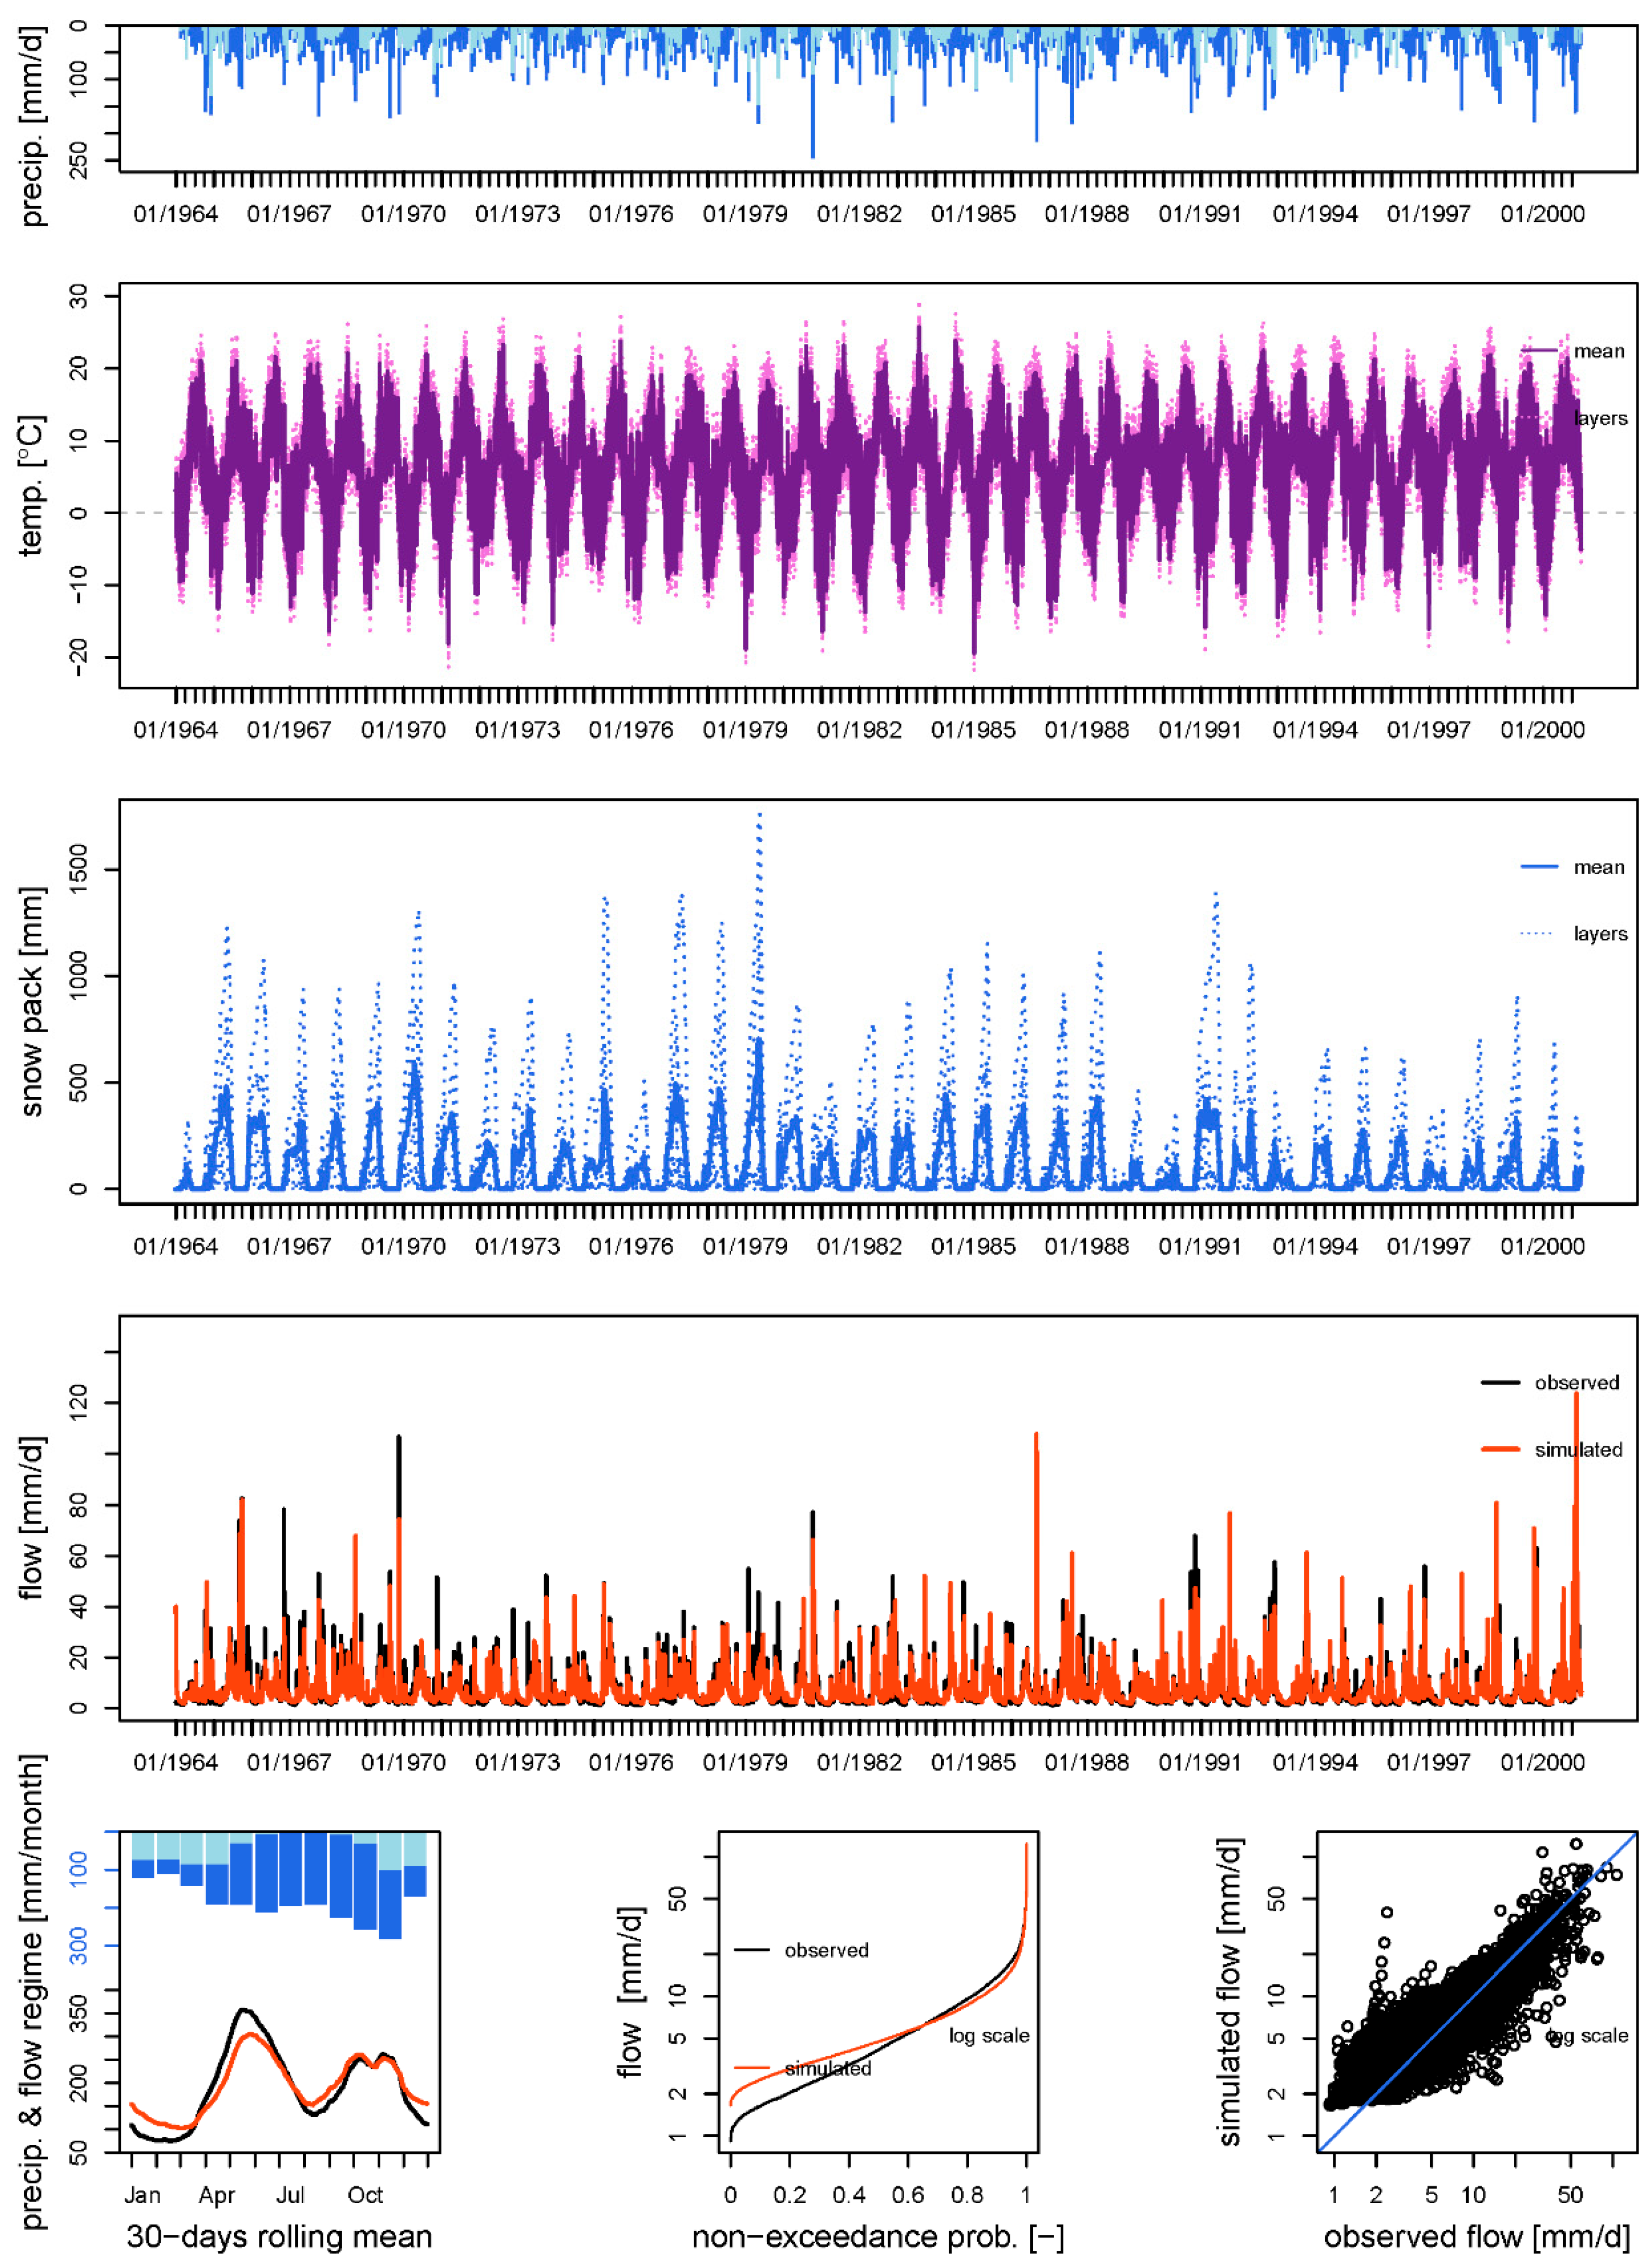
As a first step of the study the CemaNeige GR6J model was calibrated and then validated using historical data. The RMSE results for the calibration period were 3.1, 2.6, and 1.5 mm for the Soča, Savinja, and Gradaščica case studies, respectively. The RMSE results for the validation period were 2.6, 1.9, and 2.0 mm for the Soča, Savinja, and Gradaščica case studies, respectively. The NSE results for the calibration period were 0.77, 0.42, and 0.75 for the Soča, Savinja and Gradaščica case studies, respectively. The NSE results for the validation period were 0.77, 0.44, and 0.77 for the Soča, Savinja, and Gradaščica case studies, respectively. According to the NSE criterion results, the best modelling performance for the calibration period was obtained for the Soča River catchment. A similar performance was obtained also for the Gradaščica River case study, whereas a worse performance according to the NSE criterion for the calibration period was obtained for the Savinja River case study. For the validation period, the NSE criterion results show a similar situation as for the calibration period, whereas RMSE revealed the best performance for the Savinja and Gradaščica rivers case studies and slightly worse results for the Soča River. Other results for the Savinja River catchment are not shown, based on the suggestion of Moriasi et al. [34], who argued that NSE values below 0.5 using the daily time step can be regarded as an unsatisfactory modelling result. An example of runoff modelling for the calibration period for the Soča River case study is presented in Figure 2. Visual inspection of modelling performance using the 30-day rolling mean, the non-exceedance probability, and a scatter plot showing simulated and observed flow data (e.g., lower panel of the Figure 2) for the Soča and Gradaščica case studies returns satisfactory results.
3.2. Climate Change Scenarios
After the calibration and validation of the model, five bias-corrected GCM/RCM climate projections for the RCP4.5 scenario were applied to the CemaNeige GR6J hydrological model. Air temperature and precipitation projections were used as an input. Air temperature data were also used to calculate potential evapotranspiration using the equation proposed by [22].
3.2.1. Seasonality
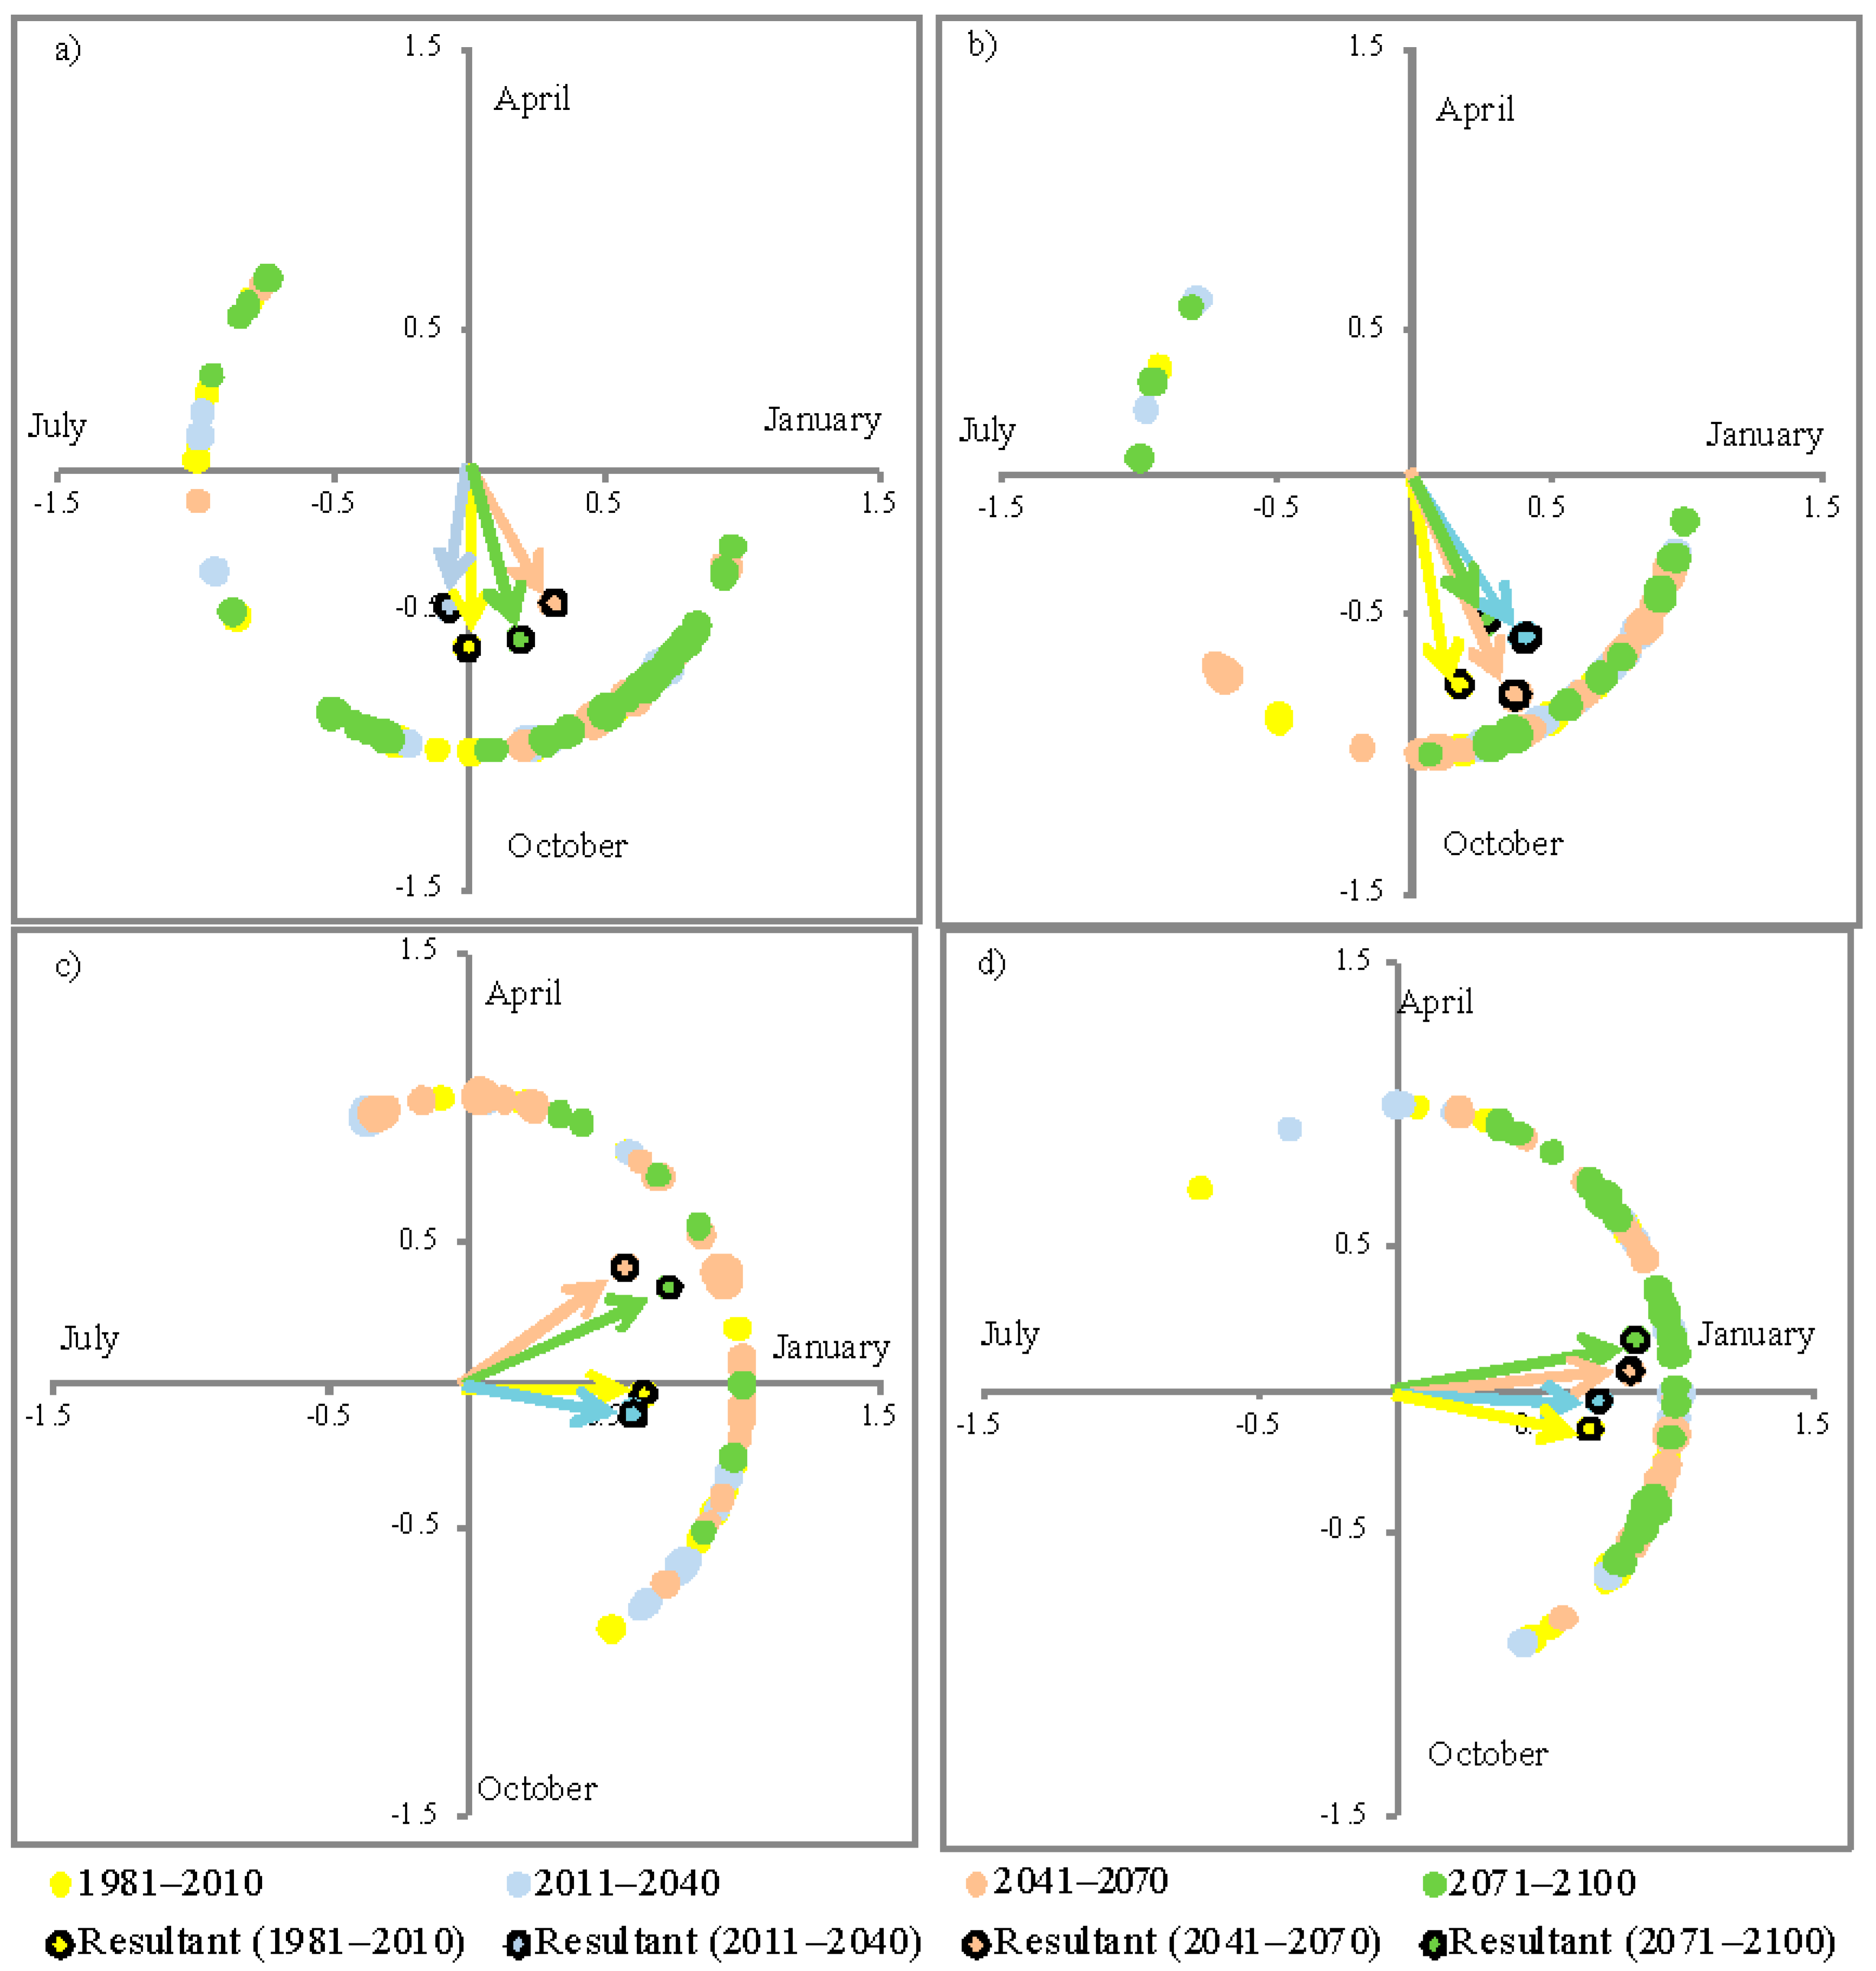
As a first step of the study, we investigated changes in the seasonality of the ROS floods due to the climate change. For this purpose, we applied the methodology shown in Section 2.4 where we investigated how the direction (i.e., day) of ROS floods and the strength of seasonality change. Figure 3 shows a few randomly selected examples of the seasonality characteristics of ROS floods for two selected case studies and for some GCM/RCM models. Circles of different colors indicate ROS floods that occurred in different periods from 1981 to 2100. Based on all ROS floods in a specific period we also calculated the resultant (i.e., mean) event. Results demonstrate that for the Soča River case study most of the events occur in autumn and a few of them also in spring (Figure 3). For the Gradaščica River case study, the situation is a bit different because ROS floods are occurring from October to April and many events also occur in the winter period (Figure 3). In Slovenia, floods usually occur in autumn period, which was also shown by [31] who investigated flood characteristics of the Litija gauging station on the Sava River. A similar flood timing can also be found in neighboring countries such as Austria. For example, in [35] it was stated that in central and southern parts of Austria extreme flood events mostly occur in autumn. In [36], it was pointed out that largest floods occur in autumn in Carinthia (Southern Austria) and that strength of seasonality (r) is generally around 1. On the other hand, seasonality is less explicit for the Litija station on the Sava River [31]. Based on the selected five GCM/RCM models we also calculated median values for four investigated 30-year periods. The median values of strength of seasonality r for the 1981–2010 (i.e., baseline) period were 0.77 and 0.70 for the Soča and Gradaščica case studies, respectively. Table 2 shows relative differences in the strength of seasonality compared to the baseline period for all three considered catchments. One can notice that for the Soča case study the strength of seasonality could decrease in the future, which could indicate a larger diversity in the timing of ROS floods. A similar conclusion can be made for the 2011–2040 period for the Gradaščica River case study while for the 2041–2070 and 2071–2100 periods seasonality could be more explicit. One can also note that the changes are in the range of 15% (Table 2). For the Soča River case study, the median of the MD for the baseline period is in mid-October. Due to climate change, we could expect that the occurrence of the majority of ROS floods could shift by a few weeks towards the beginning of November (Table 2). Moreover, for the Gradaščica River case study the median value of the MD for the baseline period indicates that ROS floods are the most frequent in end-December. We can conclude that climate change in case of the two considered catchments could in general lead to a somewhat different seasonal occurrence of ROS floods (i.e., a few weeks later) and that ROS floods could occur over a larger time span of the year, which could lead to a smaller strength of seasonality. The same climate-change-induced shifts in flood timings in the Balkan region were also reported by [37]. However, stronger seasonality in the future can be observed for some cases shown in Figure 3.
Moreover, there are some differences among the investigated cases (i.e., GCM/RCM models) with respect to the number and seasonal timing of ROS floods (Figure 3). For example, for the baseline period for the Soča River case study, strength of seasonality r could vary from 0.53 to 0.82 with a median value of 0.77. Similar behavior can also be observed for the MD variable, which is in the range from 248 (i.e., start of September) to 298 (i.e., end of October) with a median value of 286 (i.e., mid-October). Similar conclusions can be made for other periods and the other case study where the difference among investigated cases can be more than 50%.
3.2.2. Frequency and Magnitude
In the next step of this study, we also investigated how the frequency (i.e., number) and magnitude of ROS floods could change in the future. The methodology described in Section 2.4 was used to define ROS floods. The median values calculated based on the results of five GCM/RCM models of ROS floods for the period 1981–2010 were 13 and 15 events for the Soča and Gradaščica River case studies, respectively. Table 2 shows the relative difference in the number of ROS floods (i.e., median value of all five models) for the periods 2011–2040, 2041–2070, and 2071–2100 compared to the baseline period. One can notice that generally we could expect an increase in the number of ROS floods in the future. This increase is the highest for the period 2041–2070 for both considered catchments. The only exception is the period 2011–2040 when a slight decrease was observed compared to the baseline period for the Gradaščica River case study (Table 2). Similar results were also obtained by [5,9], who found that the frequency of natural hazards and ROS floods could increase in the future. Additionally, similarly as for the seasonality investigation there are large differences among the five investigated cases.
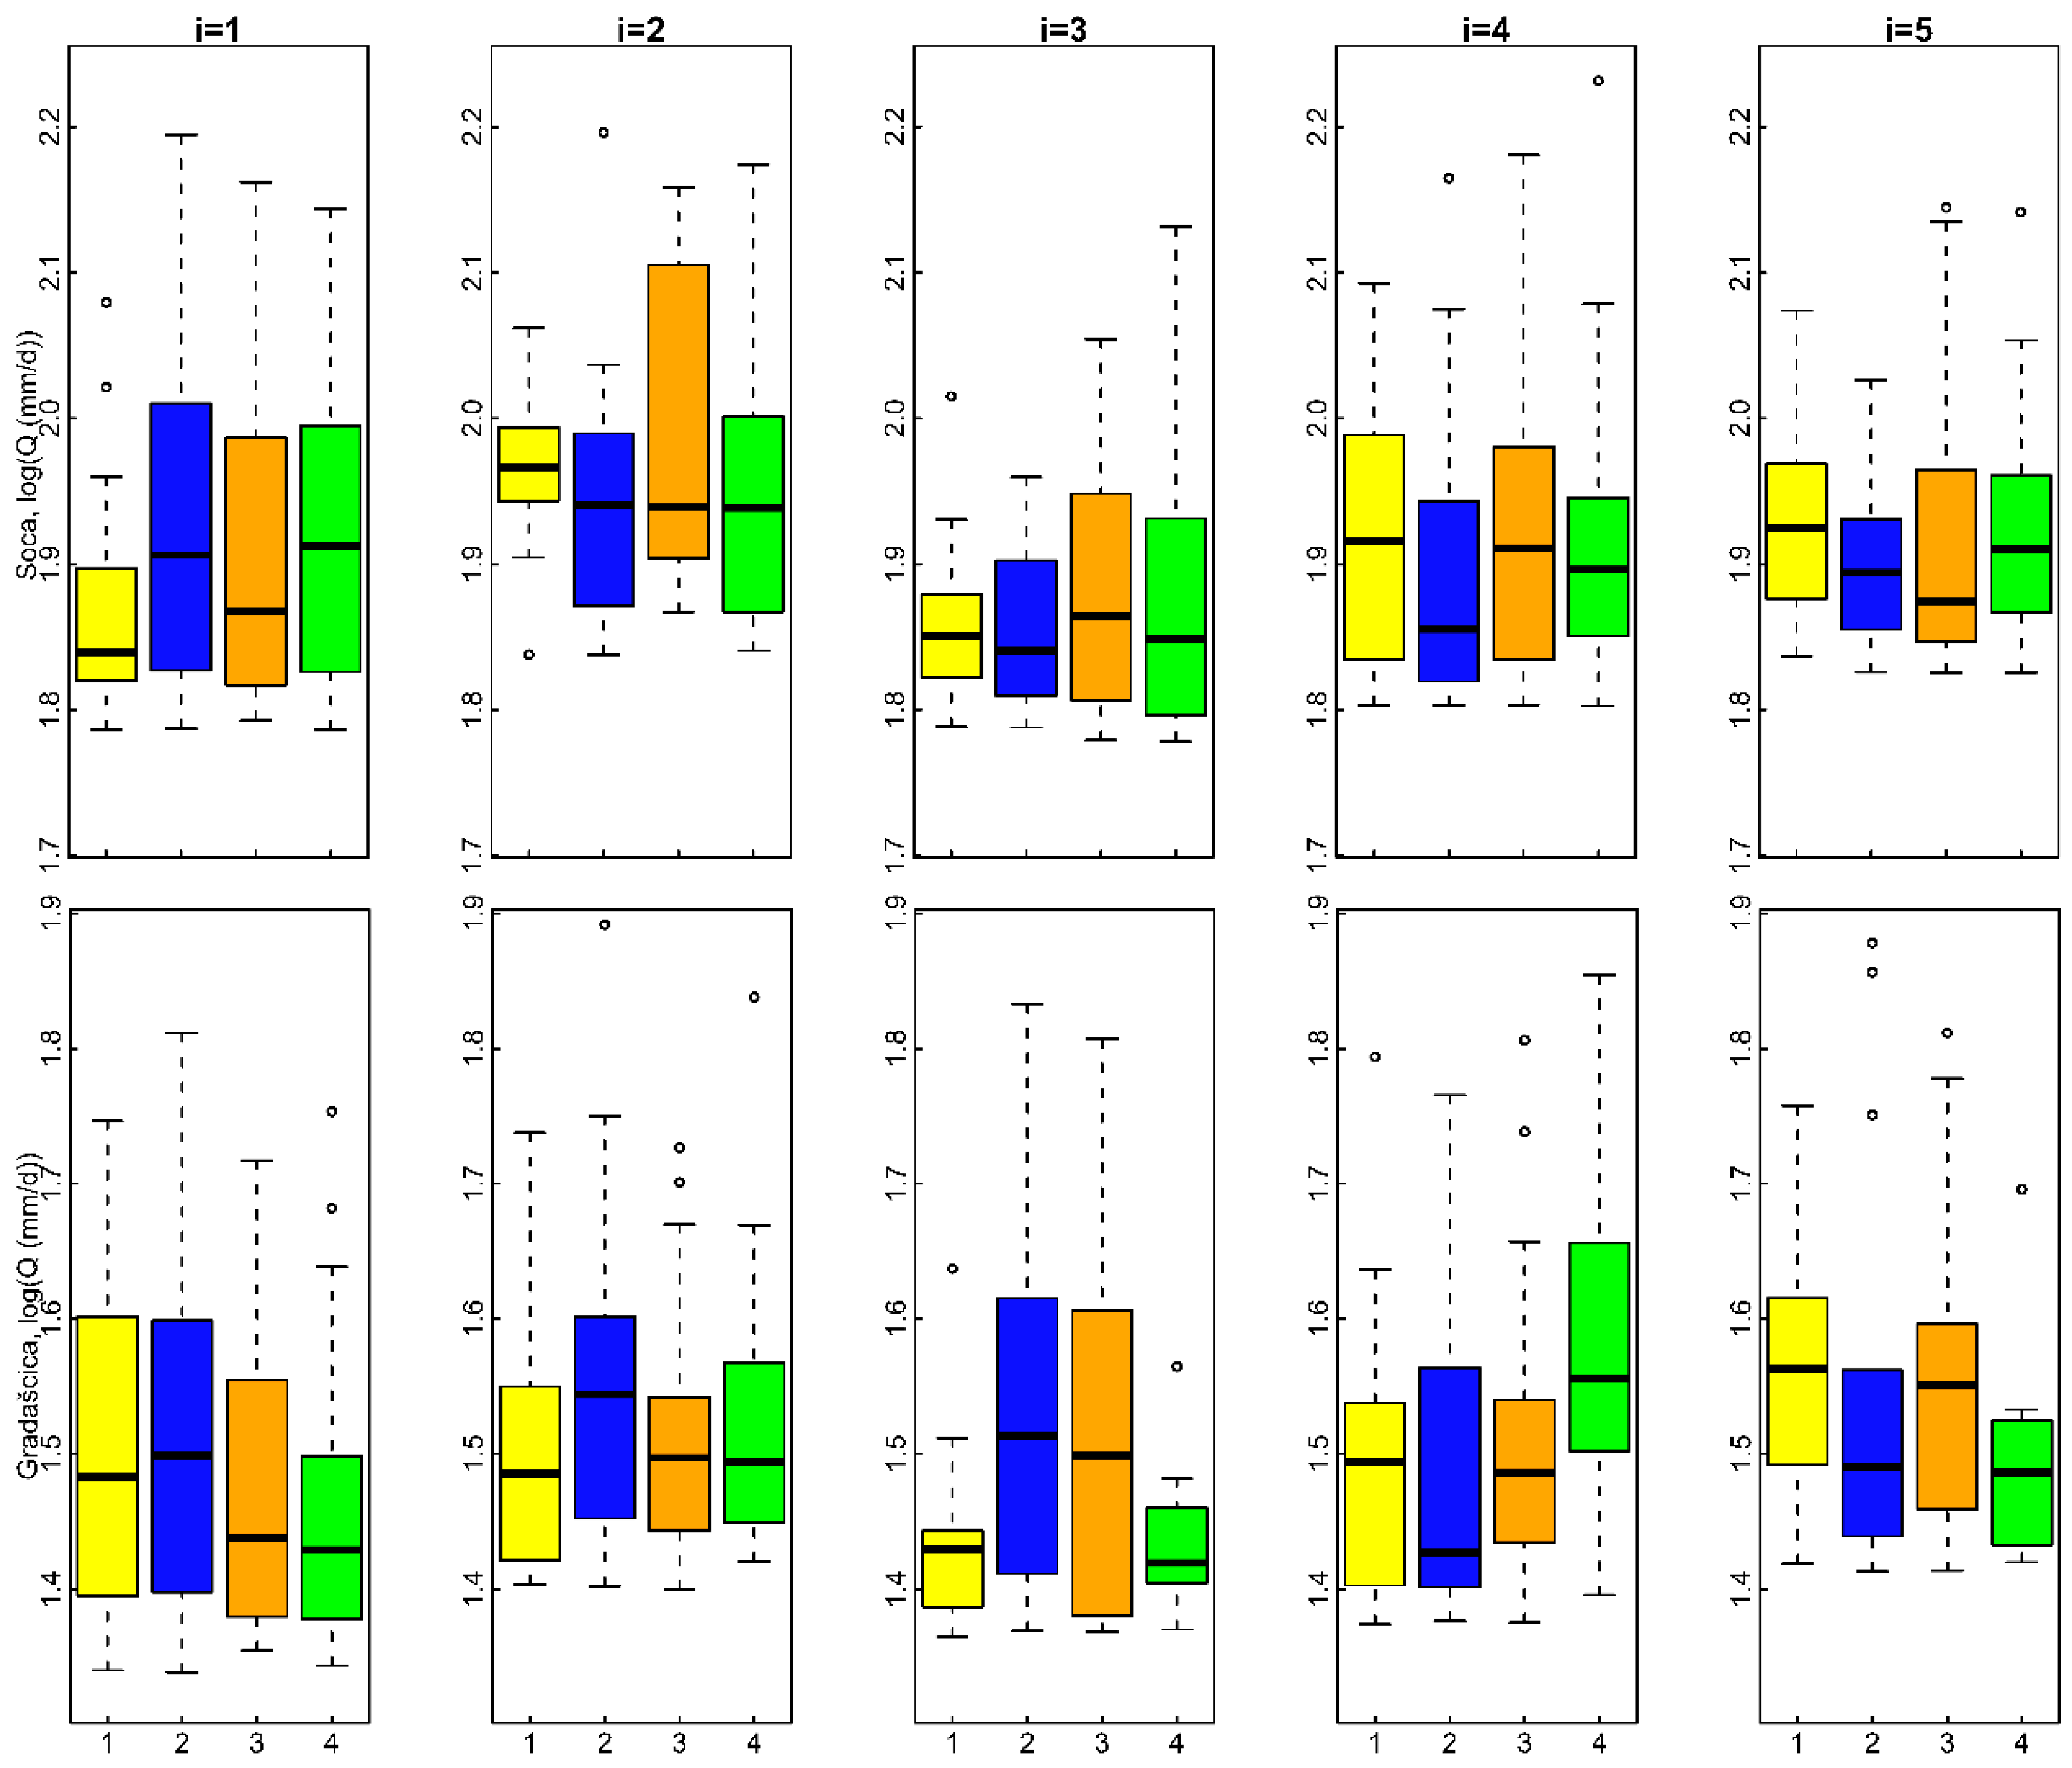
Changes in ROS-flood magnitudes were investigated in the next step. Figure 4 shows box-plots of ROS-flood magnitudes (Q) for different 30-year periods for both selected case studies. According to Figure 4, it can be understood that a range between the maximum and minimum discharge values seems to be higher for the future periods (2011–2040, 2041–2070, and 2071–2100) compared to the baseline period (1981–2010) for the Soča river for all GCM/RCM models. If we compare median values for the Soča catchment, one model (i.e., Case 1) predicts an increase in ROS floods magnitudes. On the other hand, three models (i.e., Cases 2, 4, and 5) predict smaller values in the future. The median values of all ROS floods for all five cases shown in Table 2 indicate a decrease in the ROS-flood magnitudes in the Soča River catchment in the future compared to the baseline period. On the other hand, it is true that the most extreme ROS-flood magnitudes could increase in the future (Figure 4). Similar results were also obtained by [38]. Similarly, as for the Soča River catchment all models predict that the magnitudes of the most extreme ROS floods could increase. For the Gradaščica River, which has temperate continental climate characteristics, the magnitude of ROS floods seems to be higher in the 2011–2040 compared to the baseline period for the Cases 1, 2, and 3. Results shown in Table 2 indicate that median values of ROS-flood magnitudes for the Gradaščica catchment could slightly increase in the future. However, in other future periods, ROS-flood magnitudes have a changing pattern in comparison to the baseline period for each climate model.
4. Conclusions
Climate change can lead to changes in the characteristics of ROS floods in the future in many parts of the world. In this regard, we investigated the possible changes in seasonality, magnitude, and frequency of ROS floods in the future for the two selected catchments located in different climate regions in Slovenia. The CemaNeige GR6J lumped conceptual model was applied for the simulation of ROS floods in combination with the results of five GCM/RCM models for the RCP4.5 climate scenario. Based on the presented results the following conclusions can be made:
- -
- For catchments located at higher elevations (i.e., Soča) with mountain climate characteristics, the strength of seasonality of ROS events could decrease in the future (i.e., based on the median result of five GCM/RCM models). This means that ROS floods may occur more frequently in the periods of the year in which in the past we only had few events.
- -
- A shift (i.e., one or two weeks) in the time of occurrence (MD) of ROS floods could be expected for both investigated catchments in the future (i.e., based on the median result of five GCM/RCM models).
- -
- In general, more ROS floods can be expected in the future. Moreover, the magnitudes of the most severe ROS floods could increase. However, median values indicate a slight decrease in ROS-flood magnitudes, which could be attributed to the fact that the number of small magnitude ROS floods would also increase.
- -
- Results indicate a high variability among the five investigated GCM/RCM models, which could be related to the high uncertainty. Therefore, additional investigation into ROS-flood characteristics in the future is needed to validate the aforementioned conclusions. This means that more studies should be conducted in similar environments. Along with the changes in the meteorological conditions, which are incorporated in the GCM/RCM models, one could also expect other changes in the future, such as land-use changes, which also have an effect on the elements of the water cycle that are related to the ROS-mechanism generation.
Author Contributions
N.B. and M.Š. carried out the conceptualization, C.S. performed the formal analysis (i.e., hydrological modelling), and A.M. prepared the input data (i.e., GCM/RCM). All authors contributed to writing and editing of the manuscript. All authors have read and agreed to the published version of the manuscript.
Funding
The results of the study are part of the research program P2-0180 Water Science and Technology, and Geotechnical Engineering: Tools and Methods for Process Analyses and Simulations, and Development of Technologies, which is financed by the Slovenian Research Agency (ARRS). The first author (C.S.) would like to acknowledge the financial support by the COST CA17109 DAMOCLES action through the Short Term Scientific Mission (STSM) grant. N.B. would also like to acknowledge the funding by the World Federation of Scientists (WFS).
Acknowledgments
Authors would like to acknowledge Slovenian Environment Agency (ARSO) for data provision. The critical and useful comments of anonymous reviewers helped to improve this manuscript, for which the authors are very grateful.
Conflicts of Interest
The authors declare no conflicts of interest.
References
- Merz, R.; Blöschl, G. A process typology of regional floods. Water Resour. Res. 2003, 39, 1340. [Google Scholar] [CrossRef]
- Kour, R.; Patel, N.; Krishna, A.P. Climate and hydrological models to assess the impact of climate change on hydrological regime: A review. Arab. J. Geosci. 2016, 9. [Google Scholar] [CrossRef]
- Arnell, N.W.; Gosling, S.N. The impacts of climate change on river flood risk at the global scale. Clim. Chang. 2016, 134, 387–401. [Google Scholar] [CrossRef] [Green Version]
- Surfleet, C.G.; Tullos, D. Variability in effect of climate change on rain-on-snow peak flow events in a temperate climate. J. Hydrol. 2013, 479, 24–34. [Google Scholar] [CrossRef] [Green Version]
- Gobiet, A.; Kotlarski, S.; Beniston, M.; Heinrich, G.; Rajczak, J.; Stoffel, M. 21st century climate change in the European Alps—A review. Sci. Total Environ. 2014, 493, 1138–1151. [Google Scholar] [CrossRef]
- Morán-Tejeda, E.; López-Moreno, J.I.; Stoffel, M.; Beniston, M. Rain-on-snow events in Switzerland: Recent observations and projections for the 21st century. Clim. Res. 2016, 71. [Google Scholar] [CrossRef]
- Kundzewicz, Z.W.; Krysanova, V.; Dankers, R.; Hirabayashi, Y.; Kanae, S.; Hattermann, F.F.; Huang, S.; Milly, P.C.D.; Stoffel, M.; Driessen, P.P.J.; et al. Differences in flood hazard projections in Europe–their causes and consequences for decision making. Hydrol. Sci. J. 2017, 62, 1–14. [Google Scholar] [CrossRef] [Green Version]
- Brunner, M.I.; Farinotti, D.; Zekollari, H.; Huss, M.; Zappa, M. Future shifts in extreme flow regimes in Alpine regions. Hydrol. Earth Syst. Sci. 2019, 23, 4471–4489. [Google Scholar] [CrossRef] [Green Version]
- Beniston, M.; Stoffel, M. Rain-on-snow events, floods and climate change in the Alps: Events may increase with warming up to 4 C and decrease thereafter. Sci. Total Environ. 2016, 571, 228–236. [Google Scholar] [CrossRef]
- Rojas, R.; Feyen, L.; Dosio, A.; Bavera, D. Improving pan-European hydrological simulation of extreme events through statistical bias correction of RCM-driven climate simulations. Hydrol. Earth Syst. Sci. 2011, 15. [Google Scholar] [CrossRef] [Green Version]
- Kobold, M.; Dolinar, M.; Frantar, P. Changes of water regime due to the climate change and anthropogenic influences. In Proceedings of the First Conference on Waters in Ljubljana, Ljubljana, Slovenia, 22 March 2012; pp. 7–22. (In Slovenian). [Google Scholar]
- Bertalanič, R.; Dolinar, M.; Honzak, L.; Lokovšek, N.; Medved, A.; Vertačnik, G.; Vlahovič, Ž. Climate Change Projections for Slovenia over the 21st Century (Temperature and Precipitation Summary); Slovenian Environment Agency: Ljubljana, Slovenia, 2019. Available online: http://www.meteo.si/uploads/probase/www/climate/text/en/publications/OPS21_brosura_ENG.pdf (accessed on 10 February 2019).
- Dolšak, D.; Bezak, N.; Šraj, M. Temporal characteristics of rainfall events under three climate types in Slovenia. J. Hydrol. 2016, 541, 1395–1405. [Google Scholar] [CrossRef]
- Pushpalatha, R.; Perrin, C.; Le Moine, N.; Mathevet, T.; Andreassian, V. A downward structural sensitivity analysis of hydrological models to improve low-flow simulation. J. Hydrol. 2011, 411, 66–76. [Google Scholar] [CrossRef]
- Valery, A.; Andreassian, V.; Perrin, C. As simple as possible but not simpler: What is useful in a temperature-based snow-accounting routine? Part 1—Comparison of six snow accounting routines on 380 catchments. J. Hydrol. 2014, 517, 1166–1175. [Google Scholar] [CrossRef]
- Valery, A.; Andreassian, V.; Perrin, C. As simple as possible but not simpler: What is useful in a temperature-based snow-accounting routine? Part 2—Sensitivity analysis of the cemaneige snow accounting routine on 380 catchments. J. Hydrol. 2014, 517, 1176–1187. [Google Scholar] [CrossRef]
- Sezen, C.; Bezak, N.; Šraj, M. Hydrological modelling of the karst Ljubljanica River catchment using lumped conceptual model. Acta Hydrol. 2018, 31, 87–100. [Google Scholar] [CrossRef]
- Sezen, C.; Bezak, N.; Bai, Y.; Šraj, M. Hydrological modelling of karst catchment using lumped conceptual and data mining models. J. Hydrol. 2019, 576, 98–110. [Google Scholar] [CrossRef]
- Coron, L.; Thirel, G.; Delaigue, O.; Perrin, C.; Andreassian, V. The suite of lumped GR hydrological models in an R package. Environ. Model. Softw. 2017, 94, 166–171. [Google Scholar] [CrossRef]
- Coron, L.; Delaigue, O.; Thirel, G.; Perrin, C.; Michel, C. airGR: Suite of GR Hydrological Models for Precipitation-Runoff Modelling. 2019 R Package Version 1.2.13.16. Available online: https://CRAN.R-project.org/package=airGR/ (accessed on 20 March 2019).
- R Core Team. R: A Language and Environment for Statistical Computing; R Foundation for Statistical Computing: Vienna, Austria, 2013; Available online: https://www.R-project.org/ (accessed on 4 February 2019).
- Oudin, F.; Hervieu, F.; Michel, C.; Perrin, C.; Andreassian, V.; Antcil, F.; Loumagne, C. Which potential evapotranspiration input for a lumped rainfall-runoff model? Part 2—Towards a simple and efficient potential evapotranspiration model for rainfall-runoff modelling. J. Hydrol. 2005, 303, 290–306. [Google Scholar] [CrossRef]
- Perrin, C.; Michel, C.; Andreassian, V. Improvement of a parsimonious model for streamflow simulation. J. Hydrol. 2003, 279, 275–289. [Google Scholar] [CrossRef]
- Michel, C. Hydrologie Appliquée Aux Petits Bassins Ruraux, Hydrology Handbook; Cemagref: Antony, France, 1991. (In French) [Google Scholar]
- Nash, J.E.; Sutcliffe, J.V. River flow forecasting through conceptual models. J. Hydrol. 1970, 10, 282–290. [Google Scholar] [CrossRef]
- Biondi, D.; Freni, G.; Iacobellis, V.; Mascaro, G.; Montanari, A. Validation of hydrological models: Conceptual basis, methodological approaches and a proposal for a code of practice. Phys. Chem. Earth 2012, 42–44, 70–76. [Google Scholar] [CrossRef]
- Benestad, R.; Haensler, A.; Hennemuth, B.; Illy, T.; Jacob, D.; Keup-Thiel, E.; Kotlarski, S.; Nikulin, G.; Zsebeház, G.; Otto, J.; et al. 2019 Guidance for EURO-CORDEX Climate Projections Data Use. 2018. Available online: https://www.euro-cordex.net/imperia/md/content/csc/cordex/euro-cordex-guidelines-version1.0-2017.08.pdf (accessed on 10 February 2019).
- Gudmundsson, L. Package “qmap”. 2016. Available online: https://cran.r-project.org/web/packages/qmap/qmap.pdf (accessed on 10 March 2019).
- Cannon, A.J. Package “MBC”. 2018. Available online: https://cran.r-project.org/web/packages/MBC/MBC.pdf (accessed on 10 March 2019).
- Sapač, K.; Medved, A.; Rusjan, S.; Bezak, N. Investigation of Low- and High-Flow Characteristics of Karst Catchments under Climate Change. Water 2019, 11, 925. [Google Scholar] [CrossRef] [Green Version]
- Burn, D.H. Catchment similarity for regional flood frequency analysis using seasonality measures. J. Hydrol. 1997, 202, 212–230. [Google Scholar] [CrossRef]
- Bezak, N.; Brilly, M.; Šraj, M. Flood frequency analyses, statistical trends and seasonality analyses of discharge data: A case study of the Litija station on the Sava River. J. Flood Risk Manag. 2016, 9, 154–168. [Google Scholar] [CrossRef]
- Sapač, K.; Rusjan, S.; Šraj, M. Influence of calculation criteria on the values of low-flow recession constants in a non-homogenous catchment in Slovenia. Acta Hydrol. 2019, 32, 1–21. [Google Scholar] [CrossRef]
- Morisai, D.N.; Gitau, M.W.; Pai, N.; Daggupati, P. Hydrologic and water quality models: Performance measures and evaluation criteria. Trans. ASABE 2015, 58, 1763–1785. [Google Scholar]
- Parajka, J.; Kohnová, S.; Bálint, G.; Barbuc, M.; Borga, M.; Claps, P.; Cheval, S.; Dumitrescu, A.; Gaume, E.; Hlavcova, K.; et al. Seasonal characteristics of flood regimes across the Alpine–Carpathian range. J. Hydrol. 2010, 394, 78–89. [Google Scholar] [CrossRef]
- Parajka, J.; Kohnová, S.; Merz, R.; Szolgay, J.; Hlavčová, K.; Blöschl, G. Comparative analysis of the seasonality of hydrological characteristics in Slovakia and Austria/Analyse comparative de la saisonnalité de caractéristiques hydrologiques en Slovaquie et en Autriche. Hydrol. Sci. J. 2009, 54, 456–473. [Google Scholar] [CrossRef]
- Blöschl, G.; Hall, J.; Parajka, J.; Perdigão, R.A.; Merz, B.; Arheimer, B.; Aronica, G.T.; Bilibashi, A.; Bonacci, O.; Borga, M.; et al. Changing climate shifts timing of European floods. Science 2017, 357, 588–590. [Google Scholar] [CrossRef] [Green Version]
- Musselman, K.N.; Lehner, F.; Ikeda, K.; Clark, M.P.; Prein, A.F.; Liu, C.; Barlage, M.; Rasmussen, R. Projected increases and shifts in rain-on-snow flood risk over western North America. Nat. Clim. Chang. 2018, 8, 808. [Google Scholar] [CrossRef]
Figure 1.
Location of the selected catchments (red border), meteorological stations (yellow crosses), discharge gauging stations (pink arrows) on the topographic map of Slovenia.
Figure 1.
Location of the selected catchments (red border), meteorological stations (yellow crosses), discharge gauging stations (pink arrows) on the topographic map of Slovenia.

Figure 2.
Modelling results for the Soča River case study for the calibration period. The upper four panels show precipitation, air temperature, snow pack, and flow (observed and modelled) values. Three figures shown in the lower panel indicate the modelling performance using the 30-day rolling mean, non- exceedance probability, and a scatter plot showing simulated and observed flow data.

Figure 3.
Examples of the seasonality investigation for different global/regional climate models (GCM/RCM) models showing all ROS floods (circles) and resultants (i.e., average values) indicated with arrows of different colors for different periods. (a) Soča River for Case 1, (b) Soča River for Case 2, (c) Gradaščica River for Case 3, (d) Gradaščica River for Case 4.

Figure 4.
Box-plots of ROS-flood magnitudes for four investigated 30-year periods for two catchments and five GCM/RCM models. Box-plot colors indicate different periods (yellow: 1981–2010; blue: 2011–2040; orange: 2041–2070; green: 2071–2100).
Figure 4.
Box-plots of ROS-flood magnitudes for four investigated 30-year periods for two catchments and five GCM/RCM models. Box-plot colors indicate different periods (yellow: 1981–2010; blue: 2011–2040; orange: 2041–2070; green: 2071–2100).


Table 1.
Basic characteristics of the selected case studies and discharge data used.
| Gauging Station | Kršovec | Solčava | Dvor |
|---|---|---|---|
| River | Soča | Savinja | Gradaščica |
| Catchment area [km2] | 157.9 | 63.4 | 78.9 |
| Mean catchment elevation [m] | 1376 | 1229 | 615 |
| Maximum catchment elevation [m] | 2533 | 2345 | 986 |
| Calibration period [dd/mm/yy] | 01/01/1964–31/12/2000 | 01/01/1964–31/12/2002 | 01/01/1981–31/12/2005 |
| Validation period [dd/mm/yy] | 01/01/2001–31/12/2011 | 01/01/2003–31/12/2013 | 01/01/2006–31/12/2016 |
| Minimum [m3/s] | 1.7 | 0.2 | 0.3 |
| Mean [m3/s] | 11.4 | 2.1 | 2.3 |
| Maximum [m3/s] | 195 | 99.9 | 55.6 |
| Standard deviation [m3/s] | 11.5 | 2.4 | 3.1 |
Table 2.
Relative differences between median strength of seasonality (r), mean direction of the flood date (MD), number (N), and magnitudes (Q) of rain-on-snow (ROS) floods for different periods compared to the baseline period. Median values were calculated based on the results of all five investigated cases.
| Relative Difference [%] Compared to the 1981–2010 | Soča River (r; MD) | Soča River (N; Q) | Gradaščica River (r; MD) | Gradaščica River (N; Q) |
|---|---|---|---|---|
| 2011–2040 | −12.9; 2.3 | 8; −5 | −15.7; 0.6 | −13; 3 |
| 2041–2070 | −7.8; 4.4 | 69; −9 | 2.8; 6.5 | 47; 3 |
| 2071–2100 | −11.7; 6.3 | 46; −2 | 14.3; 7.0 | 33; 0 |
© 2020 by the authors. Licensee MDPI, Basel, Switzerland. This article is an open access article distributed under the terms and conditions of the Creative Commons Attribution (CC BY) license (http://creativecommons.org/licenses/by/4.0/).
Share and Cite
MDPI and ACS Style
Sezen, C.; Šraj, M.; Medved, A.; Bezak, N. Investigation of Rain-On-Snow Floods under Climate Change. Appl. Sci. 2020, 10, 1242. https://doi.org/10.3390/app10041242
AMA Style
Sezen C, Šraj M, Medved A, Bezak N. Investigation of Rain-On-Snow Floods under Climate Change. Applied Sciences. 2020; 10(4):1242. https://doi.org/10.3390/app10041242
Chicago/Turabian StyleSezen, Cenk, Mojca Šraj, Anže Medved, and Nejc Bezak. 2020. "Investigation of Rain-On-Snow Floods under Climate Change" Applied Sciences 10, no. 4: 1242. https://doi.org/10.3390/app10041242
Note that from the first issue of 2016, this journal uses article numbers instead of page numbers. See further details here.