Monitoring Vehicles on Highway by Dual-Channel φ-OTDR

1
Guangxi Key Laboratory of Optoelectronic Information Processing, Guilin University of Electronic Technology, Guilin 541004, China
2
Guangxi Engineering technology research center for road intelligent transportation system, Guangxi Transportation Research & Consulting CO., LTD, Nanning 530007, China
3
Guangxi Key Laboratory of Wireless Wideband Communication and Signal Processing, Guilin University of Electronic Technology, Guilin 541004, China
4
Guangxi Key Laboratory of Automatic Detecting Technology and Instruments, Guilin University of Electronic Technology, Guilin 541004, China
*
Author to whom correspondence should be addressed.
Appl. Sci. 2020, 10(5), 1839; https://doi.org/10.3390/app10051839
Submission received: 29 January 2020
/
Revised: 4 March 2020
/
Accepted: 5 March 2020
/
Published: 7 March 2020
(This article belongs to the Special Issue New Progress in Construction Machinery and Vehicle Engineering)
Abstract
:As a fully distributed sensor, the phase-sensitive optical time domain reflectometer (φ-OTDR) has attracted remarkable attention in real-time vibration detection. We present a dual-channel φ-OTDR (DC-φ-OTDR), formed by two single-channel φ-OTDRs (SC-φ-OTDR), to monitor running vehicles on a highway. In the double-channel system, an improved algorithm (will be referred to as the CDM&V) is proposed to alleviate the strong dependence of vibration detection on the differential step as in the widely used conventional differential method (CDM). The DC-φ-OTDR is first tested over campus road before applying it to locate moving vehicles on the highway. For comparison purposes, both the DC-φ-OTDR and SC-φ-OTDR are used to monitor the vehicles with respective signal processing methods of the CDM and CDM&V. The experimental results at campus show that the dual-path scheme can undoubtedly reduce vibration misjudgment relative to the single one due to the very small possibility of false measurements occurred simultaneously at the same location in both channels. In signal demodulation, the CDM&V greatly relaxes the constraints on the differencing interval for identifying the vehicle-caused vibration. With a step size of 5 or lower, the CDM fails to locate the running vehicle at z=~8.5 km, but the CDM&V successfully demonstrates the feasible capability of locating the vibration. With an increase in the differential interval, both the CDM and CDM&V are able to detect the vibration signal, but with the latter showing a much better noise suppression performance and hence a larger SNR. Importantly, in comparison with the SC-φ-OTDR system, the DC-φ-OTDR exhibits a considerable enhanced SNR for the detection signal regardless of which processing algorithm (i.e., CDM, CDM&V) is used. The vehicle locations positioned by the DC-φ-OTDR are confirmed by the monitoring cameras.
1. Introduction
Highway is playing an increasingly important role in economic growth for any country. As a result of the tremendous rise in vehicle use in recent years, the pressures placed on highways intensify—causing serious problems such as traffic jams and accidents. Thus, there is a strong demand for highway operators to develop new methods of improving the efficiency and safety of transportation. Currently, two categories of discrete sensors—namely, intrusive and non-intrusive—are mainly used in the risk management of highways, with the former being installed on pavement surfaces (e.g., magnetic sensor, inductive loops) and the latter being installed at different places on the highways (e.g., radar sensor, cameras) [1,2,3,4]. These sensor-based technologies of traffic management effectively improve road safety and reduce highway congestion. It should be noted, however, that these sensors can only sense in a discrete manner and should not be deployed in full scale. Luckily, significant progress has been made in developing distributed optical fiber sensing (DOFS) systems, making them a promising approach for the vibration-sensitive measurement of transportation, due to their fully distributed nature [5,6,7]. The DOFS can locate the external dynamic disturbances at any position of optical fiber with meter-scale spatial resolution over tens of kilometers [8]. Importantly, long distance coverage can be economically achieved with optical fiber as the equivalent sensing arrays.
Generally, the DOFS can be divided into Brillouin-based DOFS and Rayleigh-based DOFS in terms of vibration detection. Brillouin-based DOFS is limited to the applications of low frequency perturbations over a relatively short sensing length due to its large amounts of time consumed in data acquiring and frequency sweeping [9]. In contrast, Rayleigh-based DOFS shows the capability of measuring a higher frequency vibration over a much longer range, and thus has becomes a powerful tool in many important fields, including railway monitoring [5], pipeline safety [10], and intrusion detection [11]. Nowadays, phase-sensitive optical time domain reflectometry (φ-OTDR) is the most commonly utilized Rayleigh-based DOFS owning to φ-OTDR offers a much higher sensitivity to external vibrations. In this technique, an ultra-narrow linewidth laser pulse is launched into the sensing fiber, any mechanical vibrations would change the coherent interaction over a great number of Rayleigh scattering units within a pulse duration. Therefore, the phase and intensity of the backscattered Rayleigh light are modulated by the vibrations. After digital signal processing (DSP), the vibrations can be determined by analyzing the changes of phase or intensity of the Rayleigh scattering traces. In φ-OTDR systems, phase demodulation has widely been used based on the linear relationship between the phase and vibration [12,13,14,15,16,17]. However, phase demodulation is at the expense of system complexity and cost. Additionally, the traditional φ-OTDR operates in single channel (SC-φ-OTDR), for which there are two important factors influencing the further improvement of its performance. The first is the signal fading that may happen at one or more points over the sensing link due to destructive interference of the backward-scattered Rayleigh lights or polarization mismatching between the Rayleigh signal and reference light in the coherent detection [18]. The second is the noises from temporal intensity fluctuation of laser pulses, laser phase noise and photodetector thermal and shot noise. Both reduce the signal-to-noise (SNR) of the time-domain traces in SC-φ-OTDR, leading to a decreased sensitivity to vibration events and an increased probability of unreliable vibration measurements. Another problem is that the conventional differential method (CDM), which is often used in signal demodulation of the SC-φ-OTDR, is highly dependent on the differentiating step to determine the vibration-induced signal peak. Inappropriate selection of step size would also lead to wrong locations of vibration events.
In the paper, an intensity-demodulated dual-channel φ-OTDR (DC-φ-OTDR) is investigated to monitor the traffic situation on a highway. The two sensing channels are extracted from an armored four-core cable. Furthermore, we propose an improved signal processing algorithm to demodulate the vibration signal for the purpose of alleviating the strong dependence of the demodulation on the differential step. With the help of the DC-φ-OTDR system, we hope to decrease the probability of false measurements. We firstly validate the DC-φ-OTDR on a campus road, and then apply it to monitor the running vehicles on the highway along a 9 km-long armored cable.
2. Experiment Setup
The experimental setup of the DC-φ-OTDR is shown in Figure 1. The intention of experimenting the dual-channel structure is to try to resolve the mistaken vibration measurement as occurred in the SC-φ-OTDR caused by signal fading and noise. In the DC-φ-OTDR, the probability of signal fading occurred simultaneously at the same location in both channels may be extremely small. Similarly, the possibility of simultaneously producing the noise-related incorrect results at the same point is very low. For simplicity, a typical heterodyne φ-OTDR is used to set up the DC-φ-OTDR, although new schemes of φ-OTDR would have better performance [19]. In the dual channel system, the two sensing fibers are tied together and share the same transmission path. The laser source is a fiber laser with a narrow linewidth of ~3 kHz and frequency drift of less than 20 MHz. The emission wavelength of the laser is 1550 nm and the maximum output power is 20 dBm. The laser light is split into two paths by a 50:50 optical coupler to form two separated SC-φ-OTDR systems. In each SC-φ-OTDR, the light is further divided into two channels by a 90:10 optical coupler: one is the sensing arm and the other is the reference one. The 90% light in the sensing arm is modulated by an acousto-optic modulator (AOM; driven by an arbitrary waveform generator, AWG) to generate probe pulses of 100 ns (corresponding to a spatial resolution of 10 m). The optical pulses are downshifted by 200 MHz from the input laser after the AOM. The rise/fall time of the AOM is 10 ns, typical insertion loss is 2 dB, and the extinction ratio is 50 dB. Then the pulsed light is launched into the sensing fiber via a circulator (CIR). In the reference arm, the 10% light is polarization controlled by a polarization controller (PC) to produce the reference light. The backscattering Rayleigh light reflected from different positions of the sensing fiber propagate backwards via the CIR and will combine with the reference by another 50:50 optical coupler for beating. The beating signal is converted to electrical signal by a 200 MHz balanced photodetector (BPD). The responsivity of the BPD is 0.9 A/W at 1550 nm. Then, the electrical signals output from both SC-φ-OTDRs are processed by I/Q demodulation and sampled by a data acquisition system with a sampling rate of ~100 MHz, which means one sample corresponds to ~1 m spatial distance. Finally, the vehicle vibrations are analyzed in real time by a computer. With the help of the dual sensing fibers, it is expected to decrease the possibility of wrong judgement for vibration events. For comparison, we also perform vibration measurements by using each SC-φ-OTDR.
3. Methods of Vibration Positioning
In the DC-φ-OTDR system, two processing techniques are employed for signal demodulation. One is the most widely used—the CDM [20,21]. To improve some shortcomings in the CDM, we present a modified signal processing algorithm. Meanwhile, the measurement results between two methods are compared.
The CDM is generally adopted to measure the location of external vibrations in φ-OTDR system. In the method, several tens of or hundreds of consecutive Rayleigh scattering traces are detected within a given time interval and then every two Rayleigh traces spaced apart by k (which will be named as differential step in the following) are subtracted in the subsequent data processing. In order to locate the vibration, the results of each subtraction are summed together to create the detection signal. Specifically, let D[j] be the j-th of the N scattering traces from one of the two sensing fibers, the vibration point could be positioned based on the accumulated differential signal μ, which can be written by:
where D is raw traces without any average denoising; m represents the number of the sensing fibers: m = 1 means the first fiber (fiber 1#) and m = 2 the second fiber (fiber 2#).
For reducing the probability of false measurement caused by signal fading and noise interference as in the SC-φ-OTDR, the final vibration location in the DC-φ-OTDR will be determined jointly by the results from two sensing channels. The reason is that the possibility of wrong results occurring at the same time in the same position on each sensing fiber would be very small. Thus, in the dual-channel sensing system as shown in Figure 1, we accordingly extend Equation (1) to the following expression to obtain the synthesized detection signal.
where μ1 and μ2 are the accumulated differential signals in fiber 1# and fiber 2#, respectively, and can be independently calculated by Equation (1). In Equation (2), the differential intervals of μ1 and μ2 are supposed to be the same. Moreover, it has to be noted that the two elements from μ1 and μ2 with identical indices should correspond to the same sensing position in order to avoid spatial mismatching in the multiplication of Equation (2); namely, both the jth elements of μ1 and μ2 should represent the signal amplitude returned from position zj. Hence, position matching between μ1 and μ2 is important to ensure no double signal peaks or zero peaks are produced in the synthesized signal, μ, for a single vibration event at a certain point. In the paper, we propose a method to the realize position alignment between μ1 and μ2 by digitizing the two raw traces from fiber 1# and fiber 2# with equal spatial distance. In our case, the distance separation between any two adjacent sampling points is set to be one meter. That is, the sampling period of the raw traces is given by: Tm = nm /c (m = 1, 2); here c is the light speed and nm denotes the effective refractive index of fiber m (n1 and n2 are estimated to be 1.4498 and 1.4468, respectively). Thus, it is easy to compute the sampling frequencies for the two sensing channels. Then, the multiplication in Equation (2) can be performed in the space domain with good spatial matching, when the position abscissas for both the accumulated signals of μ1 and μ2 are characterized by zm,i = c × tm,i/2nm (m = 1, 2); here, tm,i is the round-trip time from input to the i-th scattering element in fiber m.
The CDM shows good reliability in terms of positioning the vibration signal, but it is very sensitive to the selection of the differential step (i.e., k in Equation (1)). An inappropriate k value would fail to position the vibration or lead to a wrong location information. In practice, the value of k is highly dependent on the frequency of vibration signals and the repetition rate the probe pulses (and hence the sensing distance). Generally, a smaller k is preferable for a higher-frequency vibration signal, and larger for lower-frequency signal. On the highway, the k-value is determined by considering that the vehicle-caused vibration frequency is also closely related to the driving speed, the type of the vehicle, and the operation condition of the highway. Therefore, it is necessary to propose an improved signal demodulation method to reduce the impact of k-value sensitivity on the vibration location of running vehicles on the highway.
It is known that external vibrations would generate localized modulation in the effective refractive index of the sensing fiber, causing a change in the intensity of the backward-scattered Rayleigh light. Compared to the locations where no vibration is present, the Rayleigh traces continuously measured within a certain time would show a large fluctuation in intensity at the vibration points. Although each trace seems to change randomly, the mean and variance provide a deep insight into the overall variations of tens or hundreds of Rayleigh traces. Figure 2 shows the measured Rayleigh scattering traces at two different situations. Figure 2a is obtained in the lab with a piezo-electric transducer (PZT) at ~1 km being used to simulate a stable vibration of 40 Hz, in which 80 consecutive traces are superimposed. This frequency is comparable to the vibration frequency of a driving vehicle on the highway. We also measured 100 consecutive Rayleigh traces on the highway, where the vibration was caused by a running vehicle at ~8.2 km, and the result is given in Figure 2c. Figure 2b,d show their mean values and standard variances, respectively. From these figures, it is evident that the traces are more divergent and show larger variances at the vibration positions relative to other places. What we should notice is that it is not enough to obtain trustworthy vibration positions solely by relying on the means and variances in complex environments. It is thus necessary to present a more robust signal processing technique by combing both the advantages of the CDM and the variances of Rayleigh scattering traces.
For convenience and distinction, the proposed algorithm will be referred to as CDM&V in the following description. In the CDM&V, we similarly suppose D[j] be the j-th of the consecutive N raw scattering traces and be the mean value for the N traces. For each sensing channel, the summed differential signal, σ, is changed to be:
For the DC-φ-OTDR, the synthesized signal, which combines the summed differential signals from fiber 1# and fiber 2#, used for vibration detection is:
where σ1 and σ2 are the differential signal achieved by fiber 1# and fiber 2#, respectively, and can be independently calculated by Equation (3). Likewise, in Equation (4), the differential intervals of σ1 and σ2 are assumed to be the same (namely k), and position matching between σ1 and σ2 can be achieved by the same method as described above. From Equation (3), it is seen that the vibration is jointly determined by the traditional difference of Equation (1) and the deviation of Rayleigh traces from the mean. Thus, it is expected that for each sensing channel a higher SNR can be obtained by the CDM&V relative to the CDM, and noise level can be further suppressed when combining the differential signals from both sensing fibers (see Equation (4)).
4. Performance Tests of DC-φ-OTDR on a Campus Road
Before applying the DC-φ-OTDR to locate the running vehicles on the highway, we firstly investigate its sensing performance over a short-distance campus road (as shown in Figure 1b). In the experiment, the driving speed of the testing vehicle is in the range of 20–40 km/h. Both sensing fibers forming the DC-φ-OTDR are ~260 m, which is limited by the length of the straight section in the campus, and tightly tied together before buried in soil along the road. They originate from the same fiber spool, in order to reduce the impact of speed mismatch on the product of Equation (2) and Equation (4). It should be mentioned that only the last 130 m of fiber is used for vibration sensing, since the first 130 m functions to guide the probing optical pulses from the lab to the sensing road after passing through several 90-degree curved sections. That is, the testing vehicle is driving from z = 130 m to z = 260 m. Although the measurement path is relatively short, the undesirable vibrations caused by the passing electric bicycles and pedestrians adds a lot of extra noises to the system, which brings some difficulties to signal demodulation. The repetition rate of the probe pulses is set to be 200 kHz, guaranteeing that only one probing pulse is travelling within the fiber at any time. For each sensing fiber, an injected optical pulse would generate one raw trace of backscattered Rayleigh signal, and a total of 2500 consecutive traces were recorded in 12.5 ms by the data acquisition for the effective positioning of the vehicle. Over this time duration, the vehicle only drives forward about 14 cm, which is much less than the spatial resolution. The vibration point along each sensing fiber could be independently detected by measuring any abnormal change in the summed differential signal via both the CDM and CDM&V. Figure 3 shows the results when the vehicle was driving at 242 m; whereas Figure 3a,c are the accumulated vibration signals from single channel (i.e., fiber 1# or fiber 2#, which is equivalent to the SC-φ-OTDR), and Figure 3b,d are the synthesized ones obtained by combining both sensing fibers (the DC-φ-OTDR).
In Figure 3a, both the raw traces measured in fiber 1# and fiber 2# are processed by the CDM. The signal fading phenomenon can be apparently observed in fiber 2#, meaning that the vibration location cannot be correctly identified if that channel alone is used for probing. In fiber 1#, the vibration signal is buried in noise for k = 100 (i.e., every two Rayleigh traces used for subtraction are separated by 100). When k is increased to 300, the SNR enhancement is significant (2.6 dB) and the vibration signal of the vehicle is quite clear. To reach an SNR of 0.5 dB in fiber 1#, the two Rayleigh traces used for differentiation in Equation (1) has to be spaced apart by larger than 125. The result indicates that the CDM demodulation is highly k dependent. Here, the SNR is defined as a ratio between the peak power at the vibration position and that at the strongest side-peak not belonging to the main lobe. In Figure 3c, the proposed CDM&V is employed to deal with the Rayleigh traces. As expected, no remarkable SNR improvement is observed in fiber 2# due to fading effect. Whether k = 100 or 300, the CDM&V shows the ability of locating the signal peak in fiber 1#, with respective resulting SNRs of 3.3 dB and 5.5 dB. It is interesting to notice that the CDM&V provides 2.9 dB SNR improvement when k = 300 in fiber 1# relative to the CDM. Our additional calculation shows that the CDM&V is able to seek the vibration peak with an SNR of 2.4 dB even with a minimum differential step of kmin = 1. For the upper limit of the differencing space, kmax is safely set to be half of the total Rayleigh traces. In the case, kmax = N/2 = 2500/2 = 1250. The details about how to determine the kmax in both approaches will not be described here, we will present a detailed justification in another work. When k is changed between [1, kmax], a larger step leads to a greater SNR. The overall results by both methods are summarized in Table 1, implying that: (1) when k ≤ 125, the CDM fails to position the vibration peak; (2) when k∈[1, kmax] the localization by the CDM&V is independent on the k value; and (3) the CDM&V can enhance the SNR of the detection signals over the CDM. Furthermore, based on Equations (2) and (4), we use the synthetic signals, obtained by combining the accumulated differential signals from fiber 1# and fiber 2# via the CDM (Figure 3b) and CDM&V (Figure 3d), respectively, to discover the vibration signal. In the figures, the amplitude of each curve is normalized to the maxima. For the CDM-based synthesized signals, no signal peak can be found for the vibration when k ≤ 125; whereas the SNR is increased to ~3 dB when k = 300. This indicates again the high dependence of the algorithm on the k value. For the CDM&V, the SNR of the synthesized signal achieves up to 5.7 dB for k = 100 and 8.5 dB for k = 300, which is much greater than the counterparts obtained by the CDM. From the results, it can be reasonably concluded that relative to the CDM, the CDM&V-based dual-channel system increases the signal SNR and weakens the dependence of vibration positioning on the k value. It is also seen from Figure 3 that although signal fading results in no vibration peak being observed in the single channel of fiber 2#, the synthesized signals by the CDM&V can clearly show the signal regardless of the differential step. Additionally, it is observed that the SNRs of the dual-channel system are much better than those of the single one.
When the vehicle is driving over the campus road, the backscattered Rayleigh traces in both fiber 1# and fiber 2# are continually acquired in the lab and processed by Equation (2) of the CDM and by Equation (4) of the CDM&V, respectively, to extract the synthesized detection signals. Figure 4 shows the respective vibration signals when the vehicle reaches at z = 200 m, 218 m, 242 m, and 252 m. It is seen that the CDM cannot detect any vibration for k = 100 or lower at all these positions. On the contrary, the CDM&V shows a robust ability to determine the vibration peak with a greatly enhanced SNR. The SNR improvement is especially significant at z = 218 m where the vibration signal is less affected by the passing electric bicycles and pedestrians. Compared to the result obtained using the CDM (Figure 4b, SNR = 2.5 dB), the SNR of the vibration signal is improved by ~5.0 dB for k = 300 when applying the CDM&V. From Figure 4d, it is seen that the CDM is unable to locate the vibration at 252 m due to the vehicle approaching the end of the road with a near-zero speed. Instead, the CDM&V detects the peak with an SNR of ~0.4 dB for k = 1, ~0.9 dB for k = 100, and ~1.5 dB for k = 300.
5. Vehicle Locating on a Highway
After validating the performance of the DC-φ-OTDR over the campus road, we proceeded to assess its feasibility for monitoring running vehicles on a highway. In this case, two of the optical fibers integrated into an armored four-core cable are used as the double sensing channels.
In this test, the driving speed of the vehicle on the highway is in the range of 80-100 km/h. The cable is ~ 22 km away from the monitoring center and buried along the highway with a depth range from 0.2 m–0.5 m and a closest horizontal distance from the highway of ~ 1m. Originally, the cable was paved along the highway not for sensing purposes, but for transmitting the traffic violation videos taken by cameras to a surveillance room. Therefore, some sections of the cable are suspended in the drainage ditch and do not make contact with the soil, which hinders the vibrations caused by the running vehicles to be transmitted to the cable through the soil. For this, we have chosen the cable located between z = ~7 km and z = ~9 km being the sensing unit for the vehicle measurement, over which the cable is buried in soil as shown the inset of Figure 1c. Another reason for selecting this section of the cable is that there is a video camera mounted at z = ~8.5 km, by which we could confirm our vehicle positioning obtained by the DC-φ-OTDR. In the monitoring room (z = 0), the probe pulses with a repetition rate of 4 kHz are injected into both fiber 1# and fiber 2# (as shown in Figure 1), and the backscattered Rayleigh optical signals from each sensing fiber are converted into electric signals and sampled by data acquisition, then processed by the CDM and CDM&V, respectively, to obtain the accumulated vibration signals. In the experiment, 100 consecutive Rayleigh traces are measured over 25 ms (N = 100) for each sensing fiber. Again, the upper limit of the separation between the two differencing Rayleigh traces is restrained to be N/2. Figure 5 shows the measurement results at z = 8.3 km for different differential steps: Figure 5a1–a3 are the accumulated vibration signals from fiber 1#; Figure 5b1–b3 are the accumulated signals from fiber 2#; Figure 5c1–c3 are the synthesized signals by the fusion of both sensing channels, in which all curves are normalized to their respective maxima. It should be noted that the value of k (differential step) is arbitrarily selected from 1 to N/2; other values in this range have no significant impacts on the results. We both employ the CDM (based on Equation (1) and Equation (2)) and the CDM&V (based on Equation (3) and Equation (4)) to detect the running vehicle.
Figure 5a1–c1 compare the results obtained by the CDM for k = 5 and 30. It can be seen that when the differential step is chosen to be 5, fiber 1# fails to detect the vehicle and fiber 2# detect the signal with a small SNR of 0.5 dB. To efficiently locate the vibration, the differential step of the CDM must be greater than 5. With k being increased to 30, both fiber 1# and fiber 2# show an ability to locate the vibration signal with a respective SNR of 1.5 dB and 0.8 dB. We also notice that there are some spikes around the vibration peak, which may be attributed to the spreading effect of the vibration caused by the moving vehicle. From the two synthesized signals shown in Figure 5c1, it is observed a considerable enhancement in SNR for the larger differential step (3.9 dB for k = 30 vs. 0.7 dB for k = 5). Again, the results indicate the strong sensitivity of the CDM algorithm on the differential step. Meanwhile, the synthesized signals show greater SNRs compared to the accumulated ones either from fiber 1# or fiber 2#. The results are given in Table 2. When the CDM&V is applied to locate the vehicle position, the vibration peak can be easily found for k being varied in [1, N/2], which also shows no dependence of the presented algorithm on the step values. If k = 5, the CDM&V provides a respective SNR improvement of 2.3 dB, 1.3 dB, and 4.8 dB for the accumulated signal in fiber 1#, the accumulated signal in fiber 2#, and the synthesized signal compared to the counterparts by the CDM, which could be seen in Figure 5a2, Figure 5b2 and Figure 5c2. It is also important to note that for any k value within the concerned range, the SNRs of the synthesized signals are also much greater than those of the accumulated ones either obtained from fiber 1# or 2#. The noise level could be further suppressed for k = 30 by the CDM&V as seen in the third column of Figure 5. These results demonstrate the powerful capability of the DC-φ-OTDR in terms of positioning the moving vehicles on the highway with a considerably improved SNR, which are in accordance with those concluded over the campus road.
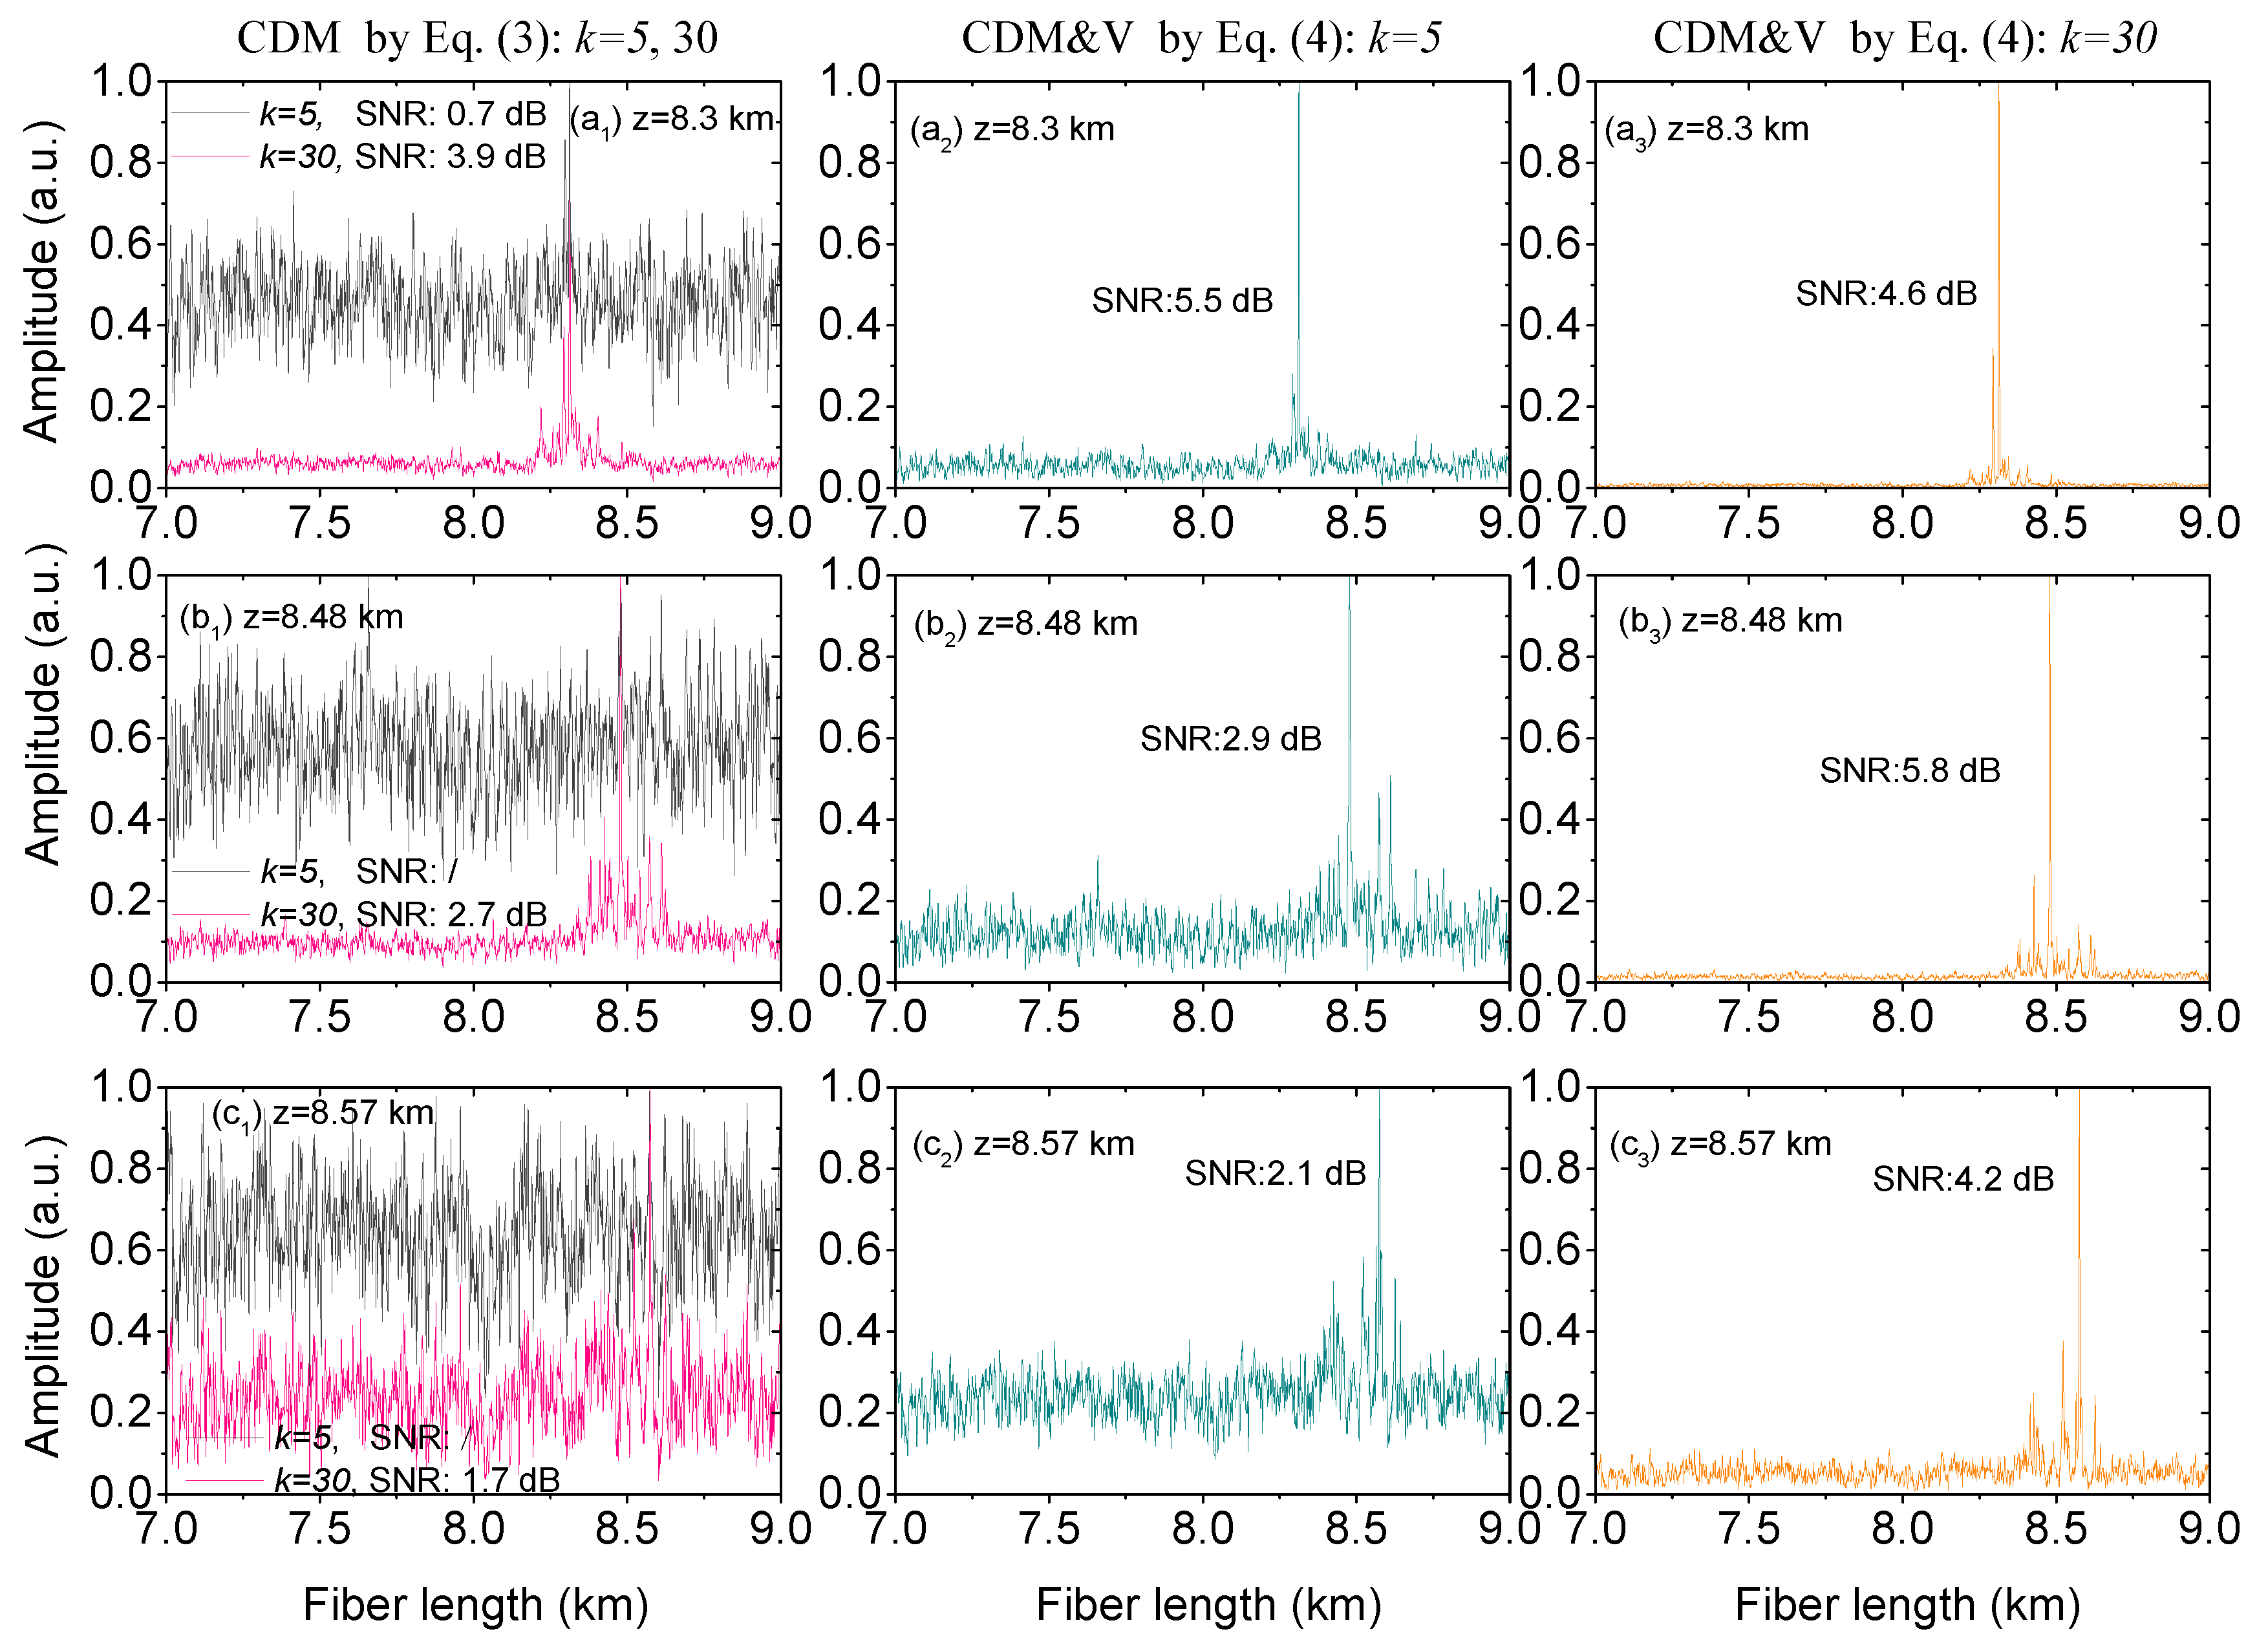
We also try to figure out the vibrations by the synthesized signals of the DC-φ-OTDR when the vehicle is travelling on the highway from z=~8.3 km to z=~8.6 km. As an example, Figure 6 presents three positions located by the CDM (the first column) and by the CDM&V (the second and third columns), respectively. For effective comparison, the curves are normalized to their respective maxima. It is seen that the DC-φ-OTDR by the CDM lacks the ability to read the vehicle at z = 8.48 km and z = 8.57 km for a differentiating step of 5. With the same step, the DC-φ-OTDR by the CDM&V clearly distinguishes all the three vibration peaks with a SNR of 5.5 dB, 2.9 dB, and 2.1 dB, respectively. These SNRs meet the minimum detectable requirements of 2 dB given in [22]. When the k value is increased to 30, the CDM-processed synthesized signals can also locate all the vibration peaks but with a much larger noise level compared to those obtained by the CDM&V. The results are given in Table 3. The well-suppressed noise by the CDM&V can easily be seen in Figure 6(a3, b3, c3). The locations determined by the DC-φ-OTDR are confirmed by the camera videos.
6. Conclusions
In conclusion, the work successfully demonstrates a DC-φ-OTDR to locate the vehicles on the highway. Dual-channel system helps to reduce the probability of unreliable measurement caused by signal fading and noise interference, which is experimentally confirmed over the campus road. In the results, signal fading does happen on one sensing fiber, making the SC-φ-OTDR fail to detect the vibration, but the synthesized signal in the DC-φ-OTDR shows good positioning capability. Additionally, an improved processing method named CDM&V is presented in signal demodulation to improve the performance of the sensor. We compare the DC-φ-OTDR processed by the CDM&V with the DC-φ-OTDR processed by the CDM. The results show that the CDM&V-based DC-φ-OTDR outperforms the CDM-based one in terms of locating the running vehicle with higher SNRs and alleviating the differentiating step dependence of discovering vibration peaks. One important point required to be mentioned is that when the synthesized signal—which combines the accumulated signals from both fiber channels—is used to determine the vibration, the light speed discrepancy between two sensing fibers must be taken into account. For this, we offer a method of achieving position matching between two accumulated differential signals from the dual sensing channels. However, it should be pointed out the good performance of achieving higher SNR and resisting to wrong measurement for the double-channel sensor is at the expense of complexity, relative to the single-channel system. Thus, a trade-off between cost and performance has to be considered before applying the DC-φ-OTDR in real applications.
Author Contributions
S.X. and Z.Q. completed this study; W.Z. participated in the design of the experiments; X.X. conceived this study. All authors have read and agreed to the published version of the manuscript.
Funding
This research was funded by the National Natural Science Foundation of China (grant nos. 61665001 and 61965005), the National Science and Technology Major Project (grant no: 2017ZX02101007-003), the Natural Science Foundation of Guangxi Province (grant no: 2019GXNSFDA185010), and the Guangxi Key Laboratory of Automatic Detecting Technology and Instruments (No. YQ17115). The APC was funded by the National Natural Science Foundation of China (grant no. 61965005). In addition, Zujun Qin acknowledges the funding from Guangxi Key Laboratory of Wireless Wideband Communication and Signal Processing and Guangxi Experiment Center of Information Science (Guilin University of Electronic Technology), and Wentao Zhang also acknowledges the funding from Guangxi distinguished expert project.
Conflicts of Interest
The authors declare no conflict of interest.
References
- Guerrero-Ibáñez, J.; Zeadally, S.; Contreras-Castillo, J. Sensor technologies for intelligent transportation systems. Sensors 2018, 18, 1212. [Google Scholar] [CrossRef] [PubMed] [Green Version]
- Jiang, J.; Mi, C.; Wu, M.; Zhang, Z.; Feng, Y.; Mi, W. Real-time Container Truck Speed Measurement at Container Port Gates Based on the Binocular Vision Technology. J. Coast. Res. 2019, 93, 998. [Google Scholar] [CrossRef]
- Martín, F.F.; Llopis, M.V.; Rodríguez, J.C.; González, J.B.; Blanco, J.M. Low-cost open-source multifunction data acquisition system for accurate measurements. Measurement 2014, 55, 265. [Google Scholar] [CrossRef]
- Singh, G.; Majumdar, S.; Rajan, S. MapReduce-based techniques for multiple object tracking in video analytics. In Proceedings of the 2017 IEEE Smart World Ubiquitous Intelligence & Computing, Advanced & Trusted Computed, Scalable Computing & Communications, Cloud & Big Data Computing, Internet of People and Smart City Innovation (SmartWorld/SCALCOM/UIC/ATC/CBDCom/IOP/SCI), San Francisco, CA, USA, 4–8 August 2017. [Google Scholar]
- Peng, F.; Duan, N.; Rao, Y.J.; Li, J. Real-time position and speed monitoring of trains using phase-sensitive OTDR. IEEE Photon. Technol. Lett. 2014, 26, 2055–2057. [Google Scholar] [CrossRef]
- He, Z.; Liu, Q.; Fan, X.; Chen, D.; Wang, S.; Yang, G. Fiber-optic distributed acoustic sensors (DAS) and applications in railway perimeter security. Proc. SPIE 2018, 10821, 1082102. [Google Scholar]
- Zhou, Z.; Liu, W.; Huang, Y.; Wang, H.; Jianping, H.; Huang, M.; Jinping, O. Optical fiber Bragg grating sensor assembly for 3D strain monitoring and its case study in highway pavement. Mech. Syst. Signal Pr. 2012, 28, 36–49. [Google Scholar] [CrossRef]
- Masoudi, A.; Newson, T.P. High spatial resolution distributed optical fiber dynamic strain sensor with enhanced frequency and strain resolution. Opt. Lett. 2017, 42, 290–293. [Google Scholar] [CrossRef]
- Zhao, L.J.; Xu, Z.N.; Li, Y.Q.; Chen, Y.H.; Qin, H. A fast key parameter extraction algorithm for long fiber distributed sensing based on Brillouin scattering. Rev. Sci. Instrum. 2019, 90, 066101. [Google Scholar] [CrossRef]
- Peng, F.; Wu, H.; Jia, X.H.; Rao, Y.J.; Wang, Z.N.; Peng, Z.P. Ultra-long high-sensitivity phi-OTDR for high spatial resolution intrusion detection of pipelines. Opt. Express 2014, 22, 13804–13810. [Google Scholar] [CrossRef]
- Lai, M.; Peng, K.; Luo, Y.; Li, X.; Li, Y.; Ai, F.; Liu, D.; Sun, Q. Ultra-long distance distributed intrusion detecting system assisted with in-line amplification. IEEE Photonics J. 2017, 9, 1–10. [Google Scholar] [CrossRef]
- Muanenda, Y.; Faralli, S.; Oton, C.J.; Di Pasquale, F. Dynamic phase extraction in a modulated double-pulse ϕ-OTDR sensor using a stable homodyne demodulation in direct detection. Opt. Express 2018, 26, 687–701. [Google Scholar] [CrossRef] [PubMed]
- Wang, Z.; Zhang, L.; Wang, S.; Xue, N.; Peng, F.; Fan, M.; Sun, W.; Qian, X.; Rao, J.; Rao, Y. Coherent Φ-OTDR based on I/Q demodulation and homodyne detection. Opt. Express 2016, 24, 853–858. [Google Scholar] [CrossRef] [PubMed]
- Bhatta, H.D.; Costa, L.; Garcia-Ruiz, A.; Fernandez-Ruiz, M.R.; Martins, H.F.; Tur, M.; Gonzalez-Herraez, M. Dynamic measurements of 1000 microstrains using chirped-pulse phase-sensitive optical time-domain reflectometry. J. Lightwave Technol. 2019, 37, 4888–4895. [Google Scholar] [CrossRef]
- Masoudi, A.; Belal, M.; Newson, T.P. A distributed optical fibre dynamic strain sensor based on phase-OTDR. Meas. Sci. Technol. 2013, 24, 085204. [Google Scholar] [CrossRef]
- Fang, G.; Xu, T.; Feng, S.; Li, F. Phase-sensitive optical time domain reflectometer based on phase-generated carrier algorithm. J. Lightwave Technol. 2015, 33, 2811–2816. [Google Scholar] [CrossRef]
- Jiang, J.; Wang, Z.; Wang, Z.; Wu, Y.; Lin, S.; Xiong, J.; Chen, Y.; Rao, Y. Coherent Kramers-Kronig receiver for Φ-OTDR. J. Lightwave Technol. 2019, 37, 4799–4807. [Google Scholar] [CrossRef]
- Ren, M.; Lu, P.; Chen, L.; Bao, X. Theoretical and experimental analysis of Φ-OTDR based on polarization diversity detection. IEEE Photon. Lett. 2016, 28, 697–700. [Google Scholar] [CrossRef]
- Marcon, L.; Soto, M.A.; Soriano-Amat, M.; Costa, L.; Martins, H.F.; Palmieri, L.; Gonzalez-Herraez, M. Boosting the spatial resolution in chirped pulse Φ-OTDR using sub-band processing. Proc. SPIE 2019, 11199, 111991W. [Google Scholar]
- Wang, Y.; Jin, B.; Wang, Y.; Wang, D.; Liu, X.; Bai, Q. Real-Time Distributed Vibration Monitoring System Using ϕ-OTDR. IEEE Sens. J. 2017, 17, 1333–1341. [Google Scholar] [CrossRef]
- Ashry, I.; Mao, Y.; Alias, M.S.; Ng, T.K.; Hveding, F.; Arsalan, M.; Ooi, B.S. Normalized differential method for improving the signal-to-noise ratio of a distributed acoustic sensor. Appl. Opt. 2019, 58, 4933–4938. [Google Scholar] [CrossRef]
- Lu, Y.; Zhu, T.; Chen, L.; Bao, X. Distributed vibration sensor based on coherent detection of phase-OTDR. J. Lightwave Technol. 2010, 37, 3243–3249. [Google Scholar]
Figure 1.
(a) Experimental set-up of the DC-φ-OTDR, (b) Testing on a campus road, and (c) Testing on a highway. The red lines in (b) and (c) respective indicate the approximate positions of the sensing cable experimented in the campus and paved along the highway. The inset in (c) is the optical cable buried in the soil over the measured zone.
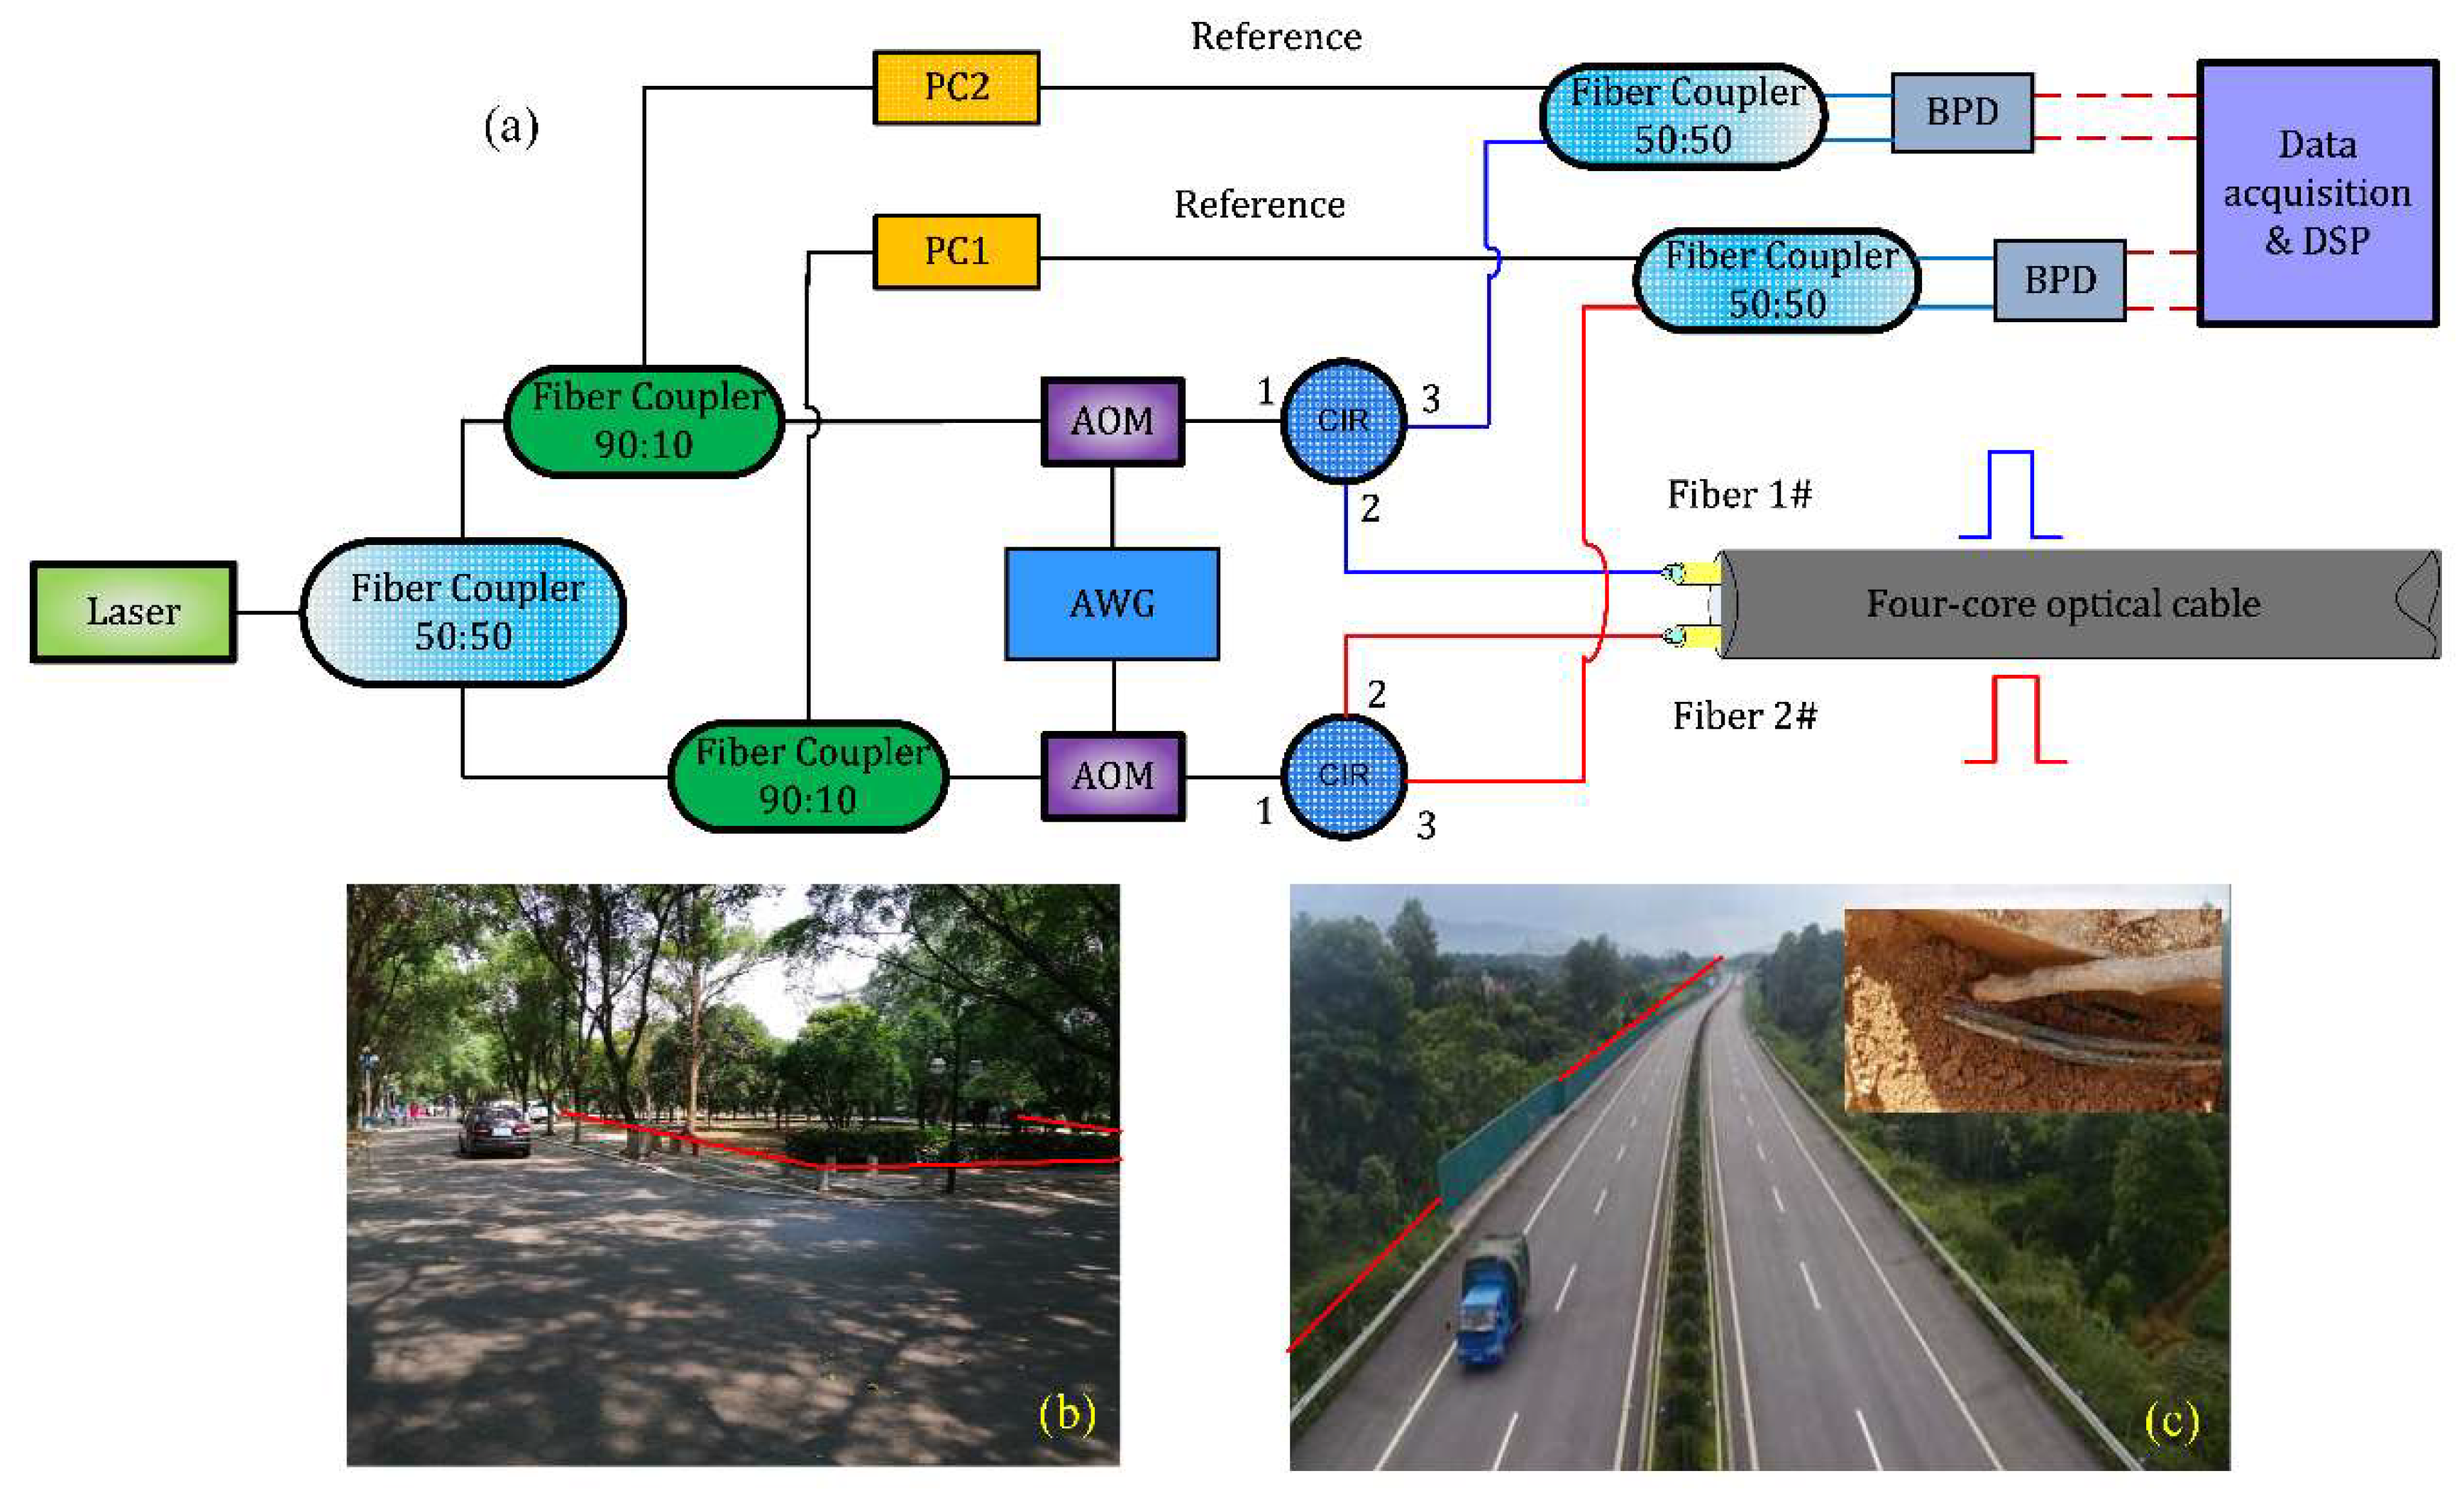
Figure 2.
(a) Superimposition of 80 raw backscattered traces with PZT modulation at 1 km; (b) mean and standard variance of (a); (c) superimposition of 100 raw traces with a running vehicle at 8.2 km; (d) mean and standard variance of (c).
Figure 2.
(a) Superimposition of 80 raw backscattered traces with PZT modulation at 1 km; (b) mean and standard variance of (a); (c) superimposition of 100 raw traces with a running vehicle at 8.2 km; (d) mean and standard variance of (c).
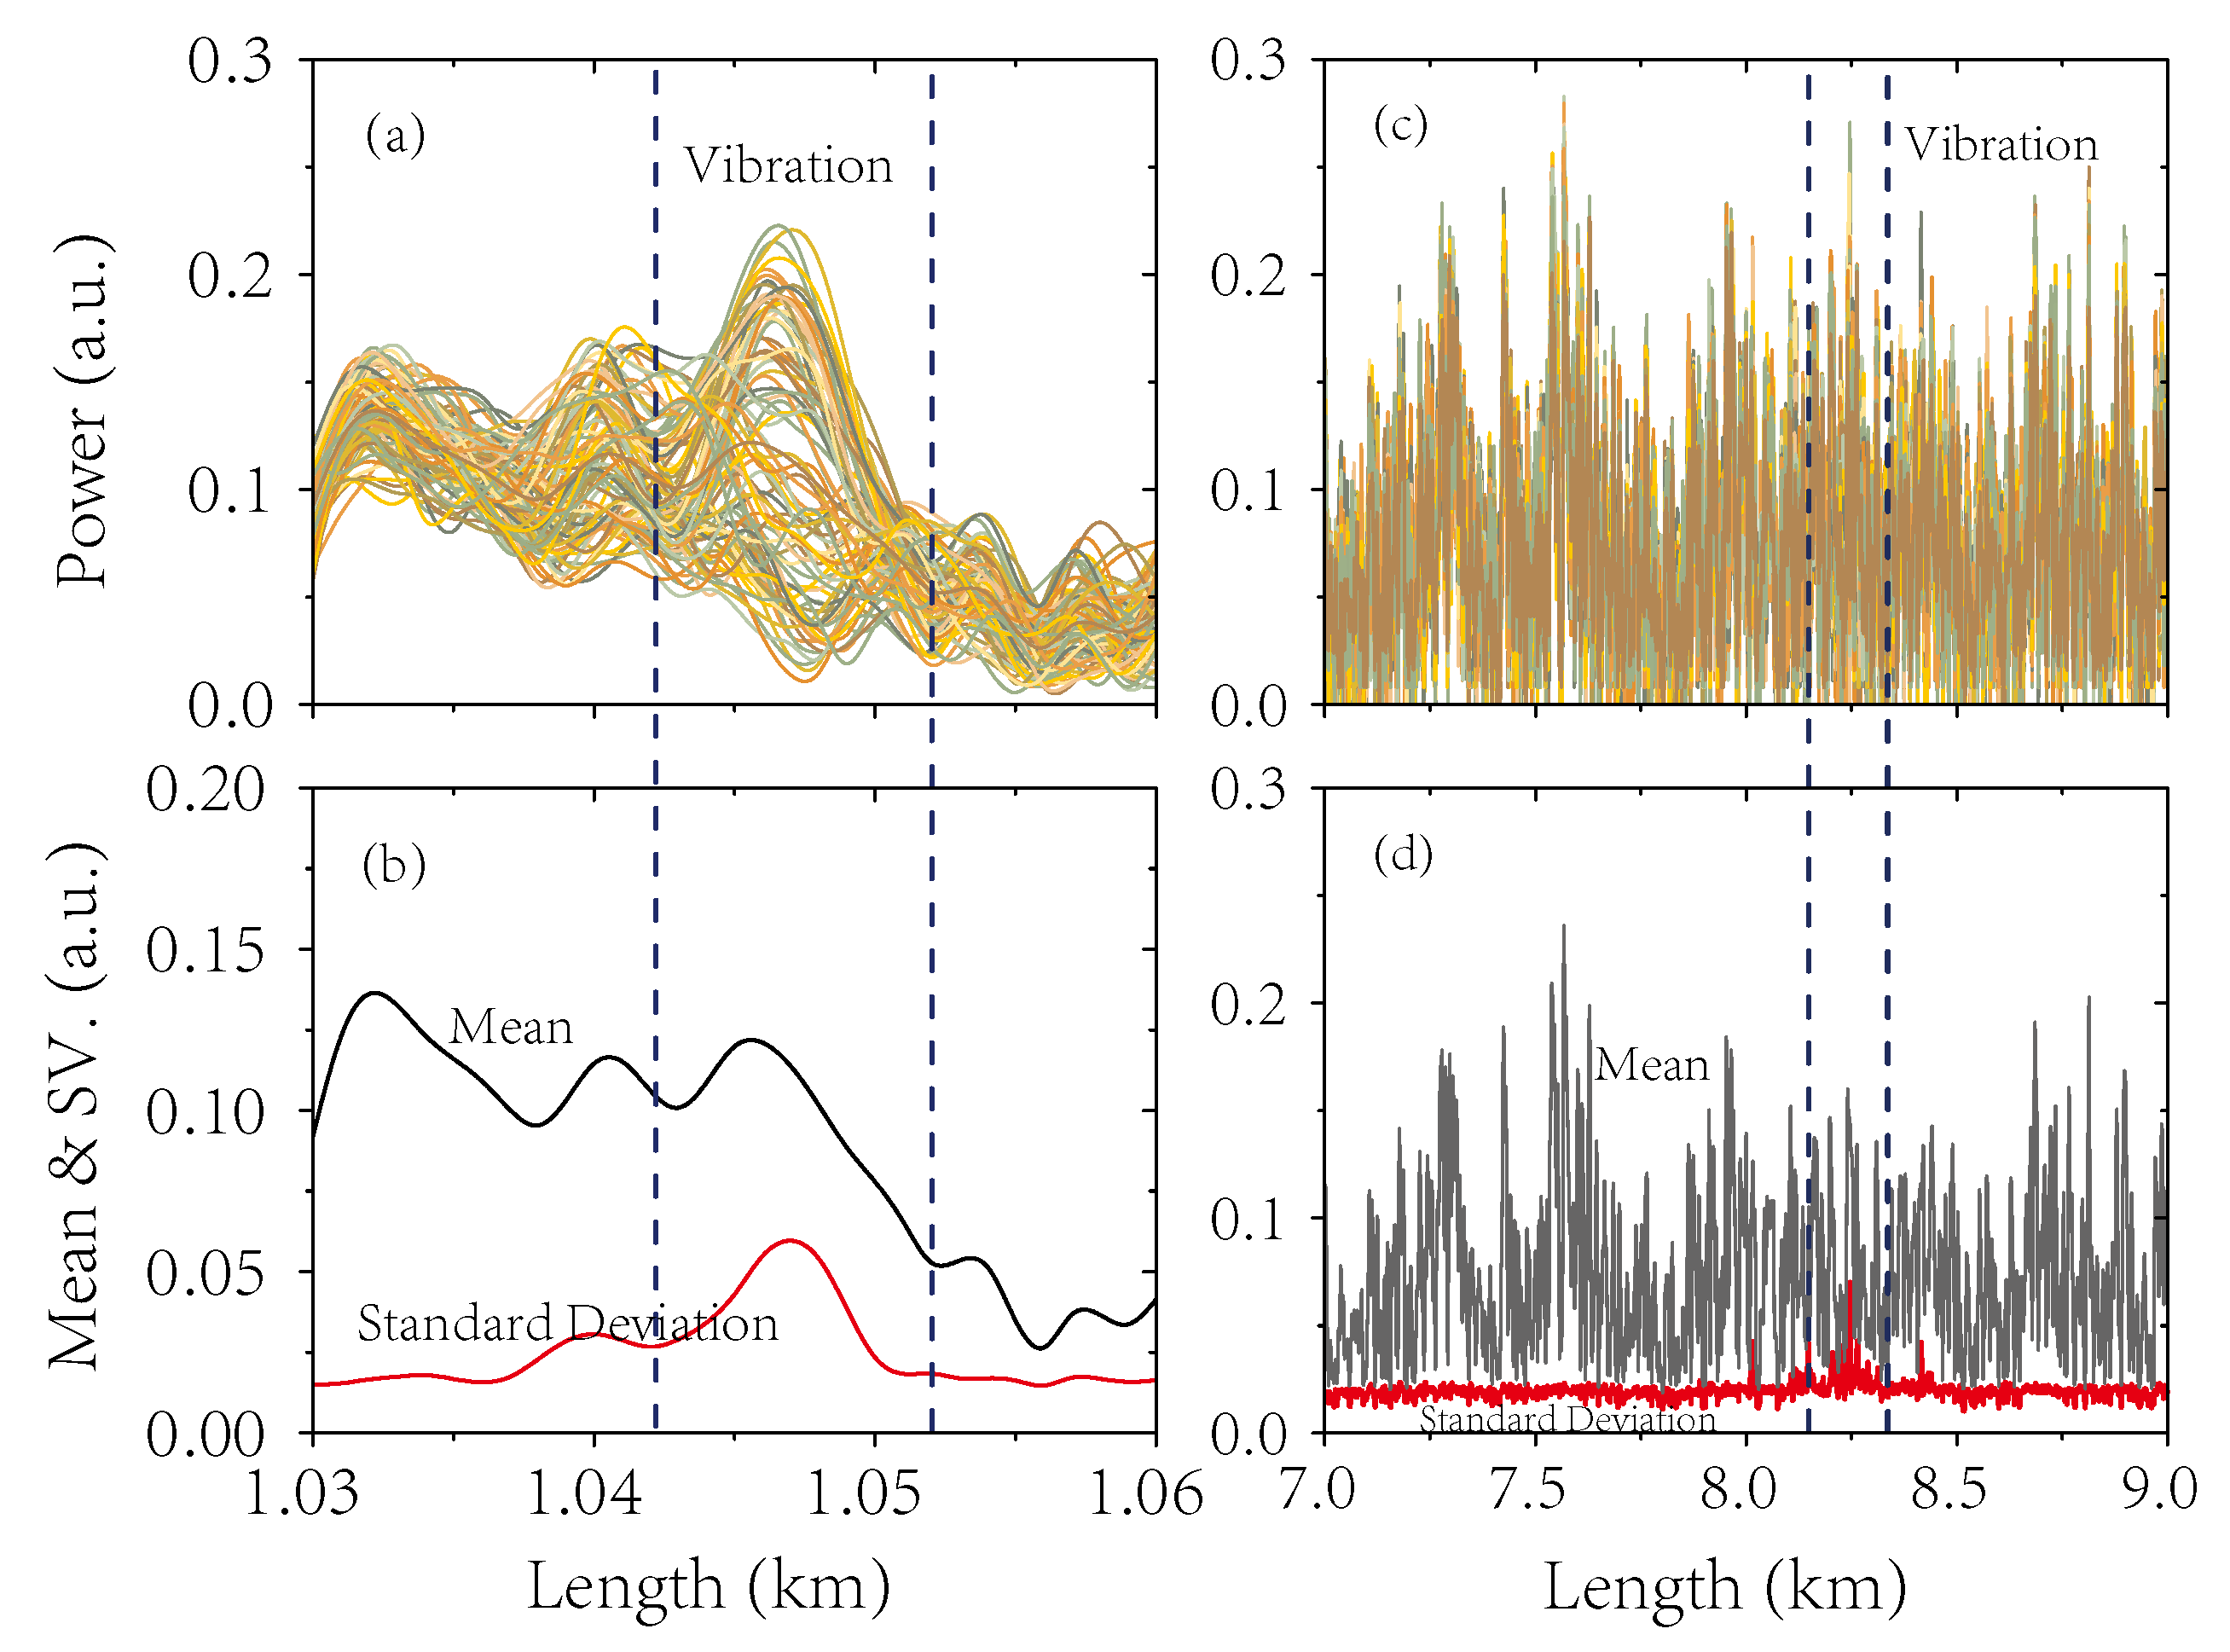
Figure 3.
Accumulated vibration signals at 242 m for different differential steps by (a) the CDM based on Equation (1) and (c) the CDM&V based on Equation (3) in fiber 1# and fiber 2#, respectively. Synthesized signals for different k values by (b) the CDM based on Equation (2) and (d) the CDM&V based on Equation (4). In the figure, 2500 consecutive Rayleigh traces are measured for each fiber.
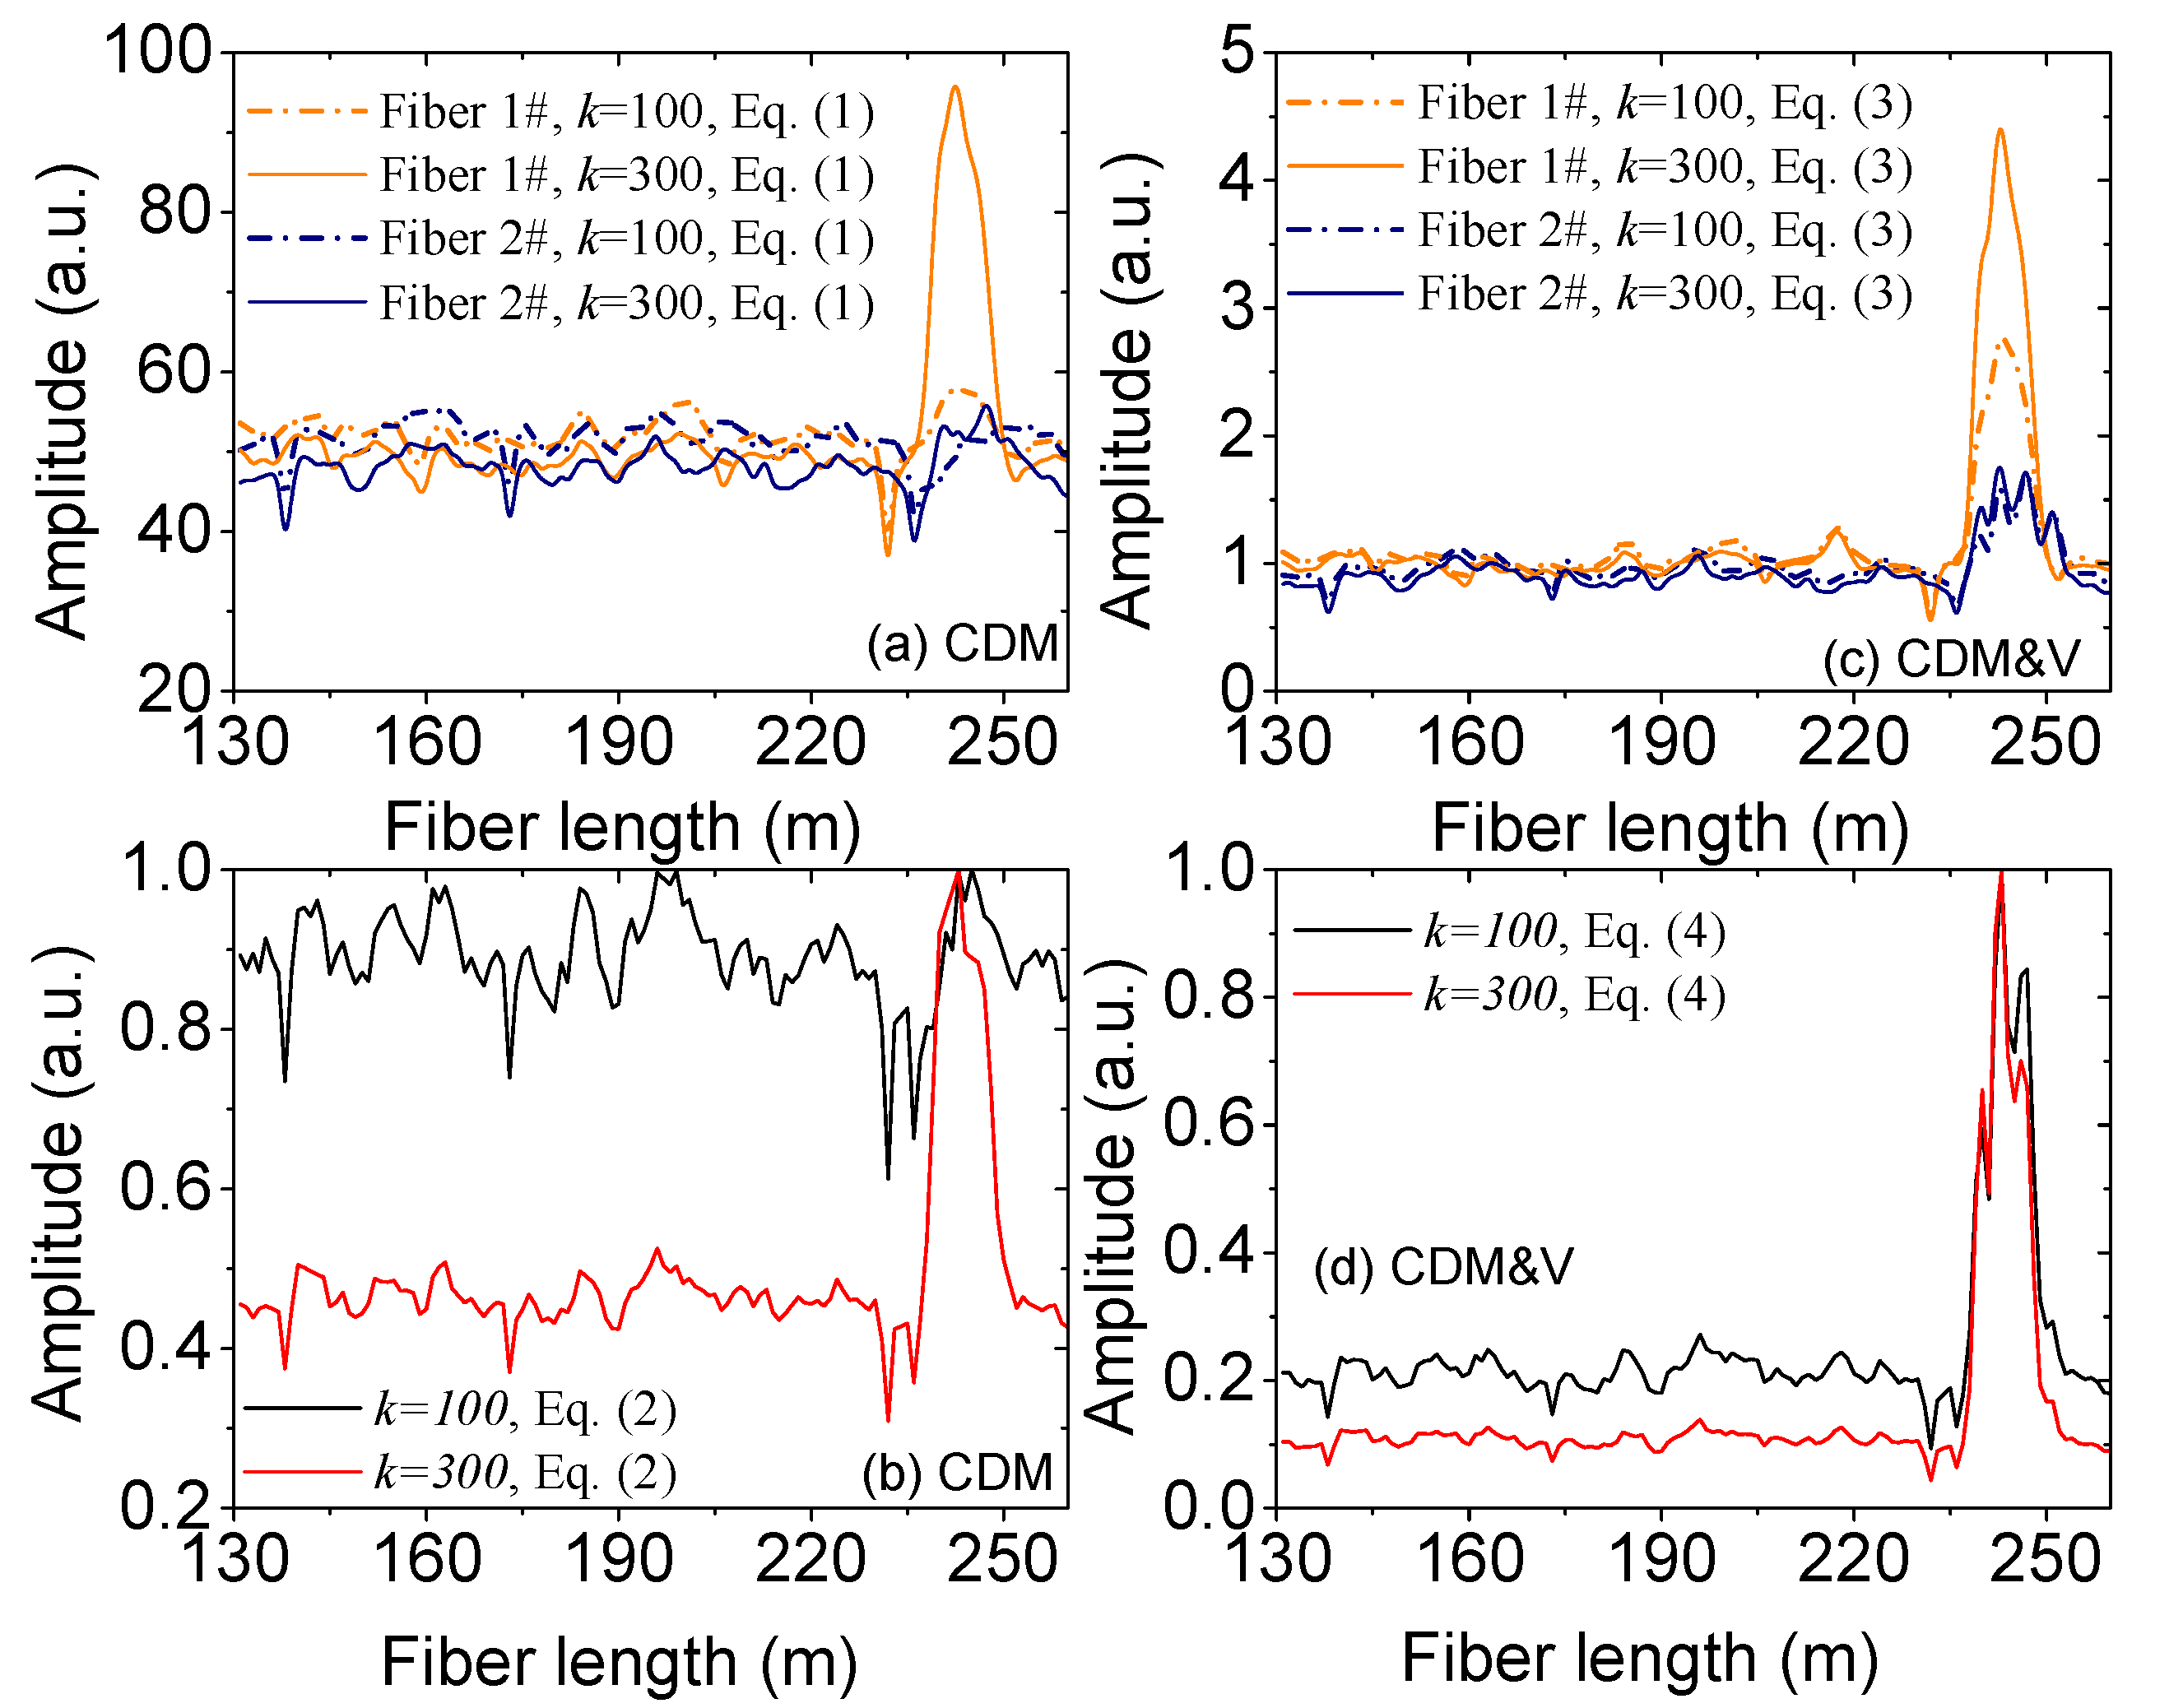
Figure 4.
Synthesized detection signals obtained by the CDM and CDM&V when the vehicle is driving over the campus road. (a) z = 200 m, (b) z = 218 m, (c) z = 242 m, and (d) z = 252 m.
Figure 4.
Synthesized detection signals obtained by the CDM and CDM&V when the vehicle is driving over the campus road. (a) z = 200 m, (b) z = 218 m, (c) z = 242 m, and (d) z = 252 m.
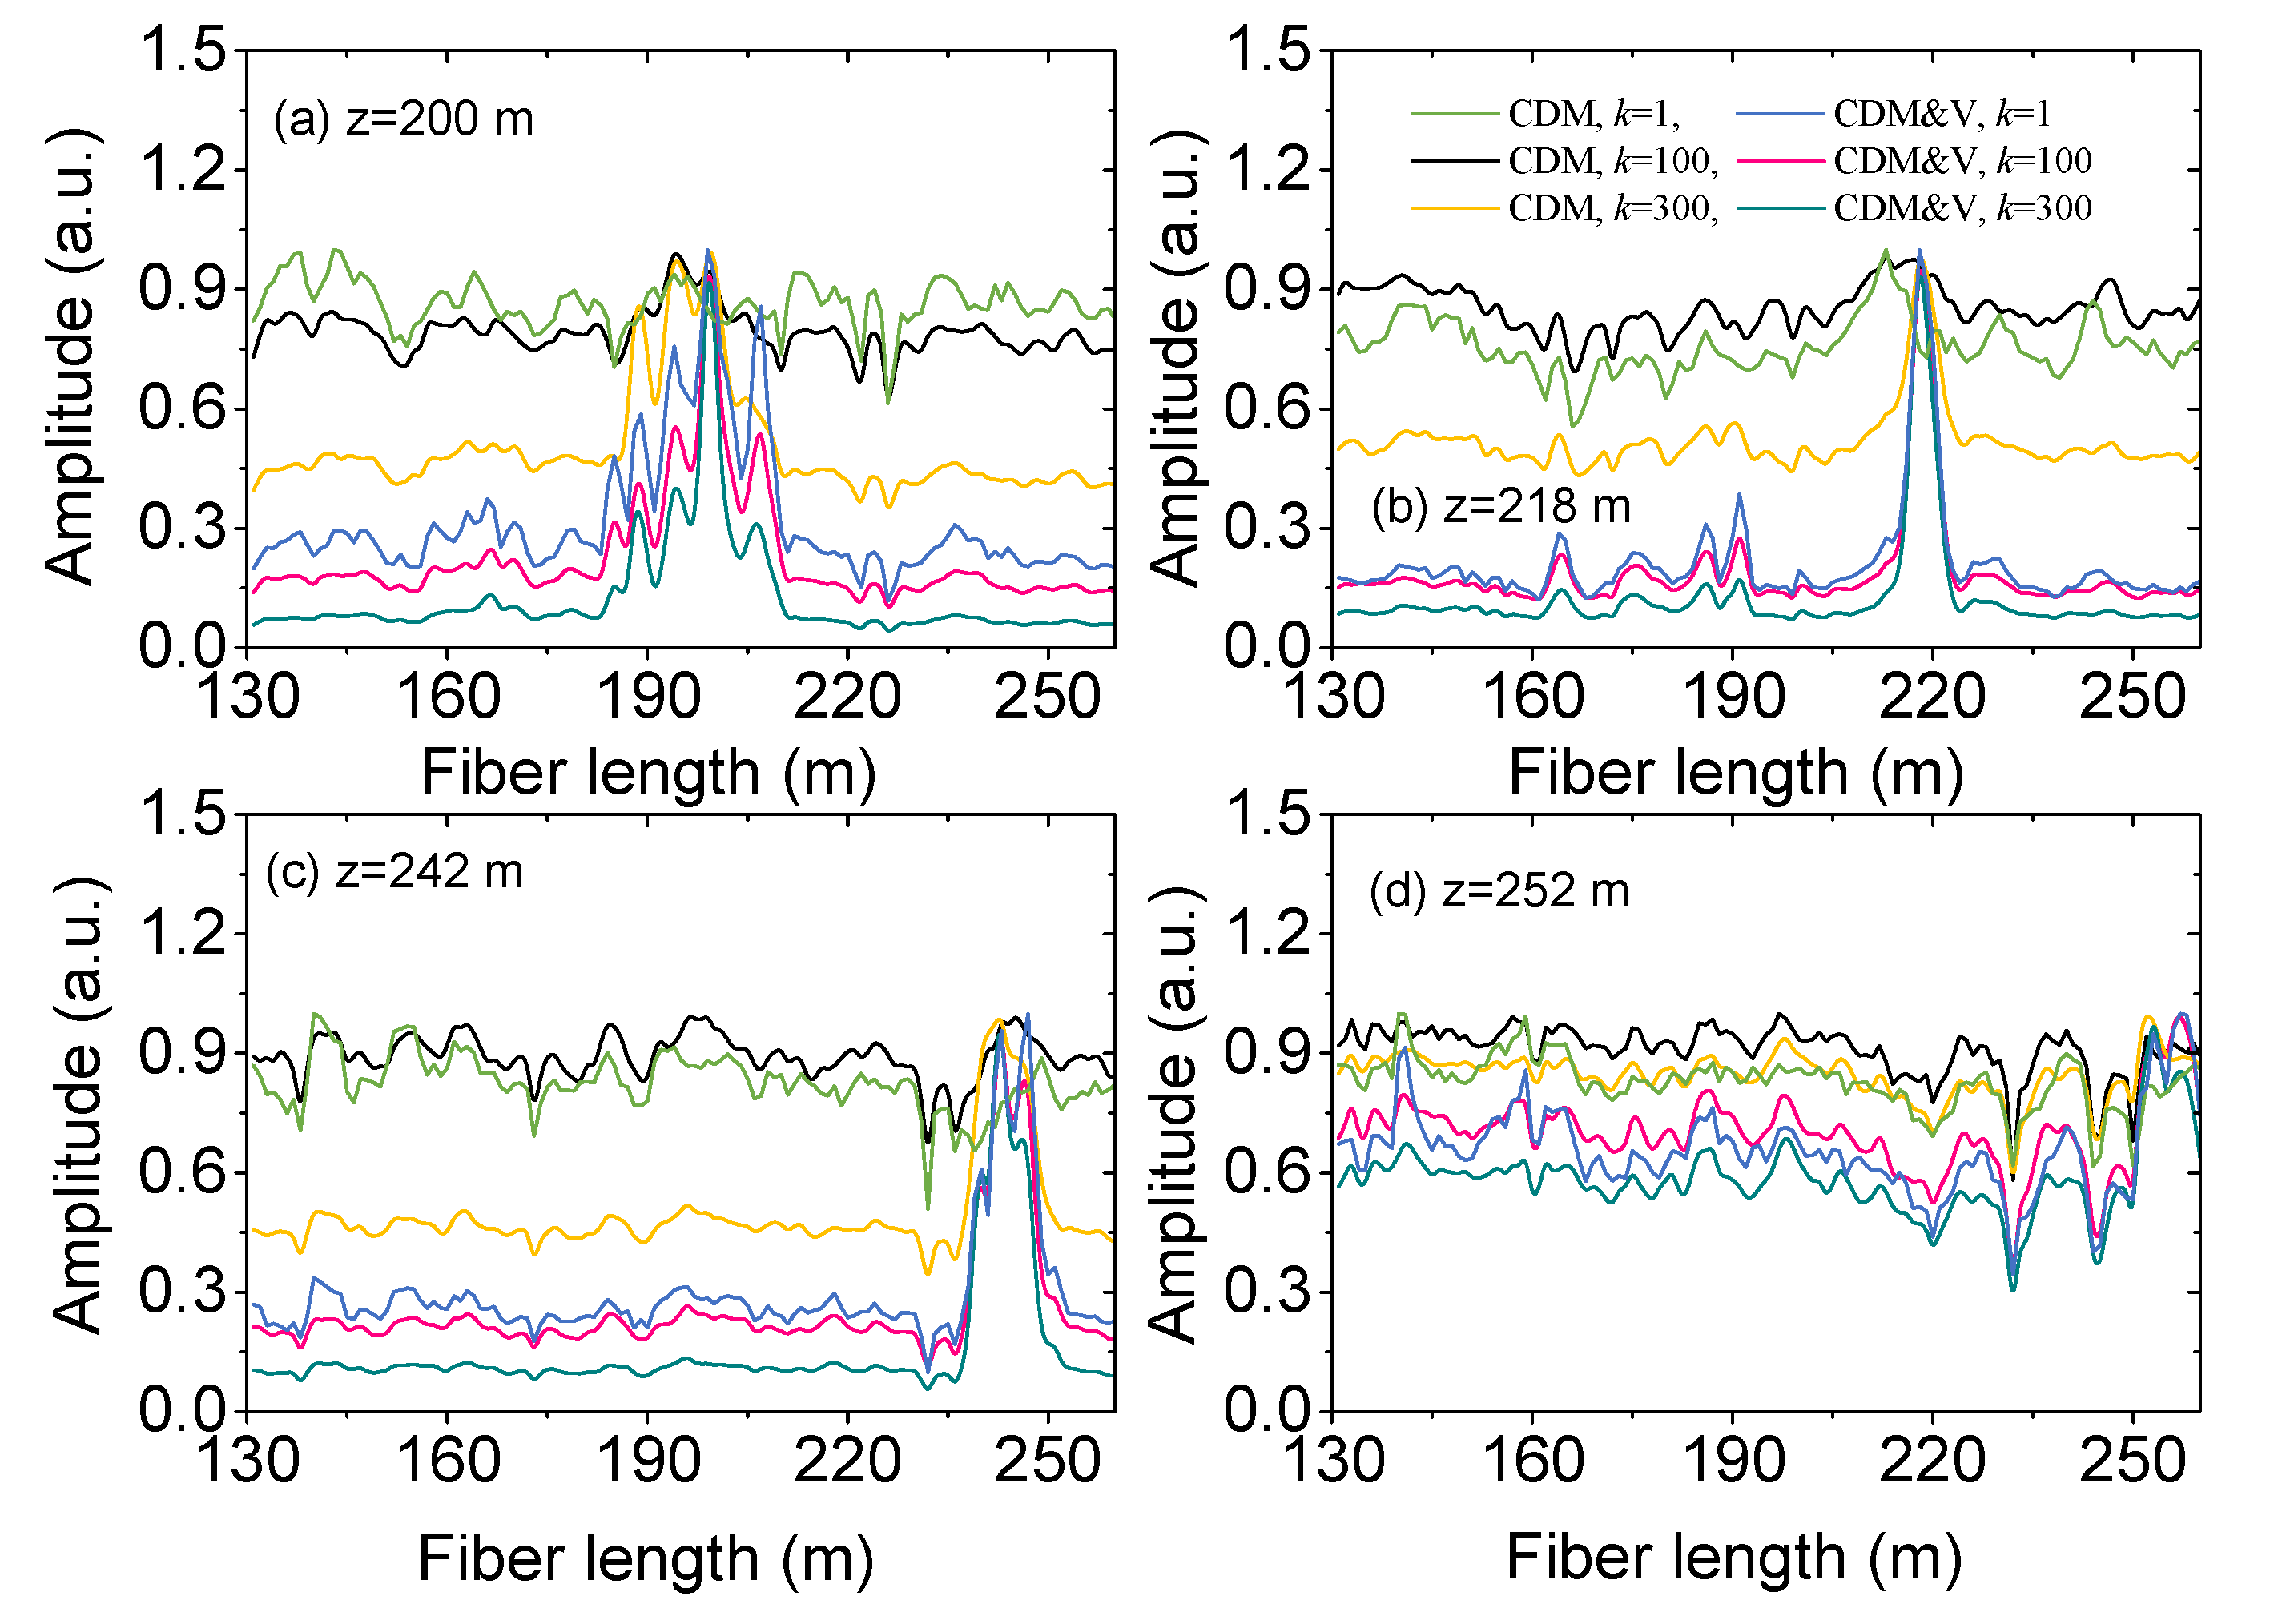
Figure 5.
Vibration signals at 8.3 km for different differential steps (i.e., k). The first and second rows respective denote the accumulated differential signal in fiber 1# and in fiber 2#, and the third row is the synthesized signals combining fiber 1# and fiber 2#. The first column is computed by the CDM, and the second and third are by the CDM&V. In the experiment, 100 consecutive Rayleigh traces are measured for each sensing fiber (N = 100).
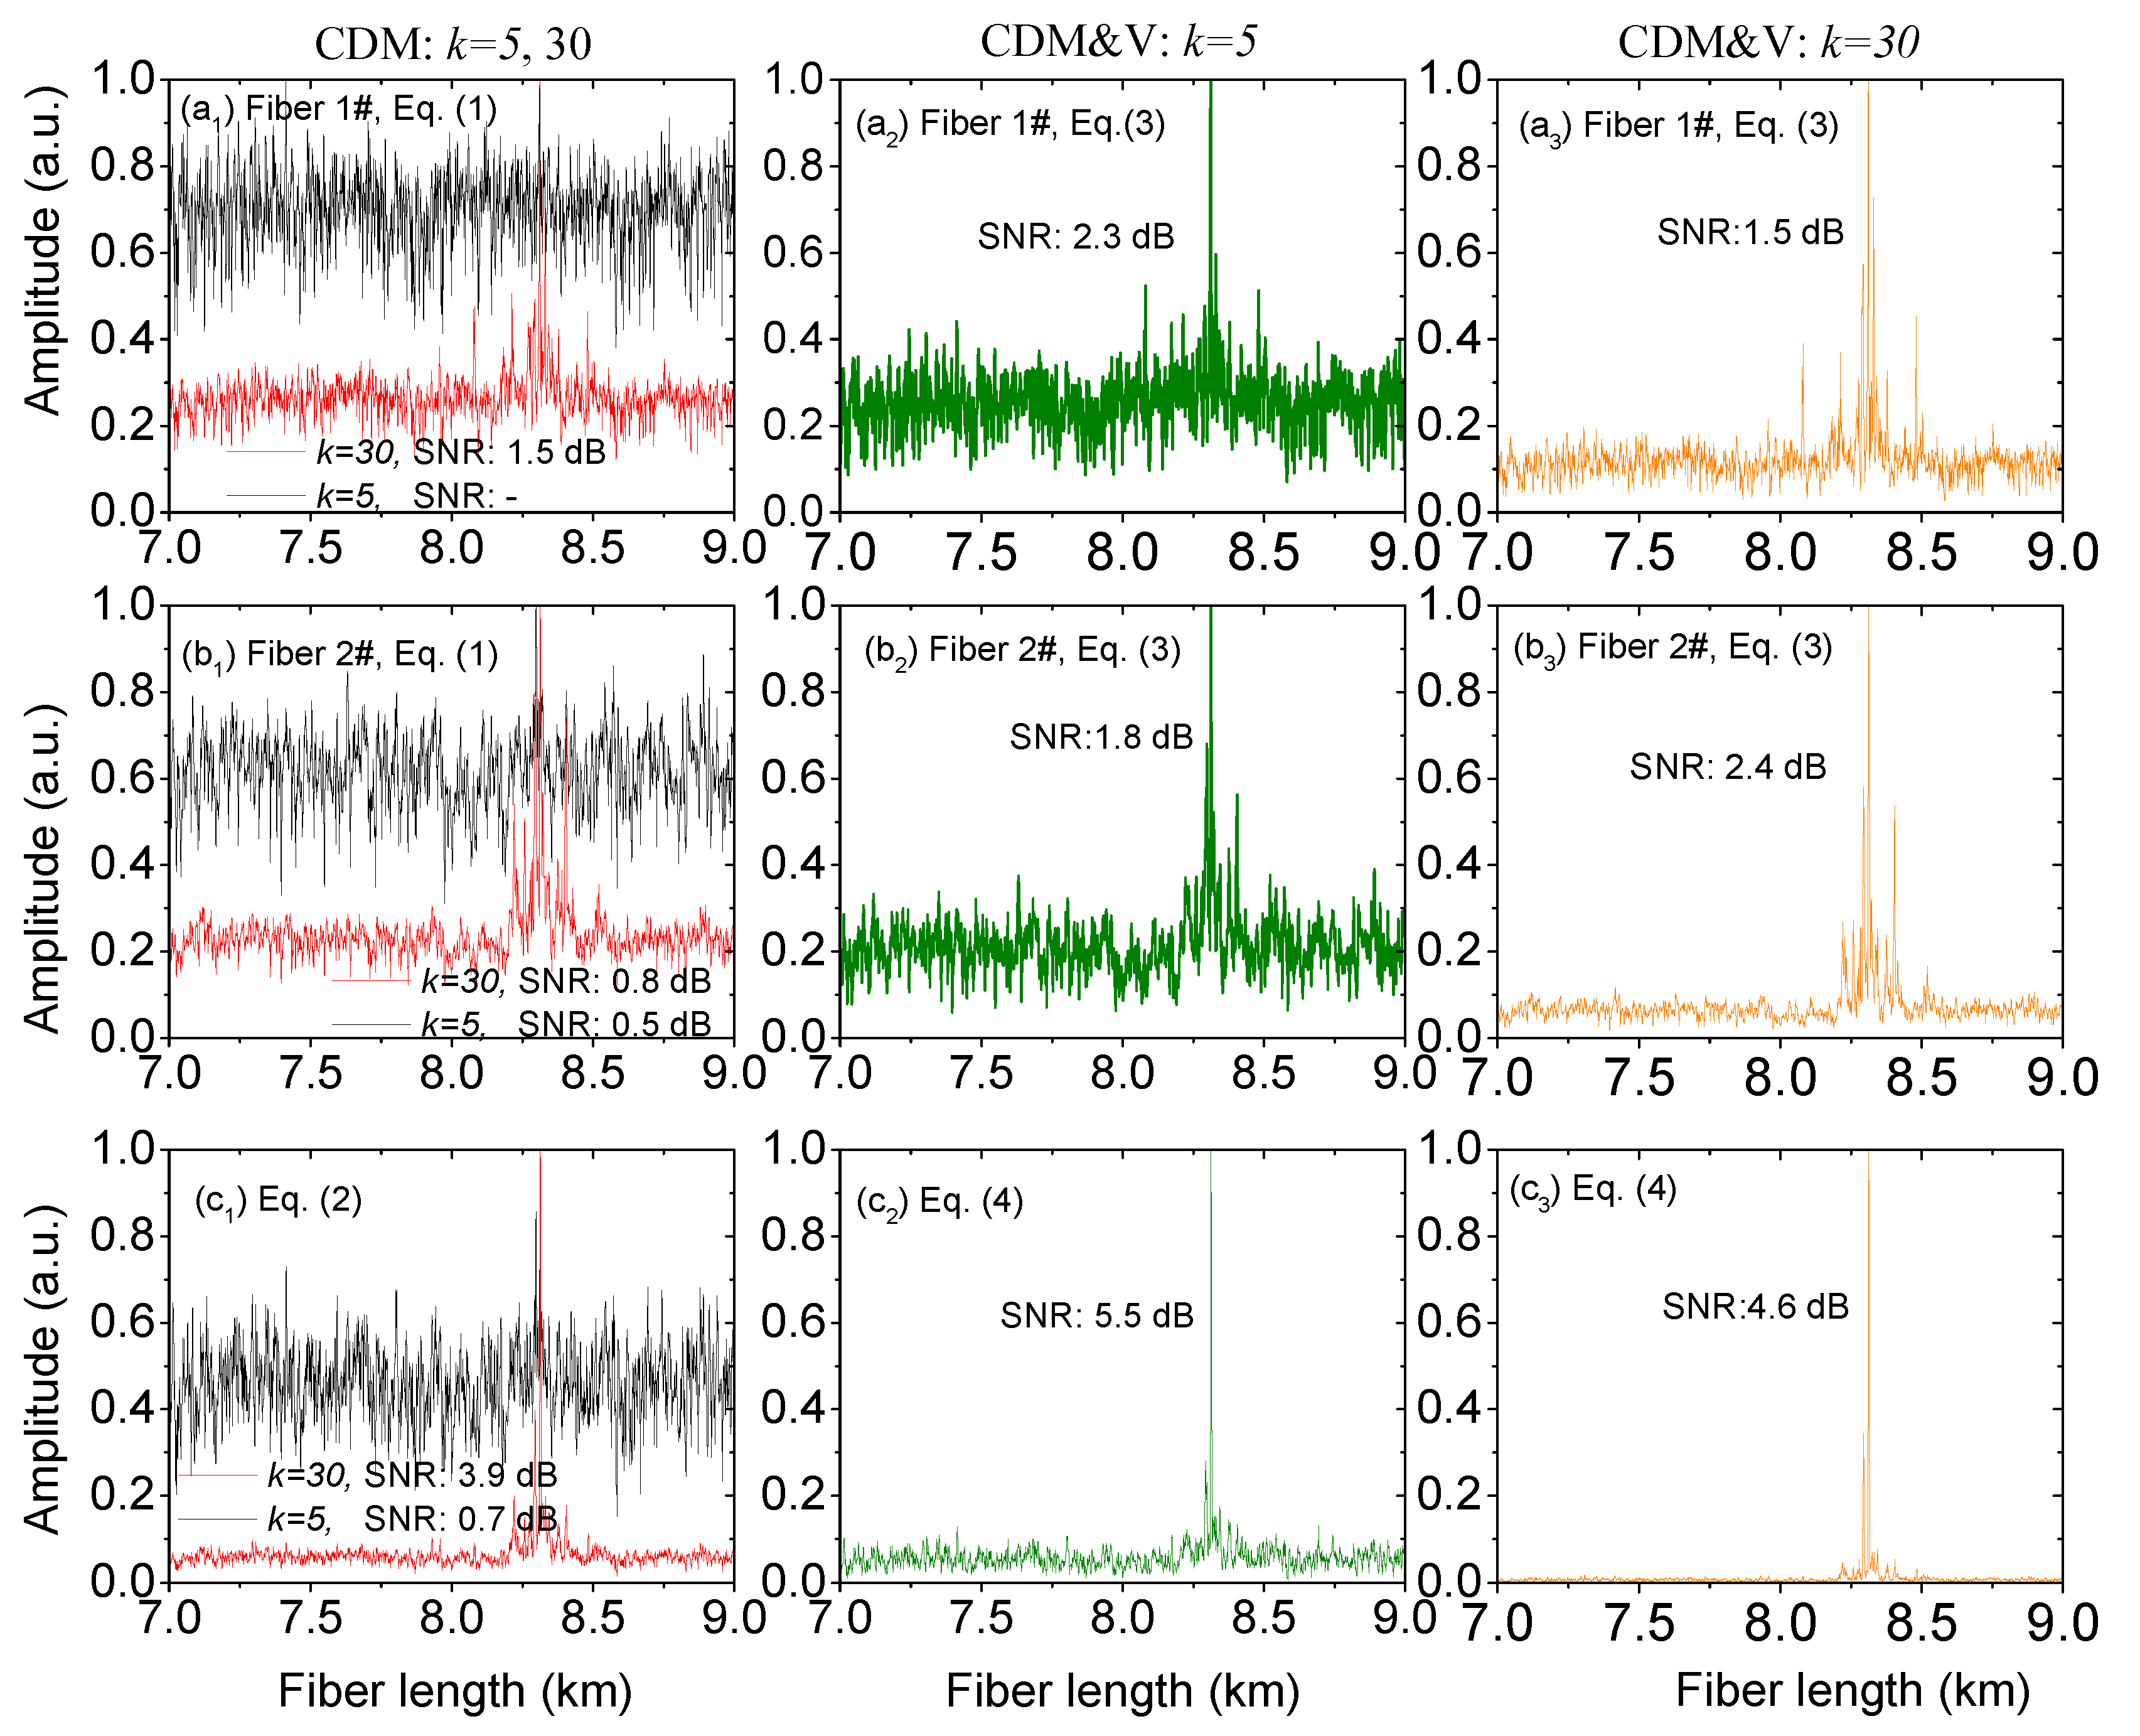
Figure 6.
Synthesized signals of the vehicle by the CDM and CDM&V at different locations. (a1, a2, a3) z = 8.3 km; (b1, b2, b3) z = 8.48 m; (c1, c2, c3) z = 8.57 m. The first column is computed by the CDM based on Equation (3), and the second and third are calculated by the CDM&V based on Equation (4).

Table 1.
SNR comparison between the CDM and CDM&V. No SNR value in Fiber 2# due to signal fading. The SNR is defined as a ratio between the peak power at the vibration position and that at the strongest side-peak not belonging to the main lobe.
Table 1.
SNR comparison between the CDM and CDM&V. No SNR value in Fiber 2# due to signal fading. The SNR is defined as a ratio between the peak power at the vibration position and that at the strongest side-peak not belonging to the main lobe.
| SNR | k | Fiber 1# | Fiber 2# | (Fiber 1#) × (Fiber 2#) |
|---|---|---|---|---|
| CDM | k = 1 | / | / | / |
| k = 100 | / | / | / | |
| k = 300 | 2.6 dB | / | 3.0 dB | |
| k = N/2= 1250 | 3.5 dB | / | 7.8 dB | |
| CDM&V | k = 1 | 2.4 dB | / | 4.5 dB |
| k = 100 | 3.3 dB | / | 5.7 dB | |
| k = 300 | 5.5 dB | / | 8.5 dB | |
| k = N/2 = 1250 | 5.9 dB | / | 13.9 dB |
Table 2.
Vibration signal comparison between the CDM and CDM&V.
| SNR | k | Fiber 1# | Fiber 2# | (Fiber 1#) × (Fiber 2#) |
|---|---|---|---|---|
| CDM | k = 1 | / | / | / |
| k = 5 | / | 0.5 dB | 0.7 dB | |
| k = 30 | 1.5 dB | 0.8 dB | 3.9 dB | |
| k = N/2 = 50 | 1.8 dB | 1.5 dB | 5.5 dB | |
| CDM&V | k = 1 | 1.8 dB | 1.7 dB | 2.3 dB |
| k = 5 | 2.3 dB | 1.8 dB | 5.5 dB | |
| k = 30 | 1.5 dB | 2.4 dB | 4.6 dB | |
| k = N/2 =50 | 3.6 dB | 3.8 dB | 7.9 dB |
Table 3.
Comparison of synthesized signal between the CDM and CDM&V.
| SNR | k | z = 8.30 km | z = 8.48 km | z = 8.57 km |
|---|---|---|---|---|
| CDM | k = 5 | 0.7 dB | / | / |
| k = 30 | 3.9 dB | 2.7 dB | 1.7 dB | |
| CDM&V | k = 5 | 5.5 dB | 2.9 dB | 2.1 dB |
| k = 30 | 4.6 dB | 5.8 dB | 4.2 dB |
© 2020 by the authors. Licensee MDPI, Basel, Switzerland. This article is an open access article distributed under the terms and conditions of the Creative Commons Attribution (CC BY) license (http://creativecommons.org/licenses/by/4.0/).
Share and Cite
MDPI and ACS Style
Xu, S.; Qin, Z.; Zhang, W.; Xiong, X. Monitoring Vehicles on Highway by Dual-Channel φ-OTDR. Appl. Sci. 2020, 10, 1839. https://doi.org/10.3390/app10051839
AMA Style
Xu S, Qin Z, Zhang W, Xiong X. Monitoring Vehicles on Highway by Dual-Channel φ-OTDR. Applied Sciences. 2020; 10(5):1839. https://doi.org/10.3390/app10051839
Chicago/Turabian StyleXu, Shaohua, Zujun Qin, Wentao Zhang, and Xianming Xiong. 2020. "Monitoring Vehicles on Highway by Dual-Channel φ-OTDR" Applied Sciences 10, no. 5: 1839. https://doi.org/10.3390/app10051839
Note that from the first issue of 2016, this journal uses article numbers instead of page numbers. See further details here.