Article

Mercury in Juvenile Solea senegalensis: Linking Bioaccumulation, Seafood Safety, and Neuro-Oxidative Responses under Climate Change-Related Stressors

by
Carolina Camacho
1,2,3,
Ana Luísa Maulvault
1,2,4,
Marta T. Santos
1,2,
Vera Barbosa
1,2,
Fabíola H. S. Fogaça
1,5,
Pedro Pousão-Ferreira
6,
M. Leonor Nunes
2,
Rui Rosa
4 and
António Marques
1,2,*
1
Division of Aquaculture, Seafood Upgrading and Bioprospection, Portuguese Institute of Sea and Atmosphere (IPMA, I.P.), Av. Doutor Alfredo Magalhães Ramalho 6, 1495-165 Algés, Portugal
2
Interdisciplinary Center of Marine Environmental Research (CIIMAR), University of Porto, Terminal de Cruzeiros do Porto de Leixões, Avenida General Norton de Matos S/N, 4450-208 Matosinhos, Portugal
3
Geobiotec-Earth Sciences Department, Faculty of Sciences and Technology, Nova University of Lisbon, Quinta da Torre, 2829-516 Caparica, Portugal
4
MARE-Marine Environmental Science Centre, Laboratório Marítimo da Guia, Faculdade de Ciências da Universidade de Lisboa, Av. Nossa Senhora do Cabo 939, 2750-374 Cascais, Portugal
5
Embrapa Agroindústria de Alimentos, Avenida das Américas, 29501 Guaratiba, 23020-470 Rio de Janeiro, Brazil
6
Aquaculture Research Station (EPPO), Portuguese Institute of Sea and Atmosphere (IPMA, I.P.), 8700-305 Olhão, Portugal
*
Author to whom correspondence should be addressed.
Appl. Sci. 2020, 10(6), 1993; https://doi.org/10.3390/app10061993
Submission received: 31 January 2020 / Revised: 5 March 2020 / Accepted: 9 March 2020 / Published: 14 March 2020

Abstract

:
Mercury (Hg) is globally recognized as a persistent chemical contaminant that accumulates in marine biota, thus constituting an ecological hazard, as well as a health risk to seafood consumers. Climate change-related stressors may influence the bioaccumulation, detoxification, and toxicity of chemical contaminants, such as Hg. Yet, the potential interactions between environmental stressors and contaminants, as well as their impacts on marine organisms and seafood safety, are still unclear. Hence, the aim of this work was to assess the bioaccumulation of Hg and neuro-oxidative responses on the commercial flat fish species Solea senegalensis (muscle, liver, and brain) co-exposed to dietary Hg in its most toxic form (i.e., MeHg), seawater warming (ΔT°C = +4 °C), and acidification (pCO2 = +1000 µatm, equivalent to ΔpH = −0.4 units). In general, fish liver exhibited the highest Hg concentration, followed by brain and muscle. Warming enhanced Hg bioaccumulation, whereas acidification decreased this element’s levels. Neuro-oxidative responses to stressors were affected by both climate change-related stressors and Hg dietary exposure. Hazard quotient (HQ) estimations evidenced that human exposure to Hg through the consumption of fish species may be aggravated in tomorrow’s ocean, thus raising concerns from the seafood safety perspective.

Graphical Abstract

1. Introduction

Mercury (Hg) is a metal of great concern to seafood consumers and health authorities, as it accumulates in some seafood species (e.g., References [1,2,3]) and has a high degree of environmental persistence and toxicity [4]. The environmental presence of Hg can be attributed to both natural causes (i.e., vulcanism and geothermal sources [5]) and anthropogenic activities (e.g., coal burning, mining, cement production, oil refining, etc. [5,6,7]). The mechanisms of Hg speciation, transfer across biological compartments, and bioaccumulation in marine organisms depend on species-specific factors, including age, gender, life cycle (e.g., Reference [8]), and feeding and migratory behaviors [9]. Yet, previous literature evidenced that such mechanisms are also strongly influenced by the surrounding abiotic conditions (e.g., seawater temperature and pH [10,11]).
Methylmercury (MeHg; CH3Hg) is the predominant form of Hg in seafood species [2,12,13], as well as the most stable, bioaccumulative/biomagnifiable, and toxic form (e.g., Reference [14]), being responsible for adverse effects in humans due to its neurotoxicity, mainly neurological alterations [11,15,16]. From an ecological perspective, increased levels of MeHg contamination were previously associated with diminished animal resilience [17,18], reproductive success [19], and biodiversity [20]. In line with these impacts, previous studies on marine species exposed to MeHg reported altered molecular responses, including enhanced oxidative stress, tissue damage [21], endocrine disruption, and genotoxicity [22]. Furthermore, since brain tissues are relatively permeable to MeHg [23], this compound is neurotoxic, promoting negative impacts in vertebrate species cholinergic systems, including alterations of acetylcholinesterase (AchE) activity [24,25], as well as sensory and cognitive impairments [26].
In parallel, marine species are sensitive to changes in the surrounding abiotic conditions (e.g., temperature, pH, oxygen, and salinity), as such alterations can affect their metabolic processes [27,28] and physiological performance, consequently compromising their resilience to stressors (e.g., chemical contamination) that can occur concomitantly. In this way, the projected climate effects, including seawater warming up by +4.8 °C and acidification down by −0.4 pH units [29], are expected to further push marine biota toward their thresholds of physiological tolerance, especially in species inhabiting coastal areas, which are already naturally exposed to strong tidal and/or seasonal variations, as well as to anthropogenic impacts [30]. Furthermore, the increased exposure and bio-amplification of CH3Hg in marine food webs under scenarios of climate change forcing (based on relative concentration pathways (RCP): RCP 2.6 = mitigation scenario/low emission of greenhouse gases (GHG); RCP 8.5 = high GHG emissions), triggering changes in ocean temperatures, pH (acidification), dissolved oxygen, and primary production, was demonstrated with modeling work [31]. By affecting contaminants’ speciation and transfer [32,33] and altering animal metabolism and fitness [34,35,36], changes to climate can negatively influence the way marine species bioaccumulate and detoxify chemical contaminants, such as MeHg, in a climate-dominant process, defined as climate change-induced susceptibility and sensitivity to pollutants [37]. Physiological alterations in marine species to overcome the stress induced by these interactive stressors can then translate into dramatic long-term implications to marine ecosystems that may compromise the sustainability of fisheries and aquaculture sectors, as well as the safety of seafood consumers [38].
Solea senegalensis is a common estuarine flat fish in southwest Europe, with great economic importance to both fisheries and aquaculture sectors, due to its high market value [6]. Given its benthic behavior, S. senegalensis typically lives and interacts with the seabed of coastal waters, making this species particularly susceptible to sediment chemical contamination [39], accumulating, for example, polycyclic aromatic hydrocarbons from impacted areas [40]. Furthermore, by feeding on fish spawns, crustaceans, and small benthic invertebrates [6], this species can also biomagnify chemical contaminants through trophic transfer, particularly those that are highly persistent and have lipophilic behavior, such as MeHg. These ecological features and the great economic importance make S. senegalensis an ideal biological model to study not only the effects of abiotic variables on tissue bioaccumulation/elimination and ecotoxicological responses to Hg exposure, but also the effects of climate change-related stressors on seafood safety.
In this context, this work aimed to assess the bioaccumulation and elimination mechanisms of Hg, as well as the neuro-oxidative responses in juvenile S. senegalensis (muscle, liver, and brain tissues) exposed to the interactive effects of dietary MeHg, seawater warming (ΔT °C = +4 °C), and acidification (pCO2 = +1000 µatm, equivalent to ΔpH = −0.4 pH units). The potential risks associated with the consumption of Hg-contaminated seafood under the abiotic conditions expected to prevail in the future were also estimated.

2. Materials and Methods

2.1. Experimental Feeds

Two experimental feeds (one control non-contaminated, i.e., non-CONT feed, and one Hg feed, i.e., CONT feed) were produced by the company SPAROS Lda. Both feeds had similar proximate chemical composition (according to the nutritional requirements of juvenile sole) and were produced following the methodology previously described in detail [26]. Mercury enrichment in CONT feed was performed by solubilizing MeHg(II) chloride form (CH3ClHg, 99.8% Sigma-Aldrich) in a small volume of ethanol (5 mL), and that solution was then added to feed oils before pellet extrusion. The final Hg concentration in CONT feed was 8.51 ± 0.15 mg∙kg−1 (dry weight, DW), whereas, in non-CONT feed, Hg concentration was 0.08 ± 0.02 mg∙kg−1 DW (due to its natural presence in fish oils used during feed preparation). Hg final concentrations in both experimental feeds were considered environmentally representative of levels usually found in natural preys of juvenile S. senegalensis inhabiting contaminated coastal areas [20].

2.2. Organisms and Acclimation

The experiment took place at Laboratório Marítimo da Guia (LMG) (Cascais, Portugal) in a recirculation aquaculture system (RAS) equipped with seawater chiller systems (±0.1 °C, Frimar, Fernando Ribeiro, Lda., Portugal) connected to thermostat heaters (V2Therm, TMC Iberia, Portugal), pH control (automatically adjusted with a Profilux® controlling system linked to individual pH probes; GHL, Kaiserslautern, Germany), protein skimmers (Reef SkimPro 450, TMC Iberia, Portugal), ultraviolet (UV) disinfection (Vector 120 nano, TMC Iberia, Portugal), biological filtration (FSBF 1500F, TMC Iberia, Portugal), and chemical filtration (active charcoal).
Juvenile (and sexually undifferentiated) S. senegalensis specimens (n = 200; total length = 8.73 ± 0.89 cm; weight = 7.63 ± 2.08 g), reared at Portuguese Institute of Sea and Atmosphere (IPMA) aquaculture facilities (Olhão, Portugal), were transported in isolated containers with constant aeration to LMG, where they were randomly and equitably distributed in 24 tanks. Specimens were acclimated for 15 days, under the following conditions: temperature = 19 °C, pH = 8.0, salinity = 35‰, dissolved oxygen >6 mg∙L−1, and a 14-h/10-h light/dark photoperiod. Five days before initiating the exposure to the three studied stressors, seawater temperature and pH were slowly adjusted in tanks simulating climate change effects (increase by 1 °C and decrease by 0.1 pH units, per day, respectively) until reaching the experimental levels defined. Water abiotic parameters were daily monitored, using a multiparameter device (Multi 3420 SET G, WTW, Oberbayern, Germany), and adjusted whenever needed. Every two days, water exchange of about 10% (total water volume) was performed to maintain water quality. Ammonia, nitrite, and nitrate levels were monitored in each tank on a weekly basis using colorimetric test kits from Aquamerck®. Ammonia and nitrite values were kept below detection, whereas nitrates were kept below 2.0 mg∙L−1.

2.3. Experimental Design

Eight treatments (four non-contaminated and four contaminated treatments) were conducted (three tank replicates per treatment), where fish were daily fed (~1.5% of their body weight) with a non-contaminated feed (non-CONT) or with a contaminated (MeHg-enriched) feed (CONT; Hg), respectively. Additionally, two temperature and pH levels were simulated, in a full cross-factorial experimental design, i.e., T1 = 19 °C and T2 = 23 °C, corresponding to the optimal S. senegalensis rearing temperature and +4 °C of seawater warming (W), respectively (scenario RPC8.5 [29]), and pH1 = 8.0 units and pH2 = 7.6 units, corresponding to the optimal S. senegalensis rearing pH and −0.4 pH level of seawater acidification (A), respectively (scenario RPC8.5 [29]). In this way, the eight treatments were defined as follows: (i) non-CONT; (ii) non-CONT + A; (iii) non-CONT + W; (iv) non-CONT + A + W; (v) CONT; (vi) CONT + A; (vii) CONT + W; (viii) CONT + A + W. After 28 days of exposure to the conditions mentioned above, an additional seven days of MeHg clearance phase was also carried out, by feeding all specimens (including those from CONT treatments) with non-CONT feed. As oxygen limitation is one of the fundamental mechanisms determining the biological responses of fish to environmental changes, especially increases in seawater temperature [41], the average concentration for dissolved oxygen during the experiment was 7.29 ± 0.02 mg∙L−1 and 6.91 ± 0.02 mg∙L−1 for T1 = 19 °C and T2 = 23 °C, respectively.

2.4. Sampling

To assess Hg bioaccumulation and elimination in fish tissue, two fish from each replicate non-CONT condition (i.e., seawater temperature set for 19 °C and pH for 8.0), as well as from all CONT treatments, were collected on days 0, 14, 28 (exposure), and 35 (elimination). To assess the neuro-oxidative responses to the interactive effects of Hg dietary exposure, warming, and acidification, three fish from each treatment (i.e., including all non-CONT and CONT cross-factorial scenarios) were collected on day 28 (i.e., maximum Hg exposure). After being anesthetized with tricaine methanesulfonate (MS222, 200 mg∙L−1; Sigma-Aldrich, MO, USA), buffered with sodium bicarbonate (1 g of NaHCO3, 1 g of MS222, and 1 L of seawater), specimens were sacrificed by cervical dissection, following the legal regulations (EU Directive 2010/63) and the procedures approved by the Ethical Committee of the Faculty of Sciences of Lisbon University. Euthanized fish were measured, and tissues were dissected (i.e., muscle, liver, and brain collected). For Hg quantification, tissue samples were immediately frozen at −80 °C, freeze-dried at −50 °C, 10−1 atm for 48 h (Heto Power Dry LL3000; Thermo Fisher Scientific, Tehovec-Mukarov, Czech Republic), homogenized, and maintained at −80 °C until further analysis. For the analysis of neuro-oxidative biomarkers, fish tissues were homogenized with a tissue grinder (Ultra-Turrax, Ika, Staufen, Germany) in ice-cold conditions in order to prevent changes in protein and enzyme activities. A volume of 2 mL of 50 mM saline phosphate buffer (PBS, pH 7.4) was used for muscle and liver homogenization and 500 µL was used for brain. Tissue homogenate extracts were then centrifuged (10,000× g for 15 min at 4 °C), and the supernatant fraction was collected and divided in three microtubes to avoid losses in enzyme activity in the freeze–thaw step [42]. These microtubes were immediately stored and kept at −80 °C until further analysis.

2.5. Total Hg and MeHg Determination

Total mercury (THg) extraction from samples (fish tissues and feed, n = 3), as well as methylmercury (MeHg), was performed according to the methodologies previously described [25,26,43]. Both THg and MeHg concentrations were determined by atomic absorption spectrometry, using an automatic Hg analyzer (Leco apparatus AMA 254, LECO, St. Joseph, MI, USA). The detection limit of the methodology was 0.005 mg∙kg−1. Results were obtained in mg∙kg−1 DW and subsequently converted to wet weight basis according to sample moisture contents. To avoid contamination, all laboratory material was cleaned beforehand with nitric acid (20% v/v for 24 h) and then rinsed with ultrapure water. All analyses were performed in triplicate and using reagents of pro analysis grade or higher. Certified reference materials (DORM-4 and TORT-4, National Research Council of Canada, Canada) were used to check accuracy. Results obtained (n = 6) in the present study for THg (DORM-4: 0.410 ± 0.055 mg∙kg−1; TORT-4: 0.27 ± 0.06 mg∙kg−1) and for MeHg (0.152 ± 0.013 mg∙kg−1) were within the range of certified values.

2.6. Biochemical Analysis

To assess protein content, the Bradford assay [44] was performed in a 96-well flat-bottom plate to quantify soluble protein. Briefly, 190 µL of Bradford reagent (Comassie Blue G-250 in methanol, H3PO4, and ultrapure water) was added to each well along with 10 µL of each sample extract or standards. The absorption was read at 595 nm (microplate reader; BioRad, Benchmark, Los Alamitos, CA, USA) indicating protein-binding to Coomassie Brilliant Blue G-250. A calibration curve was constructed using bovine serum albumin as protein standard (0–2 mg∙mL−1 BSA, Sigma, Saint Louis, MO, USA).
Acetylcholinesterase (AchE) activity was determined with a modified method initially proposed by Ellman et al. [45] and adapted to 96-well plates [46]. Briefly, 25 µL of brain extract or assay buffer (for blanks) was added to two microplate wells, and then 250 µL of an acetylthiocholine fresh reaction mixture (50 mM phosphate buffer 8.0, 75 mM acetylthiocholine iodide solution and 1.0 mM 5,5′-dithiobis (2-nitrobenzoic acid)) was added into each microplate well. The microplate was gently shaken for 30 s and the absorbance was read (415 nm) every minute for 10 min. AchE activity was expressed as nmol∙min−1∙mg−1 protein (after normalization using samples’ crude protein content).
Catalase (CAT) activity was assessed using a method adapted from Johansson and Borg [47], which measures the rate of removal of H2O2. Briefly, 20 µL of sample extract, 100 µL of assay buffer (100 mM KH2PO4, pH 7.0), 30 µL of methanol, and 20 µL of H2O2 (as substrate) were shaken in darkness for 20 min at ambient temperature. Then, 30 µL of 10 M KOH and 30 µL of 34.2 M Purpald (prepared in 0.5 M KCl) were added and incubated for 10 min in the same conditions. To finalize the reaction, 10 µL of 65.2 mM potassium periodate (prepared in 0.5 M KOH) was added, and the absorbance was read at 540 nm wavelength. A blank and a positive control were performed in each sample batch in order to validate the method. Eight standards from 4.25 mM formaldehyde were prepared with concentrations ranging from 0–100 µM to perform a calibration curve. Formaldehyde concentration in the sample was determined using the equation obtained from linear regression of the standard curve, formaldehyde (µM) = ((sample absorbance − y intercept)/slope) × (0.17/0.02), where 0.17 corresponds to the extinction coefficient and 0.02 corresponds to the total volume in each well plate. Then, CAT activity was calculated assuming that one unit is the amount of enzyme that causes the formation of 1.0 nmol of formaldehyde per minute. Thus, CAT activity was expressed in nmol∙min−1∙mg−1 protein = (µM of sample/20 min) × sample dilution × protein content.
Superoxide dismutase (SOD) activity was determined using a spectrophotometric method described in detail elsewhere [48]. Briefly, to each microplate well, 10 µL of sample or SOD standard (Sigma-Aldrich, Germany) and a mixture of 200 µL of 50 mM phosphate buffer (pH 7.4), 10 µL of 3 mM xanthine, 10 µL of 0.75 mM nitroblue tetrazolium (NBT), and 10 µL of 100 mU xanthine oxidase solution (XOD) were added. A negative control (without sample or SOD standard) was also assayed. Sample absorbance was read at 540 nm every minute for 15 min. SOD activity was expressed as inhibition percentage (% SOD inhibition) calculated with the following formula: (Abs∙min−1 of negative control − Abs∙min−1 of sample)/(Abs∙min−1 of negative control) × 100.
To assess lipid peroxidation (LPO), a procedure was adapted according to the thiobarbituric acid reactive species (TBARS) principle [49]. In a 2-mL microtube, 20 µL of each sample aliquot was added to 30 µL of phosphate buffer (50 mM, pH = 7.4), followed by 12.5 µL of sodium dodecyl sulfate as tensioactive (8.1%), 93.5 µL of trichloroacetic acid (20%, pH = 3.5), 93.5 µL of thiobarbituric acid (1%), and 50.5 µL of Milli-Q grade ultrapure water. The mixture was vortexed for 20 s and microtube lids were punctured with a needle and then incubated in boiled water. Ten minutes later, samples were cooled in ice and 62.5 µL of ultra-pure water were added. Then the mixture was centrifuged at 10,500× g for 5 min; 150 µL from each reaction was transferred, in duplicate, into a 96-well microplate and the absorbance was read at 540 nm. In order to quantify lipid peroxides, a calibration curve (0–0.3 µM malondialdehyde, Merck, Darmstadt, Germany) and blanks were performed using the same sample procedure. The results were expressed in relation to samples’ protein content (nmol∙mg−1 protein).

2.7. Data Analysis

Fulton’s condition index (K) was determined from the biometric data, according to the following formula [50]:
K = 100 (W/L3),
where W is the animal weight (g) and L is the total length (cm). Mercury net accumulation rates (NAR; mg∙kg−1∙day−1) for each tissue and treatment were determined after 14 and 28 days of exposure, as follows [51]:
NARt = ([THgt] tissue/t),
where [THgt] is the average total Hg concentration in fish tissue after 14 and 28 days of exposure. The THg elimination factor (EF) after seven days of elimination (i.e., at day 35 of the trial) was calculated according to the following formula:
EF (%) = 100 − ((CDay35/CDay28) × 100),
where CDay35 is the average concentration (mg∙kg−1 wet weight (ww)) in the fish tissue from each contaminated treatment at day 35 (elimination phase), and CDay28 is the average concentration (mg∙kg−1 ww) in the fish tissue at the end of the exposure period [52]. Considering that, after seven days of elimination, EF values were approximately or below zero in the brain and muscle, only the EF values obtained in the liver were considered in data analysis.
The percentage of Hg tolerable weekly intake (TWI) achieved with the consumption of contaminated fish species was estimated under the present and future climate conditions, using the empirical data acquired in the present study, as well as data reported in previous studies using two ecologically distinct pelagic species (Argyrososmus regius [25] and Dicentrachus labrax [43]). To do so, the TWI value of 4 µg∙kg−1 body weight (bw) [4] was used, and a weekly consumption of 150 g of fish by adults with an average body weight, bw, of 70 kg [4] was considered. Values were presented as percentage change in the contribution of Hg TWI (%) accomplished with the consumption of contaminated fish (muscle) reared under climate change effects in relation to normal T and pH conditions.
The hazard quotient (HQ) is frequently used to calculate the risk of a certain population to the exposure of a particular contaminant. To this purpose, values were determined according to the following equation [53]:
HQ = (EF × ED × FIR × C)/(RfD × WAB × TA) × 10−3,
where EF denotes exposure frequency (365 days/year), ED is the exposure duration (70 years), FIR is the fish ingestion rate (seafood: 61.55 g/capita/day [54]), C is Hg concentration in seafood (µg∙g−1, determined or predicted, according to the scenarios), RfD is the oral reference dose (5 × 10⁻⁴ µg∙g−1∙day−1 for Hg [53]), WAB is the average body weight (70 kg), and TA is the average exposure time for non-carcinogens (365 days × ED). HQ values <1 imply that the exposed population is unlikely to experience obvious adverse effects, while HQ >1 mean that the possibility of harmful effects to human health cannot be excluded [53]. The HQ baseline reference was calculated according to Hg concentrations registered for both demersal (sole [55], flounder and mullet [2], halibut [56], Atlantic cod [57], and herring [58]) and pelagic wild species (meagre [59], seabass [60], black scabbard fish [12], bluefin tuna [3], fresh tuna, tope-shark [61], and Atlantic mackerel [62]). This baseline was compared with the estimated HQ under climate change scenarios (warming, acidification, and both warming and acidification) for demersal species, assessed according to the percentage variation for each scenario in S. senegalensis (this study). For pelagic species, the variation encountered for A. regius was considered [25].
Statistical analysis was conducted at a significance level of 0.05, using the STATISTICA data analysis software system (version 8.0., StatSoft, Inc., 2007, Tulsa, OK, USA). All data were checked for normality (Kolmogorov–Smirnov test) and homogeneity of variances (Levene’s test) and transformed when needed to comply with ANOVA assumptions. To evaluate the effects of seawater temperature and pH level on Hg levels and NAR in tissues, after 28 days of exposure, a two-way ANOVA was employed. For biomarker data, differences between treatments were analyzed (for both non-CONT and CONT for each tissue) by one-way analysis of variance (ANOVA), and the Tukey honestly significant difference (HSD) post hoc test was used for multiple comparisons. For each condition (temperature and pH), differences between non-CONT and CONT scenarios were evaluated by Student’s t-test. Finally, Pearson correlation coefficients (r) between biometric data, NAR and biometric data, Hg levels and biometric data, and Hg levels and biomarkers were also calculated.

3. Results

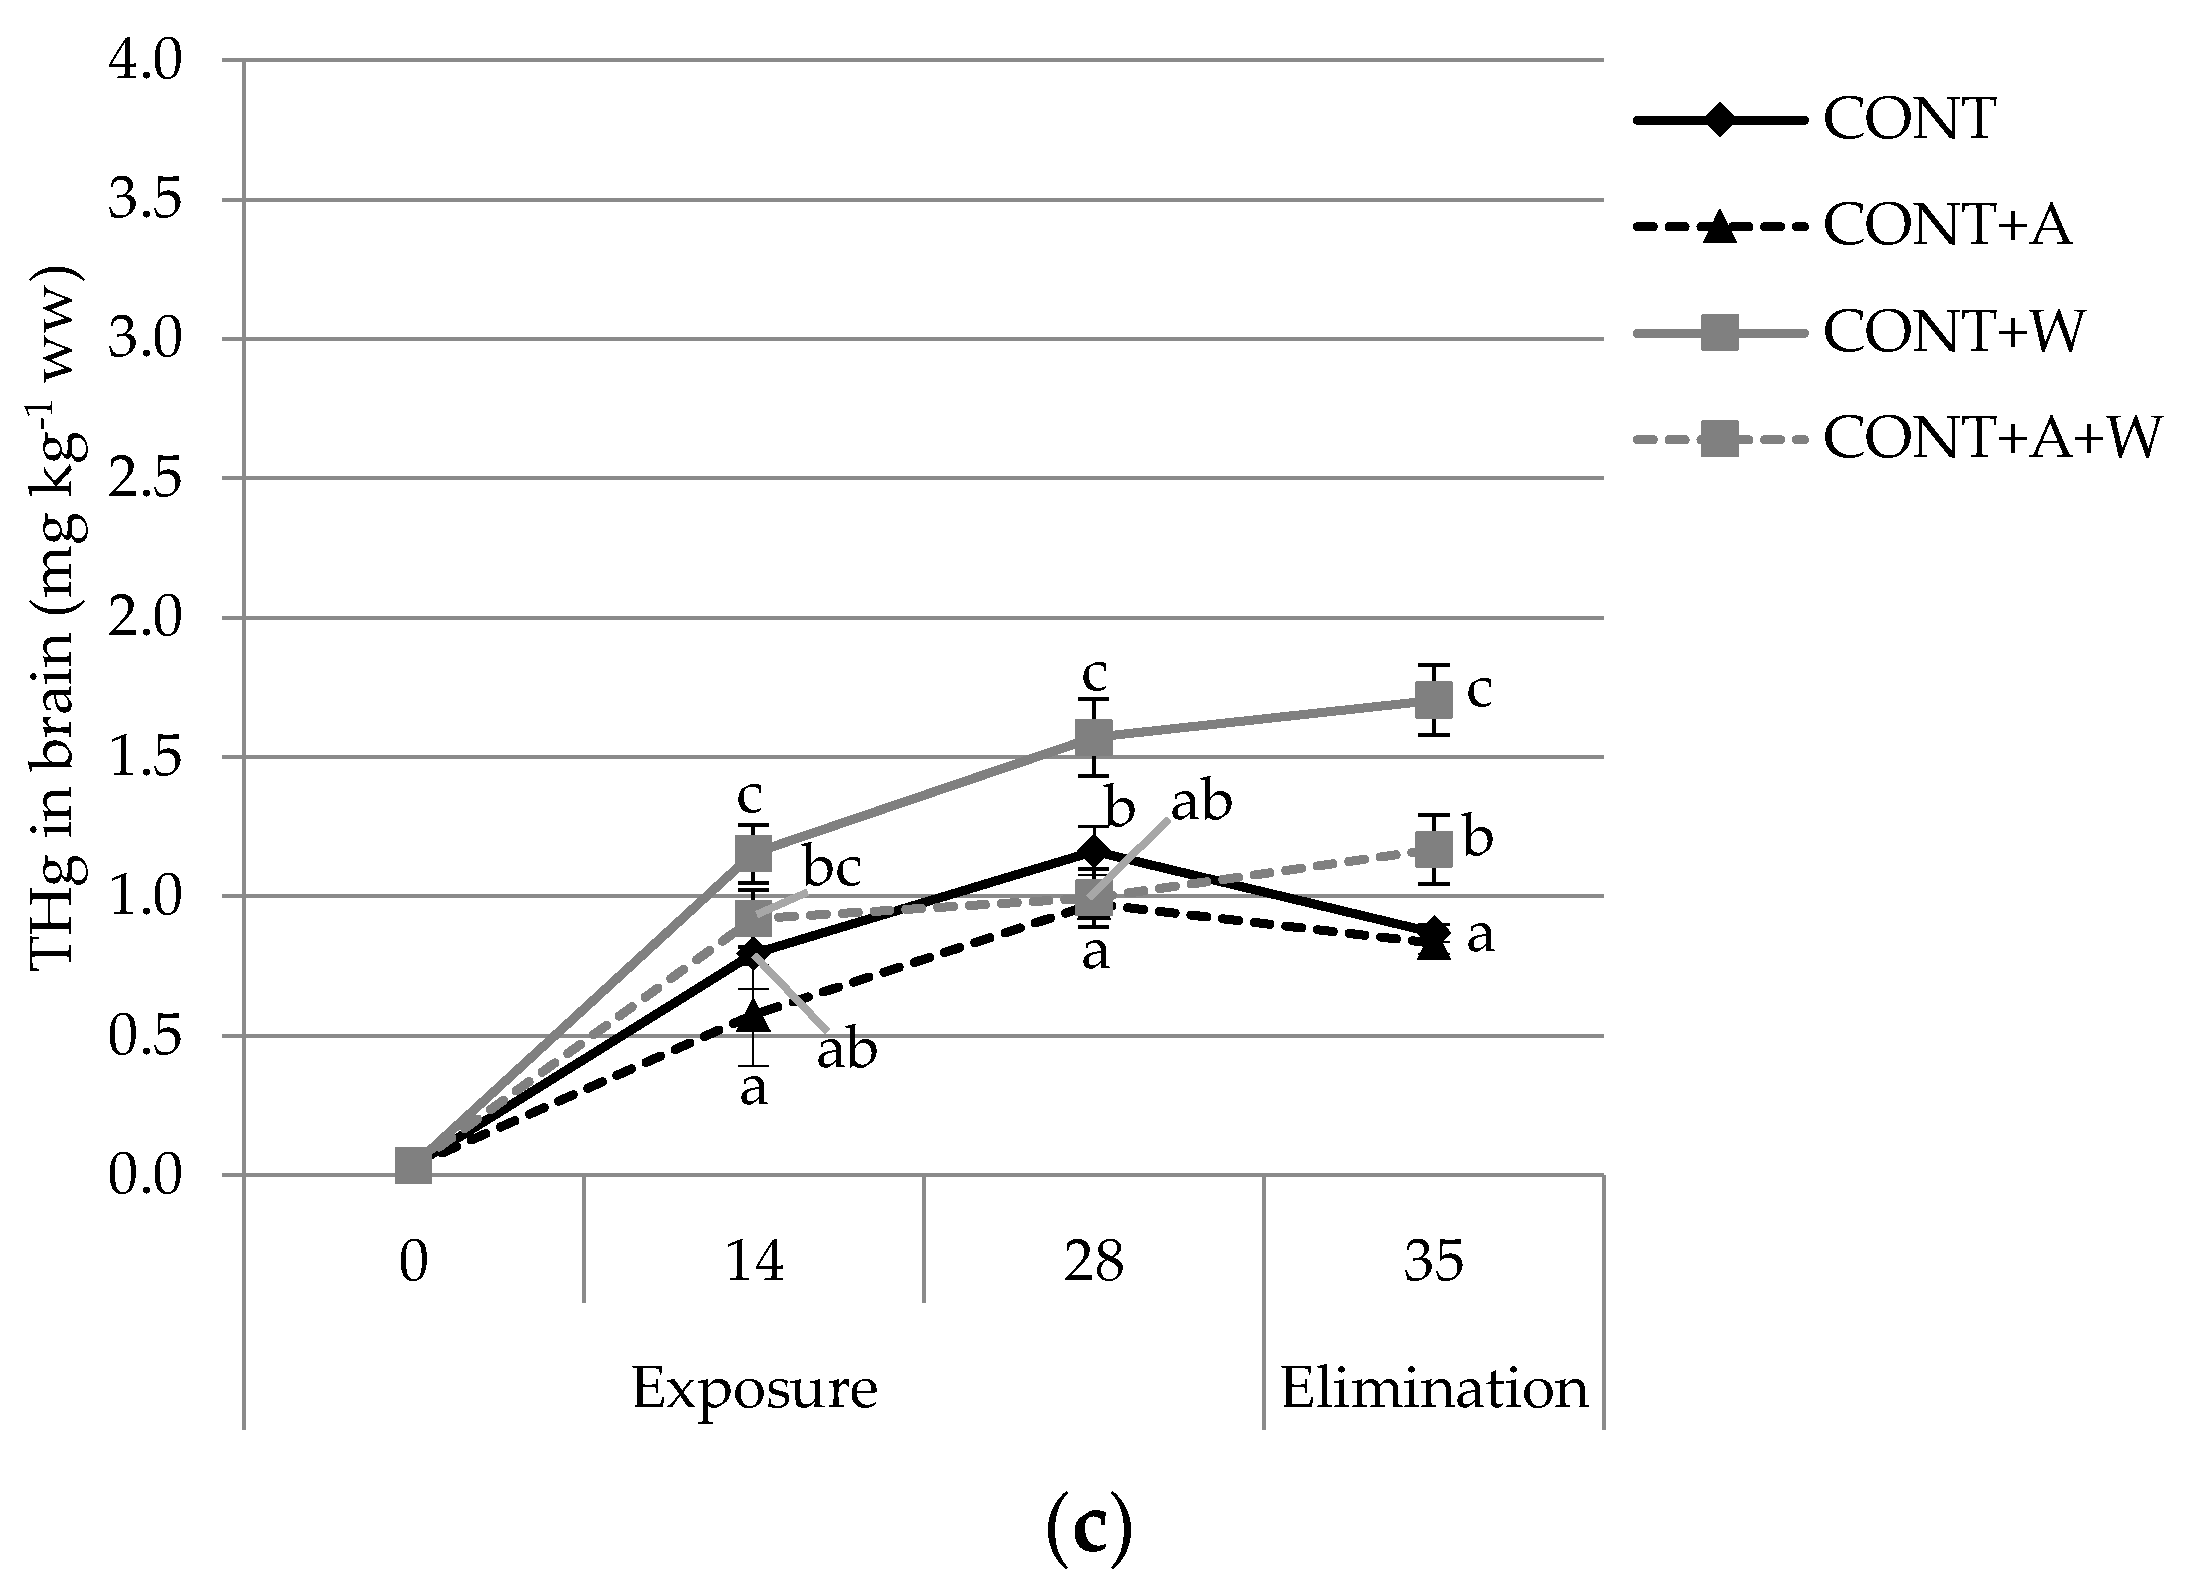
3.1. Mercury Bioaccumulation and Tissue Partioning

In the beginning of the experiment (day 0), significantly lower THg concentration (p < 0.012) was detected in brain (0.04 ± 0.01 mg∙kg−1 ww) than those found in liver (0.07 ± 0.01 mg∙kg−1 ww; p = 0.012) and muscle (0.09 ± 0.01 mg∙kg−1 ww; p = 0.002) (Table S1, Supplementary Materials). After 28 days, fish from the non-contaminated (non-CONT) treatment exhibited significantly higher THg concentrations in the muscle (0.12 ± 0.01 mg∙kg−1 ww; p = 0.003), compared to the initial day (Table S1, Supplementary Materials). THg concentrations in S. senegalensis tissues in CONT treatments throughout the experiment are presented in Figure 1.
In general, the liver exhibited higher Hg concentrations (ranging from 2.52 to 4.29 mg∙kg−1 ww), followed by brain (ranging from 0.97 to 1.57 mg∙kg−1 ww) and muscle (ranging from 0.83 to 2.14 mg∙kg−1 ww), regardless of treatment (Figure 1).
Acidification (i.e., CONT + A treatment) significantly decreased Hg concentrations in muscle (47% decrease; p = 0.0001), liver (29% decrease; p = 0.0001), and brain (16% decrease; p = 0.03) compared to Hg exposure alone (i.e., CONT treatment). In opposition, warming (i.e., treatment CONT + W) significantly increased Hg concentrations in all fish tissues (p < 0.001; 36%, 19%, and 35% in muscle, liver, and brain, respectively; see Figure 1). Matching these results, Hg net accumulation rate (NAR) significantly varied among tissues and treatments (Table 1).
Liver presented the highest Hg NARs, regardless of treatment (ranging between 87.6 and 150.6 mg∙day−1), whereas lower NARs were found in the muscle (26.5 mg∙day−1) and brain (73.3 mg∙day−1; Table 1). In fish muscle, Hg NARs were significantly enhanced by the combination of warming and acidification (treatment CONT + A + W; p < 0.05), as well as by warming, but they significantly decreased with acidification. In contrast, NARs in fish brain and liver were significantly affected by warming or acidification alone (i.e., in liver, CONT treatment significantly increased upon warming, p = 0.0002, and decreased upon acidification, p = 0.001), but not by the combination of warming and acidification (i.e., in brain, CONT treatment significantly increased upon warming alone, p = 0.0003, but not upon the interaction between these two abiotic stressors or acidification alone).
During the seven days of the Hg clearance period (i.e., day 35), different elimination patterns were observed in the three tissues (Figure 1). Hg contents varied between 1.1 and 2.2 mg∙kg−1 ww, 1.1 and 3.4 mg∙kg−1 ww, and 0.7 and 1.7 mg∙kg−1 ww in the muscle, liver, and brain, respectively. During this phase, Hg concentrations remained higher in the treatment simulating warming alone (i.e., CONT + W), whereas the lowest values were found in fish exposed to acidification alone (CONT + A), regardless of tissue. These results translated into Hg elimination percentages between 19.6% (CONT + W treatment) and 56.8% (CONT + A treatment) in fish liver, whereas Hg elimination was extremely low (close to 0%) in muscle and brain (Table 1).

3.2. Climate Change-Related Stressors and Potential Impacts on Seafood Safety

Considering that Hg content and bioavailability in seafood may alter in a climate change context, the risk of dietary exposure to Hg through the consumption of S. senegalensis (present data), as well as of two other commercial fish species assessed in previous studies (meagre A. regius [25] and seabass D. labrax [43]), was evaluated (Table 2).
The consumption of seafood in an ocean warming context (alone or combined with acidification) led to a higher Hg exposure in sole (36% increase), meagre (40% increase), and seabass (21% increase; Table 2). The hazard quotient (HQ) was also calculated in order to assess the potential hazards posed by the ingestion of Hg contaminated seafood harvested in Europe in a climate change context [63]. As such, in the present study, HQs were estimated for various wild fish species of commercial relevance in Europe, accounting for Hg levels reported in literature (in field/environmental monitoring studies), as well as integrating the changes in Hg bioaccumulation expected to occur under warming and acidification conditions (based on the present findings) (Table 3).
Demersal species that present lower HQ estimations based on Hg levels found in literature were mullet and herring (0.07 and 0.09, respectively), followed by sole (0.31), flounder (0.37), Atlantic cod (0.41), and halibut (0.66). Despite some pelagic species presenting low HQ levels (seabass and Atlantic mackerel), the majority presented HQ levels above one, particularly black scabbard fish, tunas, and tope shark (Table 3).
Even though HQ estimations were higher under the predicted climate change scenarios, especially in a warming context (i.e., under +4 °C), HQ levels remained below one for demersal species (Table 3). When acidification data were used (regardless of temperature), HQ estimations remained similar to those obtained under the control pH level (i.e., around 8.0 pH units).

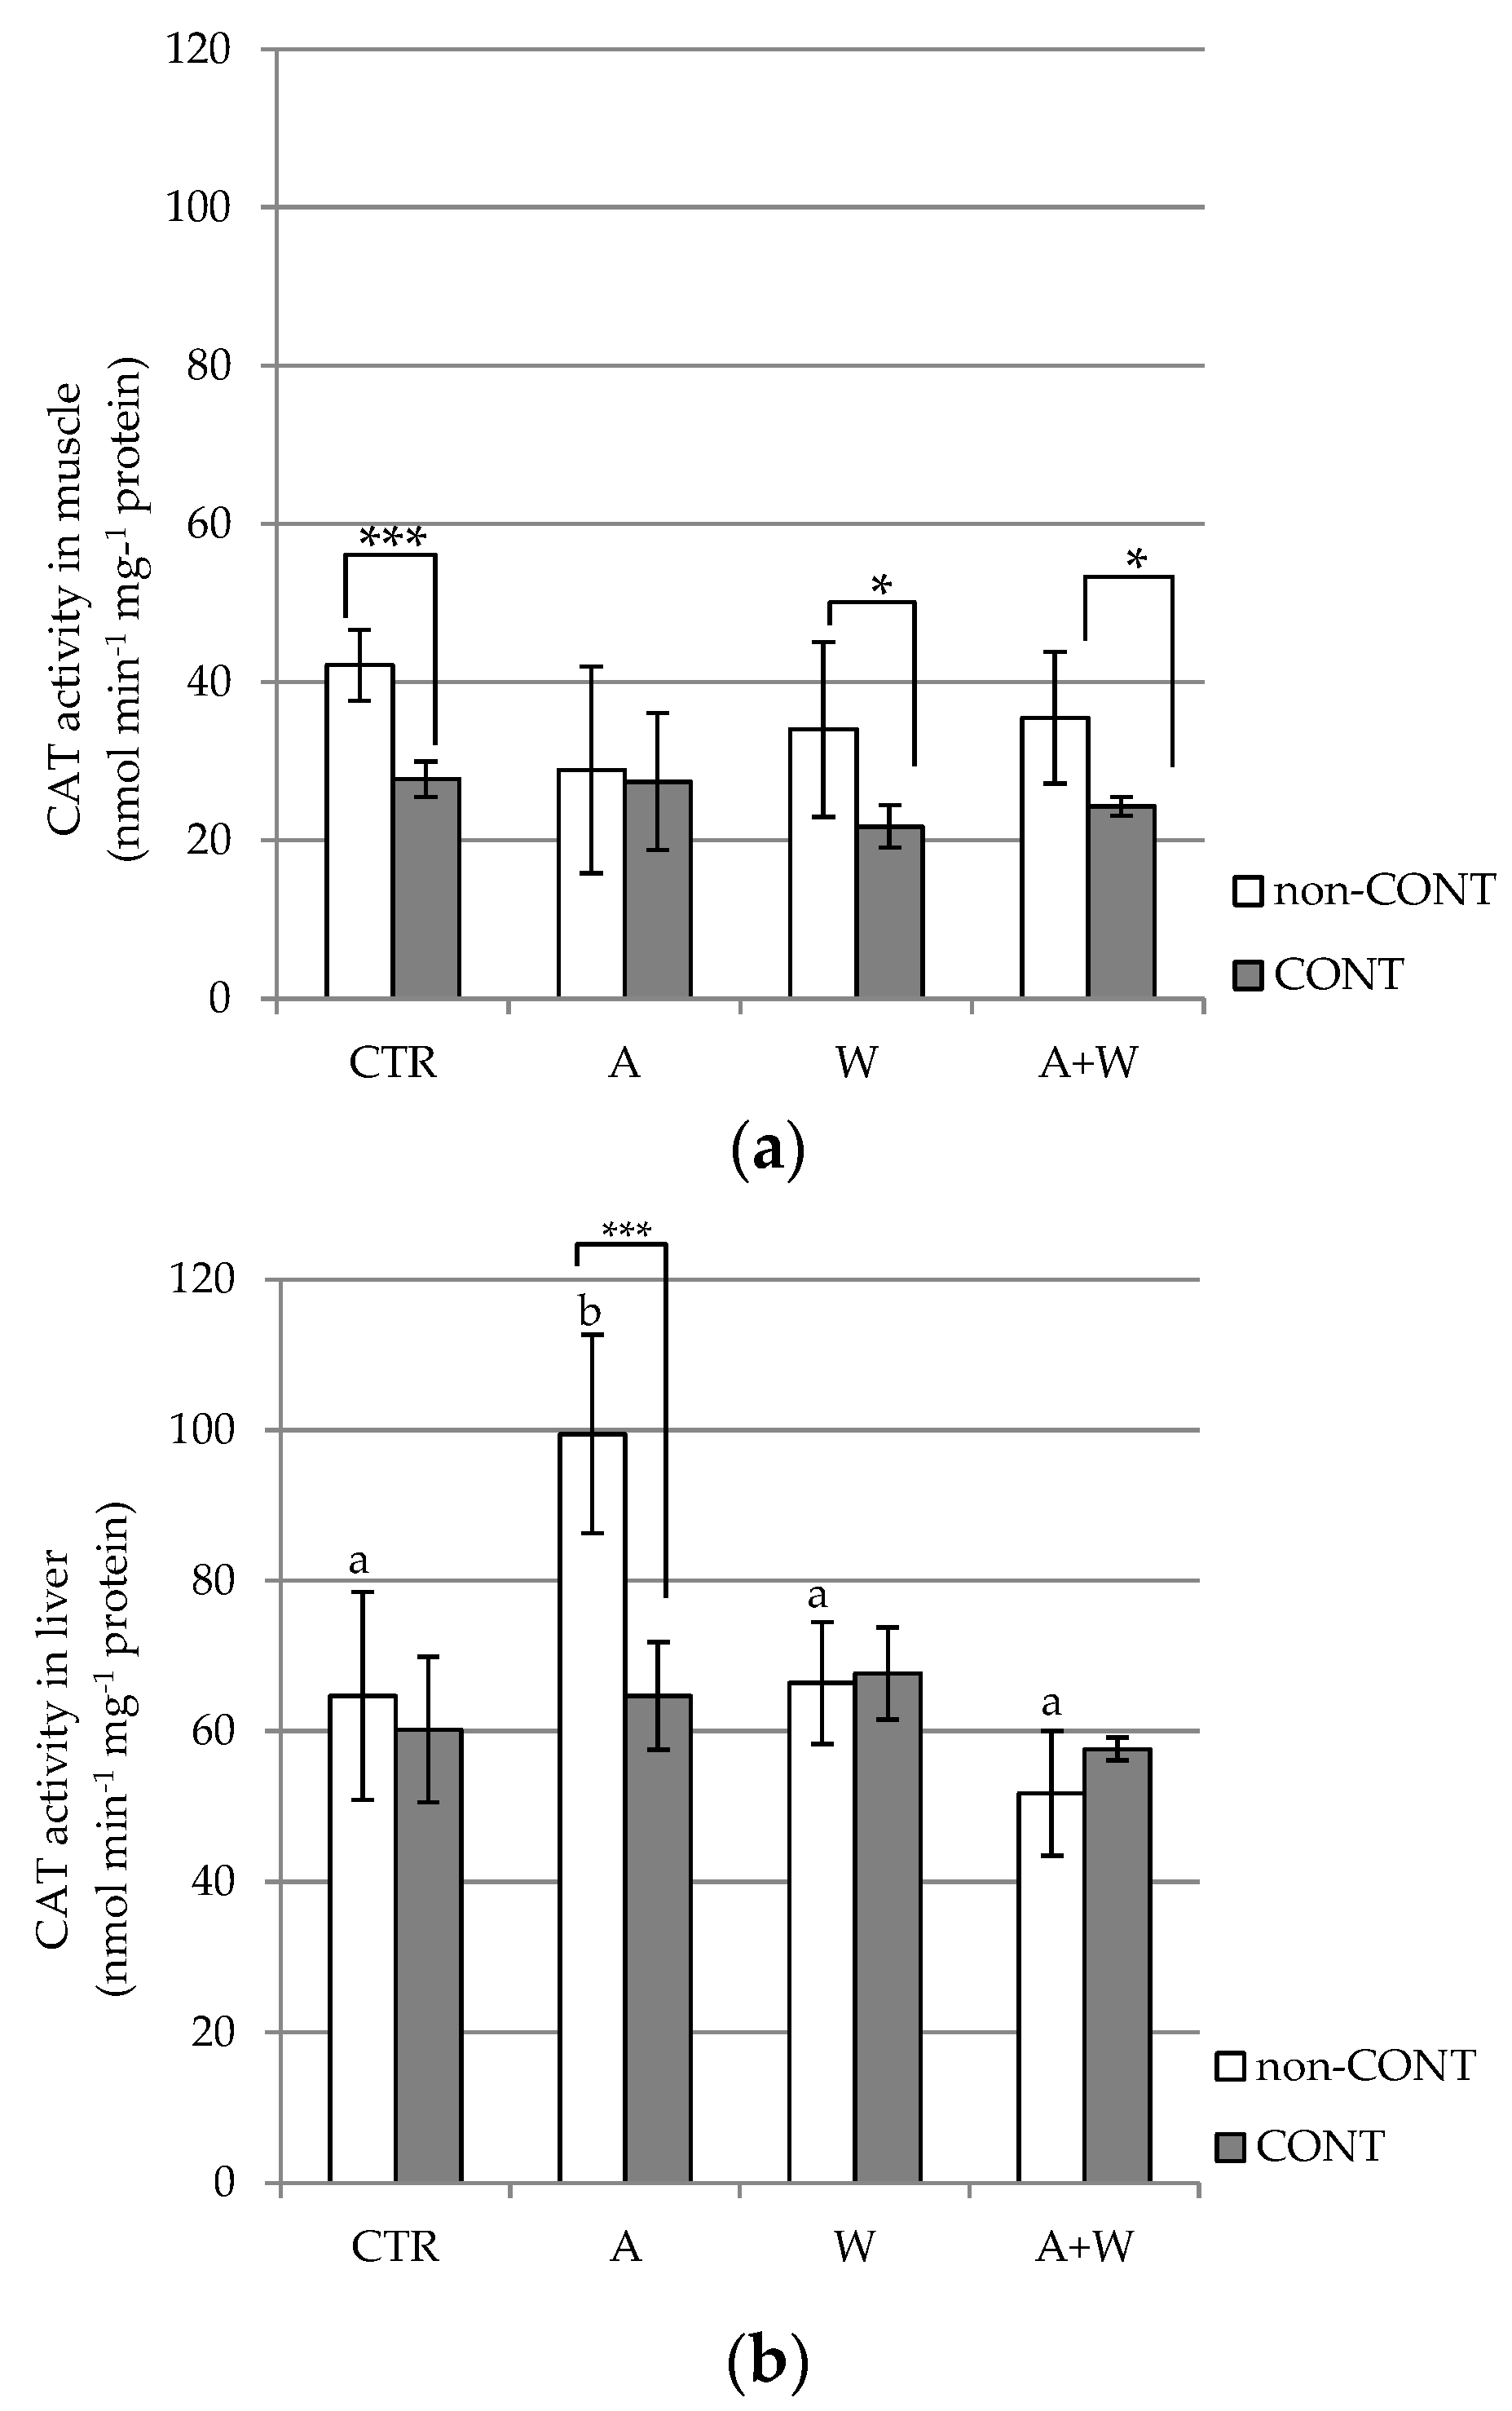
3.3. Animal Condition and Tissue Neuroxidative Responses

S. senegalensis morphometric data (i.e., weight, W, and total length, TL) and Fulton’s condition index K) in each treatment at the end of the exposure period (i.e., day 28) are presented in Table 4.
After 28 days, fish from the Non-CONT treatment exhibited significantly higher W (10.1 ± 1.3 g; p < 0.05) and TL (9.8 ± 0.5; p < 0.05) compared to those exposed to Hg alone, whereas these morphometric parameters were not significantly affected by climate change related stressors (in both Non-CONT and CONT treatments; p > 0.05). Despite changes elicited by Hg exposure, animal condition (K) was not significantly affected by any stressor (p > 0.05; Table 4). Correlations among morphometric variables, animal condition (K), and Hg contents, NARs, and EFs in the different tissues are shown in Table 5. While a positive correlation was observed between fish TL and W (r = 0.84, p < 0.001), K was only significantly correlated with TL (r = −0.43, p < 0.001).
With regard to tissue neuro-oxidative responses, CAT and SOD activities varied according to fish tissue and treatment (Figure 2 and Figure 3). CAT activity values ranged between 21.8 nmol∙min−1∙mg−1 protein (in the muscle of fish from CONT + W treatment) and 99.5 nmol∙min−1∙mg−1 protein (in the liver of fish from non-CONT + A treatment). Overall, CAT activity in fish muscle was not affected by climate change-related stressors, while Hg contamination had a significant effect in all treatments, with the exception of those simulating seawater acidification (i.e., p > 0.05 in treatments CONT + A vs. non-CONT + A; Figure 2a). Yet, different trends were found in the liver, with acidification acting alone eliciting a significant inhibition of CAT activity in relation to all treatments, including its contaminated counterpart treatment (i.e., CONT + A; p = 0.0002 Student’s t-test; Figure 2b). In opposition, fish brain revealed significantly higher CAT activity in the CONT + A treatment (93.7 ± 7.8 nmol∙min−1∙mg−1 protein; p < 0.05) compared to all treatments (Figure 2c). Moreover, in this tissue, both Hg and abiotic stressors significantly increased CAT activity, although different trends were observed according to stressor interactions. For instance, Hg exposure significantly enhanced CAT in treatments exposed to 19 °C (i.e., under control (CTR) and A conditions; p < 0.05 Student’s t-test), whereas Hg exposure significantly diminished CAT activity in treatments exposed to 24 °C and 8.0 pH units (i.e., in CONT + W vs. non-CONT + W; p = 0.003 Student’s t-test; Figure 2c).
SOD activity (percentage inhibition) in S. senegalensis tissues is presented in Figure 3. Overall, the liver presented higher percentages of SOD inhibition (between 89.0% and 91.1%) compared to muscle (between 62.4% and 90.0%) and brain (between 70.5% and 78.5%), regardless of treatment. As for the effect of the three studied stressors, different trends were observed in each fish tissue. Starting with muscle, increased temperatures impaired SOD activity in non-contaminated fish (i.e., 90.0% ± 2.5% of inhibition in non-CONT + W treatment; p < 0.05), but this trend was counteracted by Hg exposure, especially when acidification also interacted (i.e., 62.4% ± 4.9% of inhibition in CONT + A + W treatment; p < 0.05; Figure 3a). In the liver, Hg exposure was also associated with lower SOD inhibition, although significant differences between non-contaminated and Hg-contaminated counterparts were only observed in fish exposed to 19 °C and both pH levels (CTR conditions: p = 0.003 Student’s t-test; A conditions: p < 0.0001 Student’s t-test; Figure 3b). Noteworthy, in the liver of non-contaminated fish, significantly higher SOD inhibition was found under acidification alone (97.8% ± 0.5% of inhibition in non-CONT + A treatment; p < 0.05) compared to all treatments, whereas significantly lower inhibition was observed when acidification was combined with warming (89.0% ± 1.2% of inhibition in non-CONT + A + W treatment; p < 0.01; Figure 3b). In fish brain, overall, SOD activity did not present significant differences among treatments (percentage inhibition around 70% in most cases; p > 0.05), with the exception of fish co-exposed to acidification and Hg which revealed significantly higher inhibition than its non-contaminated counterpart (78.5% ± 3.0% of inhibition in Hg + A treatment; p = 0.01 Student’s t-test; Figure 3c).
Somewhat in line with SOD inhibition, lipid peroxidation (based on malonaldehyde (MDA) levels) showed, in general, higher values in liver (from 0.091 to 0.144 nmol∙mg−1 protein), followed by brain (from 0.035 to 0.084 nmol∙mg−1 protein) and muscle (from 0.025 to 0.031 nmol∙mg−1 protein; Figure 4). Hg exposure did not affect LPO in fish muscle, except in fish co-exposed to warming and acidification, which revealed significantly lower values (i.e., 0.026 ± 0.006 nmol∙mg−1 protein in CONT + A + W treatment) compared to their non-contaminated counterparts (i.e., 0.040 ± 0.012 nmol∙mg−1 protein in A + W treatment; p = 0.02 Student’s t-test; Figure 4a). Similarly, in the liver, no significant differences were observed between non-contaminated and Hg-contaminated fish (p > 0.05), but rather between those exposed to control or altered abiotic conditions (i.e., significantly higher LPO in CONT + A + W treatment compared to CONT + W treatment; p = 0.0035; Figure 4b). As for the brain, while Hg contamination significantly increased LPO under control temperature and pH levels (i.e., control treatment presented significantly lower LPO than CONT treatment; p = 0.047 Student’s t-test), the opposite trend was observed in fish exposed to warming (i.e., CONT + W presented an MDA concentration significantly higher than non-CONT + W treatment: p = 0.017 Student’s t-test; Figure 4c).
Brain AchE activity in non-CONT and CONT fish is shown in Figure 5.
In non-contaminated treatments (i.e., non-CONT), AchE activity ranged between 2.60 and 2.84 nmol∙min−1∙mg−1 protein, not evidencing significant differences among climate change scenarios (p > 0.05; Figure 5). In contrast, different trends were observed when Hg exposure was added to the equation, i.e., AchE activity was significantly increased by Hg exposure in treatments exposed to 19 °C (3.63 ± 1.0 and 3.16 ± 0.19 nmol∙min−1∙mg−1 protein in CONT under control conditions and CONT + A treatments, respectively) in relation to their non-contaminated counterparts (Figure 5). In opposition, no significant differences were observed between non-contaminated and contaminated fish exposed to 24 °C (i.e., between CONT + W and CONT + A + W; p > 0.05; Figure 5). Moreover, significantly lower AchE activity was obtained in fish from CONT + W treatment (2.37 ± 0.41 nmol∙min−1∙mg−1 protein) compared to CONT under control conditions, CONT + A, and CONT + A + W treatments (Figure 5).
Regarding correlations between variables, CAT activity and Hg NAR were negatively correlated in fish muscle (r = −0.4354; p = 0.033), while no significant correlations were found in the liver (Table 5). In opposition, Hg NAR in fish brain was negatively correlated with CAT activity (r = −0.5073; p = 0.011), SOD activity inhibition (r = −0.4411; p = 0.031), LPO (r = −0.4354; p = 0.033), and AchE activity (r = −0.4639; p = 0.022; Table 5).

4. Discussion

4.1. Mercury Bioaccumulation and Elimination in Tissues with Climate Change

The present study revealed that warming, acidification, and the co-occurrence of both climate change-related stressors influence Hg bioaccumulation and elimination in juvenile Solea senegalensis in different ways, depending on tissue affinity to this element. The primary tissue for Hg uptake was the liver, which is consistent with the fact that this organ, in addition to it central role in basic physiology, is responsible for the storage, metabolization, and redistribution of xenobiotics via blood circulation to other tissues [64].
Other studies reported higher Hg accumulation in the brain than in other tissues, namely, in zebra fish [23,65], Atlantic cod [66], and seabass [43] tissues. Such discrepancies may be due to species-specific factors related to Hg uptake [67], as well as to the slower metabolism and nutrient assimilation of S. senegalensis (a benthic species) compared to pelagic fish species [68].
In the present study, the consistent increase of THg in fish tissues under warmer temperatures (which translated into increased NARs and decreased EFs) is in accordance with previous studies in which juvenile seabass (Dicentrachus labrax; muscle, liver, and brain) [43], meagre (Argyrosomus regius; muscle, liver, and brain) [25], and even juvenile sole (Solea senaglensis; brain) [26] were used as biological models. The higher Hg bioaccumulation is due to the fact that fish experience a positive shift in metabolism and changes in the metabolic scope when subjected to increased temperatures, i.e., an enhancement [69], consequently translating into a higher intake of prey/feed [70] in order to meet the needs of enhanced animal metabolic rates, which was not followed by alterations in morphometric data or Fulton’s condition index. In line with this idea, significantly higher net accumulation rates were observed in the three tissues when fish were exposed to warmer temperatures, suggesting increased health risks for both marine species and seafood consumers in a global warming context.
On the other hand, acidification alone acted as an antagonistic factor and hampered THg bioaccumulation (and, thus, facilitated its elimination) in the three studied tissues. This result was consistent with recent studies [26,71]. Nonetheless, literature suggests that a decrease in seawater pH facilitates Hg accumulation, due to Hg+ competition with H+, limiting its sequestration and leaving more Hg for uptake [7]. However, increased Hg bioaccumulation under acidification was not observed in the present study, which may be related to the degree of acidification simulated (i.e., ΔpH = −0.4 units) and with potential changes elicited by fish at the physiological and biochemical levels, such as the following: (i) lower pH reduces the oxygen-binding capacity of respiratory proteins, thus restricting animal aerobic capacity [72], which can lead to metabolic suppression and, thus, lower uptake and metabolization of xenobiotics [72,73]; (ii) acidification can provoke disturbances of the acid–base and osmotic balance in fish tissues [74], affecting also the availability and accumulation rates of ionic contaminants, like metals [75]. Indeed, warming and acidification can dictate contaminants’ accumulation patterns, particular those that can alternate between ionic forms, such as Hg, resulting in either additive or antagonistic interactive effects [76]. Out of the two studied climate change-related stressors, acidification seemed to have played a prevalent role in impairing Hg accumulation, a trend also reported in previous studies (e.g., Reference [25]).
Results obtained during the elimination phase also showed that a seven-day clearance period was not enough to eliminate Hg from fish tissues, especially in muscle and brain, regardless of seawater abiotic conditions. This result is consistent with the persisting behavior and long tissue half-life of this compound, as it strongly binds to proteins in tissue membranes [77]. In liver, on the other hand, a decrease in Hg levels was observed likely due to the fact that the liver is the primary organ of MeHg detoxification and elimination [64,65], through Hg demethylation [64,78].

4.2. Linking Hg Contamination, Climate Change Stressors, and Potential Impacts on Seafood Safety

When assessing the risk to human health through seafood consumption and having in mind the levels of THg and the prevalence of Hg in this food item, it is imperative to restrict Hg dietary intake below certain levels. For this purpose, the European Food Safety Authority established an Hg tolerable weekly intake of 4 µg∙kg−1 bw [4].
According to the present data, under the predicted climate change stressors, higher HQs (often above one) are expected in large pelagic fish with warming, augmenting the risk of harmful effects to human health [53], especially through the consumption of pelagic predatory species occupying high trophic levels and migrating species, like black scabbard fish, tuna, and tope shark. According to the Intergovernmental Panel on Climate Change (IPCC) [29], the bioaccumulation of Hg and other persistent organic pollutants is expected to increase with climate change [37]. Indeed, some authors estimated through data modeling that marine organisms from the top of the food web will accumulate higher MeHg levels in the future [31,32], mostly due to increased Hg methylation rates by microorganisms, which will subsequently facilitate the availability of MeHg in the marine environment [10].
If the climate continues to change as projected, seafood safety will be likely compromised [29] and, thus, European consumers may have the reinforced interest in favoring the consumption of species occupying lower trophic levels instead of pelagic predatory ones, given the generally lower levels found in the literature for this group. Coastal indigenous communities with high seafood consumption frequencies, especially of large top predatory fish, will be particularly vulnerable to Hg dietary exposure and to the health hazards that result [29,37] from the exposure to this neurotoxic, carcinogenic, and teratogenic contaminant [15,16,29]. Special attention should be paid to specific population groups like the elderly, pregnant women, and children, in which health hazards may be particularly deleterious.

4.3. Interactive Effects of Hg and Climate Change-Related Stressors on Animal Condition and Neuro-Oxidative Responses

In addition to the aforementioned consequences to seafood safety, both chemical contamination and climate effects can have profound ecological impacts in marine ecosystems, substantially affecting marine species’ physiological and cellular functioning [24,26,79,80,81]. Yet, little is still known regarding the potential interactions between environmental stressors, which can translate either to an enhancement of negative effects or to their attenuation [81]. In this way, the present study provides relevant and novel insights into the neuro-oxidative implications of Hg exposure in benthic fish species in tomorrow’s ocean.
Among the studies assessing the effects of climate change stressors on marine biota, survival is one of the most used response variables [72]. Despite the physiological impairments induced by the studied stressors, fish were able to cope with and overcome stress as it did not result in mortality during the timeframe of the trial. It can also be argued that exposure to the tested multistressor levels, despite being chronic, was within the sublethal effect range. Another ecotoxicological endpoint frequently used in studies focused on climate change effects is growth and, thus, animal condition, which reflects the relationship between animal length and weight (e.g., References [70,79,80,81,82]). The prevalence of this endpoint in these studies is mostly because abiotic variables, like seawater temperature, pH, dissolved oxygen, and salinity, affect the marine biota’s metabolism and the way energy acquired through feed ingestion is channeled toward different biological functions. Nevertheless, various factors can concomitantly influence species’ metabolic response to abiotic stressors, namely, feed availability, severity, and/or chronicity of the stressor, species’ thresholds of physiological tolerance to shifts in abiotic conditions, and co-exposure to other environmental stressors, like pollutants [70,81,83].
In general, increased seawater temperatures are associated with enhanced metabolism, which can likely translate into either increased animal growth efficiency when sufficient amounts of feed/prey are available to meet animals’ energetic demands or depressed growth (associated with lower K condition index values) when there is limited feed/prey availability [41,70]. Acidification is also associated with depressed growth and poor animal fitness, and this is due to the high energetic resources that are required to maintain homeostatic balance and ionic exchanges under lower pH levels and, thus, that are no longer available to be used in other biological functions, like growth [81]. In the present study, despite S. senegalensis exposed to climate change-related stressors and/or Hg exhibiting lower TL and W (only significant for CONT treatment), no significant variations in animal condition (K) were observed, which can be due to the facts that (i) benthic species, particularly pleuronectiforms usually have lower metabolism, compared to pelagic fish species [68], (ii) the amount of feed provided was enough to maintain the energetic requirements, even in warmer temperatures, and (iii) Δtemperature = +4 °C and ΔpH = −0.4 pH units still fell within the limits of physiological tolerance of S. senegalensis. Noteworthy, the increased Hg NAR and decreased Hg elimination under warming did not affect animals’ condition, thus indicating that fish were still able to physiologically cope with the exposure to Hg (at the concentrations selected in this study, which were environmentally representative), even when abiotic stressors were combined and despite the biochemical changes elicited by stressors (acting alone or interacting with each other).
Matching the trends reported in previous ecotoxicological studies (e.g., References [24,26,79,80,83]), the three studied stressors elicited differential neuro-oxidative responses in fish muscle, liver, and brain. Such differences can be mostly attributed to the fact that (i) each fish tissue is functionally and structurally different, thus having distinct baseline biomarker/enzyme levels and responding differently to environmental stressors, including their interactions [80], (ii) different Hg concentrations were reached in each tissue (i.e., liver > brain > muscle), and (iii) chemical contaminants, like the neurotoxic Hg, can have specific modes of action and target organs [64]. Hence, despite the significantly higher Hg concentrations found in the liver, the present findings show that neuro-oxidative responses triggered by Hg were more notorious in the brain (i.e., significant differences were found between non-contaminated and Hg contaminated fish in LPO, CAT, SOD, and AchE activities, and negative correlations between these variables and Hg NAR occurred in this tissue, a result that is consistent with the mode of action (neurotoxic) of this contaminant (e.g., Reference [84]).
Another aspect worth mentioning is the fact that, in the present study, both up- and downregulations of the selected ecotoxicological biomarkers were observed, depending on the tissue and stressor interaction, a trend that is also in agreement with previous findings (e.g., References [24,25,80,83,85]). Such differential tissue biomarker responses to environmental stressors are a result of either (i) the activation of cells’ defense mechanisms in order to overcome the stress (in case of biomarker upregulation) or (ii) the depletion of cellular defense mechanisms due to severe and/or long-lasting stress conditions that exceed species’ thresholds of physiological tolerance (in case of biomarker downregulation) [24,83]. Hence, it was interesting to note in the present study, for instance, that acidification alone enhanced CAT activity in fish muscle, but this effect was counteracted by the co-exposure to Hg, probably due to an excessive formation of substrate (H2O2) that impaired the activity of this enzyme. The same argument may also be applied to the increased CAT activity in the brain of fish exposed to Hg and acidification, which was attenuated when warming was also added to the equation. In contrast, SOD activity in fish muscle and liver was significantly inhibited by warmer temperatures and/or acidification, but this trend was somewhat reversed by the co-exposure to Hg, probably because this contaminant has a pro-oxidative effect [22], thereby triggering the activity of this primary antioxidant scavenger. Despite changes in CAT and SOD activities elicited by Hg exposure, LPO levels were not significantly affected by this contaminant in muscle and liver, but rather by warming and acidification. This suggests that abiotic stressors played a preponderant negative role in these tissues, resulting in tissue damage that CAT and SOD by themselves were unable to prevent. In contrast, effects of Hg exposure seemed to have prevailed in the brain, translating into increased tissue LPO, once again reinforcing the neurotoxicological attributes of this contaminant [11,16]. Such an increase was partially counteracted by the co-exposure to abiotic stressors, probably due to an enhancement of fish metabolic rates (especially at warmer temperatures) and, thus, of enzymatic activity [80].
As for AchE activity, this enzyme is extensively used as a biomarker of xenobiotic exposure, particularly those that are neurotoxic (such as metals [22] and organophosphate pesticides), and changes in its activity can lead to alterations in behavior and neuromuscular activity [42]. AchE is a common target for many chemical compounds and, thus, the exposure to xenobiotics is frequently associated with AchE activity inhibition [86,87]. Nevertheless, an activation of this enzyme may also occur, although less commonly, as a result of (i) brain cell apoptosis (e.g., References [80,88,89]), (ii) enhanced synthesis of AchE splicing variants (e.g., AChE-R) due to stress [90], or (iii) xenobiotics’ modulation of the fish cholinergic system [89,91,92]. Such was the case for S. senegalensis exposed to Hg alone or combined with warming and acidification, which exhibited significantly higher AchE activity than non-contaminated fish reared under control temperature and pH conditions.
Finally, it is worth mentioning that, despite the neuro-oxidative responses elicited by the three studied stressors, no correlation was found between these variables and the overall animal condition (i.e., K), once more pointing out that Hg concentration, Δtemperature, and ΔpH selected in the present study were within the thresholds of physiological tolerance of S. senegalensis.

5. Conclusions

This study encompassed dietary Hg bioaccumulation patterns in S. senegalensis tissues and the elicited neuro-oxidative responses when the co-exposure to climate change-related stressors, like warming and acidification, takes place concomitantly. The present findings should be interpreted with caution, as they are limited to several experimental factors (e.g., fish species, exposure duration, degree of simulated climate change-related stressors, and Hg contamination). Taking this into account, the results confirmed that warming increased Hg accumulation, whereas acidification seemed to hamper it. The differential Hg bioaccumulation patterns observed in each fish tissue and treatment translated into distinct neuro-oxidative responses, through either enhancement (e.g., CAT activity in brain with acidification) or inhibition (e.g., AchE activity in brain with warming) of biomarker response. The estimations performed in the present study pointed out the increased probability of exceeding Hg TWI and higher HQ associated with the consumption of wild marine fish, particularly of top predatory species, if the ocean continues to warm as forecast. Finally, future legislation and recommendations regarding Hg dietary exposure should account for the expected effects of climate change-related stressors, while advising a conscious and parsimonious consumption of wild seafood species, particularly those that are likely to accumulate high levels of Hg and/or inhabit areas expected to be particularly affected by climate change, especially warming.

Supplementary Materials

The following are available online at https://www.mdpi.com/2076-3417/10/6/1993/s1: Table S1: Total mercury (THg) concentrations (mg∙kg−1 wet weight) in Solea senegalensis tissues from non-contaminated treatment (non-CONT) through the experiment timeline (up to day 28: exposure; day 35: clearance).

Author Contributions

Conceptualization, M.L.N., R.R., and A.M.; formal analysis, C.C., A.L.M., and M.S.; funding acquisition, M.L.N. and A.M.; investigation, A.L.M. and V.B.; methodology, C.C., A.L.M., V.B., and F.H.S.F.; resources, P.P.-F.; supervision, M.L.N. and A.M.; validation, C.C., A.L.M., and A.M.; visualization, C.C., A.L.M., M.T.S., and V.B.; writing—original draft, C.C.; writing—review and editing, all authors. All authors have read and agreed to the published version of the manuscript.

Funding

The research leading to these results received funding from Fundação para a Ciência e Tecnologia (F.C.T.) under the FISHBUDGET project (PTDC/BIA-BMA/28630/2017). The authors are also thankful to F.C.T. for the contract of A.M. in the framework of IF2014 (IF/00157/2014) and the PhD Grant of C.C. (SFRH/BD/141315/2018), as well as to the F.C.T. project FISHBUDGET (PTDC/BIA-BMA/28630/2017) for supporting the contract of A.L.M.

Acknowledgments

To Doctor Patrícia Anacleto (CEECIND 2017 program grant – reference CEECIND/01739/2017), Principal Investigator of FISHBUDGET project for providing resources, allowing the study development and her valuable contribution in results validation. The technical support of the IPMA team from Olhão (aquaculture EPPO facilities) are acknowledged for providing juvenile Solea senegalensis specimens for the experiments. SPAROS Lda is acknowledged for preparing the feeds.

Conflicts of Interest

The authors declare no conflicts of interest.

References

  1. Spada, L.; Annicchiarico, C.; Cardellicchio, N.; Giandomenico, S.; Di Leo, A. Mercury and methylmercury concentrations in Mediterranean seafood and surface sediments, intake evaluation and risk for consumers. Int. J. Hyg. Environ. Health 2012, 215, 418–426. [Google Scholar] [CrossRef]
  2. Maulvault, A.L.; Anacleto, P.; Barbosa, V.; Sloth, J.J.; Rasmussen, R.R.; Tediosi, A.; Fernandez-Tejedor, M.; van den Heuvel, F.H.M.; Kotterman, M.; Marques, A. Toxic elements and speciation in seafood samples from different contaminated sites in Europe. Environ. Res. 2015, 143, 72–81. [Google Scholar] [CrossRef] [PubMed] [Green Version]
  3. Annibaldi, A.; Truzzi, C.; Carnevali, O.; Pignalosa, P.; Api, M.; Scarponi, G.; Illuminati, S. Determination of Hg in farmed and wild atlantic bluefin tuna (Thunnus thynnus L.) muscle. Molecules 2019, 24, 1273. [Google Scholar] [CrossRef] [PubMed] [Green Version]
  4. EFSA. Panel on Contaminants in the Food Chain (CONTAM). Scientific Opinion on the risk for public health related to the presence of mercury and methylmercury in food. EFSA J. 2012, 10, 2985. [Google Scholar]
  5. UNEP. Global Mercury Assessment 2013: Sources, Emissions, Releases and Environmental Transport; UNEP: Nairobi, Kenya, 2013. [Google Scholar]
  6. FAO Fisheries and Aquaculture Department. Cultured Aquatic Species Information Programme Solea spp. Available online: http://www.fao.org/fishery/culturedspecies/Solea_spp/en (accessed on 11 May 2018).
  7. Kidd, K.; Clayden, M.; Jardine, T. Bioaccumulation and biomagnification of mercury through food webs. In Environmental Chemistry and Toxicology of Mercury; Liu, G., Cai, Y., O’Driscoll, N., Eds.; John Wiley & Sons, Inc: Hoboken, NJ, USA, 2012. [Google Scholar]
  8. Maulvault, A.L.; Anacleto, P.; Lourenço, H.M.; Carvalho, M.L.; Nunes, M.L.; Marques, A. Nutritional quality and safety of cooked edible crab (Cancer pagurus). Food Chem. 2012, 133, 277–283. [Google Scholar] [CrossRef]
  9. Newman, M.C.; Xu, X.; Cotton, C.F.; Tom, K.R. High mercury concentrations reflect trophic ecology of three deep-water chondrichthyans. Arch. Environ. Contam. Toxicol. 2011, 60, 618–625. [Google Scholar] [CrossRef]
  10. Downs, S.G.; MacLeod, C.L.; Lester, J.N. Mercuty in precipitation and its relation to bioaccumulation in fish: A literature review. Water Air Soil Pollut. 1998, 108, 149–187. [Google Scholar] [CrossRef]
  11. Bradley, M.A.; Barst, B.D.; Basu, N. A review of mercury bioavailability in humans and fish. Int. J. Environ. Res. Public Health 2017, 14, 169. [Google Scholar] [CrossRef] [Green Version]
  12. Afonso, C.; Lourenço, H.M.; Dias, A.; Nunes, M.L.; Castro, M. Contaminant metals in black scabbard fish (Aphanopus carbo) caught off Madeira and the Azores. Food Chem. 2007, 101, 120–125. [Google Scholar] [CrossRef]
  13. Maulvault, A.L.; Anacleto, P.; Machado, R.; Amaral, A.; Carvalho, M.L.; Lourenço, H.M.; Nunes, M.L.; Marques, A. Effect of sex, maturation stage and cooking methods on the nutritional quality and safety of black scabbard fish (Aphanopus carbo Lowe, 1839). J. Sci. Food Agric. 2012, 92, 1545–1553. [Google Scholar] [CrossRef]
  14. Miniero, R.; Beccaloni, E.; Carere, M.; Ubaldi, A.; Mancini, L.; Marchegiani, S.; Cicero, M.R.; Scenati, R.; Lucchetti, D.; Ziemacki, G.; et al. Mercury (Hg) and methyl mercury (MeHg) concentrations in fish from the coastal lagoon of Orbetello, central Italy. Mar. Pollut. Bull. 2013, 76, 365–369. [Google Scholar] [CrossRef] [PubMed]
  15. Ceccatelli, S.; Bose, R.; Edoff, K.; Onishchenko, N.; Spulber, S. Long-lasting neurotoxic effects of exposure to methylmercury during development. J. Intern. Med. 2013, 273, 490–497. [Google Scholar] [CrossRef] [PubMed]
  16. Sundseth, K.; Pacyna, J.M.; Pacyna, E.G.; Pirrone, N.; Thorne, R.J. Global sources and pathways of mercury in the context of human health. Int. J. Environ. Res. Public Health 2017, 14, 105. [Google Scholar] [CrossRef] [PubMed]
  17. Fleeger, J.W.; Carman, K.R.; Nisbet, R.M. Indirect effects of contaminants in aquatic ecosystems. Sci. Total Environ. 2003, 317, 207–233. [Google Scholar] [CrossRef]
  18. Weis, J.S. Physiological, Developmental and Behavioral Effects of Marine Pollution; Springer: Berlin/Heidelberg, Germany, 2014. [Google Scholar]
  19. Hammerschmidt, C.R.; Sandheinrich, M.B.; Wiener, J.G.; Rada, R.G. Effects of dietary methylmercury on reproduction of fathead minnows. Environ. Sci. Technol. 2002, 36, 877–883. [Google Scholar] [CrossRef] [PubMed]
  20. Nunes, M.; Coelho, J.P.; Cardoso, P.G.; Pereira, M.E.; Duarte, A.C.; Pardal, M.A. The macrobenthic community along a mercury contamination in a temperate estuarine system (Ria de Aveiro, Portugal). Sci. Total Environ. 2008, 405, 186–194. [Google Scholar] [CrossRef] [PubMed]
  21. Berntssen, M.H.G.; Aatland, A.; Handy, R.D. Chronic dietary mercury exposure causes oxidative stress, brain lesions, and altered behaviour in Atlantic salmon (Salmo salar) parr. Aquat. Toxicol. 2003, 65, 55–72. [Google Scholar] [CrossRef]
  22. Farina, M.; Aschner, M.; Rocha, J.B.T. Oxidative stress in MeHg-induced neurotoxicity. Toxicol. Appl. Pharmacol. 2011, 256, 405–417. [Google Scholar] [CrossRef] [PubMed] [Green Version]
  23. Korbas, M.; MacDonald, T.C.; Pickering, I.J.; George, G.N.; Krone, P.H. Chemical form matters: Differential accumulation of mercury following inorganic and organic mercury exposures in zebrafish larvae. ACS Chem. Biol. 2012, 7, 411–420. [Google Scholar] [CrossRef] [PubMed]
  24. Maulvault, A.L.; Barbosa, V.; Alves, R.; Custódio, A.; Anacleto, P.; Repolho, T.; Pousão Ferreira, P.; Rosa, R.; Marques, A.; Diniz, M. Ecophysiological responses of juvenile seabass (Dicentrarchus labrax) exposed to increased temperature and dietary methylmercury. Sci. Total Environ. 2017, 586, 551–558. [Google Scholar] [CrossRef]
  25. Sampaio, E.; Lopes, A.R.; Paula, J.R.; Pimentel, M.; Maulvault, A.L.; Repolho, T.; Grilo, T.F.; Pousão-Ferreira, P.; Marques, A.; Rosa, R. Ocean acidification dampens physiological stress response to warming and contamination in a commercially-important fish (Argyrosomus regius). Sci. Total Environ. 2018, 618, 388–398. [Google Scholar] [CrossRef] [PubMed]
  26. Sampaio, E.; Maulvault, A.L.; Lopes, V.M.; Paula, J.R.; Barbosa, V.; Alves, R.; Pousão-Ferreira, P.; Repolho, T.; Marques, A.; Rosa, R. Habitat selection disruption and lateralization impairment of cryptic flatfish in a warm, acid, and contaminated ocean. Mar. Biol. 2016, 163, 217. [Google Scholar] [CrossRef]
  27. Rosa, R.; Lopes, A.R.; Pimentel, M.; Faleiro, F.; Baptista, M.; Trübenbach, K.; Narciso, L.; Dionísio, G.; Pegado, M.R.; Repolho, T. Ocean cleaning stations under a changing climate: Biological responses of tropical and temperate fish-cleaner shrimp to global warming. Glob. Chang. Biol. 2014, 20, 3068–3079. [Google Scholar] [CrossRef] [PubMed]
  28. Tirado, M.C.; Clarke, R.; Jaykus, L.A.; McQuatters-Gollop, A.; Frank, J.M. Climate change and food safety: A review. Food Res. Int. 2010, 43, 1745–1765. [Google Scholar] [CrossRef]
  29. IPCC. Summary for Policymakers. In IPCC Special Report on the Ocean and Cryosphere in a Changing Climate; Portner, H.-O., Roberts, D.C., Masson-Delmotte, V., Zhai, P., Tignor, M., Poloczanska, E., Mintenbeck, K., Nicolai, M., Okem, A., Petzold, J., et al., Eds.; IPCC, 2019. Available online: https://report.ipcc.ch/srocc/pdf/SROCC_FinalDraft_FullReport.pdf (accessed on 5 March 2020).
  30. Gunderson, A.R.; Armstrong, E.J.; Stillman, J.H. Multiple stressors in a changing world: The need for an improved perspective on physiological responses to the dynamic marine environment. Ann. Rev. Mar. Sci. 2016, 8, 357–378. [Google Scholar] [CrossRef]
  31. Alava, J.J.; Cisneros-Montemayor, A.M.; Sumaila, U.R.; Cheung, W.W.L. Projected amplification of food web bioaccumulation of MeHg and PCBs under climate change in the Northeastern Pacific. Sci. Rep. 2018, 8, 1–12. [Google Scholar] [CrossRef]
  32. Booth, S.; Zeller, D. Mercury, food webs, and marine mammals: Implications of diet and climate change for human health. Environ. Health Perspect. 2005, 113, 521–526. [Google Scholar] [CrossRef]
  33. Marques, A.; Nunes, M.L.; Moore, S.K.; Strom, M.S. Climate change and seafood safety: Human health implications. Food Res. Int. 2010, 43, 1766–1779. [Google Scholar] [CrossRef]
  34. Rosa, R.; Pimentel, M.S.; Boavida-Portugal, J.; Teixeira, T.; Trübenbach, K.; Diniz, M. Ocean warming enhances malformations, premature hatching, metabolic suppression and oxidative stress in the early life stages of a keystone squid. PLoS ONE 2012, 7, e38282. [Google Scholar] [CrossRef]
  35. Rosa, R.; Baptista, M.; Lopes, V.M.; Pegado, M.R.; Ricardo Paula, J.; Trübenbach, K.; Leal, M.C.; Calado, R.; Repolho, T. Early-life exposure to climate change impairs tropical shark survival. Proc. R. Soc. B Biol. Sci. 2014, 281, 20141738. [Google Scholar] [CrossRef] [Green Version]
  36. Rosa, R.; Trubenbach, K.; Pimentel, M.S.; Boavida-Portugal, J.; Faleiro, F.; Baptista, M.; Dionisio, G.; Calado, R.; Portner, H.O.; Repolho, T. Differential impacts of ocean acidification and warming on winter and summer progeny of a coastal squid (Loligo vulgaris). J. Exp. Biol. 2014, 217, 518–525. [Google Scholar] [CrossRef] [PubMed] [Green Version]
  37. Alava, J.J.; Cheung, W.W.L.; Ross, P.S.; Sumaila, U.R. Climate change–contaminant interactions in marine food webs: Toward a conceptual framework. Glob. Chang. Biol. 2017, 23, 3984–4001. [Google Scholar] [CrossRef] [PubMed]
  38. Alava, J.J. Climate Change and Overfishing are Boosting Toxic Mercury Levels in Fish. Available online: https://theconversation.com/climate-change-and-overfishing-are-boosting-toxic-mercury-levels-in-fish-122748 (accessed on 18 February 2020).
  39. Siscar, R.; Torreblanca, A.; Palanques, A.; Solé, M. Metal concentrations and detoxification mechanisms in Solea solea and Solea senegalensis from NW Mediterranean fishing grounds. Mar. Pollut. Bull. 2013, 77, 90–99. [Google Scholar] [CrossRef] [PubMed]
  40. Frapiccini, E.; Annibaldi, A.; Betti, M.; Polidori, P.; Truzzi, C.; Marini, M. Polycyclic aromatic hydrocarbon (PAH) accumulation in different common sole (Solea solea) tissues from the North Adriatic Sea peculiar impacted area. Mar. Pollut. Bull. 2018, 137, 61–68. [Google Scholar] [CrossRef] [PubMed]
  41. Cheung, W.W.L.; Sarmiento, J.L.; Dunne, J.; Frölicher, T.L.; Lam, V.W.Y.; Palomares, M.L.D.; Watson, R.; Pauly, D. Shrinking of fishes exacerbates impacts of global ocean changes on marine ecosystems. Nat. Clim. Chang. 2013, 3, 254–258. [Google Scholar] [CrossRef]
  42. Gagné, F. Biochemical Ecotoxicology: Principles and Methods; Academic Press: Cambridge, MA, USA, 2014. [Google Scholar]
  43. Maulvault, A.L.; Custódio, A.; Anacleto, P.; Repolho, T.; Pousão, P.; Nunes, M.L.; Diniz, M.; Rosa, R.; Marques, A. Bioaccumulation and elimination of mercury in juvenile seabass (Dicentrarchus labrax) in a warmer environment. Environ. Res. 2016, 149, 77–85. [Google Scholar] [CrossRef]
  44. Bradford, M.M. A rapid and sensitive method for the quantitation of microgram quantities of protein utilizing the principle of protein-dye binding. Anal. Biochem. 1976, 72, 248–254. [Google Scholar] [CrossRef]
  45. Ellman, G.L.; Courtney, K.D.; Andres, V., Jr.; Featherstone, R.M. A new and rapid colorimetric determination of acetylcholinesterase activity. Biochem. Pharmacol. 1961, 7, 88–95. [Google Scholar] [CrossRef]
  46. Dizer, H.; da Silva de Assis, H.C.; Hansen, P.-D. Cholinesterase activity as a bioindicator for monitoring marine pollution in the Baltic Sea and the Mediterranean Sea. In Biomarkers in Marine Organisms; Elsevier: Amsterdam, The Netherlands, 2001. [Google Scholar]
  47. Johansson, L.H.; Borg, L. A spectrophotometric method for determination of catalase activity in small tissue samples. Anal. Biochem. 1988, 174, 331–336. [Google Scholar] [CrossRef]
  48. Sun, Y.; Oberley, L.W.; Li, Y. A simple method for clinical assay of superoxide dismutase. Clin. Chem. 1988, 34, 497–500. [Google Scholar] [CrossRef]
  49. Mihara, M.; Uchiyama, M. Determination of malonaldehyde precursor in tissues by thiobarbituric acid test. Anal. Biochem. 1978, 86, 271–278. [Google Scholar]
  50. Ricker, W.E. Computation and Interpretation of Biological Statistics of Fish Populations; Bulletin of the Fisheries Research of Canada: Ottawa, ON, Canada, 1975. [Google Scholar]
  51. Santana, L.M.B.M.; Blasco, J.; Abessa, D.M.S.; Campana, O. Bioaccumulation kinetics of copper in Ruditapes philippinarum exposed to increasing, continuous and pulsed exposure: Implications for growth. Sci. Total Environ. 2017, 595, 920–927. [Google Scholar] [CrossRef] [PubMed] [Green Version]
  52. Jebali, J.; Chouba, L.; Banni, M.; Boussetta, H. Comparative study of the bioaccumulation and elimination of trace metals (Cd, Pb, Zn, Mn and Fe) in the digestive gland, gills and muscle of bivalve Pinna nobilis during a field transplant experiment. J. Trace Elem. Med. Biol. 2014, 28, 212–217. [Google Scholar] [CrossRef] [PubMed]
  53. EPA. Guidance of Assessing Chemical Contaminant Data for Use in Fish Advisories; Office of Science and Technology and Office of Water: Washington, WA, USA, 2000.
  54. FAO. FAO Yearbook. Fishery and Aquaculture Statistics 2017; FAO: Rome, Italy, 2019. [Google Scholar]
  55. Storelli, M.M.; Normanno, G.; Barone, G.; Dambrosio, A.; Errico, L.; Garofalo, R.; Giacominelli-Stuffler, R. Toxic metals (Hg, Cd, and Pb) in fishery products imported into Italy: Suitability for human consumption. J. Food Prot. 2012, 75, 189–194. [Google Scholar] [CrossRef] [PubMed]
  56. Bentzen, R.; Castellini, J.M.; Gerlach, R.; Dykstra, C.; O’Hara, T. Mercury concentrations in Alaska Pacific halibut muscle relative to stable isotopes of C and N and other biological variables. Mar. Pollut. Bull. 2016, 113, 110–116. [Google Scholar] [CrossRef] [PubMed]
  57. Ruus, A.; Hjermann, D.Ø.; Beylich, B.; Schøyen, M.; Øxnevad, S.; Green, N.W. Mercury concentration trend as a possible result of changes in cod population demography. Mar. Environ. Res. 2017, 130, 85–92. [Google Scholar] [CrossRef] [PubMed]
  58. Frantzen, S.; Maage, A.; Duinker, A.; Julshamn, K.; Iversen, S.A. A baseline study of metals in herring (Clupea harengus) from the Norwegian Sea, with focus on mercury, cadmium, arsenic and lead. Chemosphere 2015, 127, 164–170. [Google Scholar] [CrossRef] [PubMed]
  59. Chaguri, M.P.; Maulvault, A.L.; Costa, S.; Gonçalves, A.; Nunes, M.L.; Carvalho, M.L.; Sant’ana, L.S.; Bandarra, N.; Marques, A. Chemometrics tools to distinguish wild and farmed meagre (Argyrosomus regius). J. Food Process. Preserv. 2017, 41, e13312. [Google Scholar] [CrossRef]
  60. Mieiro, C.L.; Pacheco, M.; Duarte, A.C.; Pereira, M.E. Fish consumption and risk of contamination by mercury–Considerations on the definition of edible parts based on the case study of European sea bass. Mar. Pollut. Bull. 2011, 62, 2850–2853. [Google Scholar] [CrossRef]
  61. Torres-Escribano, S.; Ruiz, A.; Barrios, L.; Vélez, D.; Montoro, R. Influence of mercury bioaccessibility on exposure assessment associated with consumption of cooked predatory fish in Spain. J. Sci. Food Agric. 2011, 91, 981–986. [Google Scholar] [CrossRef]
  62. Costa, F.; Coelho, J.P.; Baptista, J.; Martinho, F.; Pereira, M.E.; Pardal, M.A. Mercury accumulation in fish species along the Portuguese coast: Are there potential risks to human health? Mar. Pollut. Bull. 2020, 150, 110740. [Google Scholar] [CrossRef] [PubMed]
  63. EPA, United States Environmental Protection Agency. An Overview of Methods for EPA’s National-Scale Air Toxics Assessment. Available online: https://www.epa.gov/sites/production/files/2015-10/documents/2005-nata-tmd.pdf (accessed on 20 December 2019).
  64. Wang, R.; Feng, X.-B.; Wang, W.-X. In vivo mercury methylation and demethylation in freshwater tilapia quantified by mercury stable isotopes. Environ. Sci. Technol. 2013, 47, 7949–7957. [Google Scholar] [CrossRef] [PubMed]
  65. Gentès, S.; Maury-Brachet, R.; Feng, C.; Pedrero, Z.; Tessier, E.; Legeay, A.; Mesmer-Dudons, N.; Baudrimont, M.; Maurice, L.; Amouroux, D.; et al. Specific Effects of Dietary Methylmercury and Inorganic Mercury in Zebrafish (Danio rerio) Determined by Genetic, Histological, and Metallothionein Responses. Environ. Sci. Technol. 2015, 49, 14560–14569. [Google Scholar] [CrossRef] [PubMed]
  66. Amlund, H.; Lundebye, A.K.; Berntssen, M.H.G. Accumulation and elimination of methylmercury in Atlantic cod (Gadus morhua L.) following dietary exposure. Aquat. Toxicol. 2007, 83, 323–330. [Google Scholar] [CrossRef] [PubMed]
  67. Bosch, A.C.; O’Neill, B.; Sigge, G.O.; Kerwath, S.E.; Hoffman, L.C. Heavy metals in marine fish meat and consumer health: A review. J. Sci. Food Agric. 2016, 96, 32–48. [Google Scholar] [CrossRef]
  68. Johnston, I.A.; Dunn, J. Temperature acclimation and metabolism in ectotherms with particular reference to teleost fish. Proc. Symp. Soc. Exp. Biol. 1987, 41, 67–93. [Google Scholar]
  69. Flynn, E.E.; Bjelde, B.E.; Miller, N.A.; Todgham, A.E. Ocean acidification exerts negative effects during warming conditions in a developing Antarctic fish. Conserv. Physiol. 2015, 3, 1–16. [Google Scholar] [CrossRef] [Green Version]
  70. Dijkstra, J.A.; Buckman, K.L.; Ward, D.; Evans, D.W.; Dionne, M.; Chen, C.Y. Experimental and Natural Warming Elevates Mercury Concentrations in Estuarine Fish. PLoS ONE 2013, 8, 1–9. [Google Scholar] [CrossRef] [Green Version]
  71. Li, Y.; Wang, W.-X.; Wang, M. Alleviation of mercury toxicity to a marine copepod under multigenerational exposure by ocean acidification. Sci. Rep. 2017, 7, 324. [Google Scholar] [CrossRef] [Green Version]
  72. Doney, S.C.; Ruckelshaus, M.; Emmett Duffy, J.; Barry, J.P.; Chan, F.; English, C.A.; Galindo, H.M.; Grebmeier, J.M.; Hollowed, A.B.; Knowlton, N.; et al. Climate Change Impacts on Marine Ecosystems. Ann. Rev. Mar. Sci. 2012, 4, 11–37. [Google Scholar] [CrossRef] [Green Version]
  73. Melzner, F.; Gutowska, M.A.; Langenbuch, M.; Dupont, S.; Lucassen, M.; Thorndyke, M.C.; Bleich, M.; Pörtner, H.-O. Physiological basis for high CO2 tolerance in marine ectothermic animals: Pre-adaptation through lifestyle and ontogeny? Biogeosciences 2009, 6, 2313–2331. [Google Scholar] [CrossRef] [Green Version]
  74. Heuer, R.M.; Grosell, M. Physiological impacts of elevated carbon dioxide and ocean acidification on fish. Am. J. Physiol. Integr. Comp. Physiol. 2014, 307, R1061–R1084. [Google Scholar] [CrossRef] [PubMed] [Green Version]
  75. Schiedek, D.; Sundelin, B.; Readman, J.W.; Macdonald, R.W. Interactions between climate change and contaminants. Mar. Pollut. Bull. 2007, 54, 1845–1856. [Google Scholar] [CrossRef] [PubMed]
  76. Byrne, M.; Przeslawski, R. Multistressor impacts of warming and acidification of the ocean on marine invertebrates’ life histories. Integr. Comp. Biol. 2013, 53, 582–596. [Google Scholar] [CrossRef] [Green Version]
  77. Guzzi, G.; La Porta, C.A.M. Molecular mechanisms triggered by mercury. Toxicology 2008, 244, 1–12. [Google Scholar] [CrossRef]
  78. Eagles-Smith, C.A.; Ackerman, J.T.; Yee, J.; Adelsbach, T.L. Mercury demethylation in waterbird livers: Dose–response thresholds and differences among species. Environ. Toxicol. Chem. Int. J. 2009, 28, 568–577. [Google Scholar] [CrossRef]
  79. Maulvault, A.L.; Camacho, C.; Barbosa, V.; Alves, R.; Anacleto, P.; Fogaça, F.; Kwadijk, C.; Kotterman, M.; Cunha, S.C.; Fernandes, J.O.; et al. Assessing the effects of seawater temperature and pH on the bioaccumulation of emerging chemical contaminants in marine bivalves. Environ. Res. 2018, 161, 236–247. [Google Scholar] [CrossRef]
  80. Maulvault, A.L.; Barbosa, V.; Alves, R.; Anacleto, P.; Camacho, C.; Cunha, S.; Fernandes, J.O.; Ferreira, P.P.; Rosa, R.; Marques, A.; et al. Integrated multi-biomarker responses of juvenile seabass to diclofenac, warming and acidification co-exposure. Aquat. Toxicol. 2018, 202, 65–79. [Google Scholar] [CrossRef]
  81. Maulvault, A.L.; Anacleto, P.; Marques, A.; Diniz, M.; Rosa, R. Chemical contaminants in a changing ocean. In Ecotoxicology of Marine Organisms; Duarte, B., Caçador, I., Eds.; CRC Press: Boca Raton, FL, USA, 2019. [Google Scholar]
  82. Stauber, J.L.; Chariton, A.; Apte, S. Global Change. In Marine Ecotoxicology: Current Knowledge and Future Issues; Blasco, J., Chapman, P.M., Campana, O., Hampel, M., Eds.; Elsevier Inc.: Amsterdam, The Netherlands, 2016. [Google Scholar]
  83. Madeira, D.; Narciso, L.; Cabral, H.N.; Vinagre, C.; Diniz, M.S. Influence of temperature in thermal and oxidative stress responses in estuarine fish. Comp. Biochem. Physiol. Part A Mol. Integr. Physiol. 2013, 166, 237–243. [Google Scholar] [CrossRef]
  84. Puga, S.; Pereira, P.; Pinto-Ribeiro, F.; O’Driscoll, N.J.; Mann, E.; Barata, M.; Pousão-Ferreira, P.; Canário, J.; Almeida, A.; Pacheco, M. Unveiling the neurotoxicity of methylmercury in fish (Diplodus sargus) through a regional morphometric analysis of brain and swimming behavior assessment. Aquat. Toxicol. 2016, 180, 320–333. [Google Scholar] [CrossRef]
  85. Rosa, R.; Paula, J.R.; Sampaio, E.; Pimentel, M.; Lopes, A.R.; Baptista, M.; Guerreiro, M.; Santos, C.; Campos, D.; Almeida-Val, V.M.F.; et al. Neuro-oxidative damage and aerobic potential loss of sharks under elevated CO2 and warming. Mar. Biol. 2016, 163, 119. [Google Scholar] [CrossRef]
  86. Schmidel, A.J.; Assmann, K.L.; Werlang, C.C.; Bertoncello, K.T.; Francescon, F.; Rambo, C.L.; Beltrame, G.M.; Calegari, D.; Batista, C.B.; Blaser, R.E. Subchronic atrazine exposure changes defensive behaviour profile and disrupts brain acetylcholinesterase activity of zebrafish. Neurotoxicol. Teratol. 2014, 44, 62–69. [Google Scholar] [CrossRef]
  87. Topal, A.; Alak, G.; Ozkaraca, M.; Yeltekin, A.C.; Comaklı, S.; Acıl, G.; Kokturk, M.; Atamanalp, M. Neurotoxic responses in brain tissues of rainbow trout exposed to imidacloprid pesticide: Assessment of 8-hydroxy-2-deoxyguanosine activity, oxidative stress and acetylcholinesterase activity. Chemosphere 2017, 175, 186–191. [Google Scholar] [CrossRef] [PubMed]
  88. Zhang, X.J.; Yang, L.; Zhao, Q.; Caen, J.P.; He, H.Y.; Jin, Q.H.; Guo, L.H.; Alemany, M.; Zhang, L.Y.; Shi, Y.F. Induction of acetylcholinesterase expression during apoptosis in various cell types. Cell Death Differ. 2002, 9, 790–800. [Google Scholar] [CrossRef] [PubMed] [Green Version]
  89. Gonzalez-Rey, M.; Bebianno, M.J. Effects of non-steroidal anti-inflammatory drug (NSAID) diclofenac exposure in mussel Mytilus galloprovincialis. Aquat. Toxicol. 2014, 148, 221–230. [Google Scholar] [CrossRef] [PubMed]
  90. Lionetto, M.G.; Caricato, R.; Calisi, A.; Giordano, M.E.; Schettino, T. Acetylcholinesterase as a biomarker in environmental and occupational medicine: New insights and future perspectives. Biomed Res. Int. 2013, 2013, 321213. [Google Scholar] [CrossRef]
  91. Van der Ven, K.; Keil, D.; Moens, L.N.; Van Hummelen, P.; van Remortel, P.; Maras, M.; De Coen, W. Effects of the antidepressant mianserin in zebrafish: Molecular markers of endocrine disruption. Chemosphere 2006, 65, 1836–1845. [Google Scholar] [CrossRef]
  92. Oliveira, L.D.; Antunes, S.C.; Gonçalves, F.; Rocha, O.; Nunes, B. Evaluation of ecotoxicological effects of drugs on Daphnia magna using different enzymatic biomarkers. Ecotoxicol. Environ. Saf. 2015, 119, 123–131. [Google Scholar] [CrossRef]
Figure 1. Total mercury (THg) concentrations (mg∙kg−1 wet weight (ww)) in muscle (a), liver (b), and brain (c) of juvenile Solea senegalensis (mean ± standard deviation) fed with Hg-enriched diet in each treatment during the exposure (on days 0, 14, and 28) and elimination (day 35) periods. Abbreviations: CONT—animals fed with Hg-contaminated diet, seawater temperature set at 19 °C, and pH set at 8.0 units.; CONT + A—animals fed with Hg-contaminated diet, seawater temperature set at 19 °C, and pH set at 7.6 units; CONT + W—animals fed with Hg-contaminated diet, seawater temperature set at 23 °C, and pH set at 8.0 units; CONT + A + W—animals fed with Hg-contaminated diet, seawater temperature set at 23 °C, and pH set at 7.6 units. Gray lines indicate temperature set at 23 °C (warming (W)), whereas continuous lines indicate pH set at 8.0 units, and discontinuous lines indicate pH set at 7.6 units (acidification (A)). Different letters for each sampling day represent significant differences (p < 0.05) between treatments.
Applsci 10 01993 g001aApplsci 10 01993 g001b
Figure 2. Catalase (CAT) activity (nmol∙min−1∙mg−1 protein, mean ± SD) in S. senegalensis muscle (a), liver (b), and brain (c) after 28 days of Hg exposure. White bars represent non-contaminated treatments (non-CONT) and gray bars represent Hg-contaminated treatments (CONT). Control (CTR)—seawater temperature set at 19 °C and pH set at 8.0 units; A—seawater temperature set at 19 °C and pH set at 7.6 units; W—seawater temperature set at 23 °C and pH set at 8.0 units; A + W—seawater temperature set at 23 °C and pH set at 7.6 units. Different small letters denote significant differences between non-CONT treatments (ANOVA, p < 0.05). Different capital letters denote significant differences between CONT treatments (ANOVA, p < 0.05). Asterisks (*) represent differences between non-CONT and CONT for the same conditions (Student’s t-test: * p < 0.05; ** p < 0.005; *** p < 0.0005).
Applsci 10 01993 g002aApplsci 10 01993 g002b
Figure 3. Superoxide dismutase (SOD) activity (percentage inhibition, mean ± SD) in S. senegalensis muscle (a), liver (b), and brain (c) after 28 days of Hg exposure. White bars represent non-contaminated treatments (non-CONT) and gray bars represent Hg-contaminated treatments (CONT). CTR—seawater temperature set at 19 °C and pH set at 8.0 units; A—seawater temperature set at 19 °C and pH set at 7.6 units; W—seawater temperature set at 23 °C and pH set at 8.0 units; A + W—seawater temperature set at 23 °C and pH set at 7.6 units. Different small letters denote significant differences between non-CONT treatments (ANOVA, p < 0.05). Different capital letters denote significant differences between CONT treatments (ANOVA, p < 0.05). Asterisks (*) represent differences between non-CONT and CONT for the same conditions (Student’s t-test: * p < 0.05; ** p < 0.005; *** p < 0.0005).
Applsci 10 01993 g003
Figure 4. Lipid peroxidation in malonaldehyde (MDA) concentration (nmol∙mg−1 protein, mean ± SD) in S. senegalensis muscle (a), liver (b), and brain (c) after 28 days of Hg exposure. White bars represent non-contaminated treatments (non-CONT) and gray bars represent Hg-contaminated treatments (CONT). CTR—seawater temperature set at 19 °C and pH set at 8.0 units; A—seawater temperature set at 19 °C and pH set at 7.6 units; W—seawater temperature set at 23 °C and pH set at 8.0 units; A + W—seawater temperature set at 23 °C and pH set at 7.6 units. Different small letters denote significant differences between non-CONT treatments (ANOVA, p < 0.05). Different capital letters denote significant differences between CONT treatments (ANOVA, p < 0.05). Asterisks (*) represent differences between non-CONT and CONT for the same conditions (Student’s t-test: * p < 0.05).
Applsci 10 01993 g004
Figure 5. Acetylcholinesterase (AchE) activity (nmol∙min−1∙mg−1 protein, mean ± SD) in S. senegalensis brain, after 28 days of Hg exposure. White bars represent non-contaminated treatments (non-CONT) and gray bars represent Hg-contaminated treatments (CONT). CTR—seawater temperature set at 19 °C and pH set at 8.0 units; A—seawater temperature set at 19 °C and pH set at 7.6 units; W—seawater temperature set at 23 °C and pH set at 8.0 units; A + W—seawater temperature set at 23 °C and pH set at 7.6 units. Different small letters denote significant differences between non-CONT treatments (ANOVA, p < 0.05). Different capital letters denote significant differences between CONT treatments (ANOVA, p < 0.05). Asterisks (*) represent differences between non-CONT and CONT for the same conditions (Student’s t-test: * p < 0.05).
Applsci 10 01993 g005
Table 1. Net accumulation rates (NAR, µg∙day−1 at the end of exposure, i.e., day 28) in fish muscle, liver, and brain, as well as elimination factor (EF, as a percentage, at clearance) in the liver.
TissueTreatmentNAR during ExposureEF during Clearance
MuscleCONT53.1 ± 5.8 b≤0
CONT + A26.5 ± 3.6 a≤0
CONT + W73.3 ± 6.3 c≤0
CONT + A + W68.0 ± 2.5 c≤0
LiverCONT124.4 ± 8.4 b44.0 ± 1.2 b
CONT + A87.6 ± 4.4 a56.8 ± 1.9 c
CONT + W150.6 ± 5.5 c19.6 ± 4.3 a
CONT + A + W118.7 ± 4.4 b39.7 ± 4.7 b
BrainCONT40.4 ± 3.3 a≤0
CONT + A33.6 ± 2.9 a≤0
CONT + W54.9 ± 5.0 b≤0
CONT + A + W34.3 ± 3.8 a≤0
Abbreviations: CONT—animals fed with Hg-contaminated diet, seawater temperature set at 19 °C, and pH set at 8.0 units.; CONT + A—animals fed with Hg-contaminated diet, seawater temperature set at 19 °C, and pH set at 7.6 units; CONT + W—animals fed with Hg-contaminated diet, seawater temperature set at 23 °C, and pH set at 8.0 units; CONT + A + W—animals fed with Hg-contaminated diet, seawater temperature set at 23 °C, and pH set at 7.6 units. Different letters within a column represent significant differences (p < 0.05) between treatments for the same tissue.
Table 2. Percentage change (in relation to normal temperature and pH conditions) in the contribution of Hg tolerable weekly intake (TWI) (%) accomplished with the consumption of 150 g of three contaminated fish species (muscle) reared under climate change effects.
ExposureS. senegalensis1Argyrososmus regius2Dicentrachus labrax3
High Hg contamination + acidification exposure−47.3%0%n.d.
High Hg contamination + warming exposure35.9%40%20.6%
High Hg contamination + acidification and warming exposure26.4%0%n.d.
1 Present study; 2 calculation performed according to data provided by Sampaio et al. [25] and transformed to wet weight; 3 calculations performed according to data provided by Maulvault et al. [43]; n.d.: not determined.
Table 3. Mercury average concentrations (Hg, µg∙g−1 ww) of demersal and pelagic species found in literature in the European region, their actual hazard quotient (HQ; baseline reference), and HQ estimations under climate change predicted scenarios.
SpeciesHg (µg∙g−1 ww)ReferenceHazard Quotient (HQ)
ActualW 1A 2W + A 3
Demersal 4
Sole0.15[55]0.310.420.160.39
Flounder0.18 6[2]0.370.500.190.47
Mullet0.04 6[2]0.070.100.040.09
Halibut0.32[56]0.660.890.340.83
Atlantic cod0.20[57]0.410.560.210.52
Herring0.04[58]0.090.120.050.11
Pelagic 5
Meagre0.12 6[59]0.240.330.240.24
Seabass0.04[60]0.080.110.080.08
Black scabbard fish0.9[12]1.852.591.851.85
Bluefin tuna1.68[3]3.454.833.453.45
Fresh tuna0.94[61]1.922.691.921.92
Tope shark1.13[61]2.313.242.312.31
Atlantic mackerel0.04[62]0.090.120.090.09
1 HQ estimated under a warming scenario. 2 HQ estimated under an acidified scenario. 3 HQ estimated under a combined warming and acidified scenario. 4 HQ calculations for demersal fish were based on the variations in Hg in muscle of S. senegalensis under climate change stressors (this study). 5 HQ calculations for pelagic fish were based on Hg variations in muscle of A. regius under climate change stressors [25]. 6 Values transformed to wet weight according to the moisture content.
Table 4. Total weight (W; g), total length (TL; cm), and Fulton’s condition index (K) of specimens from all treatments at the end of Hg exposure phase.
TreatmentsWTLK
Non-CONT10.1 ± 1.3 b9.8 ± 0.5 b1.08 ± 0.06
Non-CONT + A7.3 ± 2.4 a,b8.8 ± 1.1 a,b1.07 ± 0.12
Non-CONT + W8.7 ± 2.0 a,b9.3 ± 0.6 a,b1.07 ± 0.09
Non-CONT + A + W8.9 ± 1.1 a,b9.0 ± 0.6 a,b1.25 ± 0.25
CONT5.9 ± 1.3 a8.3 ± 0.6 a1.01 ± 0.10
CONT + A7.7 ± 2.8 a,b8.9 ± 0.8 a,b1.07 ± 0.10
CONT + W7.1 ± 0.52 a,b8.7 ± 1.3 a,b1.04 ± 0.19
CONT + A + W7.5 ± 1.1 a,b8.9 ± 0.4 a,b1.07 ± 0.12
Abbreviations: Non-CONT—animals fed with non-contaminated diet, seawater temperature set at 19 °C, and pH set at 8.0 units; Non-CONT + A—animals fed with non-contaminated diet, seawater temperature set at 19 °C, and pH set at 7.6 units; Non-CONT + W—animals fed with non-contaminated diet, seawater temperature set at 23 °C, and pH set at 8.0 units; Non-CONT + A + W—animals fed with non-contaminated diet, seawater temperature set at 23 °C, and pH at 7.6 units; CONT—animals fed with Hg-contaminated diet, seawater temperature set at 19 °C, and pH set at 8.0 units; CONT + A—animals fed with Hg-contaminated diet, seawater temperature set at 19 °C, and pH set at 7.6 units; CONT + W—animals fed with Hg-contaminated diet, seawater temperature set at 23 °C, and pH at 8.0 units; CONT + A + W—animals fed with Hg-contaminated diet, seawater temperature set at 23 °C, and pH at 7.6 units. Small letters indicate significant differences between treatments.
Table 5. Pearson’s correlation coefficients (r and associated p-value) among Hg NAR, EF, and biochemical responses in the different tissues, as well as animal morphometry and condition (K).
Variables (X, Y)r and associated p-value
TL × Wr = 0.840p < 0.001
K × Wn.s.
K × TLr = −0.432p < 0.001
MuscleLiverBrain
NAR × Wn.s.n.s.ns
NAR × TLn.s.n.s.ns
NAR × Kn.s.n.s.ns
NAR × CATr = −0.4354p = 0.033n.s.r = −0.5073p = 0.011
NAR × SODn.s.n.s.r = −0.4411p = 0.031
NAR × LPOn.s.n.s.r = −0.4354p = 0.033
NAR × AchE---r = −0.4639p = 0.022
EF × W--n.s.--
EF × TL--n.s.--
EF × K--n.s.--
EF × CAT--n.s.--
EF × SOD--n.s.--
EF × LPO--n.s.--
K × CATn.s.n.s.n.s.
K × SODn.s.n.s.n.s.
K × LPOn.s.n.s.n.s.
K × AchEn.s.n.s.n.s.
Abbreviations: TW—total weight; TL—total length; K—Fulton’s condition index; NAR—net accumulation rate; EF—elimination factor; CAT—catalase; SOD—superoxide dismutase; LPO—lipid peroxidation; AchE—acetylcholinesterase; n.s.—non significant.

