Article

GSH Modification as a Marker for Plasma Source and Biological Response Comparison to Plasma Treatment

1
Department of Nuclear Engineering, North Carolina State University, Raleigh, NC 27605, USA
2
Department of Microbiology and Immunology, and Institute for Molecular Medicine & Infectious Disease, Drexel University College of Medicine, Philadelphia, PA 19102, USA
3
Centre for Innovation Competence (ZIK) Plasmatis, Leibniz Institute for Plasma Science and Technology, 17489 Greifswald, Germany
*
Author to whom correspondence should be addressed.
Appl. Sci. 2020, 10(6), 2025; https://doi.org/10.3390/app10062025
Submission received: 6 February 2020 / Revised: 5 March 2020 / Accepted: 9 March 2020 / Published: 17 March 2020
(This article belongs to the Special Issue Application of Plasma Technology in Bioscience and Biomedicine)

Abstract

:
This study investigated the use of glutathione as a marker to establish a correlation between plasma parameters and the resultant liquid chemistry from two distinct sources to predefined biological outcomes. Two different plasma sources were operated at parameters that resulted in similar biological responses: cell viability, mitochondrial activity, and the cell surface display of calreticulin. Specific glutathione modifications appeared to be associated with biological responses elicited by plasma. These modifications were more pronounced with increased treatment time for the European Cooperation in Science and Technology Reference Microplasma Jet (COST-Jet) and increased frequency for the dielectric barrier discharge and were correlated with more potent biological responses. No correlations were found when cells or glutathione were exposed to exogenously added long-lived species alone. This implied that short-lived species and other plasma components were required for the induction of cellular responses, as well as glutathione modifications. These results showed that comparisons of medical plasma sources could not rely on measurements of long-lived chemical species; rather, modifications of biomolecules (such as glutathione) might be better predictors of cellular responses to plasma exposure.

1. Introduction

Atmospheric pressure plasmas have been shown to exhibit beneficial outcomes for biomedical applications in wound healing [1], cancer [2], and other diseases. These outcomes are attributed to direct or indirect exposure of tissues to plasma-generated reactive oxygen and nitrogen species (RONS) regardless of the application method [3], i.e., directly as in dielectric barrier discharge (DBD) [4], indirectly via atmospheric pressure plasma jet (APPJ) [5], or through plasma-conditioned medium [6]. Investigations correlating the possible biological responses induced by plasma treatment to plasma parameters and components are typically limited to the source used. The configuration, discharge parameters, and environment influence the plasma components that interact with the cells and, thus, the contribution of each component to the cellular response [7,8,9,10,11]. However, direct cause-effect correlations have not yet been defined. Understanding how plasma generated RONS, UV, and electric fields affect cells will allow devices to be tailored for specific biological applications and eventually guide the community toward the determination of the “effective plasma dose” of each device.
Plasma-generated hydrogen peroxide (H2O2) is theorized to be a major effector of tumor cell killing [12,13]. However, a study comparing the nanosecond pulsed floating-electrode DBD (nspDBD) and the kINPen (an APPJ) showed similar in vitro reductions in the viability of the CT26 colorectal cancer cells at operating parameters where the kINPen produced twice as much H2O2 as the DBD [14]. These observations indicate that biological responses are not solely induced by long-lived, aqueous H2O2, and that plasma components other than H2O2 contribute to cell death [14]. The relative contribution of each component may be different, partly due to the differences in amounts of UV exposure, electric field, and short-lived and charged species in each plasma [4]. Recent literature supports these observations whereby exogenously added RONS are unable to replicate a biological effect observed subsequent to plasma exposure [15]. Therefore, changes in cell viability and other biological responses may not be the result of just RONS but of synergy from all components of plasma discharges where each plasma source produces a unique mix of these effectors. Yet comparisons between devices have traditionally relied on the chemistry produced to explain the observed differences in biological responses [16,17,18]. This limited chemistry set does not represent the chemical and biochemical processes possible during plasma treatment. For example, UV exposure and applied electric field are individually capable of inducing biological responses and enhance the observed effects of plasma-generated species [15,19,20]. In summary, there is a dire need for indicators that accurately reflect the magnitude of the biological response in correlation to all components of plasma treatment.
Recent studies have explored the use of cysteine as such an indicator to trace the short and long-lived species in the liquid phase and their potential biological impacts [11,21,22]. The different modifications infer the presence of specific molecules from short-lived species like OH to end-products like H2O2. Therefore, modifications to molecules like cysteine, the cysteine-containing glutathione (GSH) [23], or phenol [24] could be reflective of the dominant chemical species from plasma treatment that influence cellular outcomes. The amounts and types of modifications measured could help to optimize plasma treatment regimens, as well as plasma sources for specific applications. This would also provide a potential method for comparison of plasma sources and their potential for biological applications without the need for cell culture. However, the correlation between molecular modifications and specific cellular responses must be established first. To this end, this work showed the comparison between the European Cooperation in Science and Technology Reference Microplasma Jet (COST-Jet) [25] and the nspDBD [26] from both chemical composition and biological response perspective. Further, modifications on the cysteine-containing protein glutathione were compared for an attempt to establish correlations with cellular outcomes.
The plasma discharge components that contribute to biological responses following exposure vary in magnitude between the two devices. The COST-Jet generates myriad RONS in the active plasma, influenced by admixtures and absorbed power, that undergo complex reactions with molecules in the ambient air [11,25,27,28]. Short-lived species, such as a nitric oxide (NO), hydroxide radical (OH), and atomic oxygen (O), and long-lived species are transported by gas flow and solvate into the liquid interface [15,21,29,30]. While the UV produced in the discharge radiates towards the liquid interface and may influence the treated targets, the electric field does not affect the targets since it is perpendicular to the gas flow (Figure 1). In contrast, the nspDBD produces short and long-lived RONS at the liquid interface. The charged species are driven by the electric field to the liquid interface, whereas the neutral species have diffusion dominated transport and solvate as governed by Henry’s law [31]. The UV and electric field components of the nspDBD are directed towards the liquid interface. These nspDBD components individually influence the cellular response at different magnitudes [26]. Therefore, the contribution of any plasma component may significantly influence the cellular response in one treatment approach and be insignificant in another. To compare how these components may affect different plasma treatment approaches, where the components have varying influence on the overall cellular response, the cell’s biological outcome must be comparable.
This study focused on determining if correlations could be established between biological responses of cells to plasma treatment and the modifications to GSH structure caused by plasma. Klinkhammer et al. could show that plasma treatment modified GSH, and the magnitude of these modifications increased with plasma treatment time [23]. We expanded this work by investigating the relationship between observed biological outcomes in Jurkat T lymphocytes and modifications to GSH from two different plasma sources. First, we demonstrated that these two plasma sources could be operated at parameters where comparable reductions in Jurkat T lymphocyte viability were achieved. This served as a benchmark for further chemical and biological comparisons of the two plasma sources. Next, we showed that the levels of mitochondrial superoxide (O2) production and translocation of calreticulin to the outer surface of the cell membrane (ecto-CRT) were comparable between the two sources at these plasma treatment parameters. The measured concentrations of long-lived RONS were higher in the medium than in deionized water. This indicated that reactions with the medium components produced more RONS in the liquid than without organic compounds. Even with higher concentrations in the medium, the reactions between plasma-generated RONS and the medium components reduced the toxicity observed from H2O2 alone. We showed that exogenously added long-lived species alone were not responsible for inducing these biological changes. Finally, we evaluated GSH modifications as a potential, scalable marker for correlations between observed biological responses and plasma parameters. Our results showed that changes in a marker, such as GSH, could elucidate the plasma-generated chemistry unique to each source and might correlate with potential biological applications for the plasma source. While the modifications indicated the presence of specific RONS, the biological implications of these RONS were dependent on both their concentration and the cell type.

2. Materials and Methods
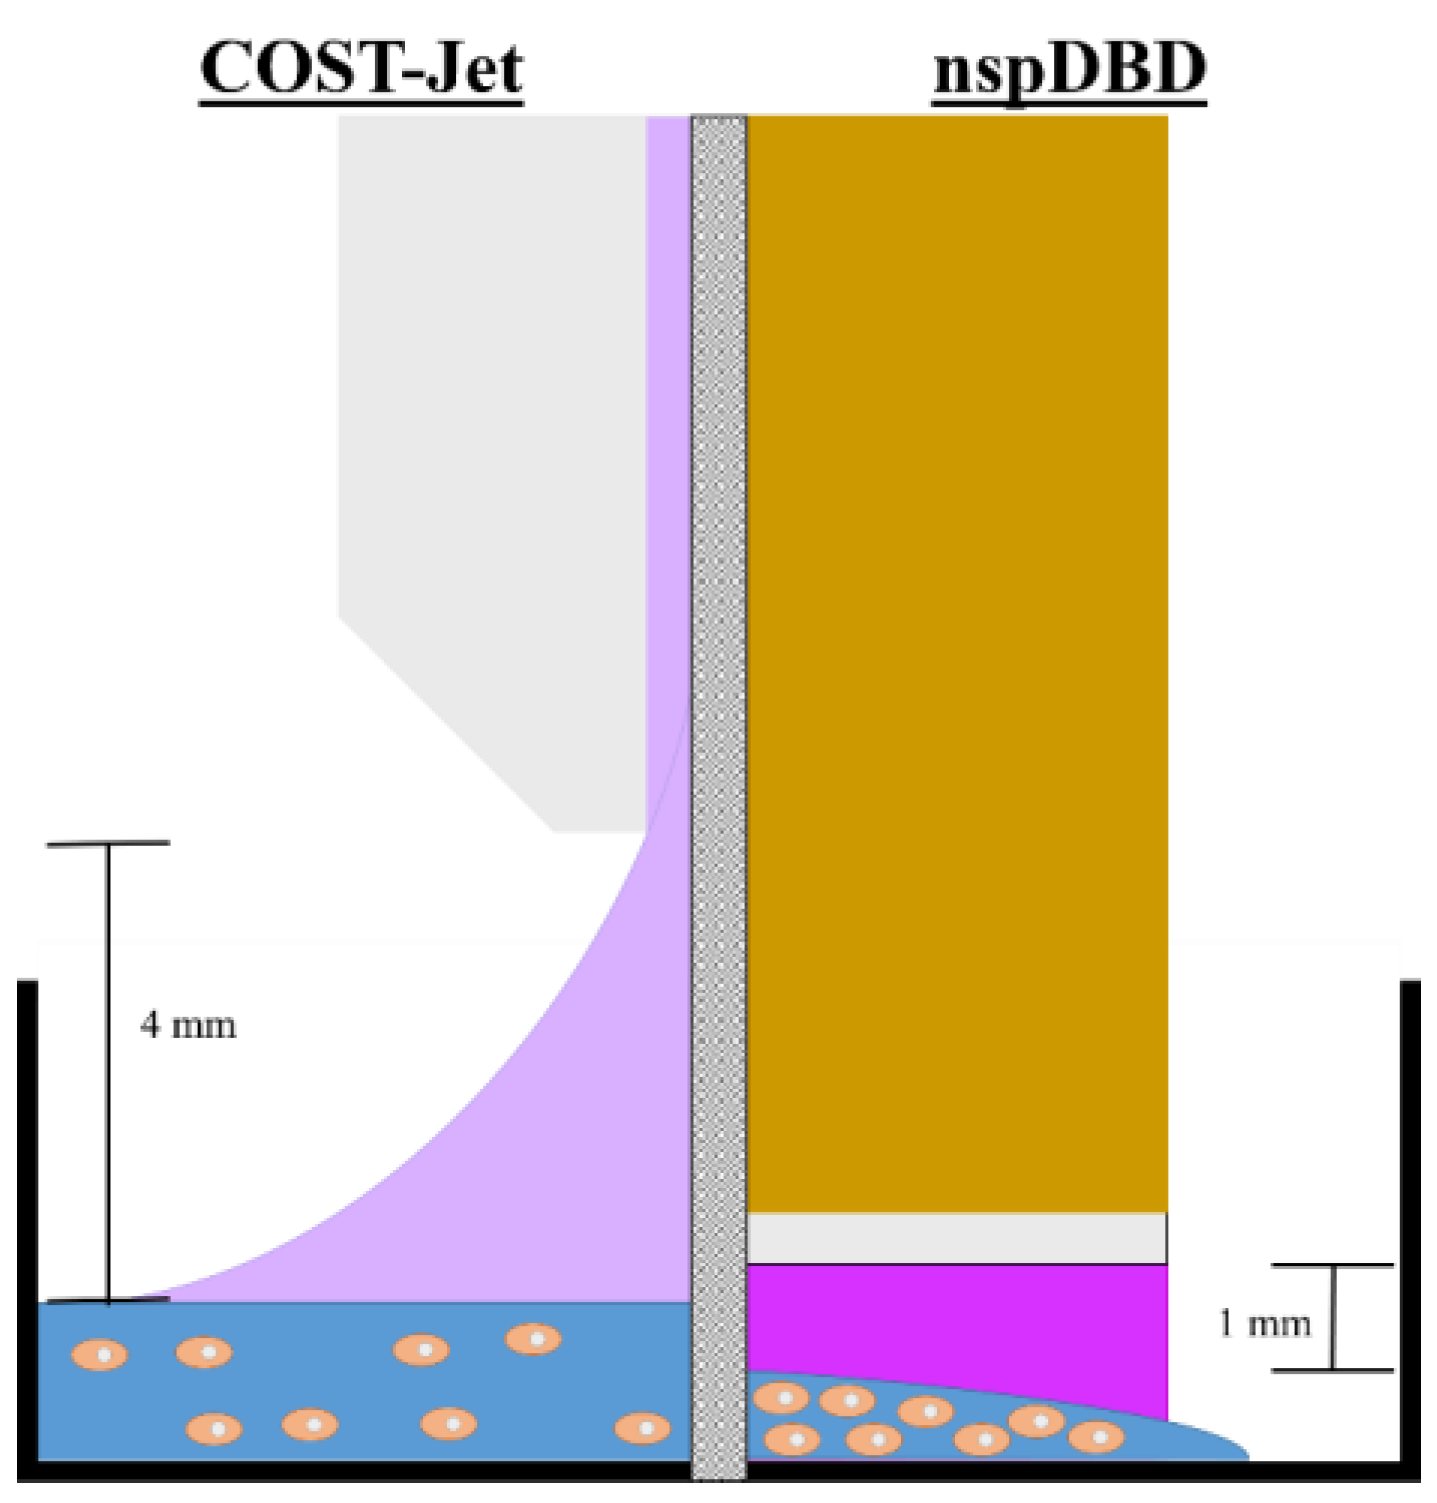
2.1. Plasma Setups

The COST-Jet is a radiofrequency (rf)-driven capacitively coupled plasma jet. The feed gas used in this study was He, with a 0.6% O2 admixture. The plasma was generated by applying an rf voltage at 13.56 MHz. Helium and oxygen (grade 5) were used for the experiments. The COST-Jet was operated at the ignition voltage to be comparable to reported literature [11]. The plasma treatment parameters are listed in Table 1.
The nspDBD used in this work was similar to those described previously [4]. Plasma was generated by applying a high voltage pulse to a copper electrode with a quartz dielectric barrier. As shown in Table 1, the treatment parameters for the nspDBD were fixed at 1 mm gap distance, 29 kV, and exposure duration of 10 s. The frequency of the pulses was varied to change the amount of energy deposited by the discharge.
The viability, MitoSOX, and calreticulin (CRT) experiments and colorimetric assays were performed in 12-well plates, while the Raman samples were prepared in 24-well plates. The treatment schematic for both plasma sources is shown in Figure 1.

2.2. Cell Culture

Jurkat cells (clone E6, ATCC® TIB152™) (American Type Culture Collection, Manassas, VA, USA) were maintained in Roswell Park Memorial Institute (RPMI) 1640 media supplemented with 10% fetal bovine serum (FBS) (Fisher Scientific, Hampton, NH, USA) and 1% penicillin/streptomycin (P/S) (ThermoFisher Scientific, Waltham, MA, USA) in a 37 °C incubator at 5% CO2. For COST-Jet experiments, cells were seeded at 3 × 10⁵ cells/mL in 12-well plates with 500 µL per well (1.5 × 10⁵ cells/well). Cells exposed to nspDBD plasma were seeded at 1.5 × 10⁶ cells/mL with 100 µL aliquots initially, then supplemented with 400 µL of media immediately after treatment (1.5 × 10⁵ cells/well).

2.3. Viability Assay

Jurkat cells were treated by nspDBD plasma at 45 and 75 Hz for 10 s or the COST-Jet for 2 and 4 min. Immediately after nspDBD exposure, cells were supplemented with media and then incubated for 24 h prior to assessing cell viability. To determine percent viable cells, dead cells were stained with 0.5 mg/mL propidium iodide (ThermoFisher Scientific, Waltham, MA, USA), a cell impermeable dye that enters non-viable cells through damaged membranes and intercalates with the DNA, emitting a fluorescent signal that can be detected using an image cytometer (Nexcelom Bioscience, Vision CBA, Lawrence, MA, USA).

2.4. MitoSOX Red Assay

Intracellular mitochondrial O2 production was detected in Jurkat cells 24 h post-treatment. Cells were washed with PBS and then stained with 5 µM MitoSOX™ Red mitochondrial O2 indicator for 10 min (Molecular Probes, Invitrogen Cat. M36008, Eugene, OR, USA). O2 generation was correlated with fluorescence intensities of measured percent MitoSOX positive cells using the Nexcelom image cytometer.

2.5. Surface Calreticulin Detection

Jurkat cells were treated by the nspDBD or the COST-Jet and then incubated for 24 h. Calreticulin on the cell surface was detected by staining cells with calreticulin polyclonal primary antibody (ThermoFisher Scientific, Waltham, MA, USA) and an Alexa Fluor 488 goat anti-rabbit IgG (H + L) secondary antibody (ThermoFisher Scientific, Waltham, MA, USA). Percent of calreticulin positive cells in the total cell population and calreticulin fluorescence intensity were measured using the Nexcelom image cytometer. Analyses of fluorescence intensity were done on FCS Express version 4 (De Novo™ software, Pasadena, CA, USA, 2011).

2.6. Colorimetric Assays for Chemical Analysis

Plasma treated samples were analyzed immediately for H2O2 and nitrite (NO2) concentrations using colorimetric assays. The phenanthroline derivative-copper method (Millipore Sigma, USA, Burlington, MA, USA) and Griess reagent (Molecular Probes, Invitrogen Cat. G7921, Eugene, OR, USA) were used for H2O2 and NO2 measurements, respectively. For H2O2 detection, 150 µL of plasma-treated liquid (deionized (DI) water or RPMI supplemented with 10% FBS and 1% P/S) was mixed with 15 µL each of the kit reagents: H2O2-1 and H2O2-2. The sample was incubated at room temperature in the dark for 10 min prior to measuring the absorption at 450 nm. For NO2, 150 µL of plasma-treated liquid was mixed with 130 µL of deionized water and 20 µL of the Griess reagent. The sample was incubated at room temperature in the dark for 30 min. The absorption was measured at 548 nm. All absorption measurements were taken on a plate reader (Fluoroskan Ascent™ FL, Thermofisher Scientific, Waltham, MA, USA) in flat-bottomed 96-well plates.

2.7. Raman Spectroscopy of Glutathione Modifications

Glutathione (GSH) (Thermofisher Scientific, Waltham, MA, USA) samples were prepared in deionized water at 10 mg/mL. For the nspDBD-treated samples, 10 µL was treated at 45 and 75 Hz, frozen at −80 °C and shipped to North Carolina State University for analysis. Upon arrival, 10 µL of the sample was dried on a calcium fluoride window overnight using a desiccator. For the COST-Jet, 500 µL samples were treated for 2 and 4 min at North Carolina State University. The 10 µL aliquots were dried overnight on the calcium fluoride window, similar to the nspDBD-treated samples. Measurements were performed on a confocal Raman microscope (Senterra II, Bruker Corporation, Billerica, MA, USA) with a wavelength of 532 nm at 20 mW. All measurements were taken using a 50× objective lens (OLYMPUS BX53M, Olympus, Waltham, MA). The spectra were measured from 0–3700 cm1 using the OPUS software (Bruker Optic GmbH, Version 7.8, Ettlingen, Germany). For each sample, 10 spectra were averaged for 10 different positions with an integration time of 1 s, similar to previous studies [23]. Background measurements were performed prior to sample measurement with the laser aperture fully closed. The raw sample spectra were analyzed by performing a rubberband baseline correction using the OPUS software, as described in [32]. Briefly, the spectrum is divided into segments, and the lowest point in each segment is used to estimate the baseline. For this study, 100 segments were used to define the baseline. After the baseline subtraction, spectra were normalized to the integrated C-H stretching peak at 2950 cm1. All measurements were done in triplicate.

2.8. Statistical Analysis

Each experiment was performed in triplicate unless otherwise stated. The data were plotted as mean and standard deviation. Graphs were plotted in Origin 2018b (OriginLab Corporation, Northampton, MA, USA).

3. Results

3.1. Comparison of Cellular Responses between COST-Jet and nspDBD Treatment of Jurkat T Lymphocytes

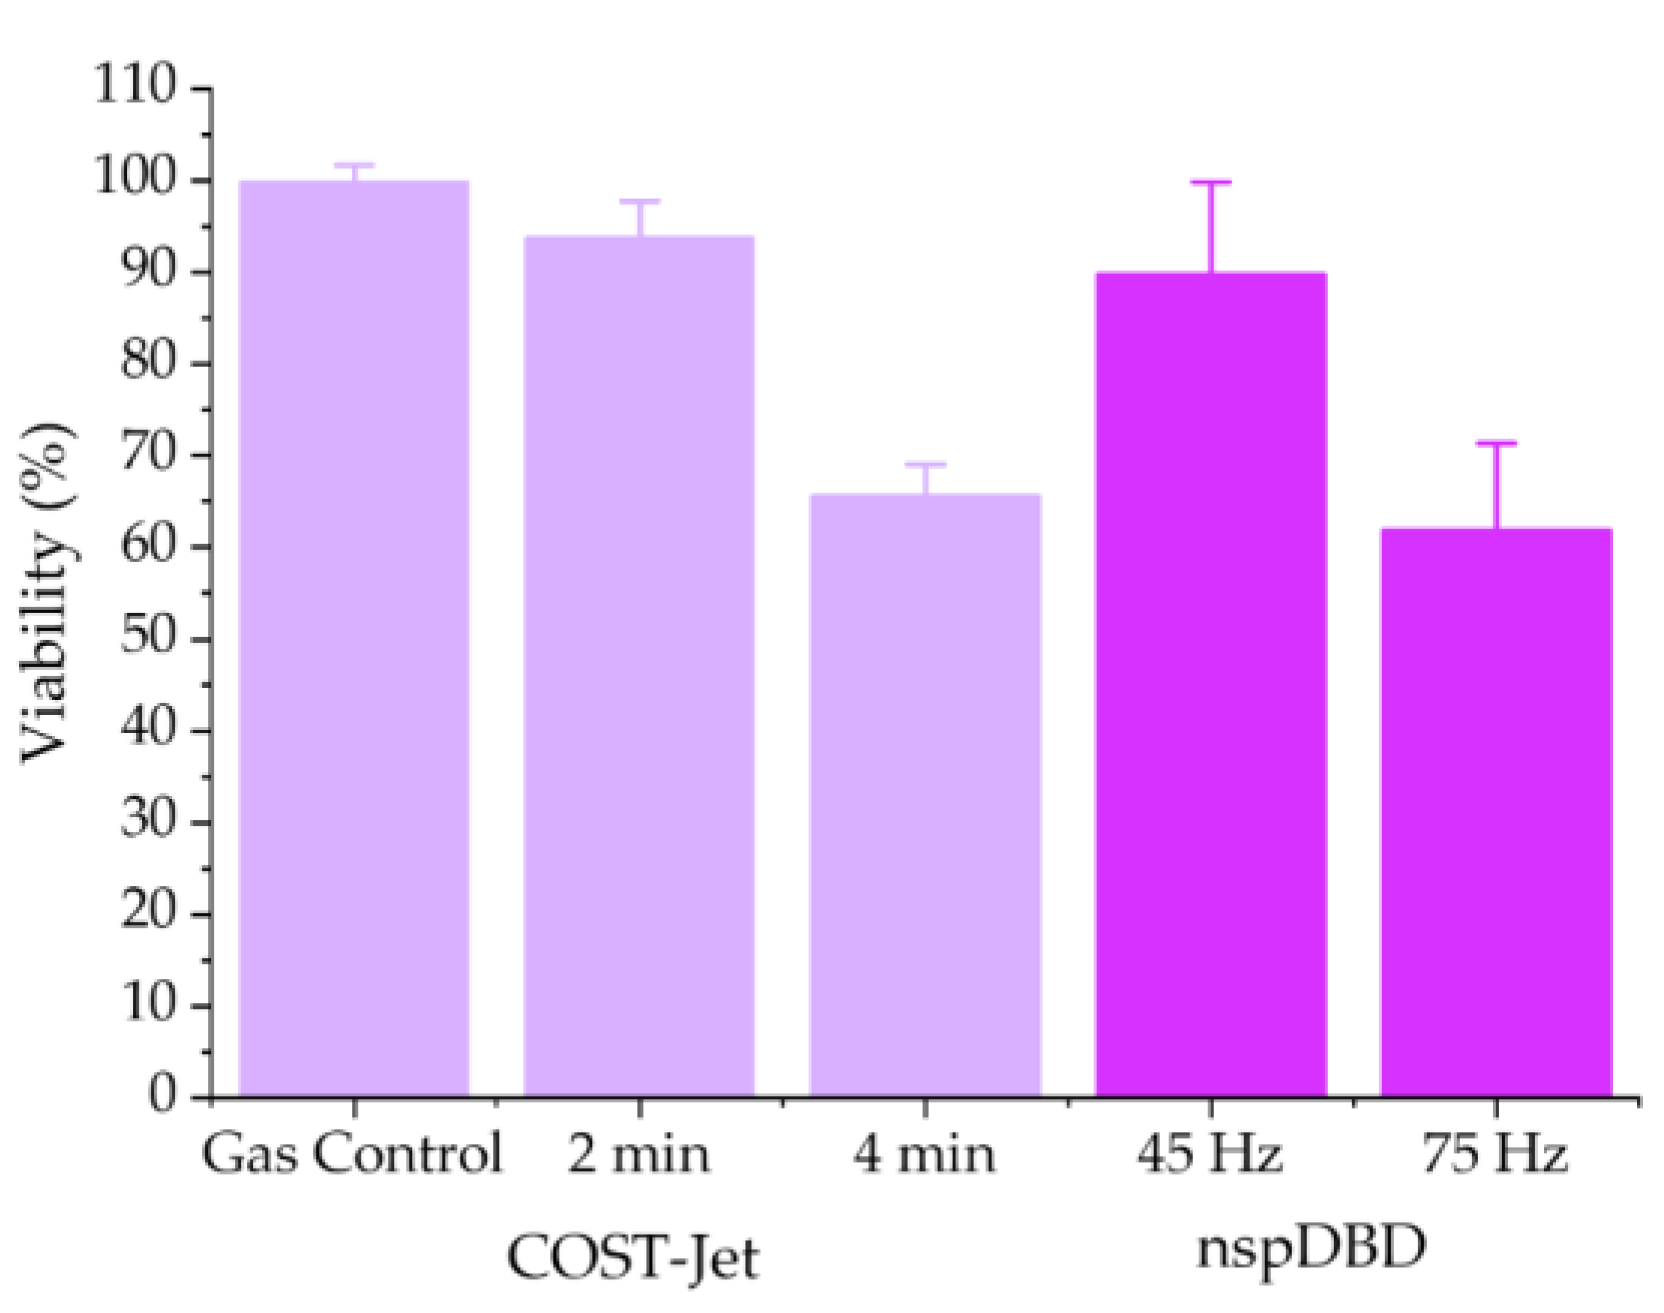
3.1.1. COST-Jet and nspDBD Treatment Cause Comparable Reductions in Jurkat T Lymphocyte Viability

To establish a common basis for comparing the two plasma sources, we sought treatment parameters necessary to achieve a predefined biological endpoint—comparable reductions in viability. Jurkat cells were treated by plasma from the nspDBD [33] or the COST-Jet [34] (He + 0.6% O2), using conditions described in previous studies (Table 1). In these studies, reduced viability was correlated with frequency for the nspDBD and treatment time for the COST-Jet; thus, we treated from 30–75 Hz with the nspDBD and up to 5 min with the COST-Jet. Cells were analyzed 24 h post-treatment. The propidium iodide (PI) viability assay was used to identify plasma parameters for each source that caused comparable reductions in cell viability.
Jurkat cell viability, normalized to the untreated controls (for the COST-Jet controls, cells were exposed to the feed gas only), was reduced with increasing frequency for nspDBD and increasing treatment time for the COST-Jet. A 5-min exposure to the feed gas (He + 0.6% O2) did not affect cell viability, in agreement with other COST-Jet studies [34,35].
As shown in Figure 2, two operating conditions were identified between the two plasma sources where cell viability was comparable:
  • 2-min for the COST-Jet (93.7% ± 3.9%) and 45 Hz for the nspDBD (89.8% ± 10.01%)
  • 4-min for the COST-Jet (65.7% ± 3.4%) and 75 Hz for the nspDBD (61.9% ± 9.4%).
These results demonstrated that completely different plasma devices could be operated to achieve the same biological endpoint. These two discharge conditions were used as the basis for further comparative investigations because similar responses were observed despite the fact that the cells were exposed to different magnitudes of species and conditions unique to each source (gas flow for the COST-Jet; charged species, UV radiation, and electric field for the nspDBD).

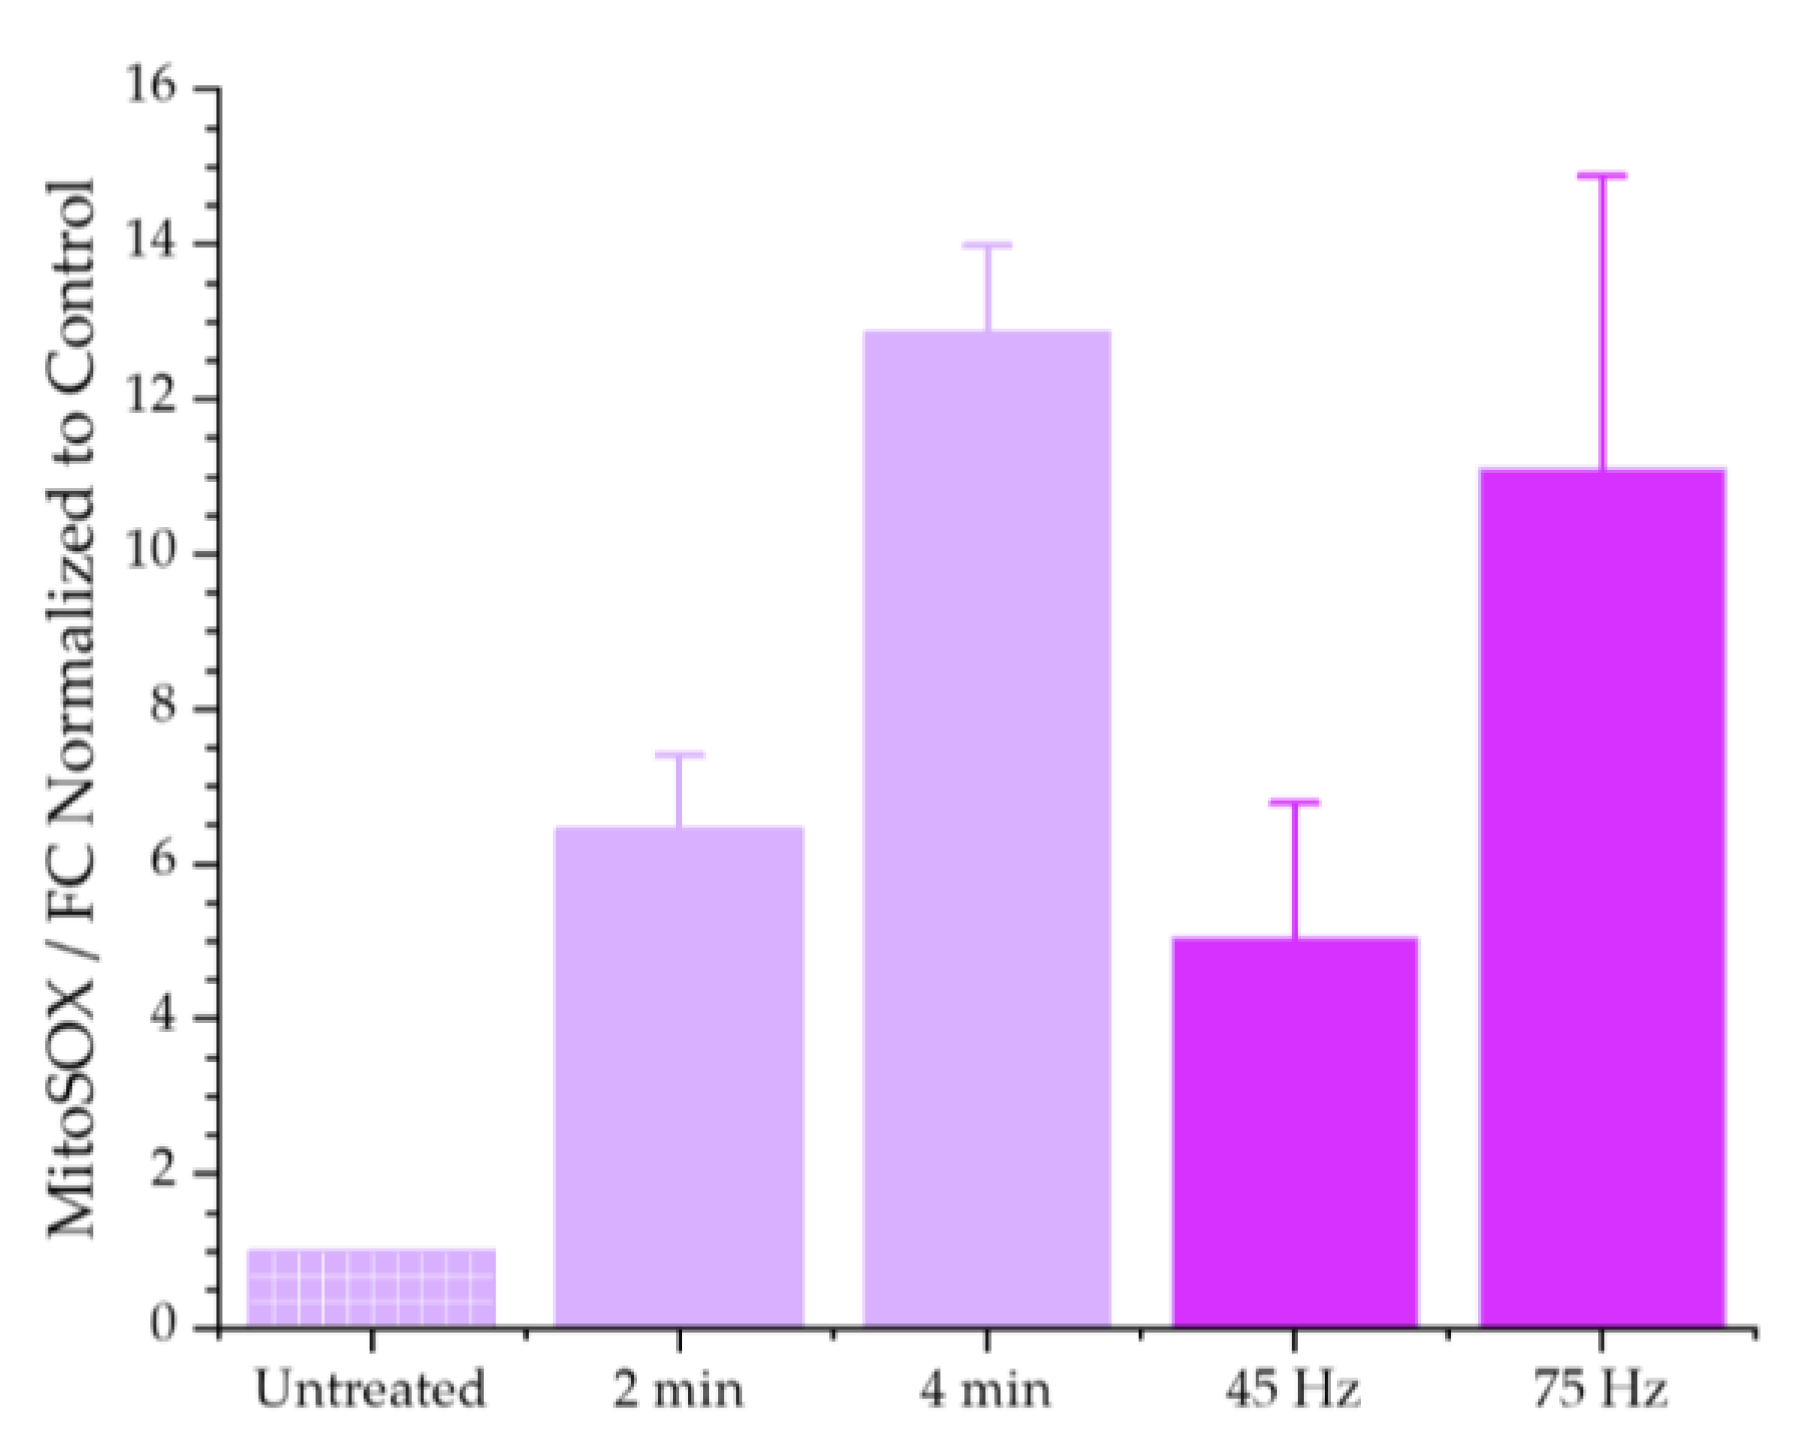
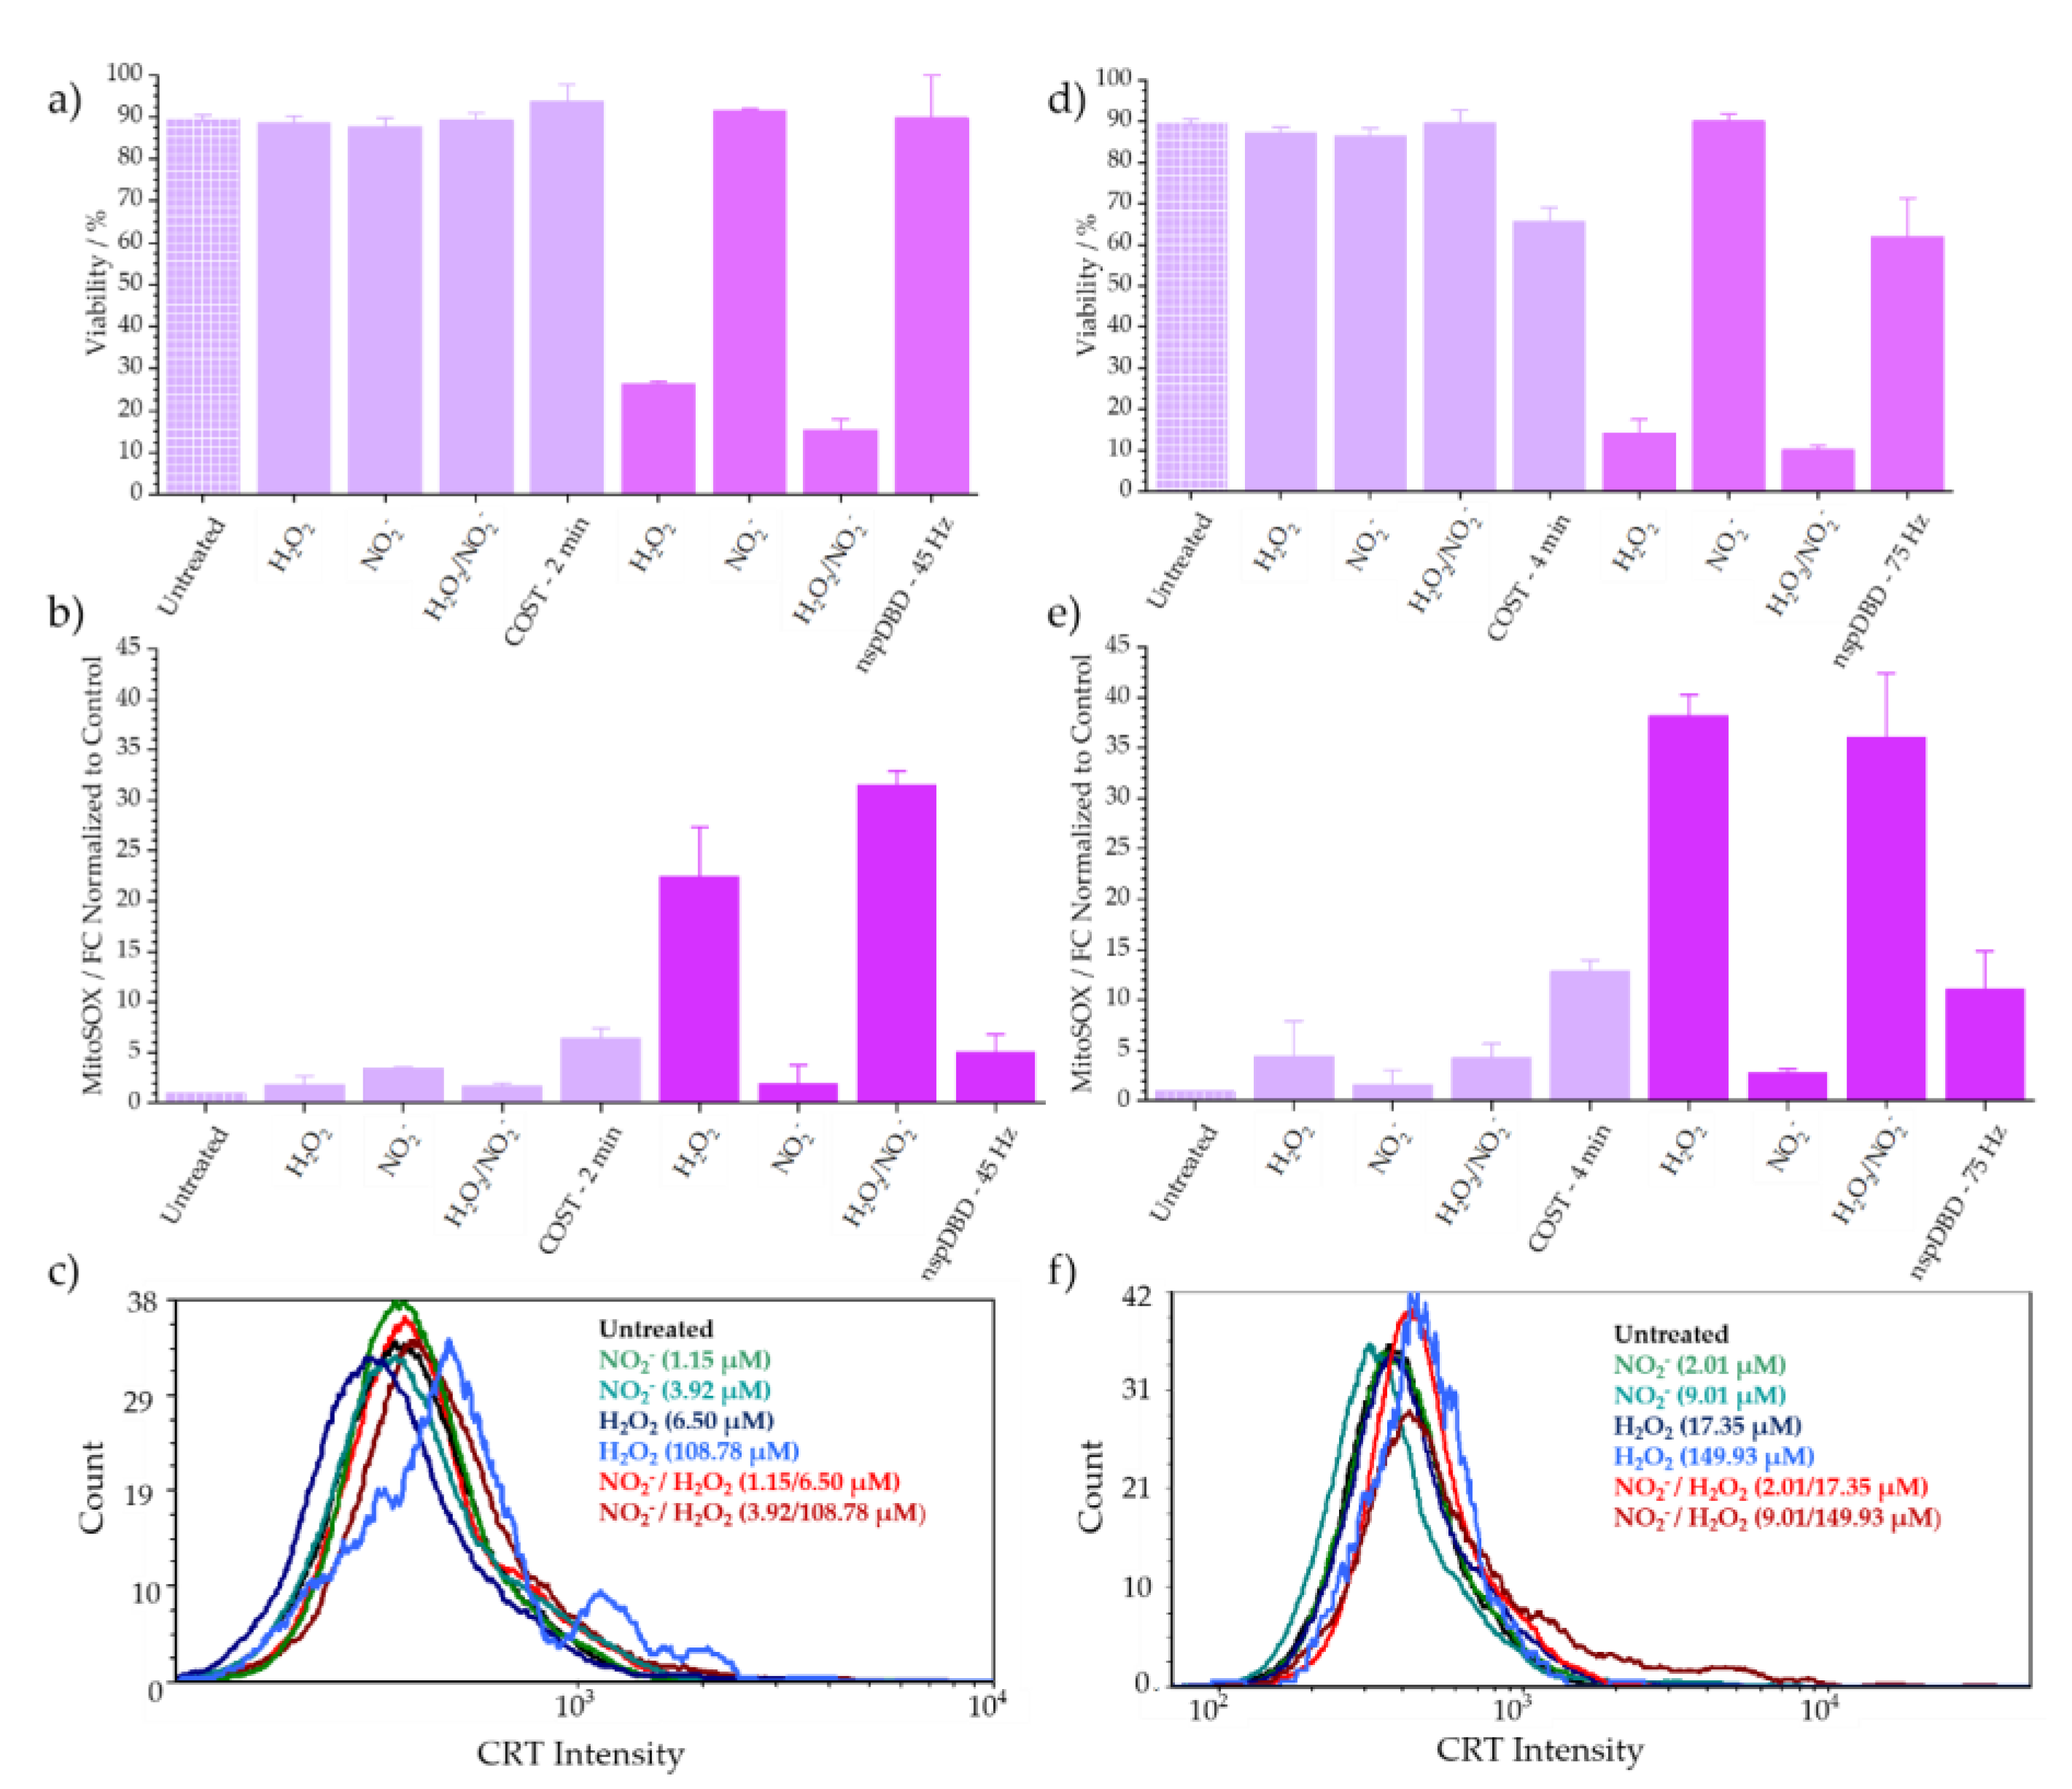
3.1.2. Mitochondrial Superoxide Production Increases in Response to Plasma Treatment

Additional experiments were conducted to determine if other biological endpoints were also comparable at these operating conditions. Another cellular function that is known to be affected by plasma is the triggering of intracellular oxidative stress pathways. O2 production by the mitochondria is an indicator of cellular oxidative stress [36,37]. To determine if there were differences in the oxidative stress induced by each device, we compared MitoSOX fluorescence in Jurkat cells treated with both plasma sources. As shown in Figure 3, cells treated with the COST-Jet and nspDBD at the same operating conditions as above had similar magnitudes of MitoSOX fluorescence. Cells responded to plasma from both sources by increasing their mitochondrial O2 production in a dose-dependent fashion, indicating that stress-responsive pathways were being upregulated in each case.

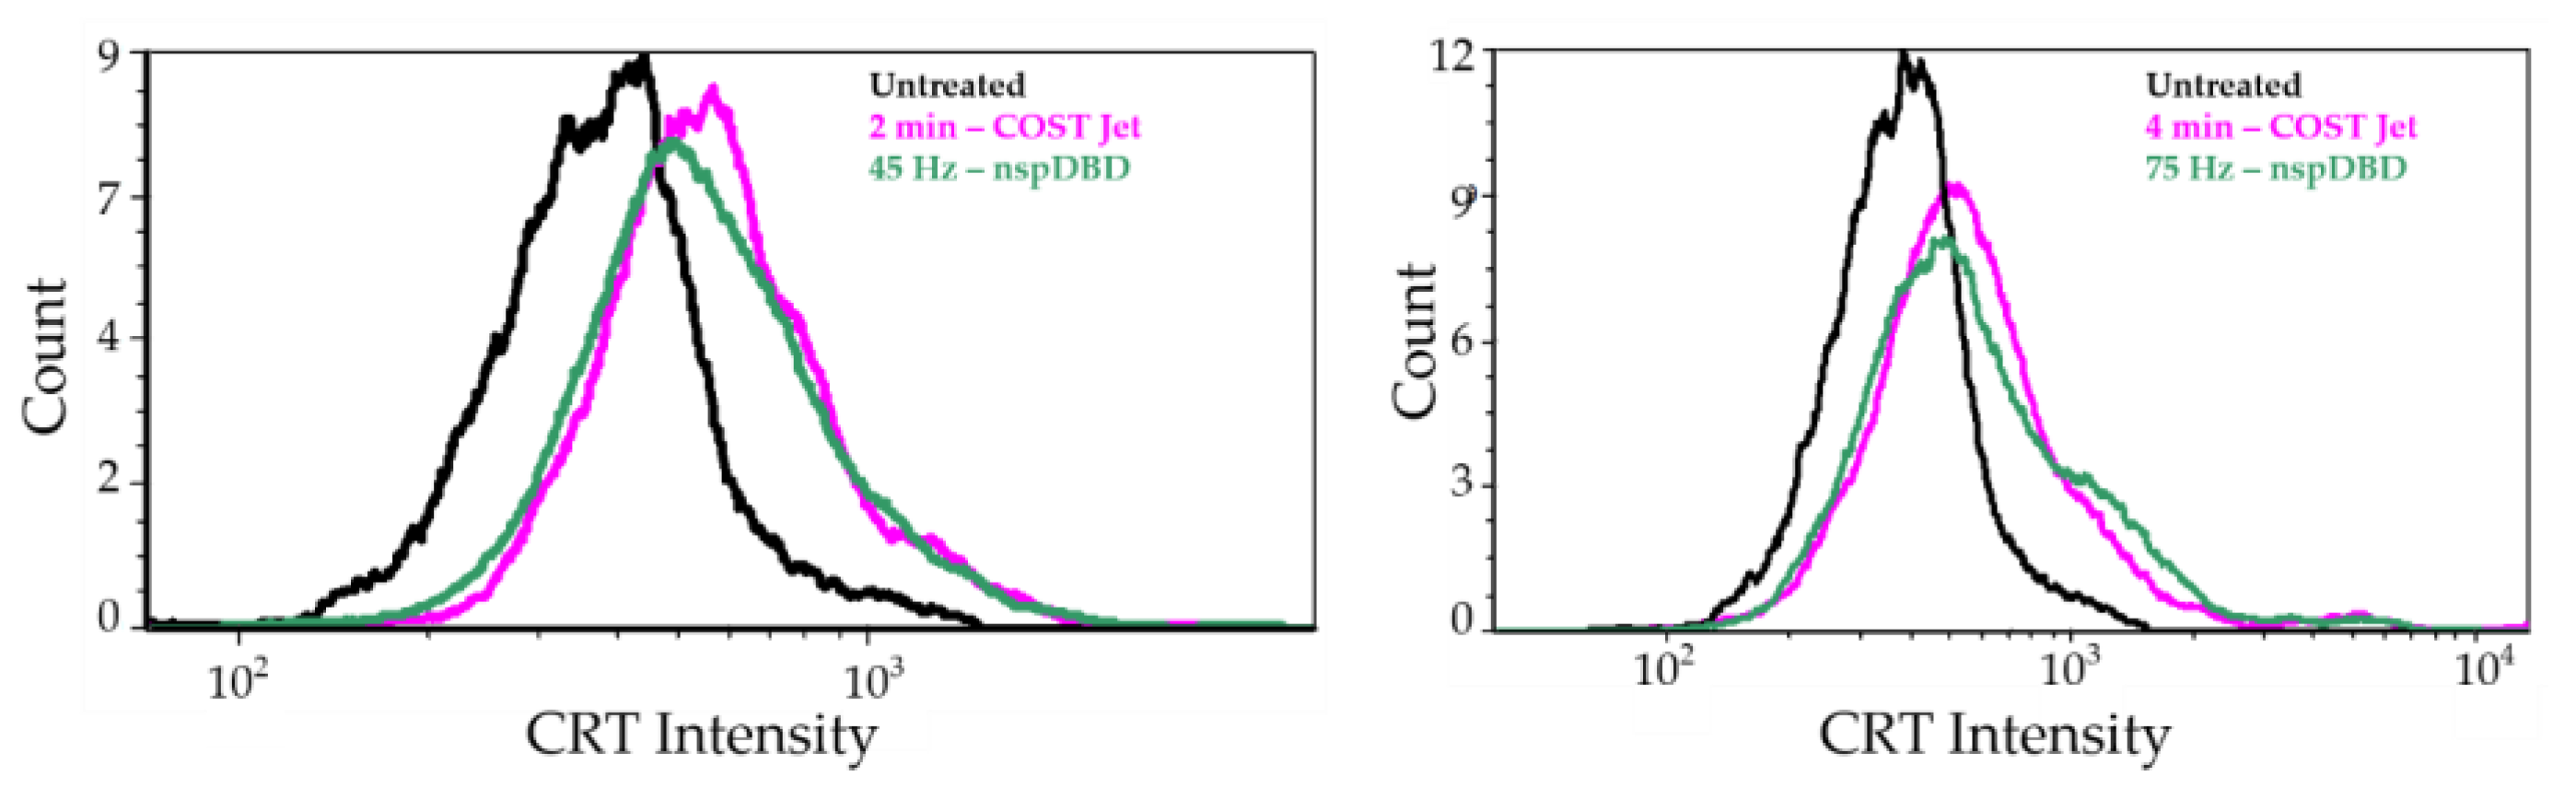
3.1.3. COST-Jet and nspDBD Treatment Increase the Cell Surface Display of Ecto-CRT

To assess a third biological response that is influenced by plasma-induced changes in cellular redox, we analyzed the cell surface display of calreticulin (ecto-CRT) on Jurkat cells after exposure to both plasma devices. Ecto-CRT is known to increase the phagocytic uptake of cells, which is a crucial step in the initiation of immune responses [38]. Generation of intracellular RONS, such as O2, upon plasma exposure, has been shown to induce endoplasmic reticulum (ER) stress and cause the ER-resident chaperone protein, calreticulin, to become translocated to the cell surface [33]. Furthermore, this translocation is believed to be largely dependent on plasma-delivered short-lived species [15]. The influence of nspDBD and COST-Jet plasma exposures on ecto-CRT translocation was compared under the plasma conditions shown to produce similar reductions in cell viability (Figure 2). We found that plasma treatment increased ecto-CRT in both cases (Figure 4), possibly as a result of increased oxidative ER stress. This suggested that the unique cocktail of effectors generated by the COST-Jet affected CRT translocation, albeit perhaps through a different chemical pathway, to a degree similar to that attributed to the nspDBD.

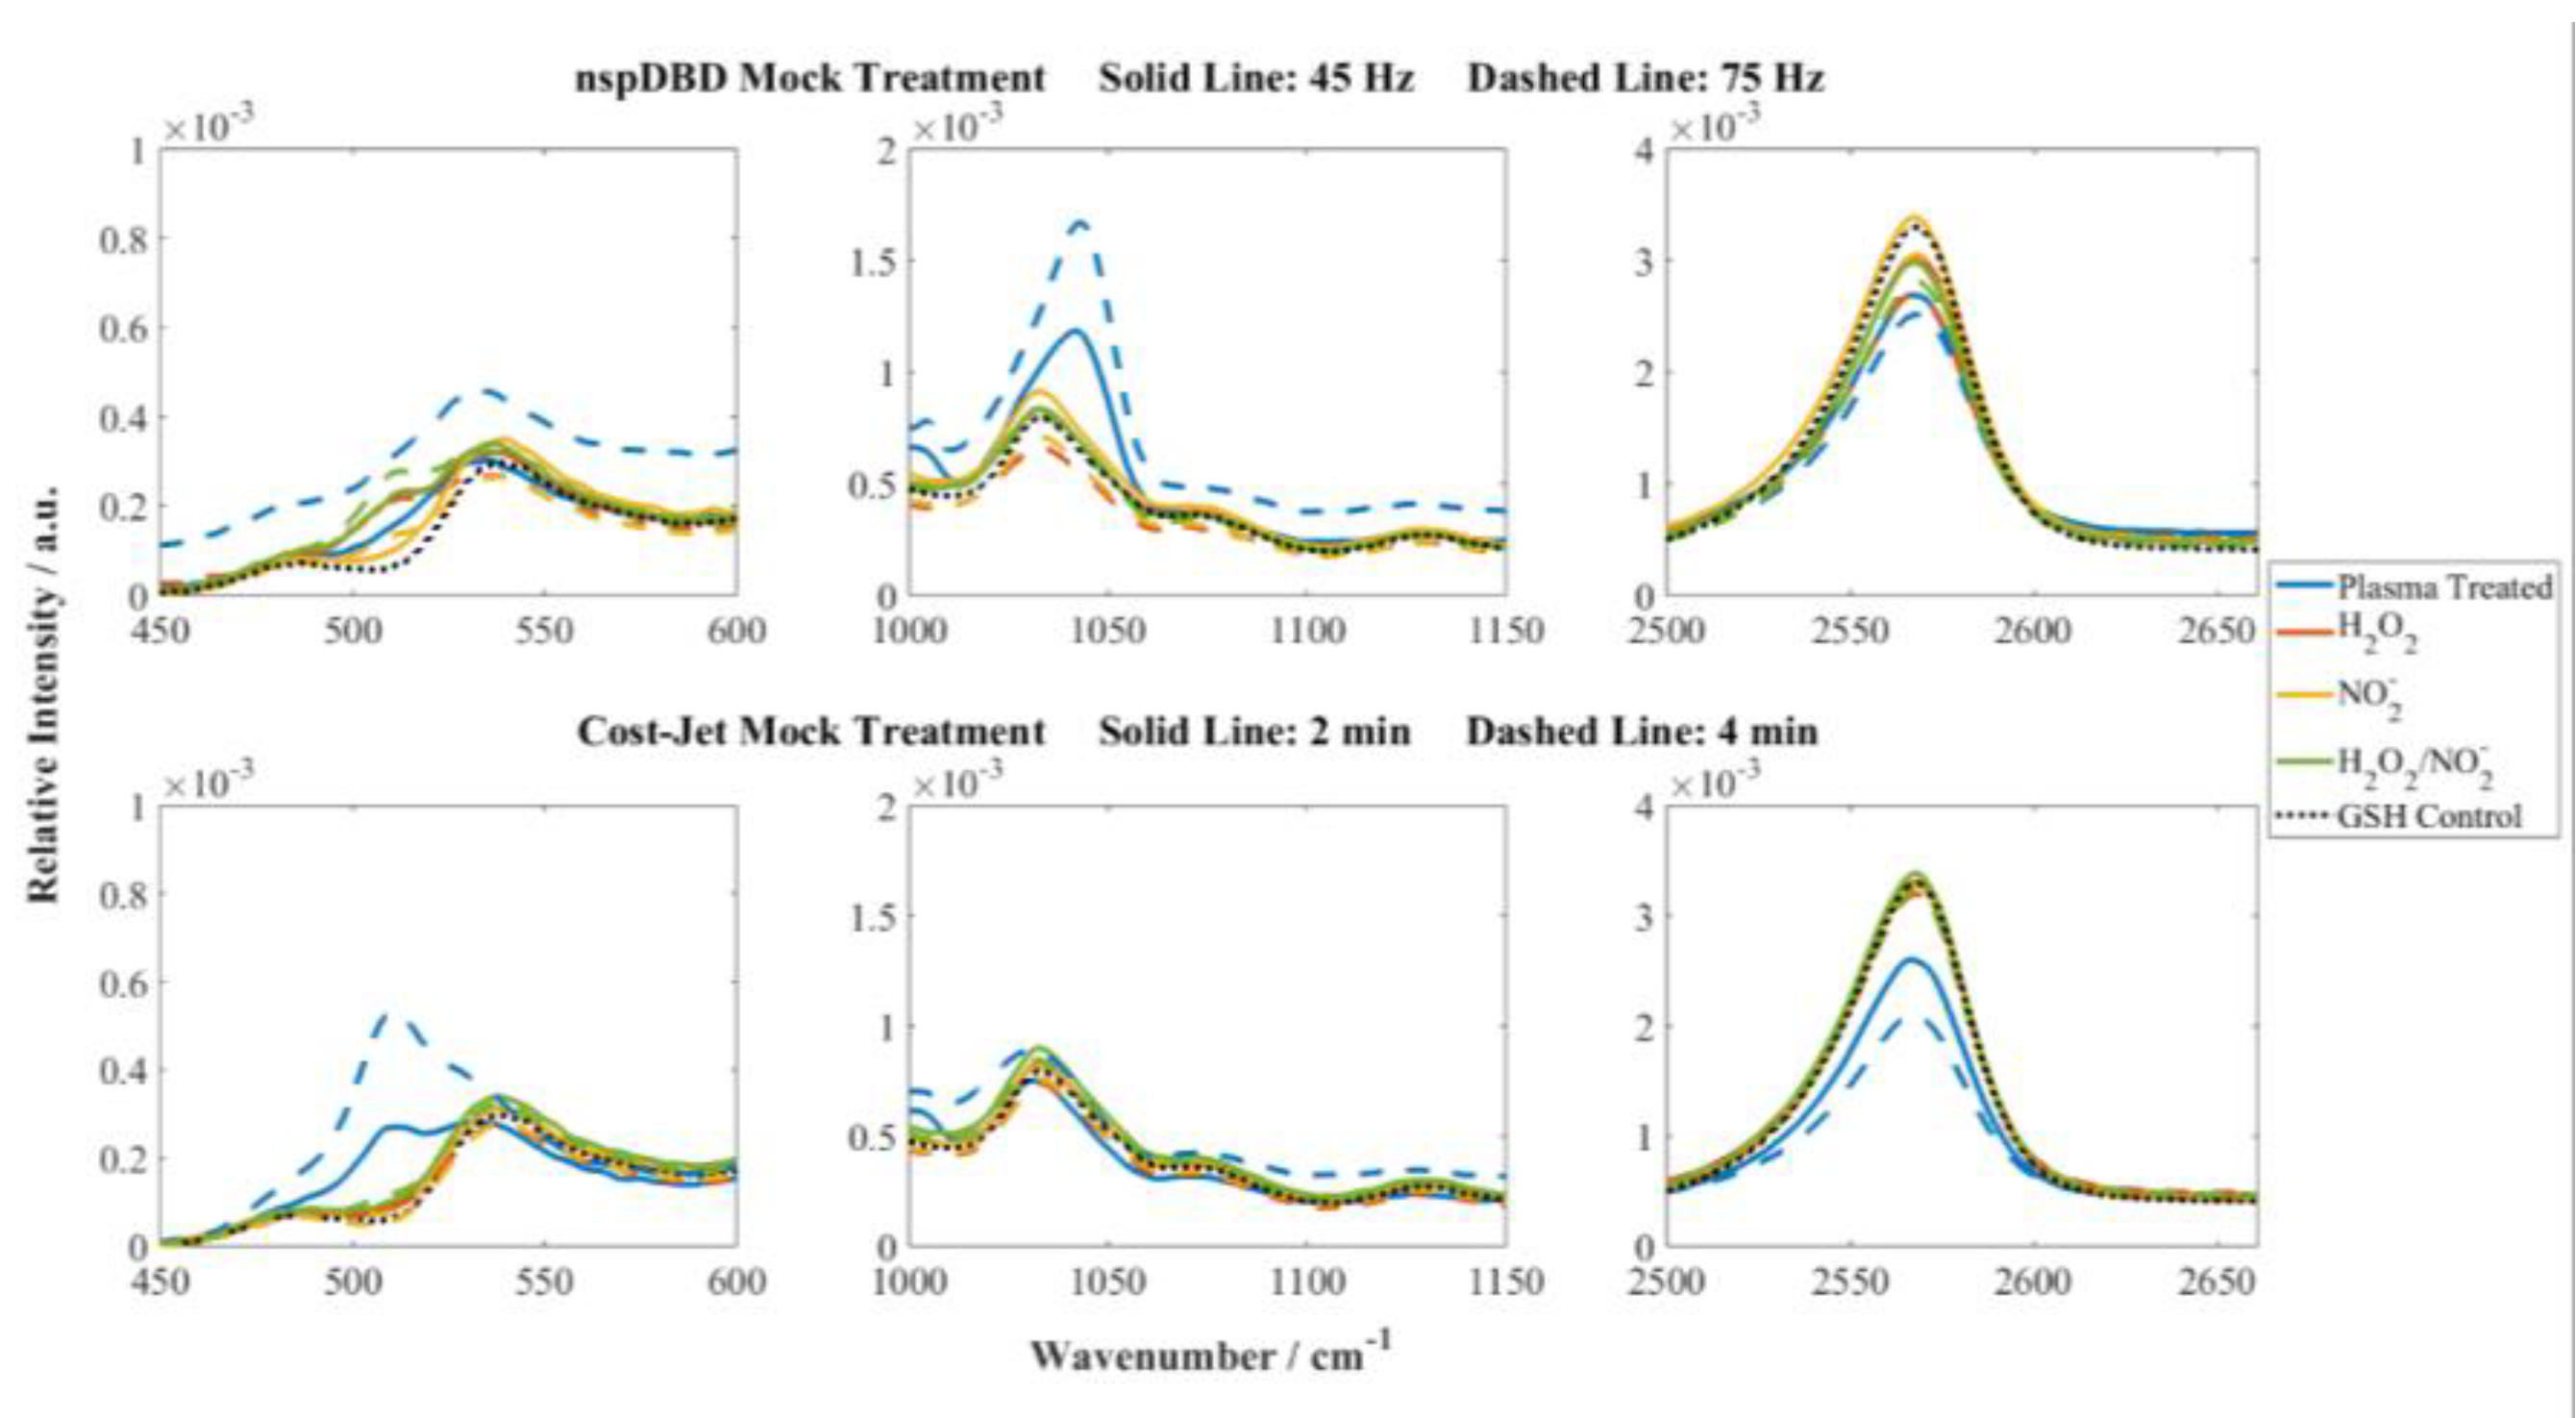
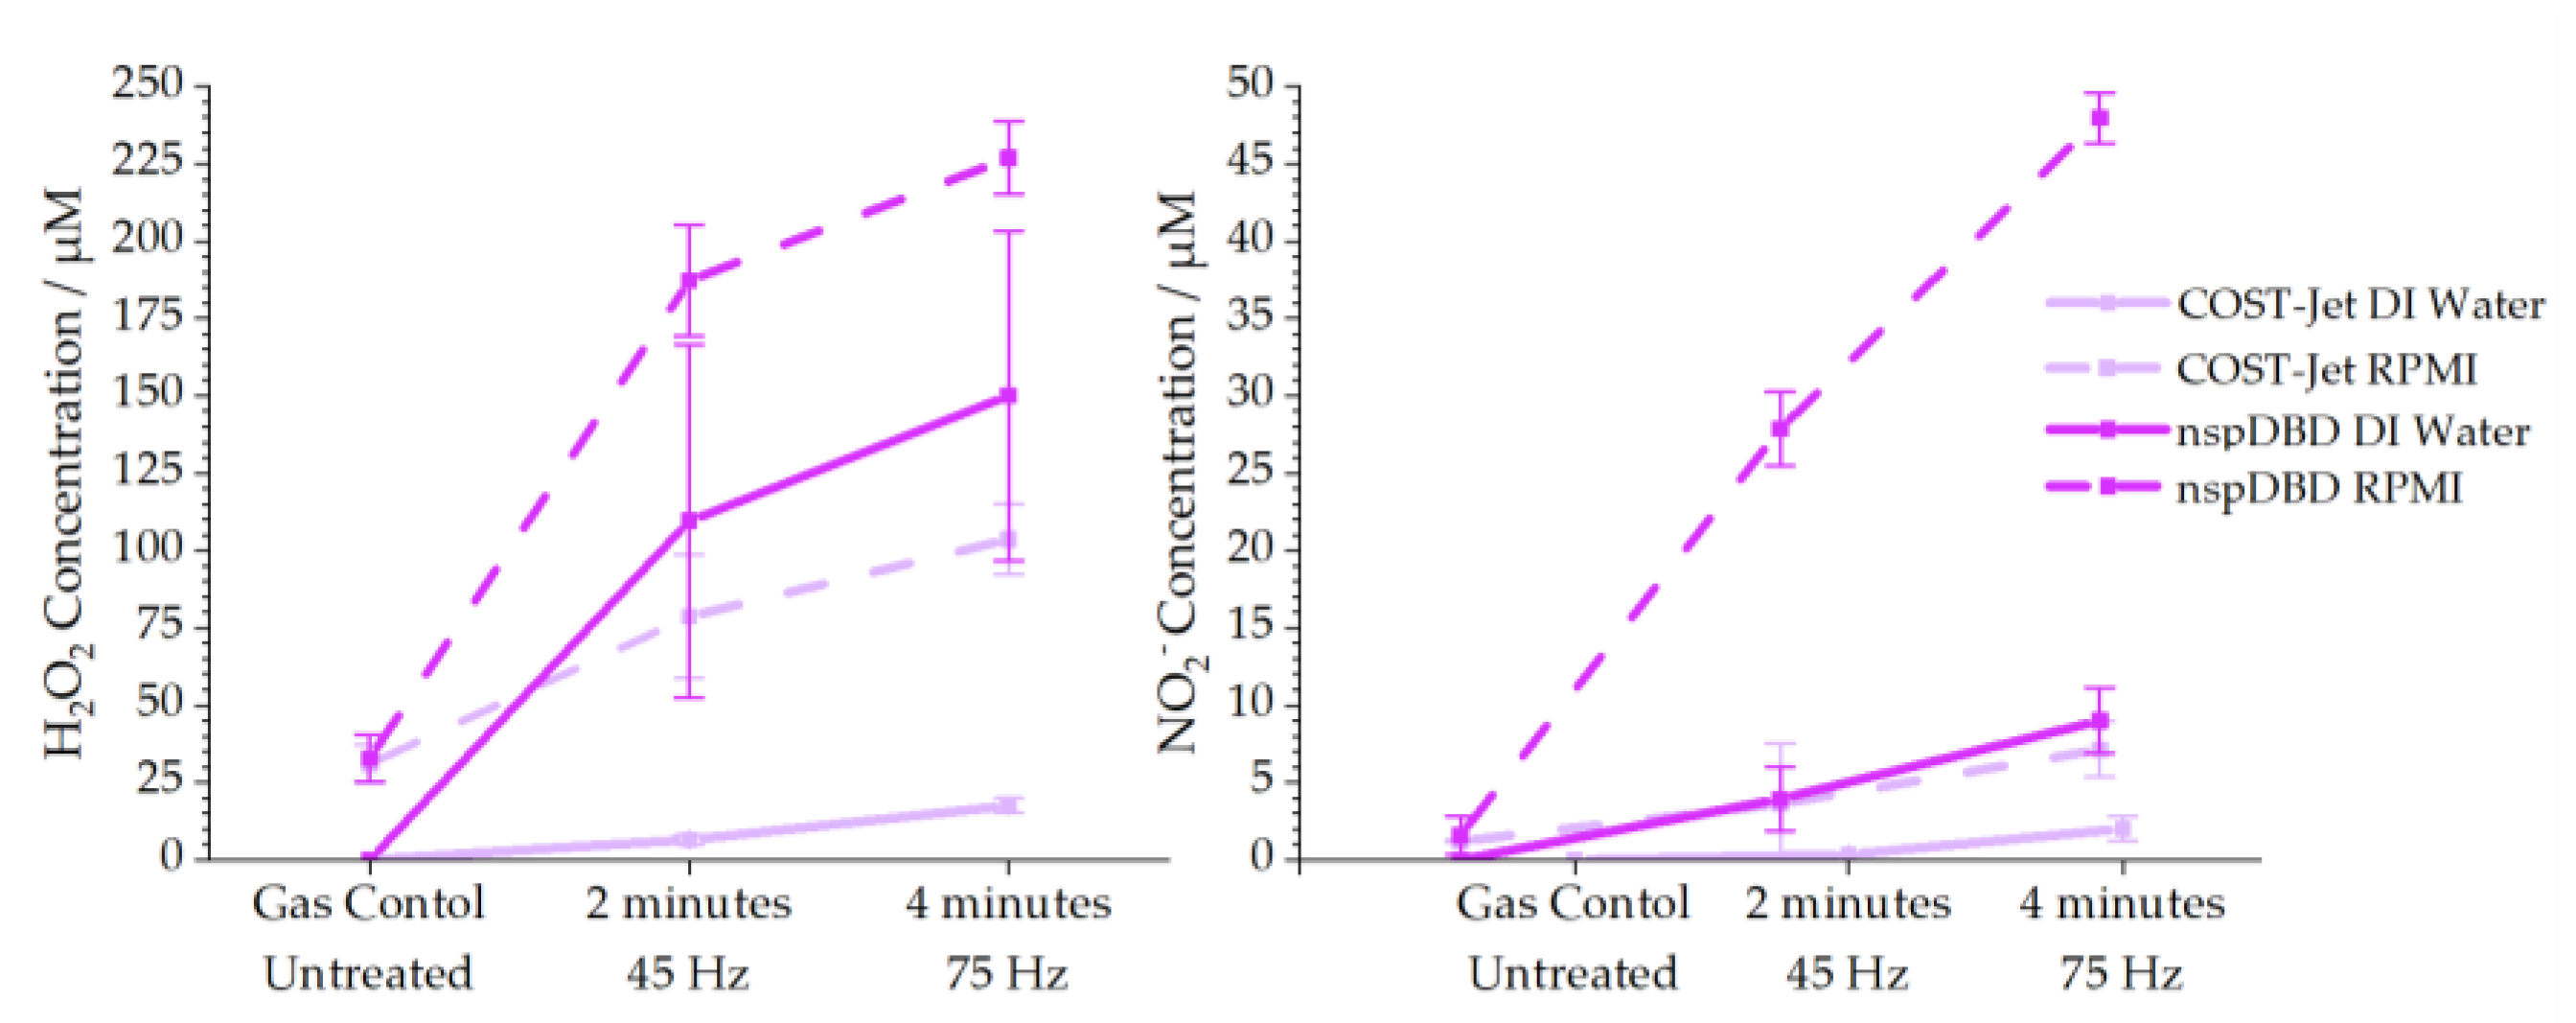
3.2. Chemical Comparison and Mock Treatment Are Inaccurate Markers of Cellular Responses

The comparable cellular responses from COST-Jet and nspDBD treatments suggested that, if the cellular stress response mechanisms were the same, the stressors generated by the plasma should be of similar magnitude. These responses have been attributed to multiple factors from plasma treatment, e.g., pulsed electric fields [39], RONS [40]. While studies have shown that CRT translocation and mitochondrial O2 production is stimulated by the presence of short-lived species [15], Jurkat T-lymphocytes are known to be sensitive to a few hundred micromolar of H2O2 [41], a long-lived species. To investigate the contribution of long-lived species to the biological responses observed by plasma treatment, we measured their concentration subsequent to plasma treatment and subjected the cells to these measured concentrations as a mock chemical treatment. We hypothesized that similar concentrations of H2O2 and NO2 must be produced to achieve similar biological responses. We evaluated their concentrations at both conditions (2 min vs. 45 Hz; 4 min vs. 75 Hz) that caused similar reductions in viability in order to correlate the increase in solvated RONS with this biological endpoint. While nitrate (NO3) is an important long-lived species to measure for characterization of liquid chemistry, it was previously shown to have an insignificant impact on cellular viability in multiple cell lines when mixed with H2O2 and NO2 [42]. Therefore, we focused our experiments on H2O2 and NO2.
First, we measured the long-lived species in the cell culture medium to understand the concentrations to which the cells were exposed after plasma treatment. Colorimetric assays were unaffected by time-dependent losses in reactive species since the assay reaction times (10 min for H2O2 and 30 min for NO2) were considerably shorter than the amount of time required for significant H2O2 and NO2 losses due to reactivity [24]. Both long-lived species were produced at higher concentrations from nspDBD treatments when compared with the COST-Jet-treated solutions (Figure 5). The concentration of H2O2 (Figure 5, left) and NO2 (Figure 5, right) increased with longer treatment times for the COST-Jet and higher frequencies for the nspDBD. In culture medium treated by the COST-Jet, an increase in exposure time resulted in increased concentrations of H2O2 (78.7 and 103.6 µM after 2 and 4 min, respectively) and NO2 (3.6 and 7.1 µM, respectively). The nspDBD concentrations increased with frequency for both species: 187.3 µM (45 Hz) to 226.9 µM (75 Hz) for H2O2 and 27.8 µM (45 Hz) to 47.9 µM (75 Hz) for NO2. These concentrations in the medium were much higher than those reported previously in deionized water [11,14], which was inconsistent with the understanding that cell culture medium would buffer long-lived species production in the liquid due to reactions between plasma-generated short-lived predecessors (such as OH and NO) and organic compounds. We repeated the measurements in DI water to show that our measurements were consistent with those reported in the literature for both devices:
  • Concentrations of H2O2 in DI water (6.49 and 17.49 µM after 2 and 4 min, respectively) and NO2 (1.15 and 2.01 µM, respectively) for the COST-Jet [21,43].
  • For the nspDBD [14], the H2O2 concentration in DI water increased from 109.6 µM to 150.1 µM and NO2 concentrations from 3.9 µM to 9.01 µM when the frequency was increased from 45 to 75 Hz.
The organic and oxidizable components of the culture medium, as well as the higher pH, should buffer the oxidative capacity of the plasma-generated RONS and reduce their concentrations. The chemical pathways for H2O2 formation from plasma treatment are described through the following mechanisms [44]:
OH + OH → H2O2,
HO2 + H2O + O2 → O2 + OH + H2O2,
2 HO2 → O2 + H2O2,
while a significant portion of H2O2 produced during plasma treatment is in the gas phase and is subsequently solvated, there is also the possibility of forming H2O2 in the liquid phase [29]. The pathway depicted by reaction (1) forms H2O2 at the liquid interface from plasma-generated OH. The latter two reactions (2,3) mainly occur in the bulk liquid as secondary chemistry. H2O2, OH, and O2 will react readily with the medium components, which should significantly reduce the concentration of H2O2 formed by reactions (1) and (2). However, the higher concentrations observed in the medium suggest the formation of organic peroxides from both plasma sources. This has been previously hypothesized by Privat-Maldonado et al. [45], based on the reaction between solvated ozone (O3) and organic compounds [46]. Experimentally, it was shown by Hefny et al. that O3 and O produced using the COST-Jet (0.6% O2 admixture) increased the H2O2 concentration in DI water if phenol was present [47]. For our investigation, the O and O3 produced by the COST-Jet [47,48] and RONS produced from the nspDBD at ambient conditions [49] could solvate and produce higher concentrations of H2O2 in the medium in comparison with DI water.
The considerably higher production of H2O2 and NO2 of nspDBD treatment showed the stronger oxidative environment of the nspDBD in comparison to the COST-Jet. The H2O2 concentrations from these treatments alone should adversely impact viability [41]. However, the biological responses of Jurkat cells to both treatments were comparable under these exposure conditions. These cells, which were sensitive to oxidation, exhibited similar responses when exposed to two different plasma chemistries of differing oxidative magnitude. We tested the cellular response to H2O2 and NO2, both alone and in combination, as a mock treatment to understand if the long-lived species had the oxidative impact to affect the cells. In lieu of plasma treatment, these cells were exposed to exogenously added concentrations of H2O2 and NO2 (Table 2), as measured in DI water. The concern with using the high nspDBD cell culture concentrations was that it would reduce Jurkat viability to zero, leading to results that would be difficult to detect and would not highlight responses due to small changes in concentration. The measured nspDBD DI water concentrations were comparable to the concentrations known to induce cellular responses in Jurkat. Therefore, these concentrations were added to cells in culture medium and incubated for 24 h. This mock treatment would not be comparable to the plasma treatment directly but rather an indication of how Jurkat cells reacted to the oxidative environment.
The viability and oxidative stress responses of Jurkat cells are shown in Figure 6, with the results obtained after plasma treatment as a benchmark. Mock treatment at the COST-Jet conditions did not reduce cell viability to the degree caused by plasma treatment (Figure 6a,d), showing that H2O2 concentrations below 20 µM did not adversely affect the cells. The H2O2 concentrations greater than 100 µM induced higher magnitudes of cell death than the nspDBD conditions (Figure 6a,d). These results supported previous literature that demonstrated H2O2 concentrations above 100 µM induced cellular arrest in Jurkat cells [41]. This clearly showed, as described above, that the higher oxidative environment due to the high concentration of H2O2 adversely affected the Jurkat cells. Added NO2 at concentrations measured from the nspDBD and COST-Jet treatments did not have any effects on cell viability. In addition, when NO2 was combined with H2O2, the observed loss in viability was comparable to cells treated with H2O2 alone. These observations suggested that NO2 did not influence the cell viability directly or through reaction with H2O2.
Mitochondrial activity was stimulated by H2O2 alone and in combination with NO2 at the nspDBD conditions in comparison to the untreated control, as shown in Figure 6b,e. H2O2 is a potent oxidizer and is well known to induce mitochondrial stress at concentrations as low as 100 µM [50]. NO2 alone had no discernable effect on mitochondrial O2 production for either of the mock treatments. The significant increase in mitochondrial activity due to the addition of exogenous H2O2 in comparison with the plasma-treated cells was indicative of the strong oxidative environment. The H2O2 concentration produced by the COST-Jet for both conditions was too low to stimulate mitochondrial O2 above the untreated control.
The effect of mock treatment on ecto-CRT expression was evaluated on Jurkat cells incubated with the RONS for 24 h. As seen in Figure 6c,f, only the nspDBD concentration of H2O2 produced a slight rightward shift and a second brighter peak in fluorescence. This was due to the higher numbers of dead and dying cells, as seen in Figure 6a,d. None of the other mock treatments produced an increase in ecto-CRT expression, clearly indicating that stable chemistry is unable to trigger necessary biological pathways that cause CRT translocation.
Our results demonstrated that, for Jurkats, mock treatment was not a good indicator of the role plasma components have in triggering cellular responses. The H2O2 concentrations produced by both devices should trigger stronger cellular responses. The reduced toxicity of H2O2 during plasma treatment was likely due to secondary reactions in the medium itself. Components in the medium and the cells themselves that offer oxidizable targets for plasma-generated species (both short and long-lived) altered the concentrations of individual species. Several investigations focus on the reactions between individual amino acids and other organic compounds, such as reactive sulfur species with plasma-generated RONS [51,52,53]. These compounds reduce the amount of plasma-generated species in the liquid by reacting with them. However, subsequent reactions can lead to increases in the overall inventory of RONS in the solution. Bruno et al. showed that cysteine alone could reduce H2O2 produced by the kINPen while increasing reactive nitrogen species (RNS) [52]. As Privat-Maldonado et al. showed through electroparamagnetic spectroscopy, there are also increases in the concentrations of short-lived species after plasma treatment of cell culture medium [45], which are precursors to these long-lived species [44]. The biological effects of the short-lived species on cellular responses are well-documented in plasma literature [15,35,54]. These initiating molecules are absent during mock treatments, which is why we did not observe similar cellular responses and GSH modifications to plasma treatment. Without the short-lived species and the organic compounds they modify, our mock treatment with exogenous H2O2 and NO2 is not representative of the actual contribution these long-lived species have during plasma treatment.

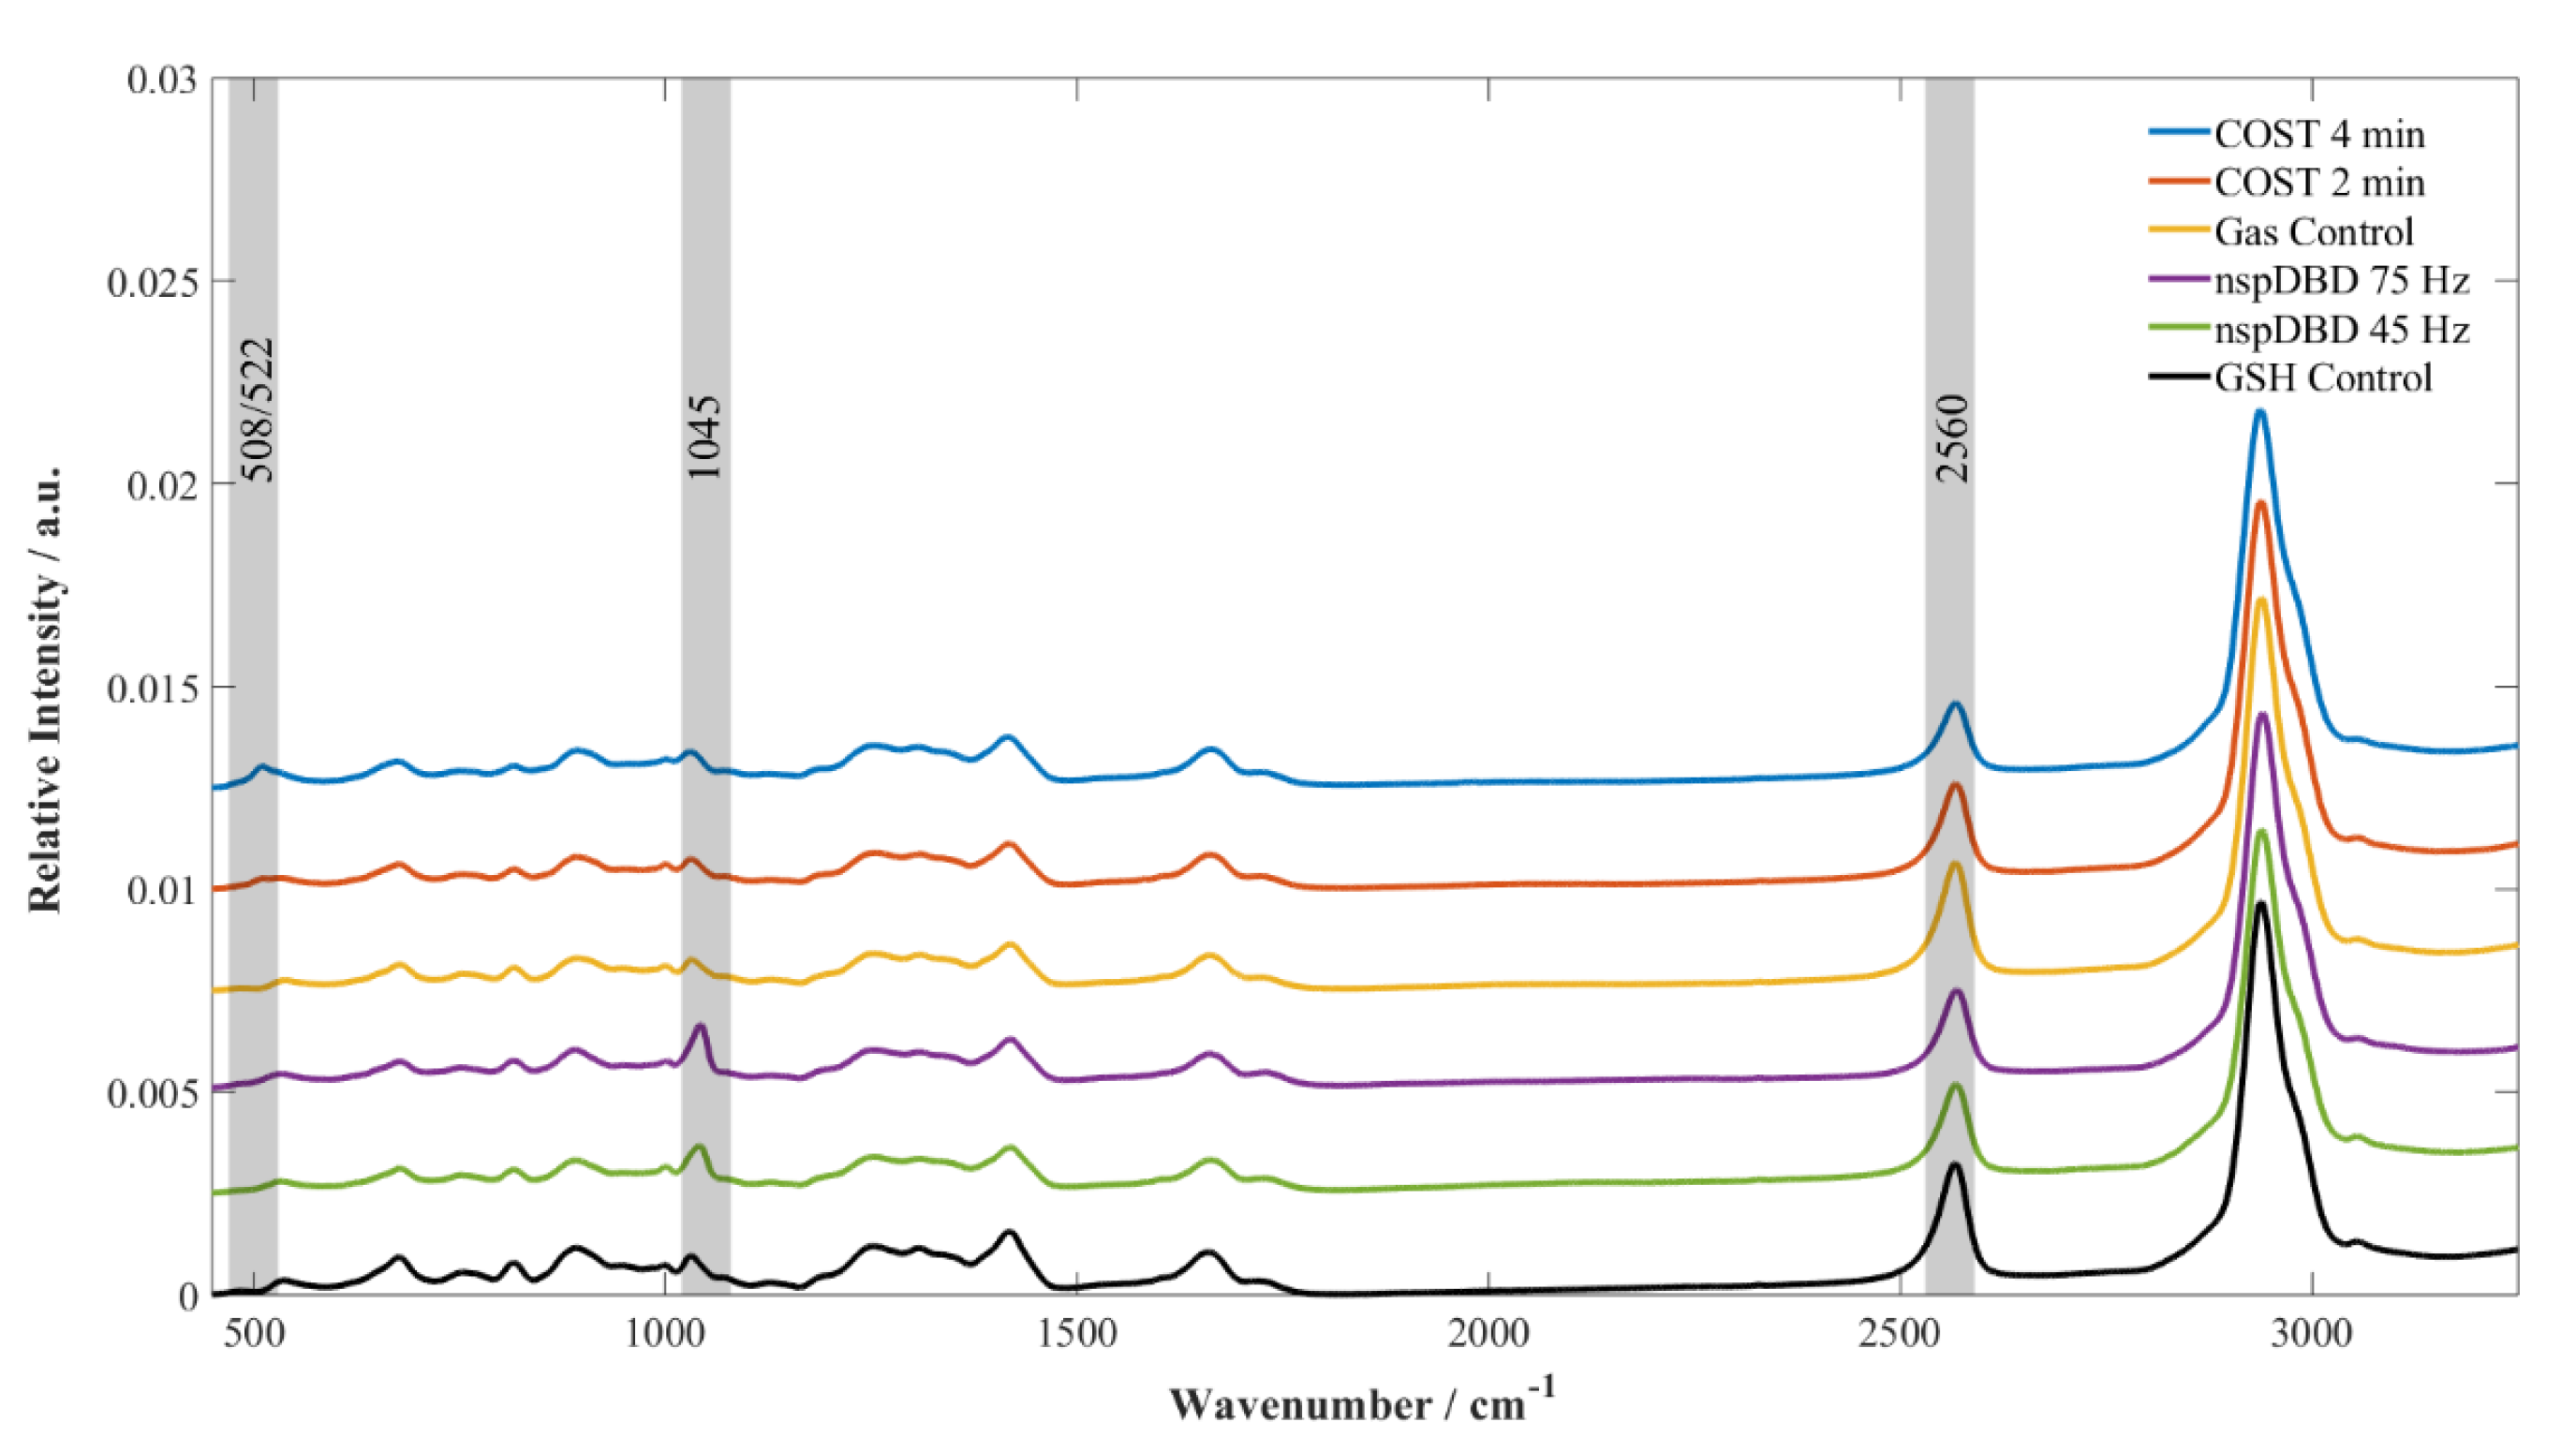
3.3. GSH Modifications Unique to Plasma Source Indicate the Stressors and the Potential for Cellular Response Present During Plasma Treatment

The data presented thus far indicated a lack of correlation between the relatively easy-to-measure long-lived species and cellular responses. The results from mock treatments demonstrated that using the measured RONS as an indicator of biological responses to plasma treatment was not sufficient. Therefore, there was a need for a method that is a true reflection of plasma parameters and the ensuing biological outcomes. In subsequent experiments, we expanded on the use of GSH as an indicator of how plasma might impact the cellular redox system, as proposed by Klinkhammer et al. [23], and related our measured biological responses to measured GSH modifications. GSH modifications after plasma or mock treatment were analyzed to address their correlation with the observed biological responses.
The specific modifications to GSH exposed to plasma treatment elucidated the possible reactive species near the molecule. Similar to previous reports on microsecond pulsed DBD-treated GSH [23], nspDBD plasma treatment caused a decrease in the intensity of the peak at 2560 cm1 and an increase of the 1045 cm1 peak when compared to the untreated GSH (Figure 7). These wavenumbers corresponded to the S-H (ν (S-H)) and the S=O (ν (S=O)) vibrational stretching modes, respectively, and indicated that S-H bonds were oxidized. Molecular dynamic (MD) simulations have previously shown that H2O2 did not initialize the oxidation of glutathione [23]. The model predicted that OH was the initiator of the reaction by forming the glutathione radical (-S), which is known to react quickly with H2O2 and form glutathione sulfenic acid (GSOH) in biological systems [55]. The MD simulations also showed that glutathione radicals could react with OH, NO, or another glutathione radical to form GSOH, S-nitrosoglutathione (GSNO), and glutathione disulfide (GSSG), respectively, in the liquid phase [23]. The presence of GSOH and the ν (S=O) band in our nspDBD-treated samples indicated the presence of OH and subsequent oxidation to form higher oxidation states. These states were GSOH, GSO2H, and GSO3H, the latter two corresponding to the ν (S=O) band. Klinkhammer et al. observed that significantly more GSO3H than GSO2H was produced by DBD treatment through mass spectrometry [23]. This type of oxidation is irreversible in biological systems [56], indicating the highly oxidative environment of microsecond pulse DBD treatment, as shown by Klinkhammer et al. [23], as well as that of the nspDBD treatment, as presented here.
Although the COST-Jet treated samples reduced the ν (S-H) band similar to the nspDBD-treated samples, an increase of the ν (S=O) mode was not observed. Instead, an increase of the ν (S-S) band was observed in the COST-Jet-treated samples, which was more pronounced for the 4-min treatment. In the case of the COST-Jet, there was little OH generated with an admixture of O2. Instead, production of O, O3, and singlet oxygen (O2(a1Ag)) was magnified [48,57,58]. It was likely that the dominant mechanism to form the glutathione radical was through H abstraction by O rather than OH. However, there was not enough oxidation to form GSO3H, as indicated by the absence of the ν (S=O) mode. While this showed GSO3H was not produced, the lower oxidation states might still be formed, indicating a less oxidative environment. This was expected between the two treatments since the end product of the ROS, H2O2, was lower for COST-Jet treatments.
The differences in GSH modifications between the COST-Jet and nspDBD suggested there might be different pathways of inducing oxidative stress and reducing the viability of Jurkat cells. Oxidation of the glutathione radical leads to the formation GSOH [55]. Further oxidation forms glutathione sulfinic acid (GSO2H) and glutathione sulfonic acid (GSO3H), whereas GSNO or GSSG may occur in the absence of an oxidative environment. The lack of the ν (S=O) mode in COST-Jet-treated samples suggested that in order to achieve the same biological responses, there must be another mechanism of oxidative stress that is unique to the COST-Jet source. The Raman spectra showed the formation of GSSG. The disulfide bond would form in a reaction between the glutathione radical and GSH. Both the sulfenic modification and glutathionylation (a disulfide bond between GSH and another protein) were shown by others to adversely impact Jurkat cells [41]. H2O2 added exogenously (at 200 µM) led to the irreversible oxidation of GSH and other proteins in the antioxidant systems that led to cellular arrest in Jurkat cells. The observed GSH modifications from nspDBD and COST-Jet treatments showed that there was the potential to induce these reactions in cell-associated GSH. Therefore, while the biological endpoint post plasma treatment was similar, the protein modifications and mechanisms for oxidative stress might be different between the two plasma sources.
Next, we assessed if mock treatment-induced modifications were distinguishable from plasma treatment. We exogenously added the concentrations of RONS, shown in Table 2, to solutions of GSH in DI water. We plotted the analyzed Raman spectra of GSH in the presence of H2O2, NO2, and the H2O2/NO2 combination and compared them to spectra generated by plasma treatments (Figure 8, top row). The spectra of the nspDBD mock treatment showed that H2O2 and the H2O2/NO2 combination reduced the ν (S-H) comparably to the plasma-treated samples. However, an increase in ν (S=O) was not observed. Instead, an increase in the ν (S-S) band was observed, which suggested slight oxidation of GSH in contrast with the higher oxidation of the nspDBD-treated samples. The NO2-treated samples did not modify GSH when compared to the untreated control. Only nspDBD plasma treatment reduced the ν (S-H) band and increased the ν (S=O) band. Taken together, there was not sufficient OH or O from the mock treatment to initiate the reaction with GSH and reduce the ν (S-H) band.
For COST-Jet treatments (Figure 8, bottom row), the decrease in the ν (S-H) band was observed only in plasma-treated samples. The concentrations of H2O2, NO2, and the H2O2/NO2 combination were not sufficient to induce measurable oxidation of the S-H bond. This indicated that the observed modifications from plasma treatment—the decrease of ν (S-H) and the increase of the ν (S-S) band—required short-lived species like O and OH. The absence of the increase in ν (S-S) and decrease in ν (S-H) bands from mock treatment indicated that other plasma components were required to induce these modifications and might be needed to induce biological responses.

4. Discussion

This study provided initial evidence that GSH modifications caused by plasma treatment might be used as markers of potential cellular responses. These modifications were due to the myriad plasma components that modify it. The presence and increase of ν (S-S) or ν (S=O) bands with a decrease in the ν (S-H) band correlated with the biological responses of Jurkat T lymphocytes to COST-Jet and nspDBD treatment, respectively. In addition, stronger plasma treatment for both sources increased the magnitude of these modifications and further affected the biological responses, showing that GSH modifications could potentially be scalable and be indicative of the magnitudes of RONS present. The absence of these modifications in mock-treated samples strongly suggested the role of the initiator molecules—O and/or OH—in the biological responses.
The contrast between observed cellular responses from plasma and mock treatment and the measured chemical concentrations indicated that the interactions between the plasma-generated RONS and the medium components drove the chemistry that the cells experience. Concentrations of H2O2 measured in medium alone from both sources would induce stronger cellular responses than plasma treatment at the corresponding conditions. RONS generated by plasma treatment and medium components must react and reduce the toxicity of H2O2 alone in order to achieve the observed cellular responses with the measured medium H2O2 concentrations. Some of these reactions may form species that cause harm to the cells themselves, such as DNA strand breaks or have other biological outcomes [11,51,52,53,58].
A unique feature of using GSH as a marker of the potency of plasma treatment is the scalability with plasma treatment parameters. Longer treatment times for the COST-Jet or higher frequencies for the nspDBD resulted in more significant modifications, which supported previous literature that showed similar trends using sulfur compounds [11,22,23]. As shown in this study, these stronger treatments triggered higher magnitudes of cellular responses. The treatment of GSH solutions as a model for treatment targets elucidated the roles of short-lived species, as shown in other studies using phenol [24,59], and their combination with long-lived species. Our results showed there is potential to investigate O for the COST-Jet and OH for the nspDBD as initiator molecules for the biological responses. This work expanded on comparing a DBD with an APPJ by investigating how the different chemistry produced can lead to similar biological responses [14].
The case for GSH as a marker for treatment outcomes in plasma medicine can be made because these modifications can be correlated to possible cellular effects in redox biology literature [60,61]. Cellular responses to plasma treatment are cell type-dependent, which means a specific modification will not necessarily indicate a specific biological outcome for different types of cells. The development of GSH as a marker would allow plasma medicine researchers to explore translational opportunities without the need for cell culture in early exploratory experiments. Plasma sources like DBDs and APPJs could potentially be compared using indicator modifications that serve as benchmarks for other sources used in the plasma medicine field. Of course, a more robust set of tests needs to be completed with different cell lines, plasma devices, and cellular responses to achieve this goal and correlate plasma parameters to biological outcomes signaled by GSH modifications.

5. Conclusions

This study demonstrated the potential for correlations between modifications to markers, such as GSH, and biological outcomes. The markers themselves highlight the existence of short-lived species through defined chemical reactions that result in the modifications from plasma-derived chemistry. Since the modifications scale with the cellular responses and plasma treatment magnitude, these markers could be used as a way to compare plasma devices and their potential for biological outcomes.

Author Contributions

Conceptualization, P.R.; methodology, P.R., H.M., V.M., B.M. and K.S.; software, D.T. and K.S.; validation, B.M., H.M., D.T., L.D. and K.B.; formal analysis, P.R., H.M. and D.T.; investigation, P.R., H.M., B.M., D.T., K.B. and L.D.; resources, K.S., V.M. and F.K.; data curation, P.R., D.T. and H.M.; writing—original draft preparation, P.R.; writing—review and editing, P.R., H.M., B.M., D.T., L.D., K.B., F.C.K., V.M. and K.S.; visualization, P.R. and H.M.; supervision, F.C.K., V.M. and K.S.; All authors have read and agreed to the published version of the manuscript.

Funding

This research received no external funding.

Acknowledgments

The authors acknowledge Eric Gebski and Rita Esposito for their assistance in performing cellular assays.

Conflicts of Interest

The authors declare no conflict of interest.

References

  1. Bekeschus, S.; Schmidt, A.; Weltmann, K.-D.; von Woedtke, T. The plasma jet kINPen–A powerful tool for wound healing. Clin. Plasma Med. 2016, 4, 19–28. [Google Scholar] [CrossRef]
  2. Brullé, L.; Vandamme, M.; Riès, D.; Martel, E.; Robert, E.; Lerondel, S.; Trichet, V.; Richard, S.; Pouvesle, J.-M.; Le Pape, A. Effects of a non thermal plasma treatment alone or in combination with gemcitabine in a MIA PaCa2-luc orthotopic pancreatic carcinoma model. PLoS ONE 2012, 7, e52653. [Google Scholar] [CrossRef] [PubMed]
  3. Graves, D.B. The emerging role of reactive oxygen and nitrogen species in redox biology and some implications for plasma applications to medicine and biology. J. Phys. D Appl. Phys. 2012, 45, 263001. [Google Scholar] [CrossRef]
  4. Lin, A.; Truong, B.; Patel, S.; Kaushik, N.; Choi, E.H.; Fridman, G.; Fridman, A.; Miller, V. Nanosecond-Pulsed DBD Plasma-Generated Reactive Oxygen Species Trigger Immunogenic Cell Death in A549 Lung Carcinoma Cells through Intracellular Oxidative Stress. Int. J. Mol. Sci. 2017, 18, 966. [Google Scholar] [CrossRef] [Green Version]
  5. Korolev, Y.D.; Frants, O.B.; Landl, N.V.; Suslov, A.I. Low-current plasmatron as a source of nitrogen oxide molecules. IEEE Trans. Plasma Sci. 2012, 40, 2837–2842. [Google Scholar] [CrossRef]
  6. Jiang, Y.; Sokorai, K.; Pyrgiotakis, G.; Demokritou, P.; Li, X.; Mukhopadhyay, S.; Jin, T.; Fan, X. Cold plasma-activated hydrogen peroxide aerosol inactivates Escherichia coli O157: H7, Salmonella Typhimurium, and Listeria innocua and maintains quality of grape tomato, spinach and cantaloupe. Int. J. Food Microbiol. 2017, 249, 53–60. [Google Scholar] [CrossRef]
  7. Kruszelnicki, J.; Lietz, A.M.; Parsey, G.; Mohades, S.; Kushner, M.J. Consequences of Environmental Factors in Plasma Treatment of Liquids, Tissues and Materials. Clin. Plasma Med. 2018, 9, 2. [Google Scholar] [CrossRef]
  8. Lietz, A.M.; Kushner, M.J. Air plasma treatment of liquid covered tissue: Long timescale chemistry. J. Phys. D Appl. Phys. 2016, 49, 425204. [Google Scholar] [CrossRef]
  9. Norberg, S.A.; Parsey, G.M.; Lietz, A.M.; Johnsen, E.; Kushner, M.J. Atmospheric pressure plasma jets onto a reactive water layer over tissue: Pulse repetition rate as a control mechanism. J. Phys. D Appl. Phys. 2018, 52, 015201. [Google Scholar] [CrossRef] [Green Version]
  10. Lu, X.; Naidis, G.; Laroussi, M.; Reuter, S.; Graves, D.; Ostrikov, K. Reactive species in non-equilibrium atmospheric-pressure plasmas: Generation, transport, and biological effects. Phys. Rep. 2016, 630, 1–84. [Google Scholar] [CrossRef] [Green Version]
  11. Lackmann, J.-W.; Bruno, G.; Jablonowski, H.; Kogelheide, F.; Offerhaus, B.; Held, J.; Schulz-von der Gathen, V.; Stapelmann, K.; von Woedtke, T.; Wende, K. Nitrosylation vs. oxidation–How to modulate cold physical plasmas for biological applications. PLoS ONE 2019, 14, e0216606. [Google Scholar] [CrossRef] [PubMed] [Green Version]
  12. Bekeschus, S.; Kolata, J.; Winterbourn, C.; Kramer, A.; Turner, R.; Weltmann, K.D.; Bröker, B.; Masur, K. Hydrogen peroxide: A central player in physical plasma-induced oxidative stress in human blood cells. Free Radic. Res. 2014, 48, 542–549. [Google Scholar] [CrossRef] [PubMed]
  13. Yan, D.; Xiao, H.; Zhu, W.; Nourmohammadi, N.; Zhang, L.G.; Bian, K.; Keidar, M. The role of aquaporins in the anti-glioblastoma capacity of the cold plasma-stimulated medium. J. Phys. D Appl. Phys. 2017, 50, 055401. [Google Scholar] [CrossRef]
  14. Bekeschus, S.; Lin, A.; Fridman, A.; Wende, K.; Weltmann, K.-D.; Miller, V. A Comparison of Floating-Electrode DBD and kINPen Jet: Plasma parameters to achieve similar growth reduction in colon cancer cells under standardized conditions. Plasma Chem. Plasma Process. 2018, 38, 1–12. [Google Scholar] [CrossRef]
  15. Lin, A.; Gorbanev, Y.; De Backer, J.; Van Loenhout, J.; Van Boxem, W.; Lemière, F.; Cos, P.; Dewilde, S.; Smits, E.; Bogaerts, A. Non-Thermal Plasma as a Unique Delivery System of Short-Lived Reactive Oxygen and Nitrogen Species for Immunogenic Cell Death in Melanoma Cells. Adv. Sci. 2019, 6, 1802062. [Google Scholar] [CrossRef] [Green Version]
  16. Wende, K.; Williams, P.; Dalluge, J.; Gaens, W.V.; Aboubakr, H.; Bischof, J.; Woedtke, T.V.; Goyal, S.M.; Weltmann, K.-D.; Bogaerts, A.; et al. Identification of the biologically active liquid chemistry induced by a nonthermal atmospheric pressure plasma jet. Biointerphases 2015, 10, 029518. [Google Scholar] [CrossRef] [Green Version]
  17. Hensel, K.; Kučerová, K.; Tarabová, B.; Janda, M.; Machala, Z.; Sano, K.; Mihai, C.T.; Ciorpac, M.; Gorgan, L.D.; Jijie, R.; et al. Effects of air transient spark discharge and helium plasma jet on water, bacteria, cells, and biomolecules. Biointerphases 2015, 10, 029515. [Google Scholar] [CrossRef]
  18. Mann, M.S.; Schnabel, U.; Weihe, T.; Weltmann, K.-D.; von Woedtke, T. A reference technique to compare the antimicrobial properties of atmospheric pressure plasma sources. Plasma Med. 2015, 5, 27–47. [Google Scholar] [CrossRef] [Green Version]
  19. Steuer, A.; Schmidt, A.; Laboha, P.; Babica, P.; Kolb, J.F. Transient Suppression of Gap Junctional Intercellular Communication After Exposure to 100-Nanosecond Pulsed Electric Fields. Bioelectrochemistry 2016, 112, 33–46. [Google Scholar] [CrossRef]
  20. Lackmann, J.-W.; Schneider, S.; Edengeiser, E.; Jarzina, F.; Brinckmann, S.; Steinborn, E.; Havenith, M.; Benedikt, J.; Bandow, J.E. Photons and particles emitted from cold atmospheric-pressure plasma inactivate bacteria and biomolecules independently and synergistically. J. R. Soc. Interface 2013, 10, 20130591. [Google Scholar] [CrossRef] [Green Version]
  21. Lackmann, J.-W.; Wende, K.; Verlackt, C.; Golda, J.; Volzke, J.; Kogelheide, F.; Held, J.; Bekeschus, S.; Bogaerts, A.; Schulz-von der Gathen, V. Chemical fingerprints of cold physical plasmas–an experimental and computational study using cysteine as tracer compound. Sci. Rep. 2018, 8, 7736. [Google Scholar] [CrossRef] [PubMed]
  22. Kogelheide, F.; Kartaschew, K.; Strack, M.; Baldus, S.; Metzler-Nolte, N.; Havenith, M.; Awakowicz, P.; Stapelmann, K.; Lackmann, J.-W. FTIR spectroscopy of cysteine as a ready-to-use method for the investigation of plasma-induced chemical modifications of macromolecules. J. Phys. D Appl. Phys. 2016, 49, 084004. [Google Scholar] [CrossRef]
  23. Klinkhammer, C.; Verlackt, C.; Kogelheide, F.; Bogaerts, A.; Metzler-Nolte, N.; Stapelmann, K.; Havenith, M.; Lackmann, J.-W. Elucidation of Plasma-induced Chemical Modifications on Glutathione and Glutathione Disulphide. Sci. Rep. 2017, 7, 13828. [Google Scholar] [CrossRef] [PubMed] [Green Version]
  24. Lukes, P.; Dolezalova, E.; Sisrova, I.; Clupek, M. Aqueous-phase chemistry and bactericidal effects from an air discharge plasma in contact with water: Evidence for the formation of peroxynitrite through a pseudo-second-order post-discharge reaction of H2O2 and HNO2. Plasma Sources Sci. Technol. 2014, 23, 015019. [Google Scholar] [CrossRef]
  25. Golda, J.; Held, J.; Redeker, B.; Konkowski, M.; Beijer, P.; Sobota, A.; Kroesen, G.; Braithwaite, N.S.J.; Reuter, S.; Turner, M. Concepts and characteristics of the ‘COST Reference Microplasma Jet’. J. Phys. D Appl. Phys. 2016, 49, 084003. [Google Scholar] [CrossRef]
  26. Lin, A.; Chernets, N.; Han, J.; Alicea, Y.; Dobrynin, D.; Fridman, G.; Freeman, T.A.; Fridman, A.; Miller, V. Non-Equilibrium Dielectric Barrier Discharge Treatment of Mesenchymal Stem Cells: Charges and Reactive Oxygen Species Play the Major Role in Cell Death. Plasma Process. Polym. 2015, 12, 1117–1127. [Google Scholar] [CrossRef]
  27. Ellerweg, D.; Benedikt, J.; von Keudell, A.; Knake, N.; Schulz-von der Gathen, V. Characterization of the effluent of a He/O2 microscale atmospheric pressure plasma jet by quantitative molecular beam mass spectrometry. New J. Phys. 2010, 12, 013021. [Google Scholar] [CrossRef]
  28. Sousa, J.S.; Niemi, K.; Cox, L.; Algwari, Q.T.; Gans, T.; O’connell, D. Cold atmospheric pressure plasma jets as sources of singlet delta oxygen for biomedical applications. J. Appl. Phys. 2011, 109, 123302. [Google Scholar] [CrossRef] [Green Version]
  29. Gorbanev, Y.; Verlackt, C.; Tinck, S.; Tuenter, E.; Foubert, K.; Cos, P.; Bogaerts, A. Combining experimental and modelling approaches to study the sources of reactive species induced in water by the COST RF plasma jet. Phys. Chem. Chem. Phys. 2018, 20, 2797–2808. [Google Scholar] [CrossRef]
  30. Kelly, S.; Golda, J.; Turner, M.M.; Schulz-von der Gathen, V. Gas and heat dynamics of a micro-scaled atmospheric pressure plasma reference jet. J. Phys. D Appl. Phys. 2015, 48, 444002. [Google Scholar] [CrossRef]
  31. Kruszelnicki, J.; Lietz, A.M.; Kushner, M.J. Interactions between water droplets and atmospheric pressure plasmas. Bull. Am. Phys. Soc. 2017, 62. [Google Scholar]
  32. Wartewig, S. IR and Raman Spectroscopy: Fundamental Processing; John Wiley & Sons: Hoboken, NJ, USA, 2006. [Google Scholar]
  33. Lin, A.; Truong, B.; Pappas, A.; Kirifides, L.; Oubarri, A.; Chen, S.; Lin, S.; Dobrynin, D.; Fridman, G.; Fridman, A. Uniform Nanosecond Pulsed Dielectric Barrier Discharge Plasma Enhances Anti-Tumor Effects by Induction of Immunogenic Cell Death in Tumors and Stimulation of Macrophages. Plasma Process. Polym. 2015, 12, 1392–1399. [Google Scholar] [CrossRef]
  34. Vermeylen, S.; De Waele, J.; Vanuytsel, S.; De Backer, J.; Van der Paal, J.; Ramakers, M.; Leyssens, K.; Marcq, E.; Van Audenaerde, J.; Smits, E.L.J. Cold atmospheric plasma treatment of melanoma and glioblastoma cancer cells. Plasma Process. Polym. 2016, 13, 1195–1205. [Google Scholar] [CrossRef]
  35. Privat-Maldonado, A.; Gorbanev, Y.; Dewilde, S.; Smits, E.; Bogaerts, A. Reduction of Human Glioblastoma Spheroids Using Cold Atmospheric Plasma: The Combined Effect of Short- and Long-Lived Reactive Species. Cancers 2018, 10, 394. [Google Scholar] [CrossRef] [PubMed] [Green Version]
  36. Turrens, J.F. Mitochondrial formation of reactive oxygen species. J. Physiol. 2003, 552, 335–344. [Google Scholar] [CrossRef] [PubMed]
  37. Beckman, J.S.; Koppenol, W.H. Nitric oxide, superoxide, and peroxynitrite: The good, the bad, and ugly. Am. J. Physiol. Cell Physiol. 1996, 271, C1424–C1437. [Google Scholar] [CrossRef] [Green Version]
  38. Obeid, M.; Tesniere, A.; Panaretakis, T.; Tufi, R.; Joza, N.; Van Endert, P.; Ghiringhelli, F.; Apetoh, L.; Chaput, N.; Flament, C.; et al. Ecto-calreticulin in immunogenic chemotherapy. Immunol. Rev. 2007, 220, 22–34. [Google Scholar] [CrossRef]
  39. Beebe, S.J.; White, J.; Blackmore, P.F.; Deng, Y.; Somers, K.; Schoenbach, K.H. Diverse effects of nanosecond pulsed electric fields on cells and tissues. DNA Cell Biol. 2003, 22, 785–796. [Google Scholar] [CrossRef]
  40. Graves, D.B. Reactive species from cold atmospheric plasma: Implications for cancer therapy. Plasma Process. Polym. 2014, 11, 1120–1127. [Google Scholar] [CrossRef]
  41. Baty, J.W.; Hampton, M.B.; Winterbourn, C.C. Proteomic detection of hydrogen peroxide-sensitive thiol proteins in Jurkat cells. Biochem. J. 2005, 389, 785–795. [Google Scholar] [CrossRef] [Green Version]
  42. Girard, P.-M.; Arbabian, A.; Fleury, M.; Bauville, G.; Puech, V.; Dutreix, M.; Sousa, J.S. Synergistic effect of H2O2 and NO2 in cell death induced by cold atmospheric He plasma. Sci. Rep. 2016, 6, 29098. [Google Scholar] [CrossRef] [PubMed] [Green Version]
  43. Bekeschus, S.; Wende, K.; Hefny, M.M.; Rödder, K.; Jablonowski, H.; Schmidt, A.; von Woedtke, T.; Weltmann, K.-D.; Benedikt, J. Oxygen atoms are critical in rendering THP-1 leukaemia cells susceptible to cold physical plasma-induced apoptosis. Sci. Rep. 2017, 7, 2791. [Google Scholar] [CrossRef] [PubMed] [Green Version]
  44. Verlackt, C.; Van Boxem, W.; Bogaerts, A. Transport and accumulation of plasma generated species in aqueous solution. Phys. Chem. Chem. Phys. 2018, 20, 6845–6859. [Google Scholar] [CrossRef] [PubMed]
  45. Privat-Maldonado, A.; Gorbanev, Y.; O’Connell, D.; Vann, R.; Chechik, V.; Woude, M.W. Nontarget Biomolecules Alter Macromolecular Changes Induced by Bactericidal Low–Temperature Plasma. IEEE Trans. Radiat. Plasma Med. Sci. 2018, 2, 121–128. [Google Scholar] [CrossRef] [PubMed]
  46. Halliwell, B.; Gutteridge, J.M. Free Radicals in Biology and Medicine; Oxford University Press: Oxford, UK, 2015. [Google Scholar]
  47. Hefny, M.M.; Pattyn, C.; Lukes, P.; Benedikt, J. Atmospheric plasma generates oxygen atoms as oxidizing species in aqueous solutions. J. Phys. D Appl. Phys. 2016, 49, 404002. [Google Scholar] [CrossRef]
  48. Ellerweg, D.; von Keudell, A.; Benedikt, J. Unexpected O and O3 production in the effluent of He/O2 microplasma jets emanating into ambient air. Plasma Sources Sci. Technol. 2012, 21, 034019. [Google Scholar] [CrossRef]
  49. Mastanaiah, N.; Banerjee, P.; Johnson, J.A.; Roy, S. Examining the role of ozone in surface plasma sterilization using dielectric barrier discharge (DBD) plasma. Plasma Process. Polym. 2013, 10, 1120–1133. [Google Scholar] [CrossRef]
  50. Fujii, Y.; Tomita, K.; Sano, H.; Yamasaki, A.; Hitsuda, Y.; Adcock, I.M.; Shimizu, E. Dissociation of DNA damage and mitochondrial injury caused by hydrogen peroxide in SV-40 transformed lung epithelial cells. Cancer Cell Int. 2002, 2, 16. [Google Scholar] [CrossRef]
  51. Tanaka, H.; Nakamura, K.; Mizuno, M.; Ishikawa, K.; Takeda, K.; Kajiyama, H.; Utsumi, F.; Kikkawa, F.; Hori, M. Non-thermal atmospheric pressure plasma activates lactate in Ringer’s solution for anti-tumor effects. Sci. Rep. 2016, 6, 36282. [Google Scholar] [CrossRef] [Green Version]
  52. Bruno, G.; Heusler, T.; Lackmann, J.-W.; von Woedtke, T.; Weltmann, K.-D.; Wende, K. Cold physical plasma-induced oxidation of cysteine yields reactive sulfur species (RSS). Clin. Plasma Med. 2019, 14, 100083. [Google Scholar] [CrossRef]
  53. Uchida, G.; Mino, Y.; Suzuki, T.; Ikeda, J.-I.; Suzuki, T.; Takenaka, K.; Setsuhara, Y. Decomposition and oxidation of methionine and tryptophan following irradiation with a nonequilibrium plasma jet and applications for killing cancer cells. Sci. Rep. 2019, 9, 6625. [Google Scholar] [CrossRef] [PubMed] [Green Version]
  54. Sasaki, S.; Kanzaki, M.; Kaneko, T. Calcium influx through TRP channels induced by short-lived reactive species in plasma-irradiated solution. Sci. Rep. 2016, 6, 25728. [Google Scholar] [CrossRef] [PubMed] [Green Version]
  55. Paulsen, C.E.; Carroll, K.S. Cysteine-mediated redox signaling: Chemistry, biology, and tools for discovery. Chem. Rev. 2013, 113, 4633–4679. [Google Scholar] [CrossRef] [PubMed]
  56. Gupta, V.; Carroll, K.S. Sulfenic acid chemistry, detection and cellular lifetime. Biochim. Et Biophys. Acta (Bba) Gen. Subj. 2014, 1840, 847–875. [Google Scholar] [CrossRef] [PubMed] [Green Version]
  57. Xu, H.; Wang, S.; Shaban, M.; Montazersadgh, F.; Alkayal, A.; Liu, D.; Kong, M.G.; Buckley, B.R.; Iza, F. trans-Stilbene epoxidation by He+O2 atmospheric pressure plasma: Epoxidation without oxidant waste stream. Plasma Process. Polym. 2020, 17, 1900162. [Google Scholar] [CrossRef]
  58. Gorbanev, Y.; Van der Paal, J.; Van Boxem, W.; Dewilde, S.; Bogaerts, A. Reaction of chloride anion with atomic oxygen in aqueous solutions: Can cold plasma help in chemistry research? Phys. Chem. Chem. Phys. 2019, 21, 4117–4121. [Google Scholar] [CrossRef]
  59. Jirásek, V.; Lukeš, P. Formation of reactive chlorine species in saline solution treated by non-equilibrium atmospheric pressure He/O2 plasma jet. Plasma Sources Sci. Technol. 2019, 28, 035015. [Google Scholar] [CrossRef]
  60. Sies, H. Glutathione and its role in cellular functions. Free Radic. Biol. Med. 1999, 27, 916–921. [Google Scholar] [CrossRef]
  61. Franco, R.; Cidlowski, J. Apoptosis and glutathione: Beyond an antioxidant. Cell Death Differ. 2009, 16, 1303. [Google Scholar] [CrossRef] [Green Version]
Figure 1. Schematic of plasma treatment setups. The European Cooperation in Science and Technology Reference Microplasma Jet (COST-Jet) was set 4 mm above 500 µL of culture medium or deionized (DI) water. The COST-Jet operated in He with a 0.6% O2 admixture. The nanosecond pulsed floating-electrode dielectric barrier discharge (nspDBD) was positioned with a 1 mm gap distance above the liquid surface in ambient air. The treatment volume was 100 µL.
Applsci 10 02025 g001
Figure 2. Viability comparison of Jurkat T lymphocytes treated with nspDBD or COST-Jet (He + 0.6% O2). Cells were treated from 30–75 Hz with the nspDBD and 1–5 min with the COST-Jet. Percent viability was calculated relative to cells not exposed to plasma or feed gas. Cell loss was comparable at 2 and 4 min of COST-Jet treatment with 45 and 75 Hz nspDBD treatment, respectively. Viability experiments were repeated once in triplicate. The data plotted represent the mean and standard deviation.
Applsci 10 02025 g002
Figure 3. Mitochondrial O2 production in Jurkat T lymphocytes in response to plasma treatment. COST-Jet (2 and 4 min) and nspDBD (45 and 75 Hz) induced higher and comparable magnitudes of oxidative stress relative to the untreated control cells. This experiment was repeated once in triplicate. The data plotted represent the mean and standard deviation.
Applsci 10 02025 g003
Figure 4. Expression of calreticulin (ecto-CRT) was measured 24 h post-treatment on Jurkat T lymphocytes treated at the two comparable conditions: 2 min/45 Hz (Left) and 4 min/75 Hz (Right). Both devices induced similar increases in the numbers of ecto-CRT-positive cells.
Applsci 10 02025 g004
Figure 5. Concentrations of H2O2 (Left) and NO2 (Right) in DI water (solid line) or RPMI (Roswell Park Memorial Institute) supplemented with 10% fetal bovine serum (FBS) and 1% penicillin/streptomycin (P/S) (dashed line) post plasma treatment. The gas control and untreated H2O2 measurement indicate the medium itself is detected by the peroxide kit used. These experiments were repeated once, and the data plotted represent the mean and standard deviation.
Applsci 10 02025 g005
Figure 6. Exogenous addition of H2O2 elicited cellular responses from Jurkat T lymphocytes at the two comparable conditions of 2 min/45 Hz (ac) and 4 min/75 Hz (df). Mock treatment reduced viability and stimulated mitochondrial O2 production above the untreated control only at H2O2 concentrations above 100 µM. (d) There were no changes in ecto-CRT responses to mock treatments. The mock treatment experiments were performed once in triplicate. The data represent the mean and standard deviation.
Applsci 10 02025 g006
Figure 7. Raman spectra of glutathione (GSH) in deionized water post plasma treatment with the nspDBD and COST-Jet. The main observations from both sources were reduced S-H stretching (2560 cm1) that was further reduced after increased plasma treatment. Interestingly, increased S-O stretching (1045 cm1) was observed only for the nspDBD treatment, whereas the COST-Jet-treated GSH showed increased S-S stretching (508/522 cm1), indicating the formation of GSSG. These differences between the nspDBD and the COST-Jet indicated the different magnitudes of oxidation between the two treatments.
Applsci 10 02025 g007
Figure 8. Raman spectra analysis of plasma-treated GSH showed more pronounced peaks than mock treatment. GSH was mixed with H2O2, NO2, or their combination. The spectra were plotted against their corresponding plasma treatment counterparts. The spectra were centered on the observed modifications from plasma treatment: increased in the ν (S-S) (508/522 cm1) and ν (S=O) (1045 cm1) bands with a decrease in the ν (S-H) (2560 cm1) band. For both the nspDBD and the COST-Jet, stronger plasma treatment resulted in more pronounced modifications. (Top Row) The nspDBD treatment of GSH resulted in a decrease in the ν (S-H) band and an increase in the ν (S=O) band with no change in the ν (S-S) band. The H2O2 only and the combined mock treatment at these conditions reduced the ν (S-H) band with a slight increase in the ν (S-S) band, which indicated slight oxidation of the GSH. There was no discernable difference in modifications between the NO2 treatment when compared with the untreated control. (Bottom Row) The COST-Jet-treated samples showed a decrease in the ν (S-H) band and an increase in the ν (S-S) band. There was no increase in the ν (S=O) band. The mock treatment samples did not modify the GSH when compared to the control.
Applsci 10 02025 g008
Table 1. Plasma Treatment Parameters.
ParameterCOST-Jet 1nspDBD 2
Treatment Distance4 mm1 mm
Treatment Time0, 1, 2, 3, 4, 5 min10 s
Frequency13.56 MHz30, 45, 60, 75 Hz
Treated Volume500 µL100 µL
Gas Flow RateHe + 0.6% O2 (1 slm + 6 sccm)-
Pulse Width-20 ns
Rise Time-2 ns
Energy/Pulse-0.9 mJ/pulse
1 European Cooperation in Science and Technology Reference Microplasma Jet (COST-Jet), 2 Nanosecond pulsed dielectric barrier discharge (nspDBD).
Table 2. Mock Treatment Concentrations.
Treatment ConditionH2O2 (µM)NO2 (µM)
COST-Jet: 2 min6.501.15
COST-Jet: 4 min17.352.01
nspDBD: 45 Hz108.783.92
nspDBD: 75 Hz149.939.01

